
Abstract
Vaccines are reliant on adjuvants to enhance the immune stimulus, and type I interferons (IFNs) have been shown to be beneficial in augmenting this response. We were interested in identifying compounds that would sustain activation of an endogenous type I IFN response as a co-adjuvant. We began with generation of a human monocytic THP-1 cell line with an IFN-stimulated response element (ISRE)-β-lactamase reporter construct for high-throughput screening. Pilot studies were performed to optimize the parameters and conditions for this cell-based Förster resonance energy transfer (FRET) reporter assay for sustaining an IFN-α-induced ISRE activation signal. These conditions were confirmed in an initial pilot screen, followed by the main screen for evaluating prolongation of an IFN-α-induced ISRE activation signal at 16 h. Hit compounds were identified using a structure enrichment strategy based on chemoinformatic clustering and a naïve “Top X” approach. A select list of confirmed hits was then evaluated for toxicity and the ability to sustain IFN activity by gene and protein expression. Finally, for proof of concept, a panel of compounds was used to immunize mice as co-adjuvant with a model antigen and an IFN-inducing Toll-like receptor 4 agonist, lipopolysaccharide, as an adjuvant. Selected compounds significantly augmented antigen-specific immunoglobulin responses.
Introduction
Much of vaccine development has focused on the mixture of antigens necessary to evoke a protective immune response. Equally important to the antigen components, however, is the composition of the accompanying adjuvant required to augment the strength of the response without harmful toxicity. The use of appropriate adjuvants is particularly important for at-risk populations with reduced immune responses, such as the elderly. In 2015, the U.S. Food and Drug Administration (FDA) approved FLUAD, the first seasonal influenza vaccine containing an adjuvant marketed in the United States to improve efficacy in the elderly population.1,2 FLUAD is formulated with the adjuvant MF59, an oil-in-water emulsion of squalene oil that has been shown to act by differentiation of dendritic cells (DCs) and enhancement of antigen uptake.3,4 Additional agents to enhance and prolong immune responses in conjunction with the antigen-preserving components may result in further reductions in mortality from infections, including influenza.
Type I interferon (IFN) has been shown to be a potent adjuvant when co-administered with a human influenza vaccine.5,6 Hence, we aimed to discover well-characterized small molecules that would prolong the activation signal from endogenously produced type I IFN. When a foreign antigen is introduced, it is engulfed by antigen-presenting cells (APCs) and trafficked into the draining lymph node, where an adaptive immune response is primed in contrast to the primary effect of an adjuvant at the local site of injection. 7 We hypothesized that prolonging the IFN response would enhance the antigen-presenting activity after migration of APCs to the lymph node beyond the usual window of signal decay.
Although there are multiple isoforms of type I IFN-α and one isoform of IFN-β, they bind a common receptor on the cell surface. 8 The type I IFN receptor (IFNAR) is composed of two subunits, IFNAR1 and IFNAR2, which are associated with the Janus activated kinases (JAKs) tyrosine kinase 2 (TYK2) and JAK1, respectively.9,10 Activation of the JAKs that are associated with the IFNAR results in tyrosine phosphorylation of STAT1 (signal transducer and activator of transcription 1) and STAT2; this leads to the formation of IFN-stimulated gene factor 3 (ISGF3) complexes comprised of STAT1-STAT2-IRF9 multimers. 11 These complexes translocate to the nucleus and bind IFN-stimulated response elements (ISREs) to initiate gene transcription.12,13 An increase in expression of genes associated with this IFN gene signature, including LY6E, MX1, OAS3, IFI44L, IFI6, and IFITM3, has been linked to the early phases after vaccination. 14 The duration of the IFN response is tightly regulated at the transcriptional and protein levels.
Prior high-throughput screening (HTS) sought to discover compounds that directly induced IFN up to 8 h as novel antiviral agents.15–17 However, here we aimed to identify small molecules that would prolong an existing IFN signal in an APC during its transition to the draining lymph node to enhance adaptive immune responses. We previously identified pyrimidoindoles and 4-aminoquinazolines as potent adjuvants through HTS using a Förster resonance energy transfer (FRET)-based NF-κB reporter assay in the human APC-like monocytic cell line, THP-1.18,19 Using this same reporter cell line, we recently demonstrated the overall feasibility of HTS for identifying co-adjuvants that prolonged NF-κB signaling. 19 Based on this success, we developed a THP-1 cell line with a robust ISRE reporter construct, which was then used in HTS, where IFN-α was added concurrently with the screening compounds and ISRE activity was assayed after 16 h. This strategy revealed a variety of chemotypes that improved vaccine efficacy as co-adjuvants in a murine model using lipopolysaccharide (LPS, an interferon inducing adjuvant) and ovalbumin (OVA, a test antigen).
Materials and Methods
ISRE-bla THP-1 Cells
The ISRE-β-lactamase (bla) reporter human monocytic THP-1 cell line was developed with Thermo Fisher Scientific (Waltham, MA; formerly Life Technologies, Carlsbad, CA). An existing ISRE-bla reporter lentiviral construct was transduced into THP-1 cells (ISRE-bla THP-1). A stable pool of cells expressing the construct was generated following blasticidin selection. Clones were selected by pulsing the cells with LiveBLAzer FRET-B/G and sorting by flow cytometry. The ISRE-bla THP-1 cells were maintained in culture in complete RPMI-1640 growth medium supplemented with 10% fetal bovine serum (FBS, cat. 26400-036, Thermo Fisher Scientific), penicillin-streptomycin (100 U/mL and 100 µg/mL, respectively), 1% minimum essential medium with nonessential amino acid (MEM-NEAA, Thermo Fisher Scientific), and blasticidin (5 μg/mL) at 37 °C in 5% CO2. All the assay validations were carried out in assay medium OptiMEM I Reduced Serum Medium (cat. 31985-070, Thermo Fisher Scientific) in 384-well plates (cat. 3712, Corning, Corning, NY). Serial dilutions of human IFN-α (cat. 11101-1, PBL Assay Science, Piscataway, NJ) were carried out in assay medium without FBS.
Assays for Interferon Signaling in ISRE-bla THP-1 Cells
For overexpression of ubiquitin-specific peptidase 18 (USP18), human USP18 was cloned into the MSCV-IRES-Puro (MIP) retroviral vector. 20 For stable knockdown of USP18, control short-hairpin RNA (shCTRL) or USP18-specific shRNA was cloned into the pSuper-retro-puro retroviral vector. 21 Transfection was conducted by using polyethylenimine (PEI). 22 For retrovirus production, 293T cells were co-transfected with plasmids encoding viral vectors and packaging vectors pCL-10A1. Viral particles were collected 48 h after transfection and filtered with a 0.45 μm sterile filter. For the retrovirus infection, spin infection (2000g, 3 h, 30 °C; Allegra X12R [Beckman Coulter, Brea, CA]) in the presence of polybrene (8 µg/mL) was performed. Single colonies were isolated by culturing cells in a 96-well plate and tested for the knockdown of USP18. ISRE-bla THP-1-transduced cells were treated with 1000 U/mL of human IFN-α, lysed in radioimmunoprecipitation assay (RIPA) buffer composed of 25 mM Tris-HCl (pH 8.0), 150 mM NaCl, 1 mM EDTA, and 0.5% Nonidet P-40 with proteinase and phosphatase inhibitors (Roche, Basel, Switzerland). The cell lysates were denatured in 1× sample buffer (50 mM Tris-HCl [pH 6.8], 2% sodium dodecyl sulfate [SDS], 2-mercaptethanol, 10% glycerol, and 1% bromophenol blue) for 5 min at 100 °C. The proteins were separated by SDS–polyacrylamide gel electrophoresis (PAGE), blotted onto methyl cellulose membrane, and probed with the indicated antibodies: anti-phospho-STAT1 (Tyr 701) (Cell Signaling Technology, Danvers, MA), anti-STAT1 (Cell Signaling Technology), anti-USP18, 23 and anti-tubulin (Sigma-Aldrich, St. Louis, MO). For the quantification of protein blots, signals were detected with the LI-COR Odyssey system.
Compound Library for HTS and Purchased Compounds
A library of diverse compounds was acquired from the UCSF Small Molecule Discovery Center (SMDC) consisting of 172,145 chemical entities from 10 suppliers ( Suppl. Fig. S1 ). Hit compounds were purchased from the vendors listed in Supplemental Table S2 .
High-Throughput Screening
HTS was performed by Thermo Fisher Scientific at their commercial robotics facility (Madison, WI). Frozen ISRE-bla THP-1 cells were first thawed and incubated in assay media containing 5% FBS for 24 h. Then cells were transferred to the 384-well assay plates at a density of 40,000 cells/well, except for the cell-free background control wells. 50nM Human type I IFN-α was added to the “IFN 16h” control wells and the test wells. At the same time, test compounds at a final concentration of 5 µM were added to the test wells. After 10 h of incubation, IFN-α was added to the “IFN 6h” control wells. After an additional 6 h, the β-lactamase substrate was added to all wells, giving 16 h total incubation for the “IFN 16h” wells and 6 h of incubation for the “IFN 6h” activation control wells. The fluorescence emission at 535 and 465 nm was assayed after 3 h of further incubation with LiveBLAzer FRET-B/G (CCF4-AM) β-lactamase substrate.
Four types of control wells were included: cell-free wells for background estimation; “No IFN + cells” wells to estimate the readout of unstimulated cells; “IFN 16h” wells to estimate the readout of the ISRE reporter gene after 16 h of incubation, during which time the signal will decay; and an additional control “IFN 6h” wells for ensuring activation of ISRE-bla THP-1 cells. There were 46 plates in the pilot screen and 572 plates screened over eight assay runs in the main screen.
Measurement of ISRE Activation in ISRE-bla THP-1 Cells
Fluorescence was measured at an excitation wavelength of 405 nm and emission wavelengths of 465 and 535 nm. In each assay plate, negative control wells were included that were cell-free and cells with vehicle, that is, 0.5% DMSO (No IFN + cells). The background fluorescence values were subtracted from the raw fluorescence values (cell-free wells at the same fluorescence wavelength), and emission ratios were calculated by dividing background-subtracted values at an emission wavelength of 465 nm to an emission wavelength of 535 nm. The response ratios were calculated as follows: (emission ratio of a test well)/(average emission ratio of “No IFN + cells” wells [0.5% DMSO]). The percent activation was calculated using “IFN 6h” as a reference. The activation values were not standardized to “IFN 16h” due to significant variability of the “IFN 16h” values.
For dose titration experiments, cells were plated in 96-well plates (105 cells/well) and treated with serially diluted compounds in the presence of vehicle or three different doses of IFN-α (20, 100, and 500 U/mL) for 16 h. Substrate was added and incubated for 3 h. Fluorescence was measured and emission ratios were calculated as described above.
Cell Viability Assay
THP-1 cells were dispensed in 96-well plates (105 cells/well) and treated with 5 µM of each compound. After 18 h of incubation, a solution of 3-[4,5-dimethylthiazol-2-yl]-2,5-dipheyl tetrazolium bromide (MTT; Thermo Fisher Scientific) in assay media (0.5 mg/mL) was added to each well and further incubated for 4–6 h, followed by the addition of a cell lysis buffer (15% w/v SDS and 0.12% v/v 12 N HCl aqueous solution), incubated overnight, and then absorbance measured at 570 nm using 650 nm as a reference with a plate reader.
Quantigene Assay and Immunoblots
Murine bone marrow-derived dendritic cells (BMDCs) prepared from wild-type (WT) C57BL/6 mice were plated at a density of 2 × 10⁵ cells/well in a 96-well plate. The cells were then treated with a 5 µM final concentration of each compound. IFN-α (100 U/mL) was then added and the plates were incubated for 10 h. The cells were then lysed and analyzed by Quantigene assay (Thermo Fisher Scientific) for expression of Isg56, Ifi2712a, Ifi16, Isg15, and Irf7, in addition to Rps20, Hprt, and Rpl19 genes used as a reference. Gene expression in human THP-1 cells by RT-qPCR was performed using lower concentrations of select compounds (1 µM of
In Vivo Adjuvant Activity Study
Seven- to nine-week-old WT C57BL/6 mice were purchased from Jackson Laboratories (Bar Harbor, MA). All animal experiments received prior approval from the University of California, San Diego (UCSD) Institutional Animal Care and Use Committee. The mice (n = 5 per group) were immunized in the gastronemius muscle with OVA (20 μg/injection; Worthington Biochemical Co., Lakewood, NJ) mixed with LPS (3 μg/injection; L2654, Sigma-Aldrich) and one of the compounds
Statistical Analysis
Procedures to identify hits from the HTS using a structural enrichment method are detailed in the Pilot, Main, and Confirmation Screens section in Results. Data for in vitro studies are represented as mean ± standard deviation (SD). Prism 6 (GraphPad Software, San Diego, CA) statistical software was used to obtain p values for comparison between groups (p < 0.05 was considered significant) for in vivo study. One-way analysis of variance (ANOVA) followed by Dunnett’s post hoc test was used to compare multiple groups against the vehicle group. 25
Results
Overall HTS Strategy and Design
We devised a cell-based HTS assay to broadly cover cellular pathways that might prolong an IFN-induced signal. We first developed a cell line with an ISRE reporter gene and optimized assay conditions to accommodate longer cell incubation times needed to assess prolonged activation of IFN-α. Extensive preliminary experiments were then performed to optimize this newly created THP-1 ISRE-bla cell line for HTS assays. This was followed by an initial pilot screen with 14,597 compounds. This assay was then used in an HTS main screen with 172,145 compounds, and potential hits were rescreened in duplicate in a confirmation screen of 2026 compounds. Additional validation screens for confirmed hits included toxicity studies and gene and protein analysis. This approach led to the discovery of several chemical scaffolds that were able to sustain a type I IFN response. The overall value of this screening strategy was confirmed by the ability of selected compounds to augment a vaccination response to a test antigen in mice in the presence of a known IFN-inducing compound ( Fig. 1 ).
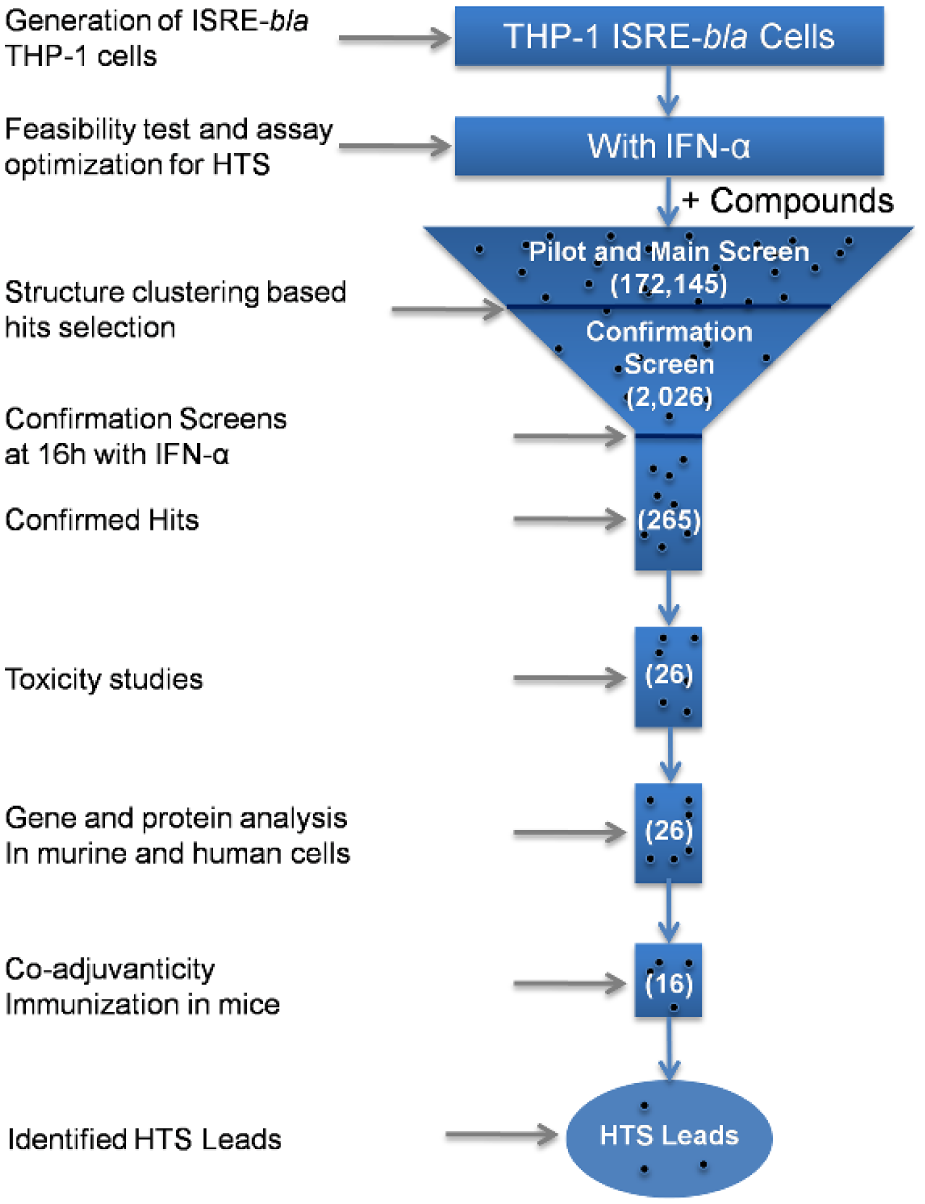
HTS workflow strategy. The cell-based assay using THP-1 ISRE-bla reporter cells was optimized for the identification of compounds that prolonged ISRE activation when stimulated with IFN-α for 16 h. First, the ISRE-bla THP-1 cells were generated and a feasibility test was performed to validate the transduction of the ISRE-bla gene responsive to activation with IFN-α. The assay conditions were then optimized for HTS, and a pilot screen of 14,597 compounds was run to validate the approach. In the main library screen, 172,145 compounds were screened in the presence of IFN-α for ISRE activation at 16 h. Cluster-based statistical analysis yielded 2026 compounds, which were retested in a confirmation screen at 16 h with IFN-α in duplicate. Two hundred sixty-five compounds that had confirmed activity at 16 h were structurally clustered using a similarity cutoff index of 0.5. Several large families of chemotypes were identified as hits. The selected compounds from these chemotypes were subjected to cell-based toxicity studies, in vitro gene and protein analysis, and in vivo co-adjuvanticity studies in mice, which led to the identification of key lead molecules. The number in parentheses corresponds to the number of compounds.
Generation of ISRE-bla THP-1 Cells and Feasibility Studies
We selected the human THP-1 cell line because it had previously been utilized for robotic HTS and is a monocytic cell line with features characteristic of APCs.18,19,26 THP-1 cells were transduced with an existing validated ISRE-bla reporter construct by Thermo Fisher Scientific. The stable pool of THP-1 cells expressing ISRE-bla was further expanded and sorted by fluorescence-activated cell sorting (FACS) to obtain single cell clones. For the initial screen, a total of 36 clones were screened against a single concentration of IFN-α (10 nM). Eight top responding clones were selected and further screened against graded doses of IFN-α. EC50 and response ratios of stimulation were determined for each clone. As all eight clones showed similar EC50 values for IFN-α stimulation, the clone that yielded the highest response ratio was selected for further feasibility assays. These cells have maintained FRET activity with exogenous IFN up to nine passages.
The THP-1 ISRE-bla cell line generated from the selected clone was propagated and first tested for the ability to regulate IFN responses. USP18 is a protease that removes ISG15 from substrate proteins and also functions as a potent inhibitor of type I IFN signaling.20,27,28 This mechanism was tested in the THP-1 ISRE-bla cell line by overexpression and knockdown approaches. Overexpression of USP18 using retroviral transduction (MIP-USP18) reduced the level of STAT1 phosphorylation upon IFN-α treatment ( Fig. 2A ). Conversely, USP18 silencing by introducing a short-hairpin RNA (shRNA) prolonged STAT1 phosphorylation ( Fig. 2B ). Hence, the THP-1 ISRE-bla cell line biologically responded to IFN-α and had the potential to detect compounds that altered IFN signal regulation (demonstrated here by alterations in USP18 levels).
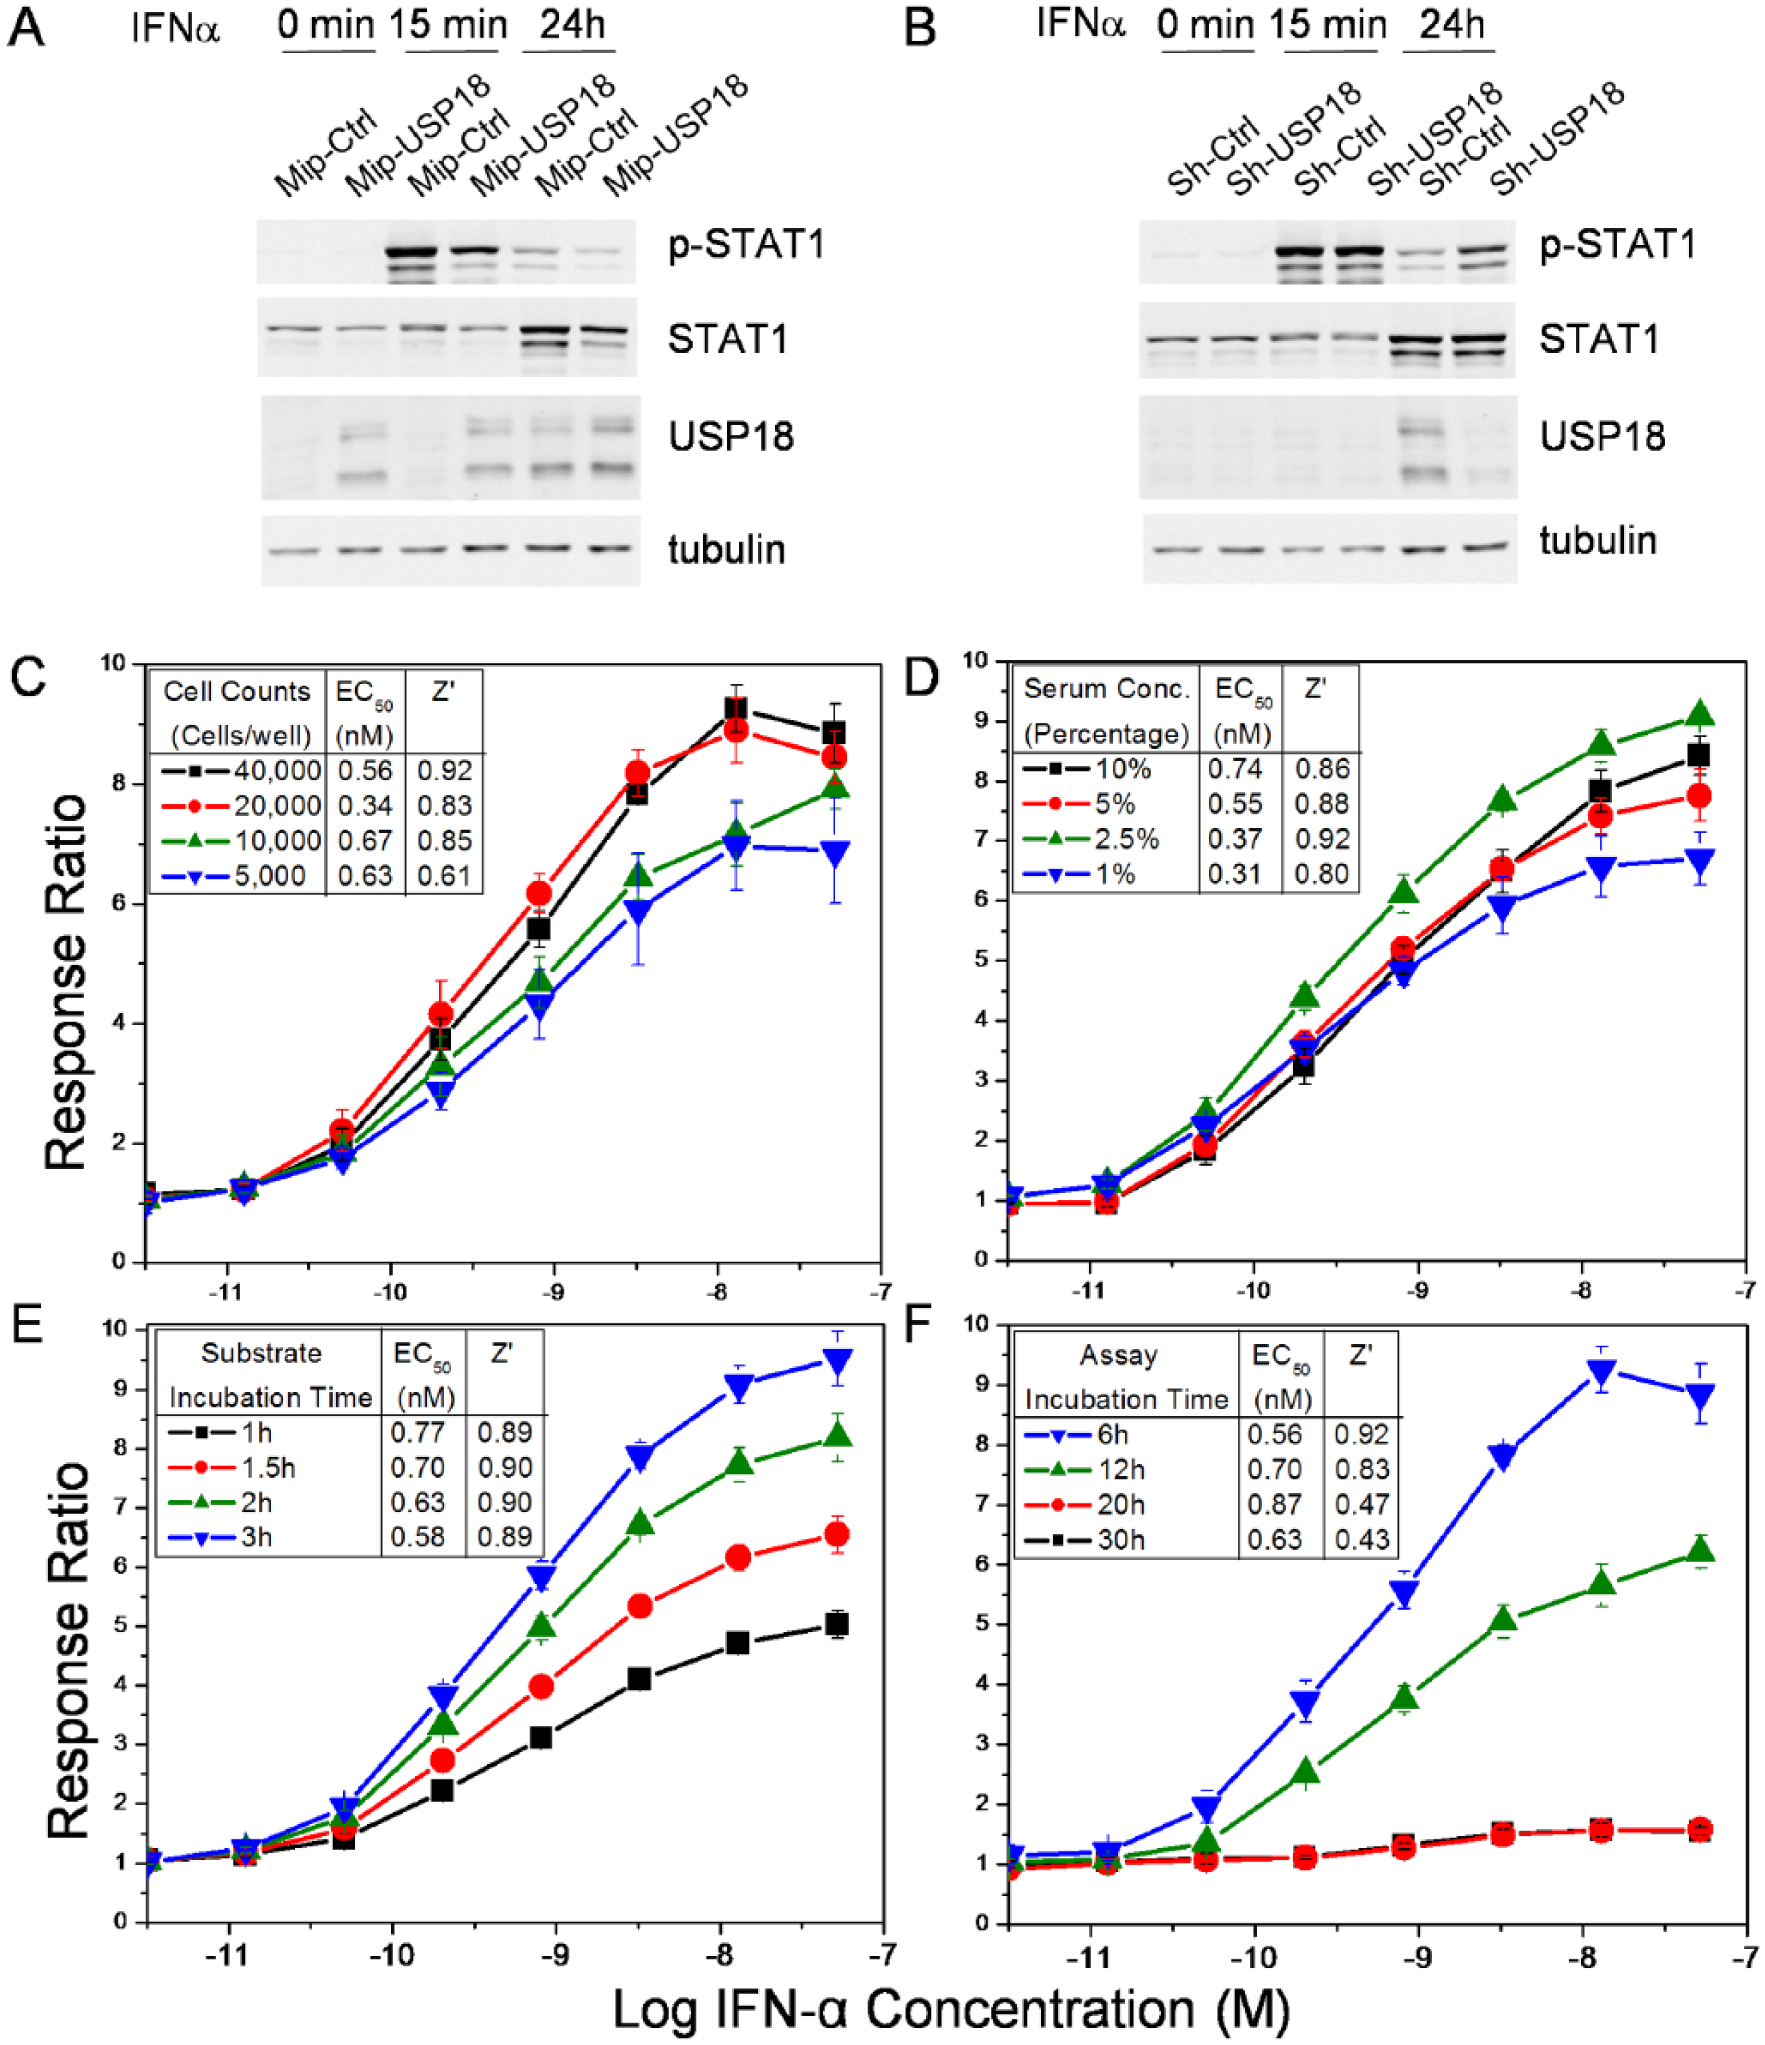
Cell feasibility tests. The expression of ISRE in THP-1 cells was confirmed using (
To assess the feasibility of HTS using the newly generated THP-1 ISRE-bla cell line, cells were tested for responses over graded doses of human IFN-α2A subject to the following variables: (1) varying cell counts, including 5000, 10,000, 20,000 and 40,000 cells/well; (2) FBS concentration at 1.0%, 2.5%, 5.0%, or 10%; (3) substrate incubation time of 60, 90, 120, or 180 min; and (4) total stimulation time with IFN-α treatment of 6, 12, 20, or 30 h (assay stimulation time) ( Fig. 2C–F ). The signal increased with increasing cell counts ( Fig. 2C ) and increasing substrate incubation time ( Fig. 2E ), suggesting a direct relationship between activation, cell density, and exposure to substrate. The serum concentration did not show any appreciable effect on activation ( Fig. 2D ). With regard to assay incubation time, the signal peaked at 6 h and began to fall over time, as expected ( Fig. 2F ). These feasibility studies performed with both the fresh and cryopreserved cells showed that the activation signal was sufficiently robust to further evaluate this THP-1 ISRE-bla cell line for assay optimization to be used for the HTS.
Assay Optimization for HTS
In order to avoid variability in assay performed over different days, the HTS experiments required the use of frozen cells (from the same passage cycle), which were thawed and plated prior to the screens using the robotic system. We conducted an additional series of experiments with the thawed cells to optimize the assay conditions for the HTS. We first examined the following parameters: (1) assay incubation time post-IFN-α addition (6, 12, and 30 h), (2) cell counts (20,000 vs 40,000 cells/well), (3) serum concentration in assay media (5% vs 2.5%), and (4) the optimal dose of IFN-α for both the test wells and the full-stimulation control wells ( Fig. 3A ). The substrate incubation time was kept fixed at 3 h. Within each of these experimental conditions there were dose–response curves against serial dilutions beginning with a concentration of 100 nM IFN-α and an additional control “IFN-α 6h” for 100 nM IFN-α added 6 h prior to the total assay incubation time.
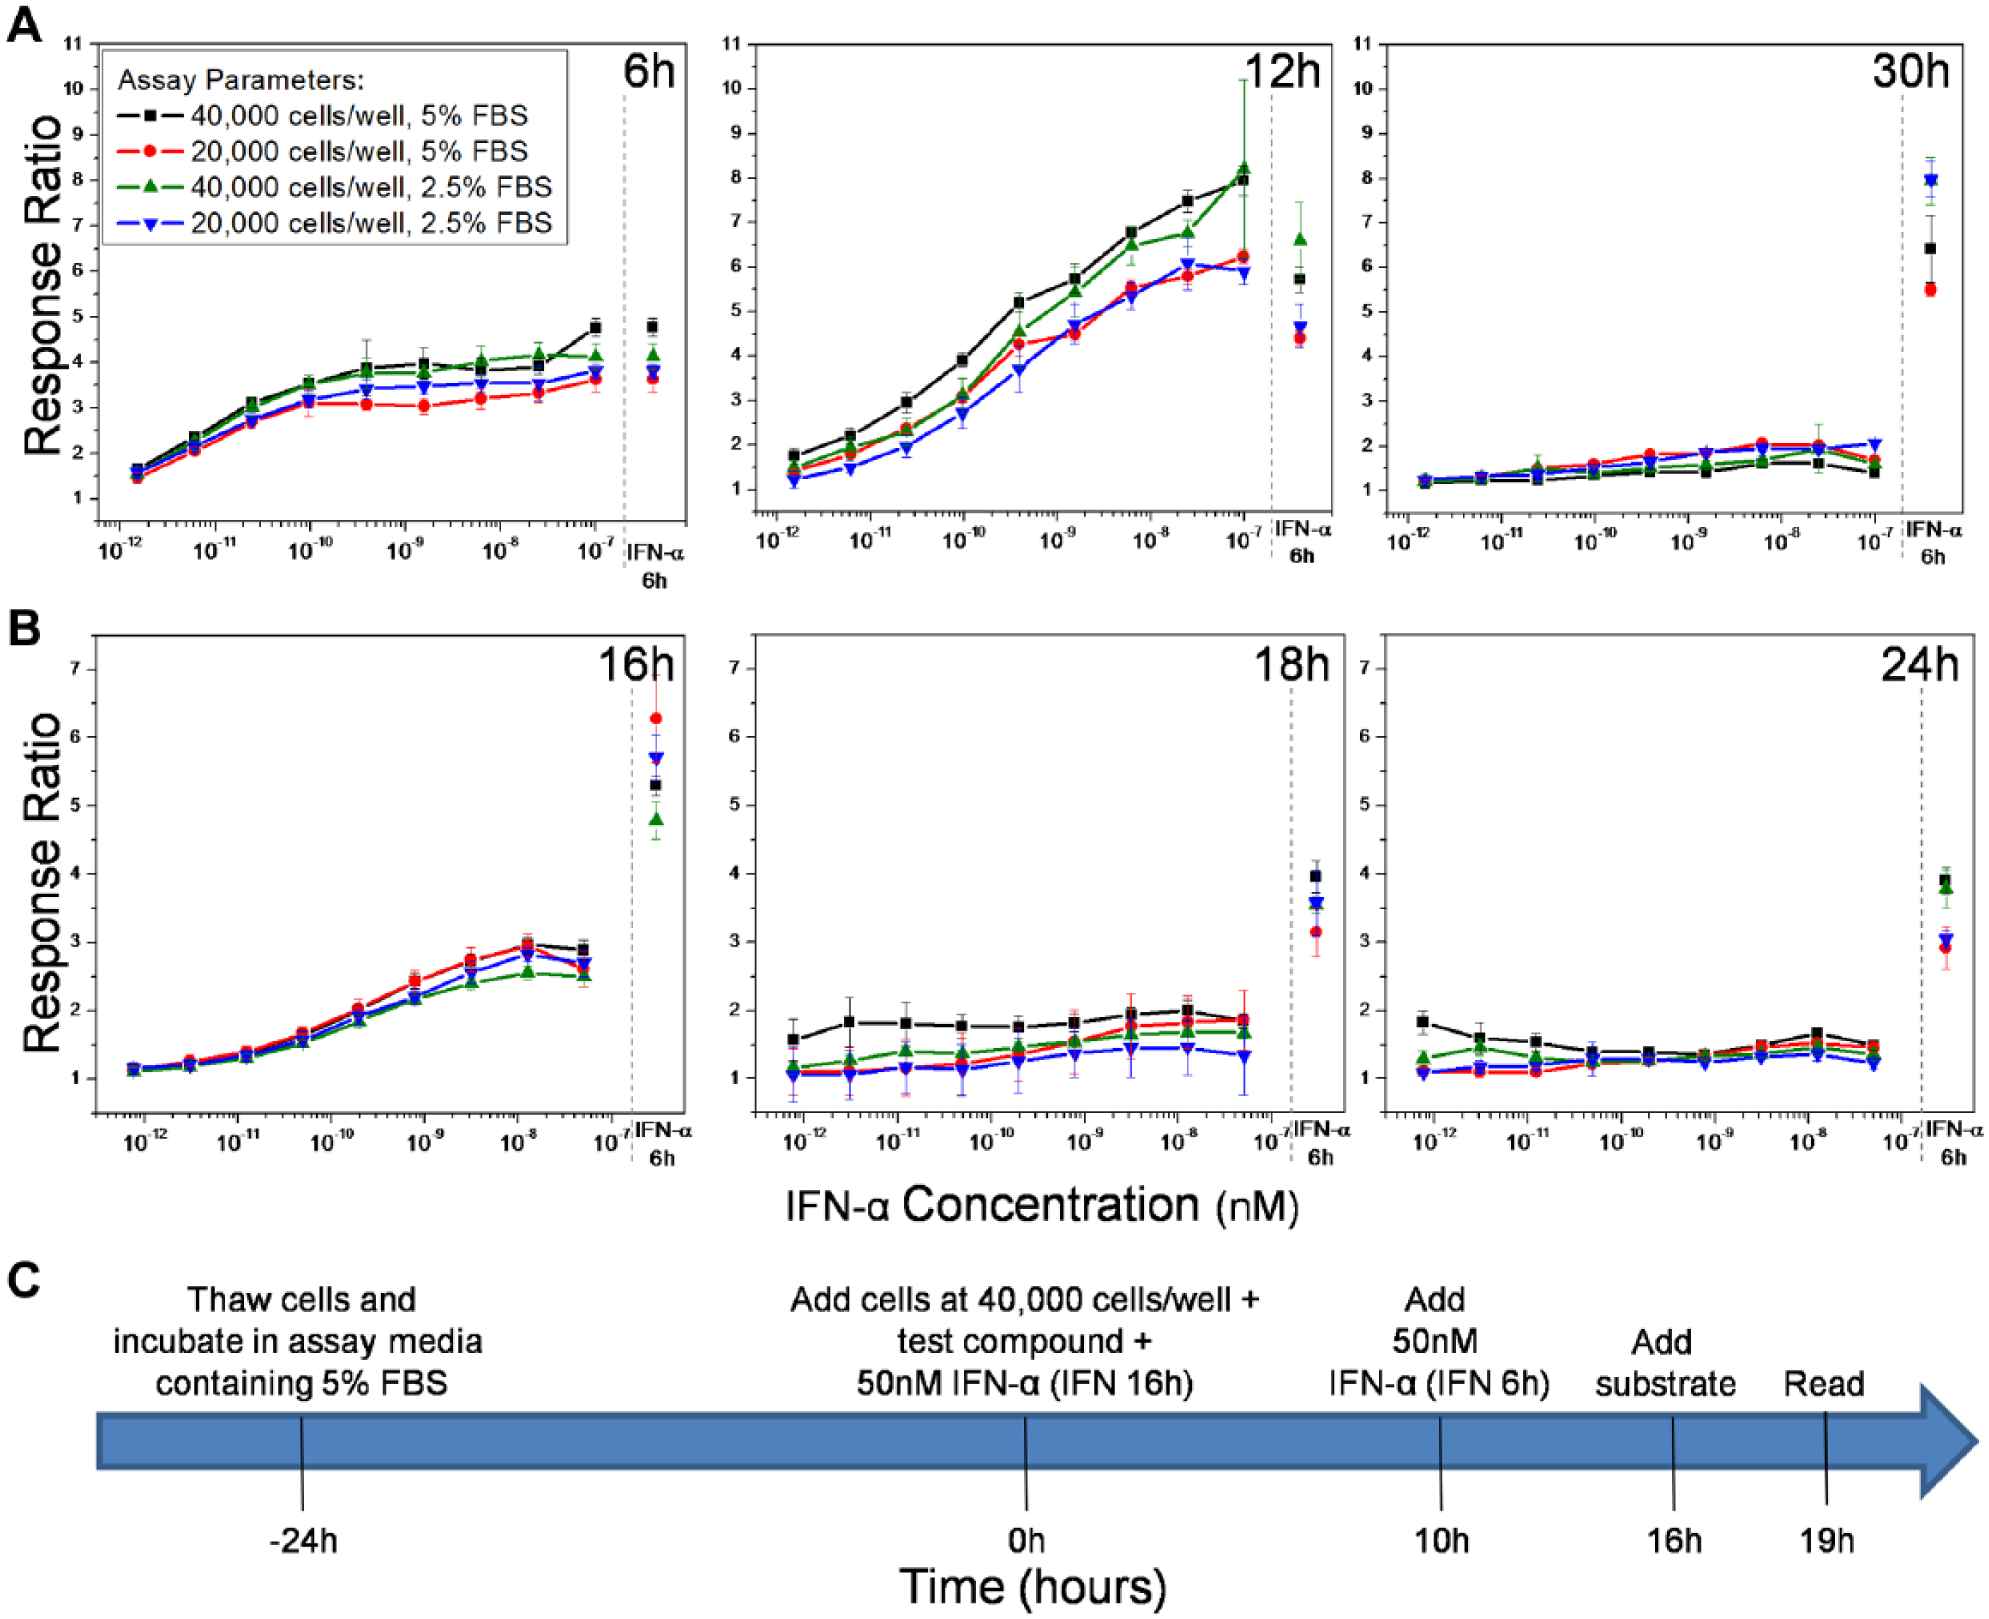
Assay optimization for HTS. The assay conditions were optimized for cell density, serum concentration, and incubation time. (
Initial experiments revealed that 6 and 12 h of IFN-α stimulation were too short to see signal decay. By 30 h, the signal had completely decayed, suggesting that an incubation time of 30 h was too long to be reliable for the assay ( Fig. 3A ). Forty thousand cells per well and 5% FBS appeared to have a better response than other conditions at the 12 h time point. Dose–response curves indicated that good stimulation was achieved at concentrations lower than 100 nM IFN-α as well, so a second set of focused validation experiments was run using 50 nM IFN-α. The goal was to maximize the difference between the “IFN-α 6h” activation controls for 50 nM IFN-α and the decayed IFN-α signal at 16, 18, and 24 h. This difference was greatest at 16 h of incubation time ( Fig. 3B ).
The incubation time before the cell stimulation did not significantly affect the signal. In addition, the cells tolerated up to 1% DMSO without significant change in emission ratios. An optimal assay protocol using the above standardized conditions was deemed to be as follows: The cells are first incubated in assay media containing 5% FBS for 24 h after thawing and then are distributed in the 384-well assay plates at a density of 40,000 cells/well (except for the cell-free control wells). IFN-α is added to the “IFN 16h” control wells and the test wells. After 10 h of incubation, IFN-α is added to the “IFN 6h” control wells. After an additional 6 h, the β-lactamase substrate is added to all wells, giving 16 h of total incubation for the “IFN 16h” wells and 6 h of incubation for the “IFN 6h” full-activation wells. The fluorescence emissions are measured after 3 h of further incubation with the substrate ( Fig. 3C ).
Pilot, Main, and Confirmation Screens
We selected compounds representative of the chemical diversity in the compound library at UCSF SMDC. A total of 46 plates comprising 14,597 compounds were included in the pilot screen ( Fig. 4A ). As shown, the assay exhibited a substantial difference in “% activation” between the two control conditions: “IFN 16h” (purple circles), exhibiting normal decay in IFN-α signaling over 16 h, and “IFN 6h” (blue triangles), demonstrating maximum IFN-α signaling ( Fig. 4A ). This difference in control conditions indicates that the assay had adequate power to detect compounds that prolong IFN-α signaling. Encouraged by this result, the main screen, which included 172,145 test compounds on 572 plates, was performed over eight assay runs ( Suppl. Fig. S3 ). All 14,597 compounds from the pilot screen were repeated for statistical analysis. After background correction, outliers were trimmed for control wells and “% activation” for the test compounds was computed using the “IFN 6h” condition as the 100% activation control and “No IFN + cells” wells as the 0% value. Z′ for the main HTS ranged between 0.50 and 0.90, with a median of 0.71.
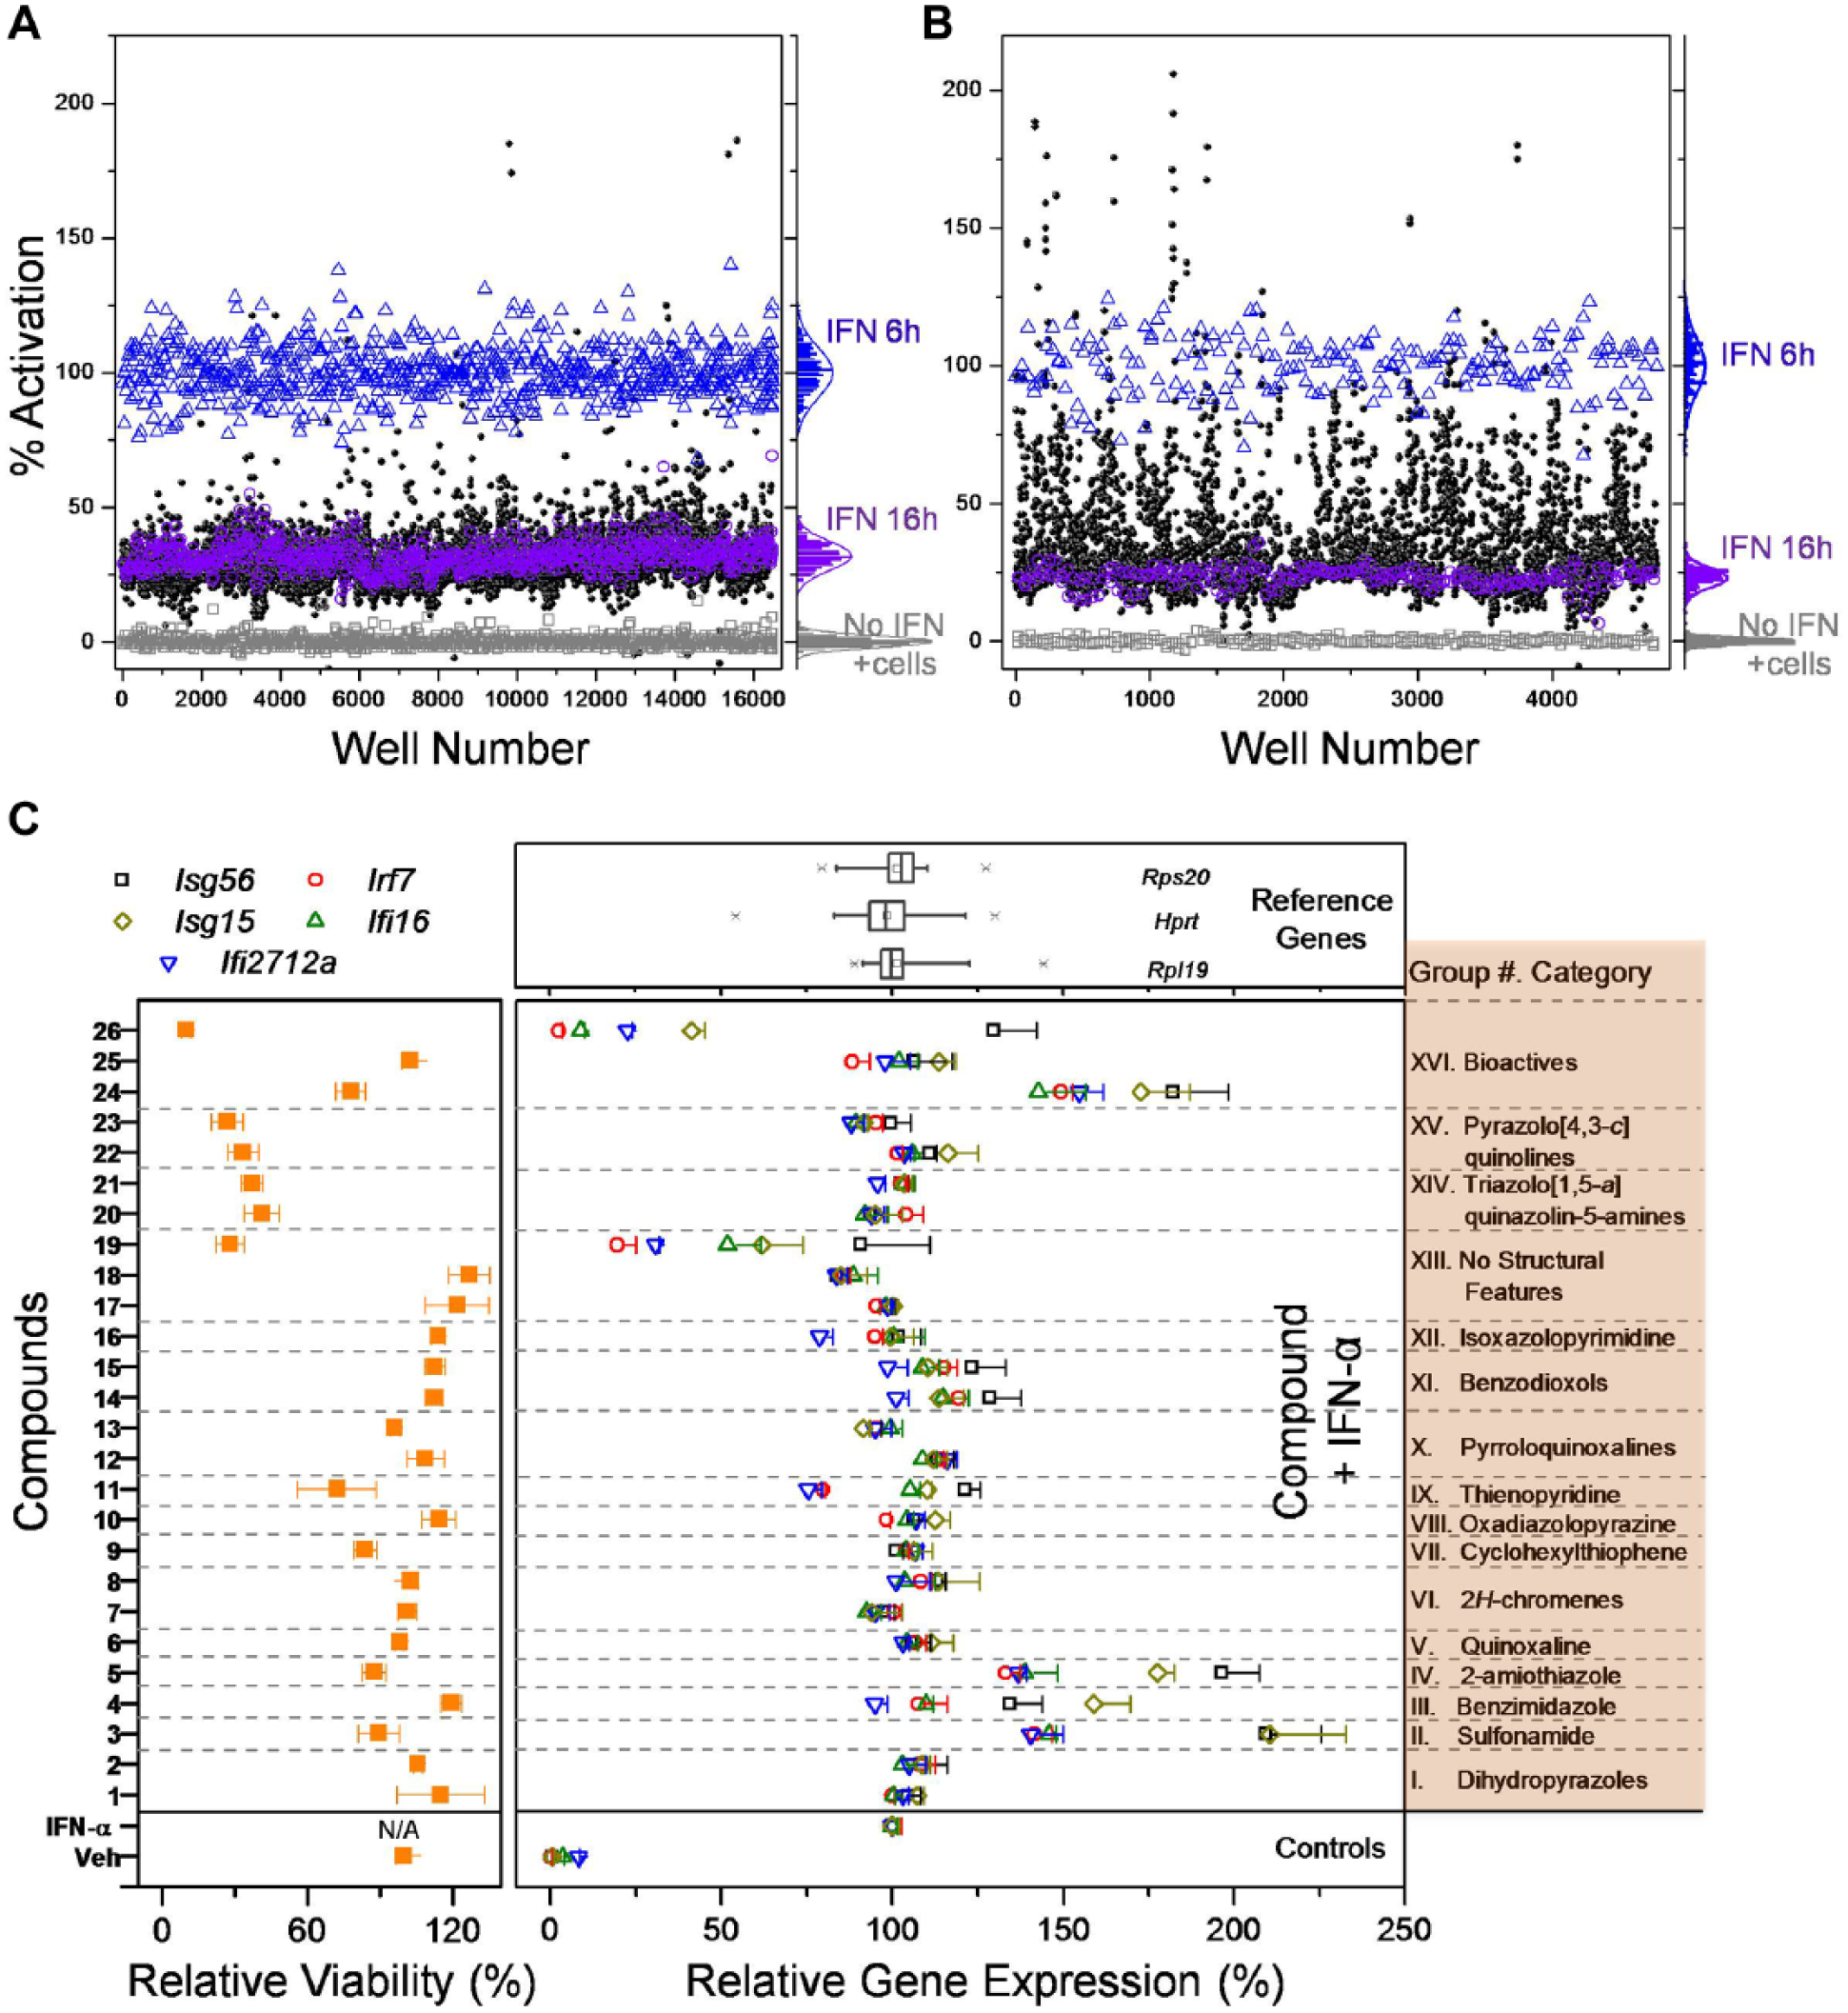
Compound screening. Percent activation values for the controls and test compounds from (
We used a structural family enrichment method to identify hits.19,26,29 Structural families were estimated using Murcko scaffold clusters 30 and Daylight fingerprint functional classes. 31 Only Murcko clusters that had at least five test compounds as members were included in the enrichment analysis. A total of 5483 Murcko clusters were thus used, and they contained 56% of all the test compounds. Functional class fingerprint clusters were obtained for all the test compounds by using k-medoids clustering with Euclidean distance, computed using the r function clara; k = 300 was chosen based on estimated cluster sizes and similarity measures. 32 Once compounds were clustered, all the test compounds were ranked according to their “% activation” values. The top 2% of test compounds were identified as candidate hits. To avoid high activation merely caused by autofluorescence, compounds with activation values greater than 125% (i.e., mean + 4× SD of all the “IFN 6h” full-activation values) were not considered as candidate hits unless they were found to be included in a significant Murcko scaffold cluster. Next, each cluster (either Murcko class or functional class cluster) was scored for statistically significant enrichment based on comparing “% candidate hits” inside a cluster versus outside the cluster using Fisher’s exact test. The set of significant clusters was ranked by enrichment odds ratio, and the ranked list of clusters was walked down until the desired number of hits was identified, or until clusters were judged no longer statistically significant. To attain the desired number of compounds and also to increase structural diversity, additional hits were added using a “Top X” approach, walking down the ranked list of test compounds until approximately 2000 compounds were identified. Using this strategy, we identified 778 hits from 109 significantly enriched Murcko clusters, at a false discovery rate (FDR) of 0.25. We also identified 1338 hits from 22 significantly enriched fingerprint clusters, at an FDR of 0.05. As 590 compounds were common by both of the selection approaches, we filled out the remaining ~500 hits using the Top X approach to obtain a final list of 2026 compounds for confirmation screening. To confirm the hits identified in the HTS main screen, these compounds were rescreened in duplicates at 16 h with IFN-α ( Fig. 4B ). The confirmation screen, as expected, showed a higher number of hits above the decayed level of IFN-α at 16 h (“IFN 16h” controls shown in purple circles). Based on this screen, we identified 265 candidate hits using a data-driven method that fits a mixture of two linear models to the combined primary and confirmation screen “% activation” values.19,26 The confirmation rates by the above methods of hit selection are provided in Supplementary Figure S4 .
Selection of Compounds and Bioactivity Analysis of Hits
To prioritize compounds from the 265 confirmed hits for further biological analysis, we first classified compounds by substructure using the server-based ChemMine tools (University of California, Irvine; http://chemmine.ucr.edu/tools/launch_job/Clustering/) and a binning clustering application with a similarity cutoff of 0.5.
33
This analysis allowed us to cluster these compounds into structural categories, as shown in
Supplementary Table S2
. The number of compounds within a group (cluster size) indicates the relative scaffold distribution. Additional categories were generated from confirmed hits that did not have enough structural features for clustering (no structural features) and compounds that had been previously biologically characterized as known bioactives. We then chose to purchase representative confirmed hit compounds from each cluster that were available from commercial vendors (compounds
Dihydropyrazoles represented the largest group but had been previously reported to have intrinsic fluorescence,
35
suggesting that these may have led to false-positive readouts in the FRET-based assay. To assess if the compounds in group I were fluorescent, we first measured the absorbance spectra of several of these compounds at 405 nm, followed by measurement of fluorescence spectra at an excitation wavelength of 405 nm, which was used in the FRET assay. Indeed, most of the compounds showed variable fluorescence emission at 465 nm, except compound
Initially, the compounds were tested for toxicity in THP-1 cells using an MTT assay. Most of the compounds were found to be relatively nontoxic with a relative viability of more than 70% of the vehicle control (0.5% DMSO). However, both of the compounds from group XIV (triazolo[1,5-a]quinazolin-5-amines) and group XV (pyrazolo[4,3-c]quinolones) were found to decrease cell viability (<40%). Among the bioactive compounds, belinostat (
To assess the potential for the compounds to activate APCs in vivo, we evaluated their effect in primary murine BMDCs. Specifically, the panel of compounds was tested for the ability to augment an IFN-induced gene signature pattern including Isg56, Isg15, Ifi2712a, Irf7, and Ifi16 genes (
Fig. 4C
, right). Gene expression was normalized to the geometric mean of three reference genes (Rps20, Hprt, and Rpl19) that were not altered in the presence of IFN-α. None of the compounds showed any significant change in gene expression in the absence of IFN-α (
Suppl. Fig. S7
). In addition, most of the nontoxic compounds did not alter the gene expression compared with IFN-α alone. Compounds
The relative potency of compounds
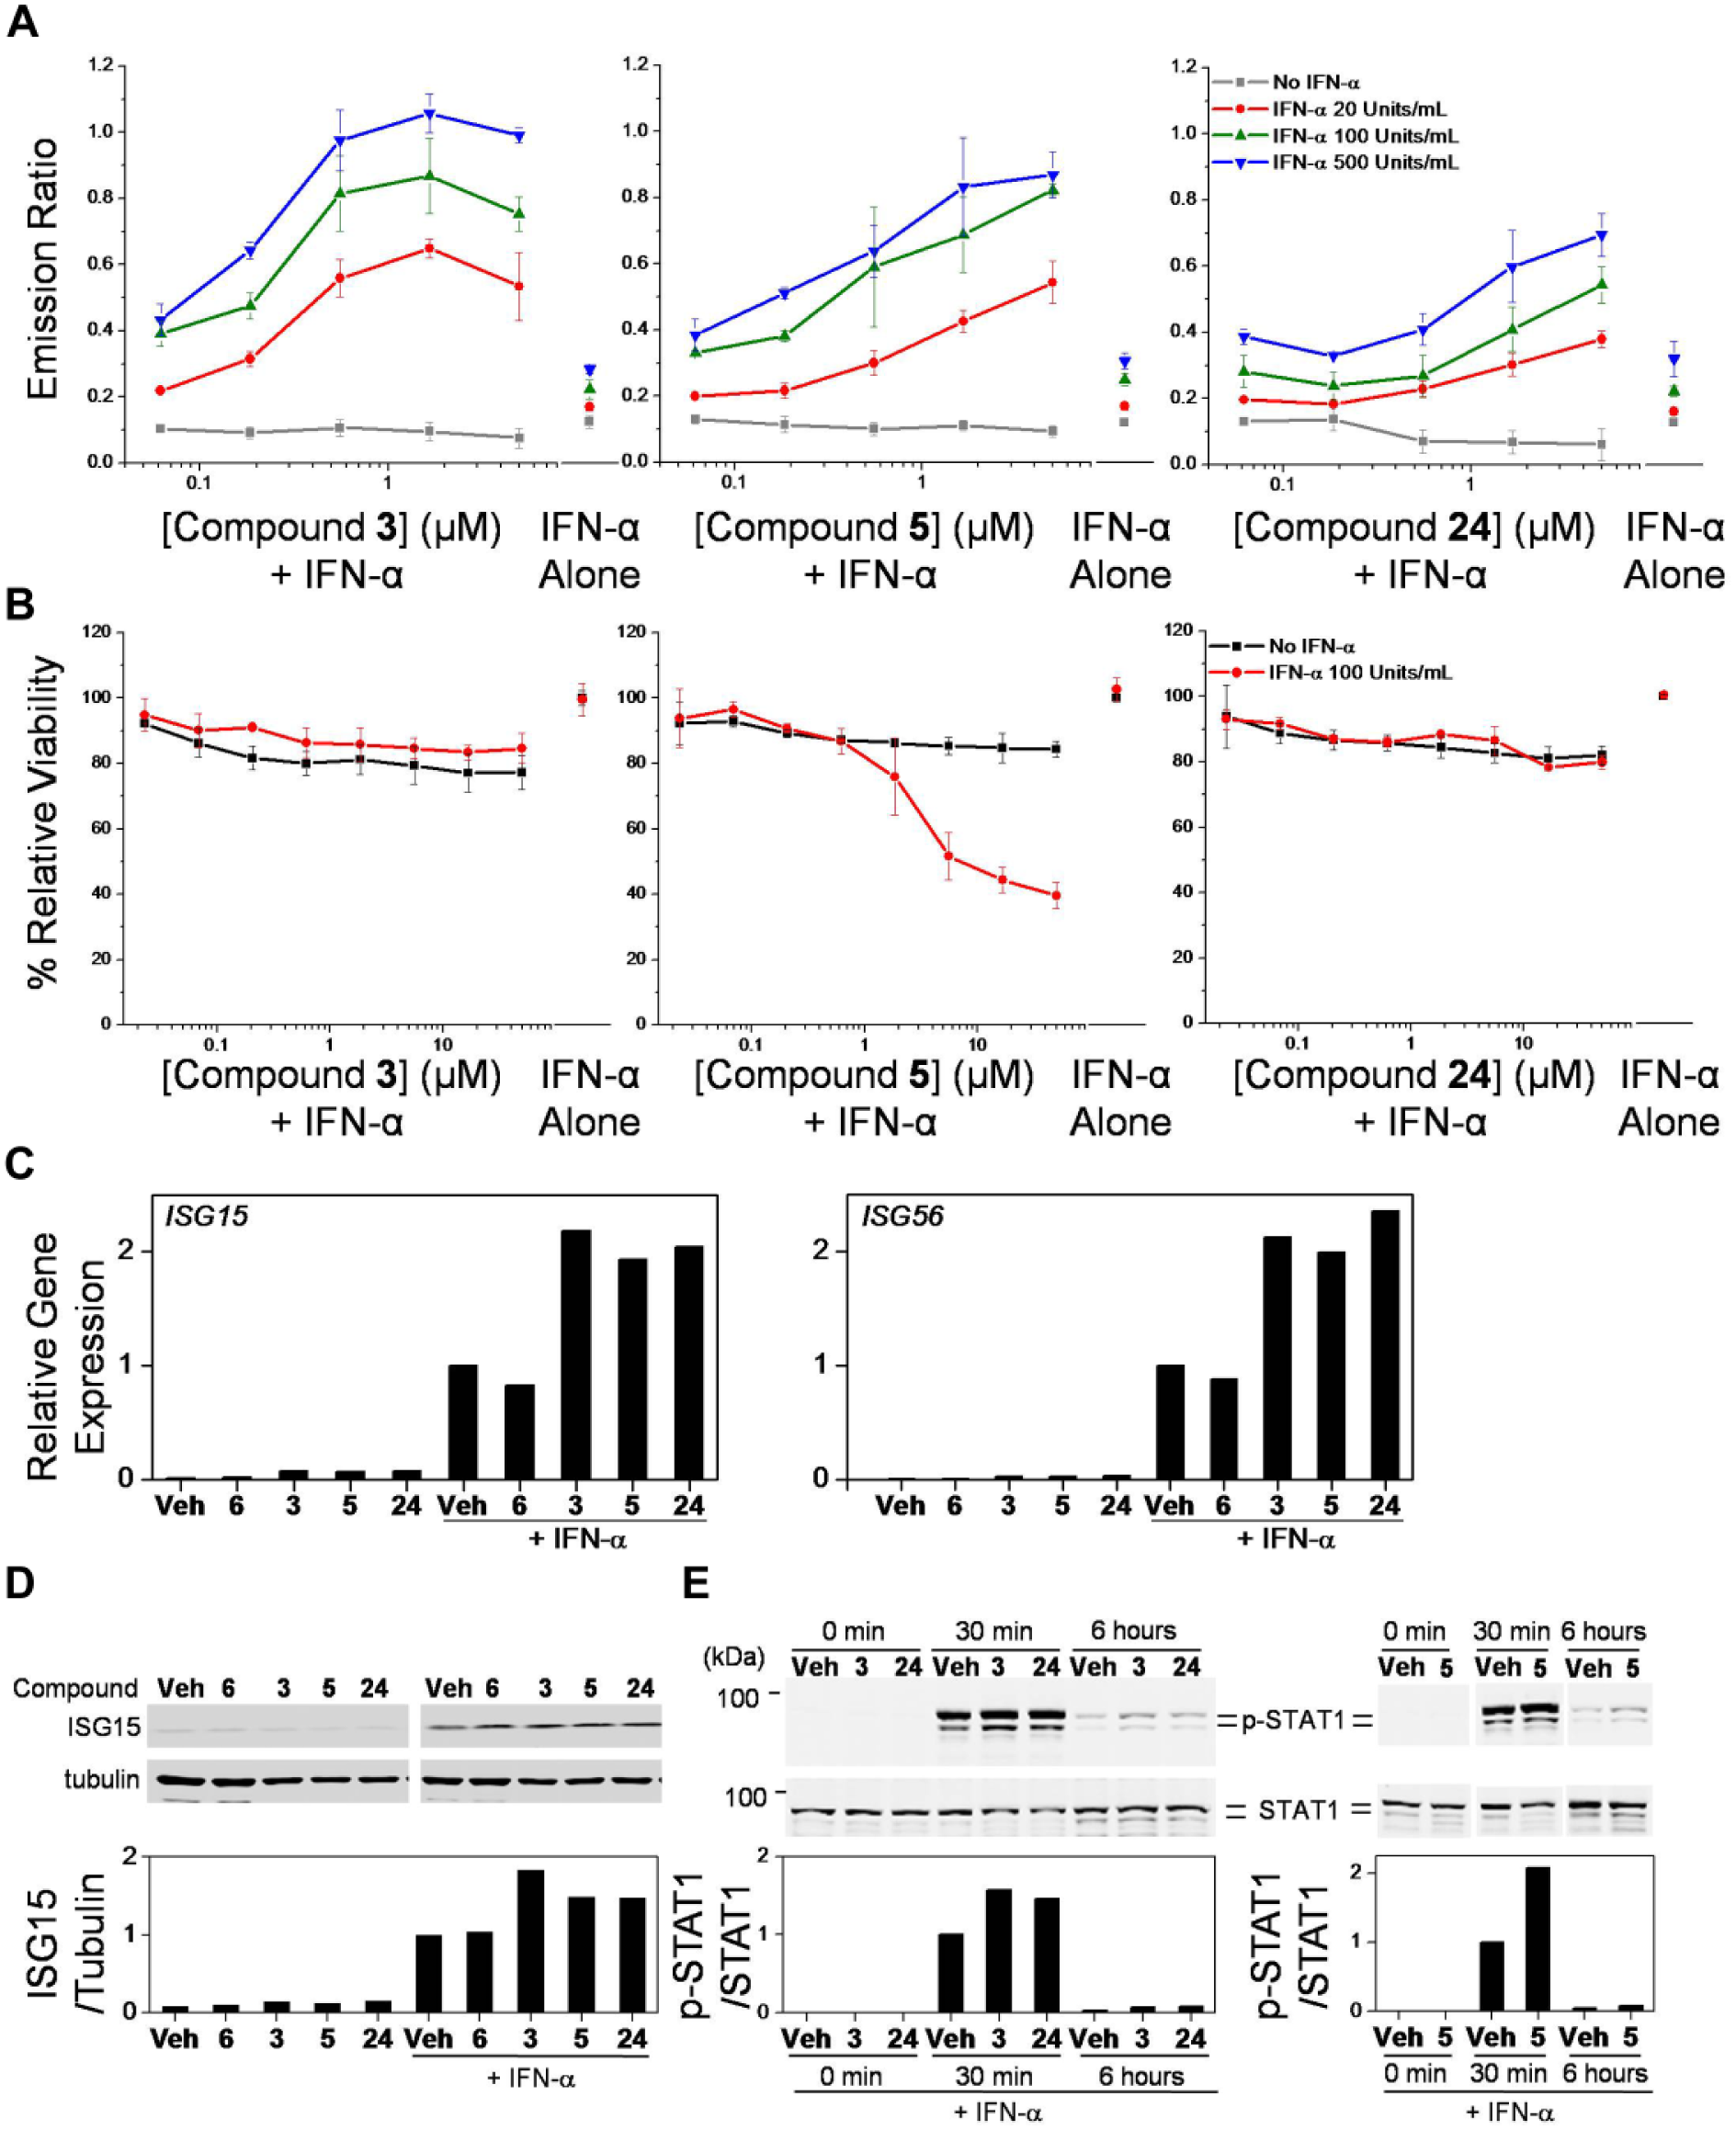
Dose–response curves and secondary screens. (
In order to understand the translation of gene to protein expression in human cells, we first confirmed the gene expression profile for select compounds (
Thus, all the structurally clustered compounds that were relatively nontoxic (relative viability >70%) and that did not show suppression of gene expression (such as compounds
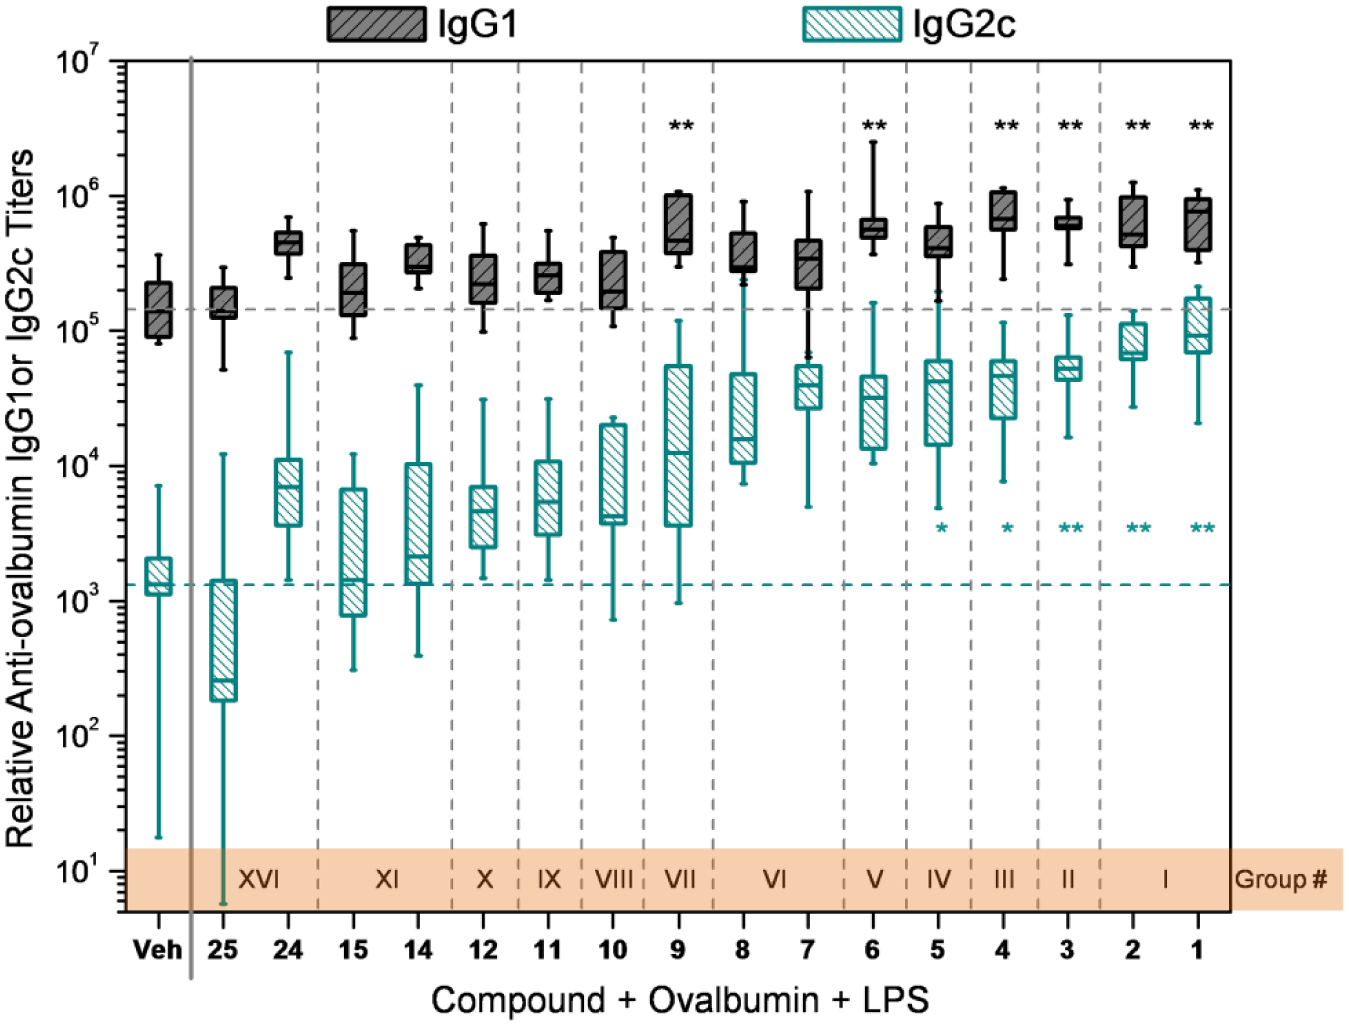
Co-adjuvant activities of select compounds with LPS. Mice (n = 10 per group) were immunized on days 0 and 7 with antigen OVA (20 µg/animal), LPS (3 µg/animal), and the indicated compound (100 nmol/animal)
Discussion
There is an imperative need for potent adjuvants to enhance vaccine response. To address this unmet need, we undertook a high-throughput screen based on our hypothesis that a small-molecular-weight compound that prolongs type I IFN signaling would function as a co-adjuvant in vaccines. To broaden our search, we utilized a cell-based approach to reflect the biologic and metabolic processes in an APC. Biological high-throughput screens suffer greater variability than targeted molecular inhibition; however, our approach could provide a greater number of potential independent molecular targets. To test compounds for prolongation of type I IFN signaling in an APC, we required a very robust assay system. Hence, we developed a monocytic cell line, THP-1, with an ISRE construct that was optimized for HTS. Other smaller high-throughput screens using established lung tumor or sarcoma cell lines have identified compounds that directly stimulated type I IFN production.15,17 Our strategy was different in that the cells were assayed in the presence of IFN-α, as would be induced under normal vaccine conditions. Here we specifically examined the THP-1 ISRE reporter cells after an extended incubation time in order to reveal compounds that could sustain IFN signaling.
To overcome the inherent variability flaws in cell-based assays, we selected chemical scaffolds that were enriched as “hits.” This approach provided two advantages: large families suggest that there is replication in the activity, and negative data afford a structure–activity relationship within the family to guide strategic structure–activity designs. One advantage of a FRET-based system in a prolonged HTS assay is that the baseline signal compensates for loss of cells in the individual wells. In other assay systems, such as luciferase reporters, a single readout cannot differentiate lack of activity from loss of cellular numbers or diminished cell function. Titrations of the test compounds to determine EC50 or IC50 can overcome this limitation, but the size of the screens makes such assays very cumbersome. One limitation of FRET-based systems is the false-positive rate due to compounds that are inherently fluorescent. One such large family of compounds, the dihydropyrazoles (group I), was found to have this property in our screen. Rather than discarding such scaffolds, orthogonal assays for ISRE-associated gene transcripts and eventual in vivo immunization confirmed potency for a few of these compounds.
The variety of molecular pathways that can enhance ISRE activity is suggested by the diverse chemical scaffolds that exerted this activity. The positive hits included some bioactive compounds, including cardiac glycosides and HDAC inhibitors. We selected belinostat, an Src kinase inhibitor (KX2-391), and an epigenetic modulator azacitidine.36–38 Belinostat was relatively toxic in vitro, but KX2-391 increased IFN-induced gene expression without significant toxicity. In this regard, it has been reported that Src kinase inhibits TLR signaling.
39
IFN has been reported to enhance the cytotoxicity of compounds that affect other signaling pathways.
40
In our study, compound
Thus, the assay successfully identified agents that enhance ISRE activation and the expression of IFN-induced genes. Several of the scaffolds identified do not yet have a known cellular target, which is a limitation of the cell-based approach. Two of the chemical groups (groups II and IV) increased the IFN gene transcription profile, prolonged IFN activation of STAT1, and were also good co-adjuvants in a murine immunization model. Several of the other scaffolds (groups I, III, V, and VII) were demonstrated to be effective co-adjuvants, suggesting that the cell-based assay detected agents with multiple regulatory mechanisms.
The key supporting evidence for this HTS in selecting potential co-adjuvants was the final assessment by co-immunization with an antigen and LPS in an in vivo test model. A single in vitro assay cannot replicate the complex system of multiple cell interactions and physical relocation that an APC must undergo to initiate an effective and lasting immune response. Not surprisingly, in a complex biological system the 16 h relative ratio values in the FRET assay did not always directly correlate with the immunoglobulin levels measured after co-immunization. Further work to identify the targets and the cellular mechanisms is warranted and ongoing. In summary, we discovered multiple chemical scaffolds that resulted in prolonged ISRE activation in conjunction with IFN-α stimulation.
Supplemental Material
Supplemental_Material_for_ID_of_Compounds_that_Prolong_Type_I_Interferon_Signaling_by_Corr_et_al – Supplemental material for Identification of Compounds That Prolong Type I Interferon Signaling as Potential Vaccine Adjuvants
Supplemental material, Supplemental_Material_for_ID_of_Compounds_that_Prolong_Type_I_Interferon_Signaling_by_Corr_et_al for Identification of Compounds That Prolong Type I Interferon Signaling as Potential Vaccine Adjuvants by Nikunj M. Shukla, Kei-Ichiro Arimoto, Shiyin Yao, Jun-Bao Fan, Yue Zhang, Fumi Sato-Kaneko, Fitzgerald S. Lao, Tadashi Hosoya, Karen Messer, Minya Pu, Howard B. Cottam, Dennis A. Carson, Tomoko Hayashi, Dong-Er Zhang and Maripat Corr in SLAS Discovery
Footnotes
Acknowledgements
We are grateful to Drs. Michael Harvey, David Piper, and Chetana Revankar and their teams at the Life Technologies Corporation for performing the cell generation and feasibility studies; assay optimization; and pilot, main, and confirmation screens at their facilities.
Supplementary material is available online with this article.
Author Contributions
The manuscript was written through contributions by all the authors. All authors approved the final version of the manuscript. K.M. and M.P. performed statistical analysis of the HTS data. N.M.S. and H.B.C. performed chemotype clustering analysis, compound selection, and purity analysis of the purchased compounds. K.I.A., S.Y., J.B.F., F.S.K., F.S.L., T.H., D.E.Z., Y.Z., and M.C. performed biological assays. N.M.S., K.M., H.B.C., D.A.C., T.H., D.E.Z., and M.C. wrote the manuscript. N.M.S. and K.I.A. contributed equally to this manuscript.
Declaration of Conflicting Interests
The authors declared no potential conflicts of interest with respect to the research, authorship, and/or publication of this article.
Funding
The authors disclosed receipt of the following financial support for the research, authorship, and/or publication of this article: We acknowledge the NIH Adjuvant Discovery Program for funding (HHSN272200900034C and HHSN272201400051C, D. A. Carson). The funders had no role in study design, data collection and interpretation, or the decision to submit the work for publication.
References
Supplementary Material
Please find the following supplemental material available below.
For Open Access articles published under a Creative Commons License, all supplemental material carries the same license as the article it is associated with.
For non-Open Access articles published, all supplemental material carries a non-exclusive license, and permission requests for re-use of supplemental material or any part of supplemental material shall be sent directly to the copyright owner as specified in the copyright notice associated with the article.