
Abstract
Rapid mixing in microplates is still an underappreciated challenge in screening assay development, particularly with the use of noncontact nanoliter liquid handlers. In high-content/throughput screening (HC/TS), fast and efficient mixing between compounds and cell culture medium is even more critical as biological kinetics dictates speed of mixing, usually within a few minutes. Moreover, mixing in HC/TS should be gentle enough to avoid any negative disruption in cell layer. Here the authors introduce a method to accurately quantify drop diffusion into a microplate well, independently of buffer, liquid handler, or dispensing protocol. This method was used to determine the effect of various mixing methods on the diffusion of a nanoliter drop of pure DMSO in aqueous buffer in 384-well plates. Rapid plate shaking and additional buffer addition were shown to be the most efficient and effective mixing methods for HC/TS. However, efficient mixing by plate shaking is limited by assay volume. Bulk addition shows fast and efficient mixing, without negative effects on cells. Moreover, this simple, fast, and inexpensive method can be easily adapted on any platform.
Keywords
Introduction
W
With stock solutions in 100% DMSO and a final assay concentration less than 1%, screened compounds have to be diluted at least 100-fold in assay plates. These plates can be filled with various aqueous buffers such as cell culture medium for cell-based assays. Solubility of screened compounds in aqueous buffer is a critical issue as it has been shown that up to 40% of compounds in a screening library may possess poor aqueous solubility. 3 This can lead to compound precipitation, which can either have a negative effect on the number of hits identified during a screening campaign or result in an underestimation of the potency of a hit compound. Indeed, the actual compound concentration in solution could be far lower than the expected concentration. 4
With the miniaturization of microwell plate formats (i.e., 384- and 1536-well plates), the volume required to obtain at least a 100-fold dilution is out of range of most of classical tip-based liquid handlers (microliter range). A traditional approach is to predilute stock solution in aqueous buffer (“daughter plates”) followed by the transfer of the prediluted compounds to assay plates (2-step dilution). The volumes used for each dilution step (between 1 and 10 µL) fit within most liquid handler dispensing specifications. However, this 2-step approach increases the risk of compound precipitation compared to a direct 100-fold dilution into assay plates. 4 Recently, several new nanoliter dispensing technologies have been released onto the market, including pin tools and pressurized liquid delivery using valves, capillary-based, or acoustic-based dispensing tools. These dispensers deliver volumes in the range of a few nanoliters to 1 µL, which fit with a 1-step dilution method for both 384- and 1536-well assay plates. Whatever the technology is, noncontact (i.e., the dispensing device does not touch the liquid present in the assay plate) or contact (e.g., pin tools), they share the same issue, which is the inability to mix the dispensed compounds with the assay buffer. The traditional aspiration/dispensing mixing method works well with cell-based assays as it does not disrupt the cell layer. However, this method requires the use of tips for an aspiration/dispensing cycle to produce a fast and gentle mixing. In the case of nanoliter dispensing, the inability to mix using aspiration/dispense cycling means that there is a lack of validated rapid mixing methods. The lack of such methods is an unsolved and underestimated issue, particularly with cell-based and high-content screening (HCS) assays. 5
HCS assays are complex assays developed to measure more than a single parameter in the screening well (e.g., compound activity and cytotoxicity) or to measure the complex cellular effects due to the action of a given compound. HCS is rapidly becoming more commonplace; in 2006, almost 50% of the screening labs worldwide were using this technology in comparison to 2004, when the percentage was less than 25%. 6 This progression will continue downstream as HCS becomes one of the main technologies for secondary assays. 6 HCS uses cell-based assays and typically automated microscopy, including automated confocal microscopy, as the readout. Compound mixing in HCS is more difficult to achieve compared with in vitro assays. Mixing should not detach or harm the cells already seeded on the assay plates. For HCS, microscopy images often represent a very small part of the well. For example, 1 picture represents only 1/70th of a 384-well when a 20× water objective from an Opera™ confocal microscope (PerkinElmer, Hamburg, Germany) is used. To obtain the images with the greatest contrast, it is usually recommended to capture images from the center of the well. Compounds are also usually dispensed in this area, which can lead to cell detachment or cell shape modification. In addition, a relatively rapid homogenization of the compound is essential to be in line with the kinetics of the corresponding biological assay. It is not uncommon for a cell-based assay to require an in-line process with adequate mixing in under a minute.
One of the main issues in studying mixing methods in microwell plates is the lack of accurate methods to determine the kinetics of homogenization. In this study, we developed a new method to accurately measure the kinetics of diffusion after compound addition by taking advantage of automated confocal microscopy. We then used this method to determine the kinetics of diffusion after noncontact dispensing of a small volume of compound dissolved in 100% DMSO into aqueous assay buffer. Various mixing methods suitable for HCS were studied. We report herein that the sequential addition of a small volume of aqueous buffer is the most efficient method to gently produce a homogeneous mixture without harmful effects on the cell layer, even for poorly adherent cell lines such as HEK293. This simple, rapid, and inexpensive method can be easily adapted to virtually any kind of automated platform and is suitable for HCS.
Materials and Methods
Materials
Brilliant Blue R250, fluorescein, sodium bicarbonate, and DMSO were purchased from Sigma-Aldrich (St. Louis, MO). Sodium bicarbonate was dissolved in water at a concentration of 50 mM and is subsequently referred to as assay buffer. Brilliant Blue R250 was dissolved in either 100% DMSO or water at a concentration of 10 mg/mL. Fluorescein was also dissolved in DMSO or aqueous buffer at a concentration of 8 µM or 80 µM according to the dilution ratio studied. All solutions were stored at room temperature until use. Clear-bottom microplates were obtained from Greiner bio-one (Frickenhausen, Germany).
Devices
PreSys device (Genomics Solution, Ann Arbor, MI) was used to dispense DMSO or aqueous drops in each experiment because of its versatility in both aliquoting speed and volume. The PreSys uses SynQuad™ technology for dispensing based on individual syringes prepressurizing the liquid to be dispensed. A microvalve accurately distributes the desired volume. Accuracy and reproducibility were tested by dispensing with both aqueous buffer and DMSO. An average accuracy of −15% was measured for most of the buffers and volumes tested in this study (i.e., volumes dispensed by the PreSys were 15% lower than by manual dispense; data not shown). Confocal pictures were taken with the automated confocal microscope Opera™ (PerkinElmer). A 488-nm laser was used for fluorescein excitation and a 535/50-nm filter for emission. Two pictures of each well center were captured at a height of 5 µm using a 20× air lens, NA = 0.40. The average fluorescence intensity of the Opera™ pictures was quantified with Acapella Software (PerkinElmer). Plate shaker (thermomixer comfort) and centrifuge (5810R) were from Eppendorf (Hamburg, Germany).
Measurement of homogenization by numeric camera
Five hundred nanoliters of Brilliant Blue dissolved in either DMSO or water at a concentration of 10 mg/mL was dispensed in clear 384-well plates (Corning Corporation, New York, NY) prefilled with 50 µL of water. Pictures were taken at the indicated times using a consumer digital camera. Fluorescence intensity was quantified with Image J software (http://rsb.info.nih.gov/ij) from the top to the bottom of the well following a vertical line to obtain intensity profiling. A complete diffusion was characterized by a plateau in intensity along the line corresponding to a similar dye concentration from top to bottom.
Determination of homogenization kinetics by confocal microscopy
Fluorescein, dissolved in either 100% DMSO or water, was primed with the PreSys, and aliquots were dispensed into 384-well black clear-bottom plates (referred to as assay plates) prefilled with assay buffer. This buffer was used to enhance the fluorescence intensity produced by the dye. Fluorescein alone has almost no fluorescence in 100% DMSO and is poorly fluorescent in water or phosphate-buffered saline (PBS). The following 2 dilution schemes were evaluated: (1) 100-fold dilution: 1 µL or 500 nL of 8 µM fluorescein added to 100 µL or 50 µL of assay buffer and (2) 1000-fold dilution: 100 nL or 50 nL of 80 µM fluorescein added to 100 µL or 50 µL of assay buffer. Immediately after dye addition, assay plates were carefully and manually transferred to the Opera™ (
For each experiment, a manual mixing reference was used as a standard for complete homogenization. Briefly, identical stock fluorescein solutions were diluted with the same dilution ratio in 50-mL tubes (Falcon, Lincoln Park, NJ). A large volume was used to reduce pipetting errors. The resulting mixture was homogenized by strong vortexing. An identical volume of the final volume (50 or 100 µL) was then added to the assay plates and images obtained with the Opera™ as described above. Each kinetic data point was reproduced at least 24 times on the same day using 24 independent wells and repeated on a second day (n = 48).
Data normalization
For each experimental data point, average fluorescence intensities determined after image analysis were then normalized according to the PreSys dispensing accuracy (values reduced by 15% on average) to compare these values with the manual reference. A diffusion percentage was then calculated using the manual reference values according to the following equation:

where Ix is the intensity measured in the sample at time x, I0 is the intensity measured immediately after drop dispensing, and Iref is the intensity obtained with the manual reference (100% diffusion). Percentage of homogenization was calculated using both fluorescence intensities obtained with manual reference and with fluorescein at the initial concentration of the drop (see text). For kinetics studies, diffusion curves were generated by fitting data to a 1-phase exponential decay equation with Prism (GraphPad Software, San Diego, CA). Calculated rate constants were used to compare diffusion efficacies.
Homogenization by plate centrifugation
Immediately after dye addition, assay plates were sealed with film (Axygen, Union City, CA) and centrifuged at 1200 rpm for either 30 s or 10 min. Pictures were recorded before and after centrifugation and diffusion quantified as described previously.
Homogenization by plate shaking
Immediately after drop dispensing, assay plates were sealed with film and loaded onto a plate shaker. Plates were shaken at 600 rpm or 1200 rpm for either 30 s or 10 min. Pictures were recorded before and after shaking and diffusion quantified as described previously.
Homogenization by bulk dispensing
Either 500 nL or 1 µL of fluorescein dissolved in 100% DMSO was dispensed with the PreSys into assay plates prefilled with either 80% or 50% of the final volume (50 or 100 µL). A second aliquot of assay buffer, representing respectively 20% or 50% of the final volume, was immediately added with the PreSys (50 µL/s) in each well. Pictures were recorded before and at different times after bulk addition and diffusion quantified as described previously.
Cell culture
HEK293 cells expressing a green fluorescent protein (GFP)–labeled protein were cultivated in Dulbecco’s modified Eagle’s medium (DMEM) nutrient mixture F-12 supplemented with 10% fetal bovine serum (FBS), 1% penicillin streptomycin, and 200 µg/mL of geneticin. Hela cells expressing a GFP-labeled protein were cultivated in DMEM with 10% FBS, 1% penicillin streptomycin, and 200 µg/mL geneticin.
Cell layer control after dispensing
HEK293 cells and Hela cells expressing a GFP-labeled protein were used to measure the effect of DMSO, shaking, or buffer addition on cell viability and adherence. Briefly, HEK293 cells (15,000 cells/well) were grown in 384-well assay microplates coated with 1% fibronectin at 37°C in 5% CO2, 95% humidity atmosphere for 2 days. Hela cells (12,000 cells/well) were grown in 384-well assay microplates at 37°C in a 5% CO2, 95% humidity atmosphere for a day. DMSO (0.5 µL) was dispensed with PreSys as described above with or without a second aliquot of medium, and images were captured with the Opera™ before DMSO addition, immediately after DMSO addition, or 1 h after incubation at 37°C. For shaking effect determination, plates were shaken at 1200 rpm for 10 min. Cell adherence and viability was estimated by visual inspection from the images.
Results and Discussion
Using a high-speed camera, Dreesen and Graber 7 observed in 2004 that a nanoliter drop of DMSO/H2O (90/10 v/v) dispensed into a 1536-well plate containing 7 µL of aqueous buffer immediately falls to the bottom of the well. Drop diffusion, after addition, was almost nonexistent. In most HCS assays, 384-well plates are used with ~50 to 100 µL of cell culture medium to provide enough liquid to feed and protect the cells during assay incubation. To determine whether a similar lack of diffusion occurs in 384-well format plates, which contain a much larger volume, a drop (0.5 µL) of DMSO containing Brilliant Blue was added to a well containing 50 µL of water to simulate a 100-fold, 1-step dilution of screened compounds. Every aliquot performed in this study was done using a PreSys device. This dispenser was chosen for its range of dispensing volumes as well as its ability to accurately dispense at different speeds. Figure 1A shows that a DMSO drop falls quickly to the bottom of the well and that its complete diffusion requires more than 2 h. Quantification of the dye intensity confirmed this lack of homogeneity by determining that higher fluorescence intensity can be measured at the bottom of the well from 10 s to 60 min after dispensing the drop. Complete diffusion is characterized by a plateau in intensity, which was obtained between 60 and 150 min. By comparison, a similar addition of dye dissolved in water presented a faster diffusion rate (plateau reached between 30 and 60 min) even if it was not as immediate as may have been expected ( Fig. 1B ). These results confirm Dressen et al.’s observation that what occurs in 1536-well plates is also occurring in 384-well plates. This is consistent with the observations of Walling et al., 8 who also described a lack of homogenization when 10 µL of DMSO was added to 40 µL of aqueous buffer in 384-well plates. For cell-based assays, the low diffusion rate is a cause for concern, and a high local concentration of DMSO for up to an hour may have an adverse effect on cell health. To determine the effect of this low diffusion rate on cells, 500 nL of pure DMSO was dispensed into a well containing HEK293 cells in 50 µL of cell culture medium to mimic a 100-fold, 1-step dilution. HEK293 cells were modified to express a membrane protein fused with GFP to be able to easily visualize the cells before ( Fig. 1C ) and 1 h after DMSO addition ( Fig. 1D ). Figure 1C shows healthy adherent HEK293 cells as expected when plates were coated with fibronectin. In contrast, as observed in Figure 1D , cells started to detach 1 h after DMSO addition despite the wells being coated with fibronectin. Cell detachment was not related to the dispensing step as cells were not detaching or rounding up immediately after DMSO addition (not shown). As predicted, without proper and fast mixing, any particular compound dissolved in pure DMSO may (1) be toxic for the cells because of a high local DMSO concentration and (2) create an effect simply due to a very high local drug concentration. The resulting images would not be capturing the true compound effect. False-negative (due to toxicity) and false-positive (due to high compound concentration) rates may be dramatically increased, and dose-response curves may also be affected. A fast mixing method suitable for HCS is a prerequisite for using single-step compound dilution.
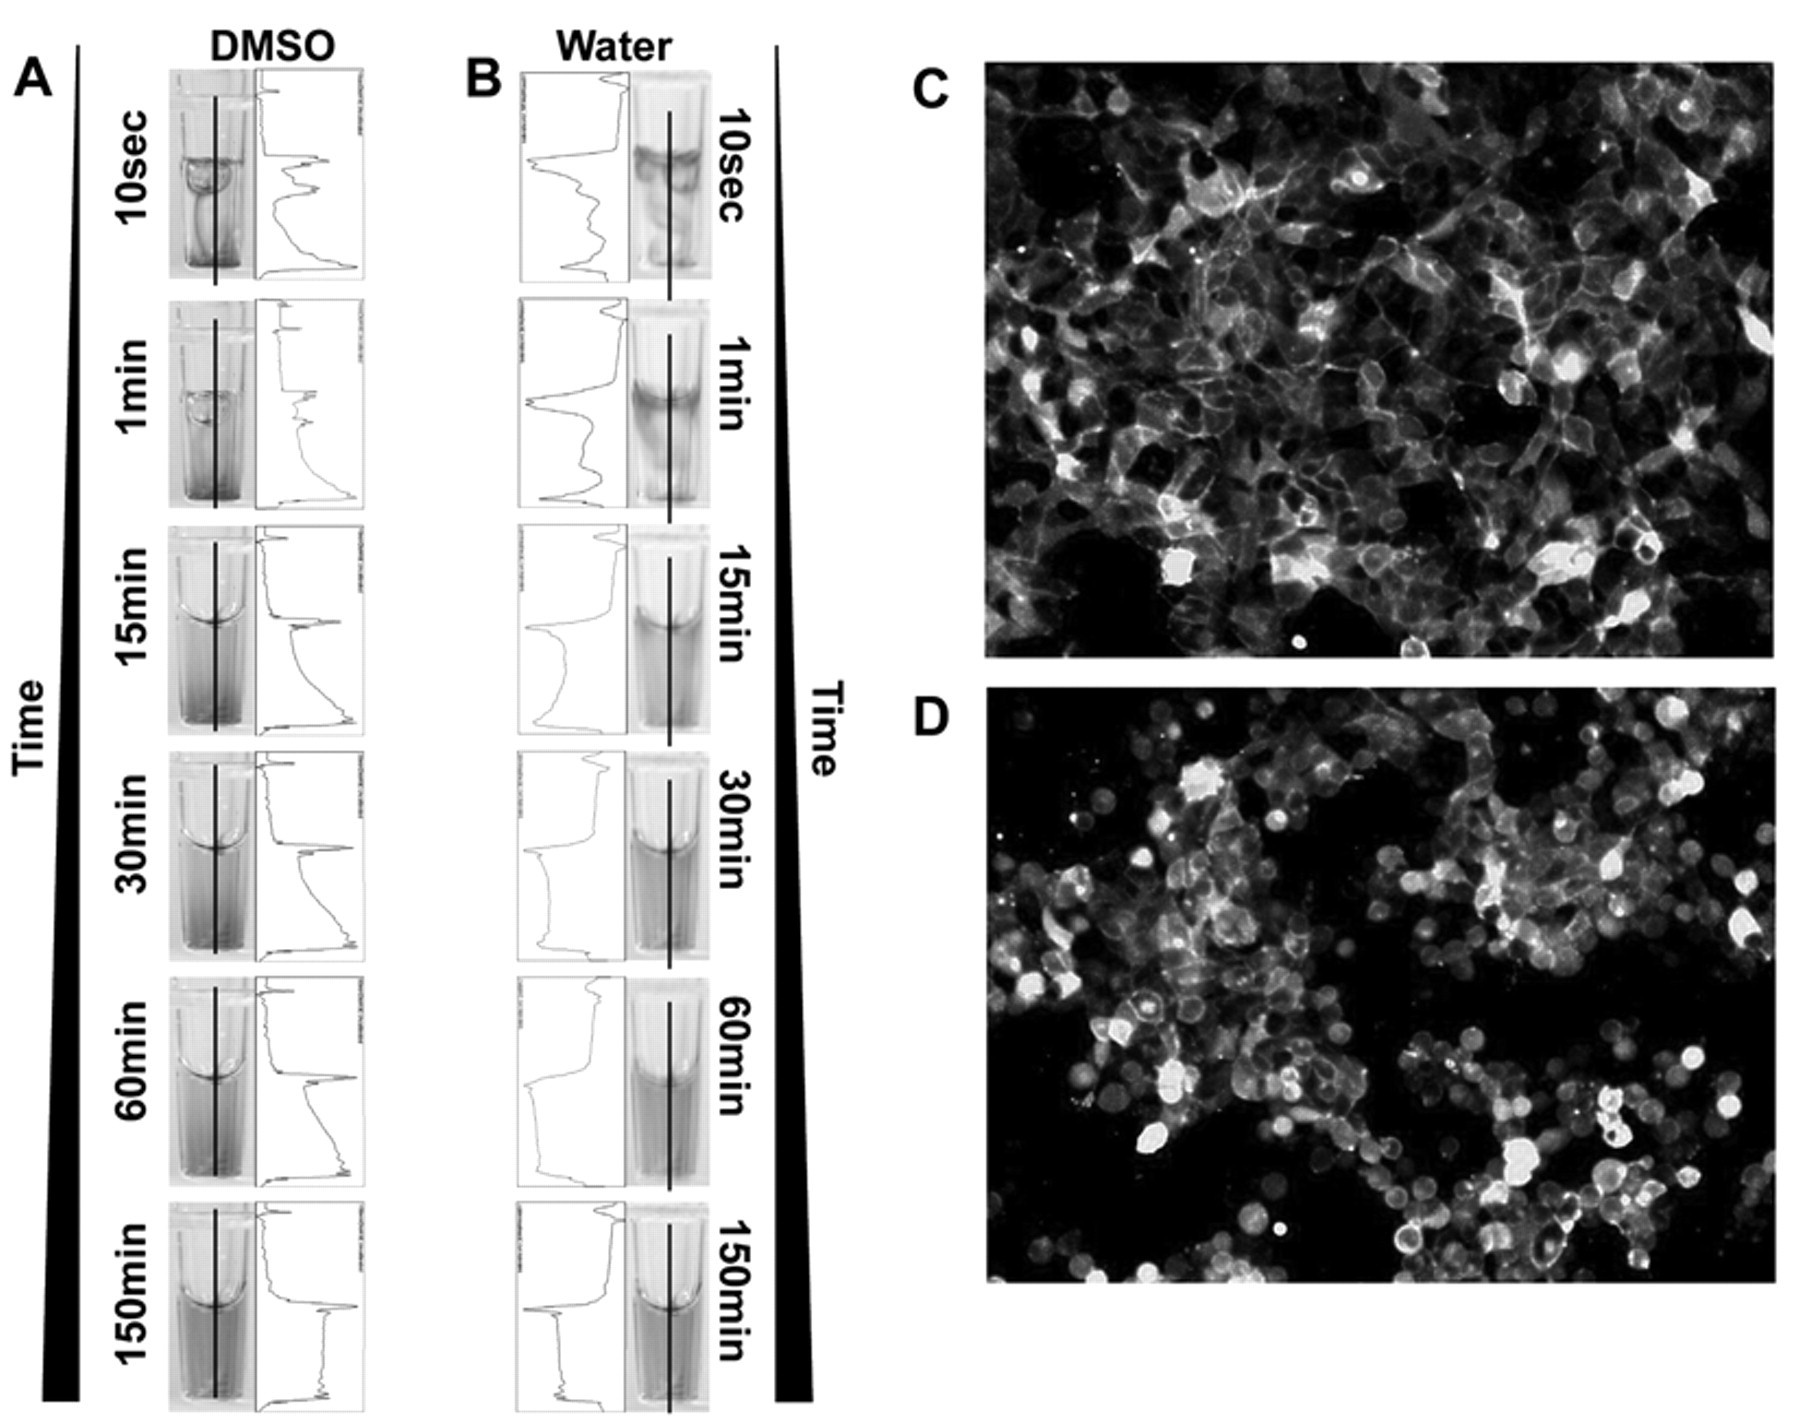
Effect of DMSO drop dispensing. Five hundred nanoliters of (
Several methods for studying mixing in microplates have been described using high-speed imaging
7
or disturbance of well-bottom-layered fluorescent dye using different densities of buffers
8
or different pH.
5
Most of these methods are limited in their ability to mimic screening conditions (same plate, same volume, similar dispensing protocol, or liquid handler) and are not amenable to full kinetic studies. Fast imaging also requires modification of clear plates to record pictures, and quantification of homogenization remains highly variable and dependant on picture quality. The dispensing step also influences the overall homogenization kinetics as the compound drop is likely broken or modified by its contact with the surface of the aqueous buffer (
Fig. 1A
,
B
). Accordingly, a proper homogenization quantification method should be able to easily measure homogenization when compounds are dispensed, which is not the case with methods using various density or pH buffers. To overcome these issues, we designed an innovative method taking advantage of automated confocal microscopy. DMSO nanovolumes containing fluorescein are dispensing with a PreSys in plates prefilled with aqueous assay buffer to mimic plates containing cells and cell culture buffer (
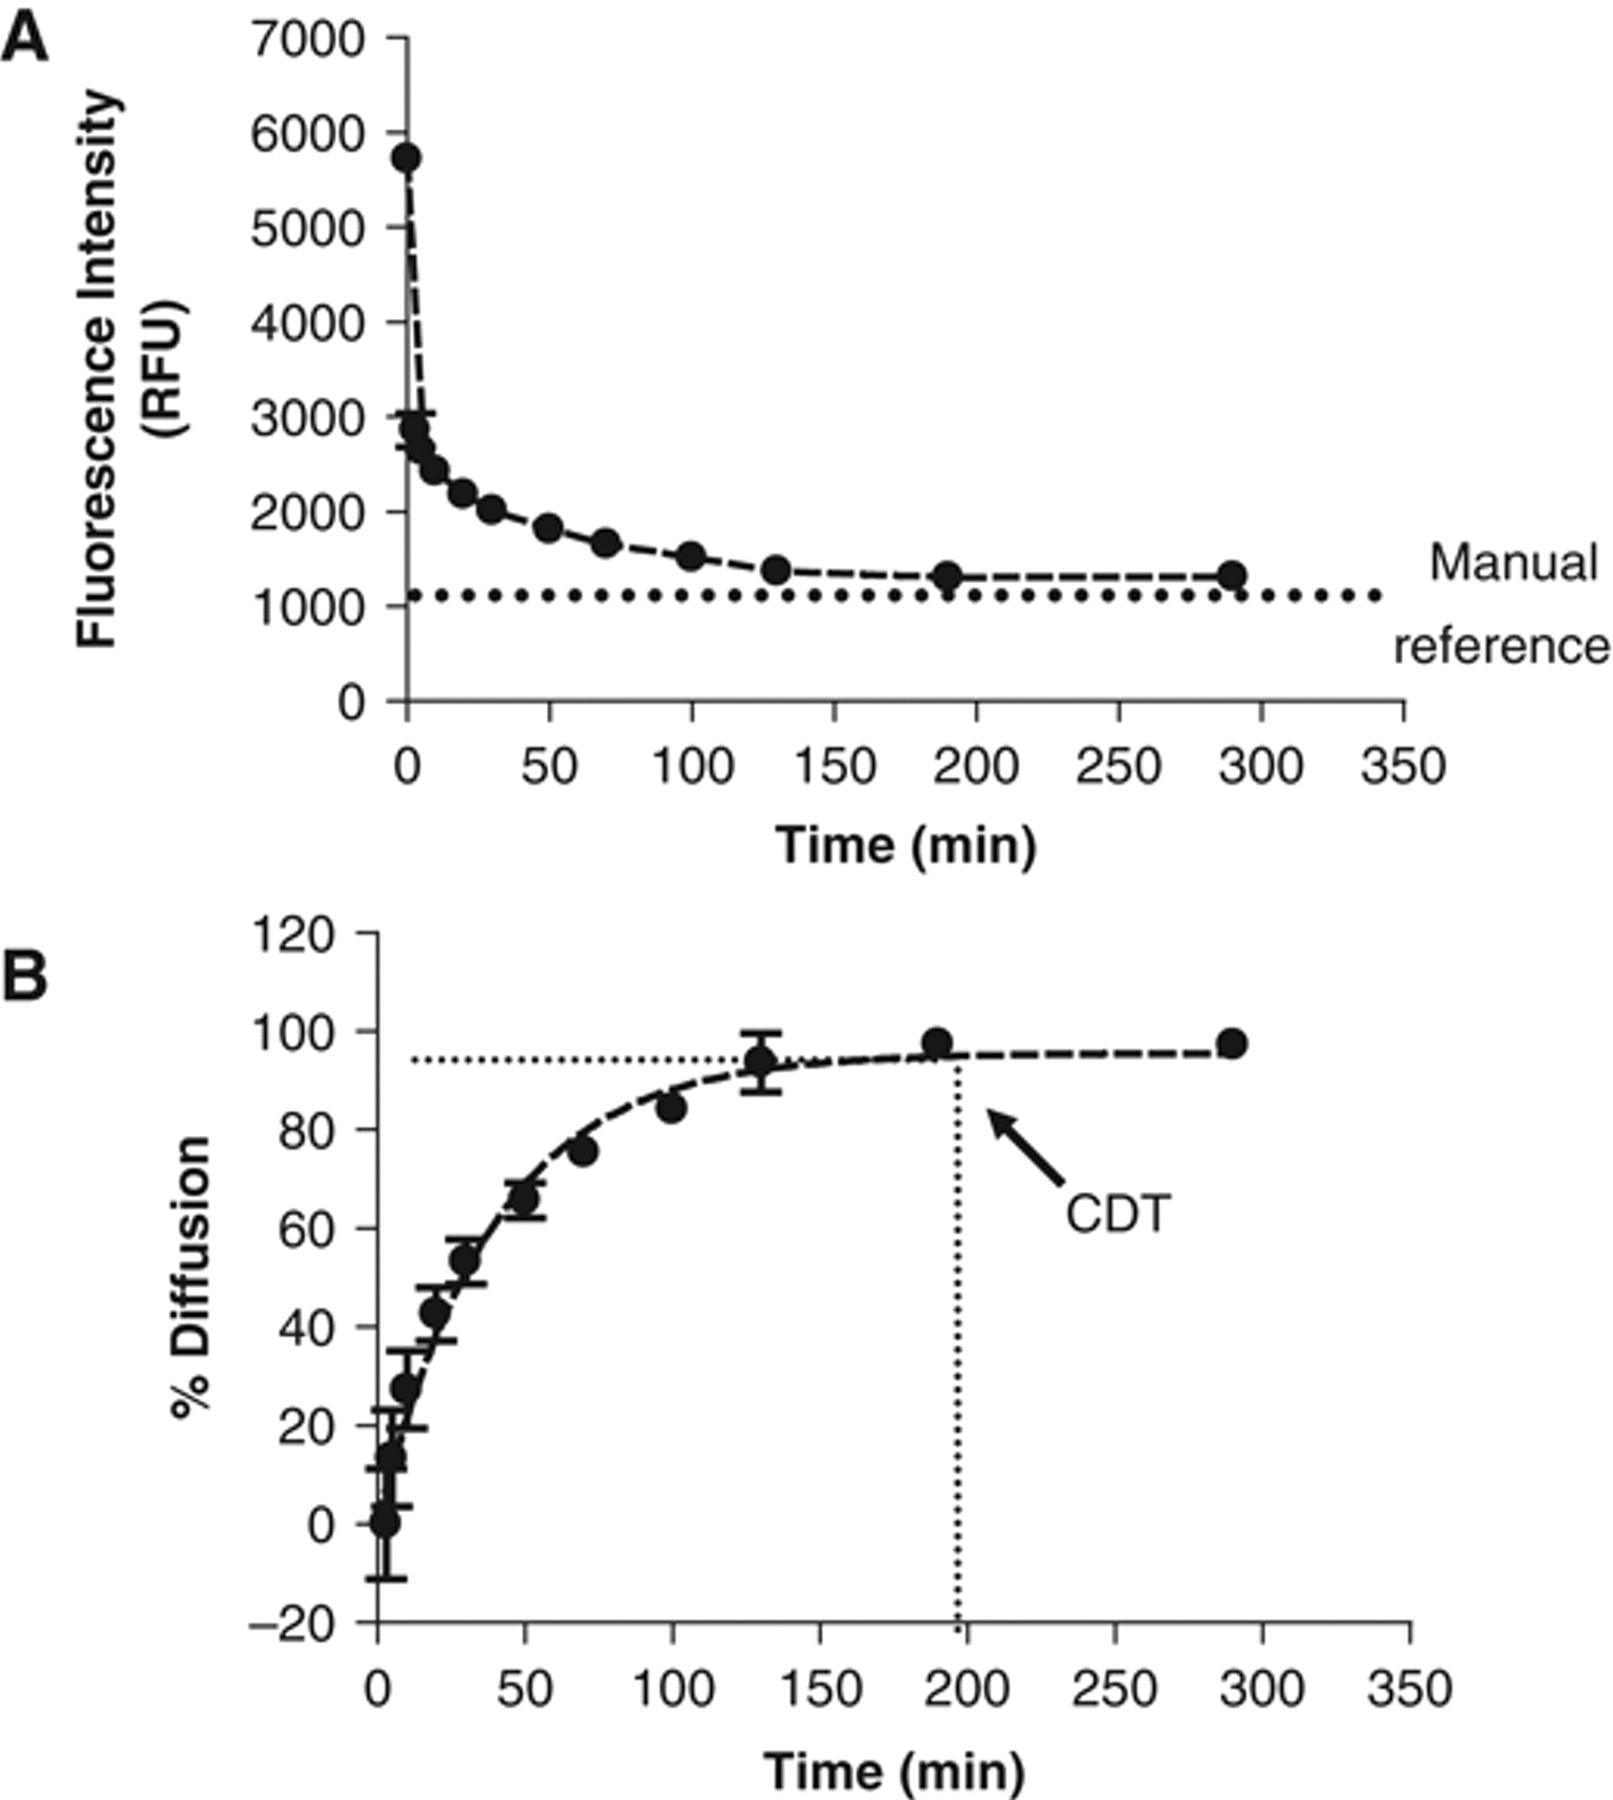
To validate this approach, the diffusion kinetics of a 100-fold, 1-step dilution of fluorescein dissolved in 100% DMSO was performed (500 nL added to 50 µL; Fig. 2A ). As predicted, fluorescence intensity values were high immediately after dispensing the compound and decreased over time according to an inverse exponential curve. Time = 0 represents the fluorescence intensity obtained with a fluorescein concentration equal to the concentration in the drop added (no dilution). The diffusion percentage was then calculated using both this initial intensity value and the manual reference homogenization sample value ( Fig. 2B ). Immediately after drop addition, the concentration of the DMSO-fluorescein mixture was already diluted approximately twice (50% of homogenization), which is consistent with the image obtained after 10 s. This partial homogenization is likely due to the merging of the DMSO drop at the medium surface. This result confirms the importance of considering drop addition in the overall process of diffusion.
Confocal-based method of drop diffusion quantification. (
Complete diffusion time (CDT) was determined as the time when the diffusion percentage reached 100% relative to the manual mixing reference. It was also observed that complete diffusion occurred at the point where the fluorescence intensity curves began to plateau. The inverse exponential shape of the curves is consistent with the Fick laws on liquid diffusion. 9 Similar curves were obtained by Mitre et al., 5 although a different method for diffusion quantification was used. Interestingly, the coefficient of variation (CV) for each of the kinetic points decreased over time (as diffusion increased), dropping from 5%-6% to 1%. This effect was used to confirm the CDT and may be explained by variability in the location of drop dispensing from well to well (i.e., the drop may not always land in the center of the well). The Opera™, on the other hand, took pictures at the same location in each of the wells. When the dye was not homogenized, its concentration was dependent on the initial position of the drop in the bottom of the well. However, when diffusion was complete, a similar dye concentration was measured at all locations in the well.
Table 1 lists the CDT obtained with 1-step dilution schemes of 100-fold and 1000-fold in either 50 µL or 100 µL of assay buffer. One hundred and thirty minutes were necessary to achieve diffusion of 0.5 µL of DMSO in 50 µL (100-fold dilution), which is consistent with Figure 1B and consequently validated our quantification method. Diffusion occurred twice as fast when a dilution of 1000-fold was used (60 min). Surprisingly, diffusion was much slower when 100 µL was used instead of 50 µL. Diffusion of 1 µL in 100 µL took more than 4 h, which is impractical for most biological processes assayed in HTS and HCS. Again, diffusion was faster when a 1000-fold dilution ratio was used. The first Fick law dictates that the diffusion rate is proportional to the concentration gradient. 9 With a 1/1000 ratio, the dye concentration in the dispensed drop as well as the concentration gradient was 10-fold higher than with a 1/100 ratio. This concentration gradient resulted in a 2 times faster rate of diffusion. However, despite a 2-fold increase, the diffusion speed for a high concentration drop was not fast enough to be consistent with most biological assay kinetics.
Complete Diffusion Times for DMSO and Water Dispensing
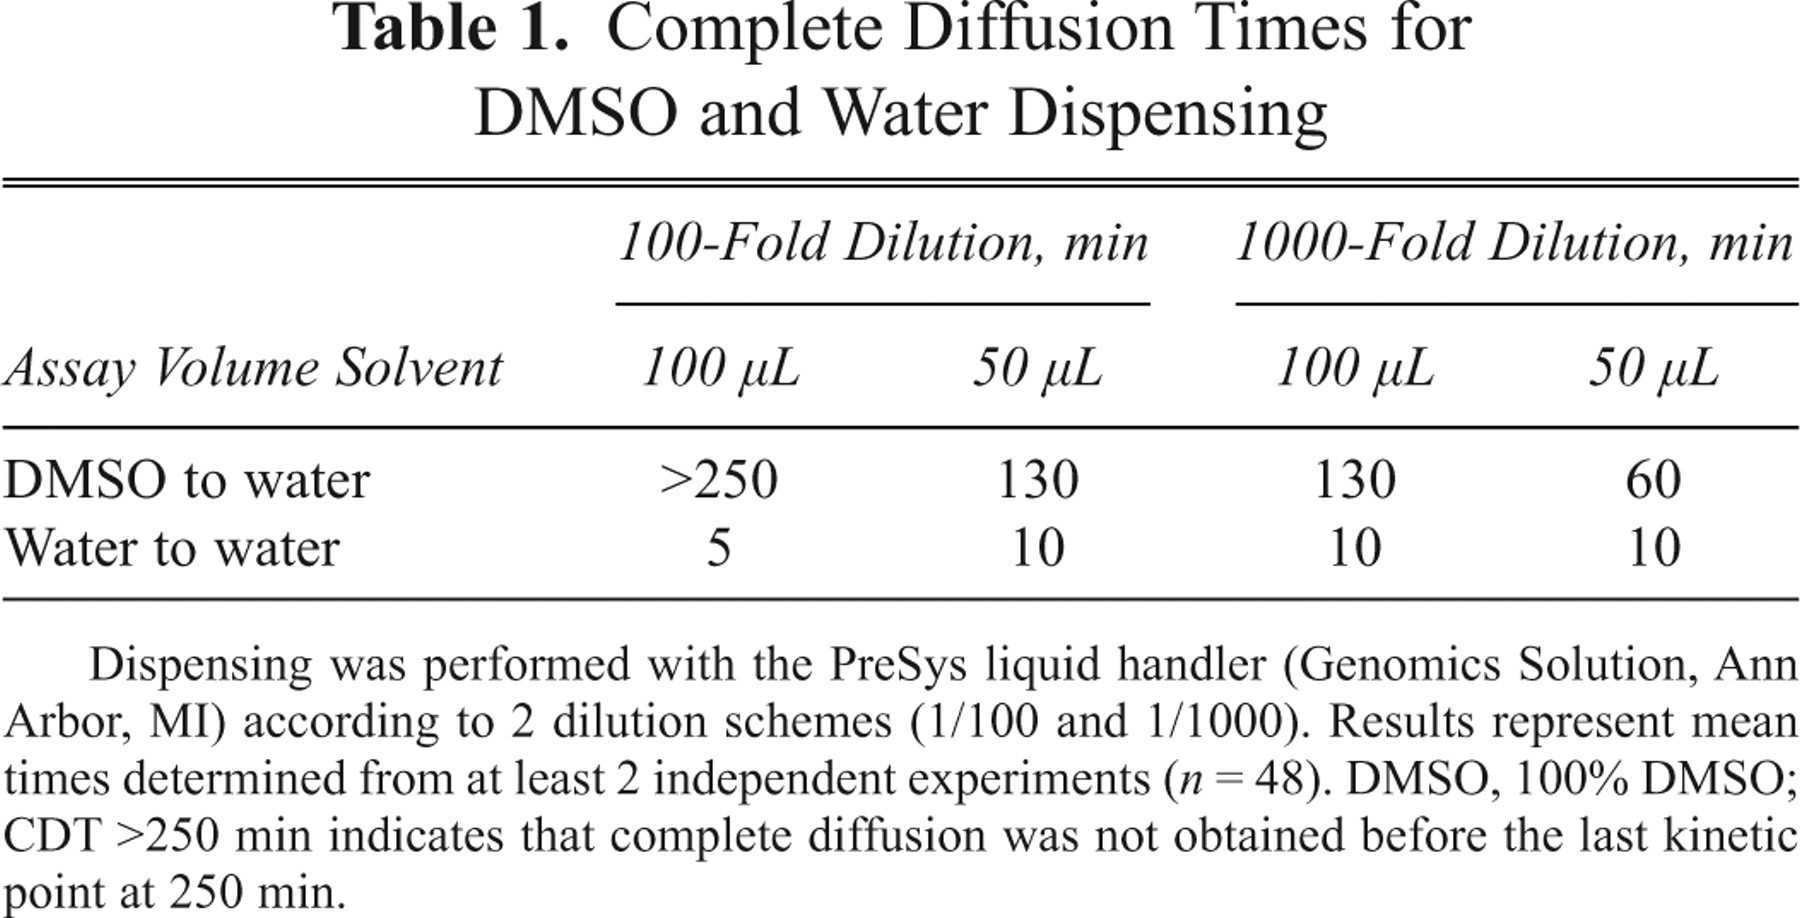
Dispensing was performed with the PreSys liquid handler (Genomics Solution, Ann Arbor, MI) according to 2 dilution schemes (1/100 and 1/1000). Results represent mean times determined from at least 2 independent experiments (n = 48). DMSO, 100% DMSO; CDT >250 min indicates that complete diffusion was not obtained before the last kinetic point at 250 min.
Use of a 1-step dilution of stock compound in 100% DMSO required the identification of a fast mixing method suitable for high throughput, automation, adherent cell types, and confocal microscopy. We studied mixing methods (dispensing speed, centrifugation, shaking and bulk addition) suitable for HCS that could be easily adapted during screening development. We excluded sonication—routinely used for compound dissolution and mixing, 10 as well as turbo, 5 magnetic, or acoustic mixing methods, because the damaging effects on cells could not be controlled. Acoustic mixing also requires specific equipment that is not standard on many HCS platforms. Pipetting and stirring were not evaluated as the focus was on noncontact approaches to compound addition.
For the following experiments, a dilution ratio of 100-fold of stock compound in 100% DMSO into either 50 µL or 100 µL total volume (1% final DMSO concentration) was used; this represents commonly used screening conditions. To better focus on the in-well diffusion, we decided to consider as a starting point of the diffusion kinetics the first measurement obtained after drop addition before any mixing, considered by definition as the no-diffusion state (0% of diffusion).
Dispensing speed
It was first determined if the dispensing speed could increase the rate of compound diffusion as contact of the DMSO drop with medium surface partially achieved mixing. Dispensing speeds from 1 to 200 µL/s were tested without any obvious effect on the diffusion rate irrespective of the final volume ( Fig. 3 ). In addition, no differences were seen in the initial percentage of mixing due to drop addition (not shown). Because of DMSO viscosity, a typical speed for dispensing compounds is 1 µL/s. Faster dispensing speeds helped the drop to fall to the bottom of the well instead of increasing diffusion of the drop at the assay buffer surface, as was expected.
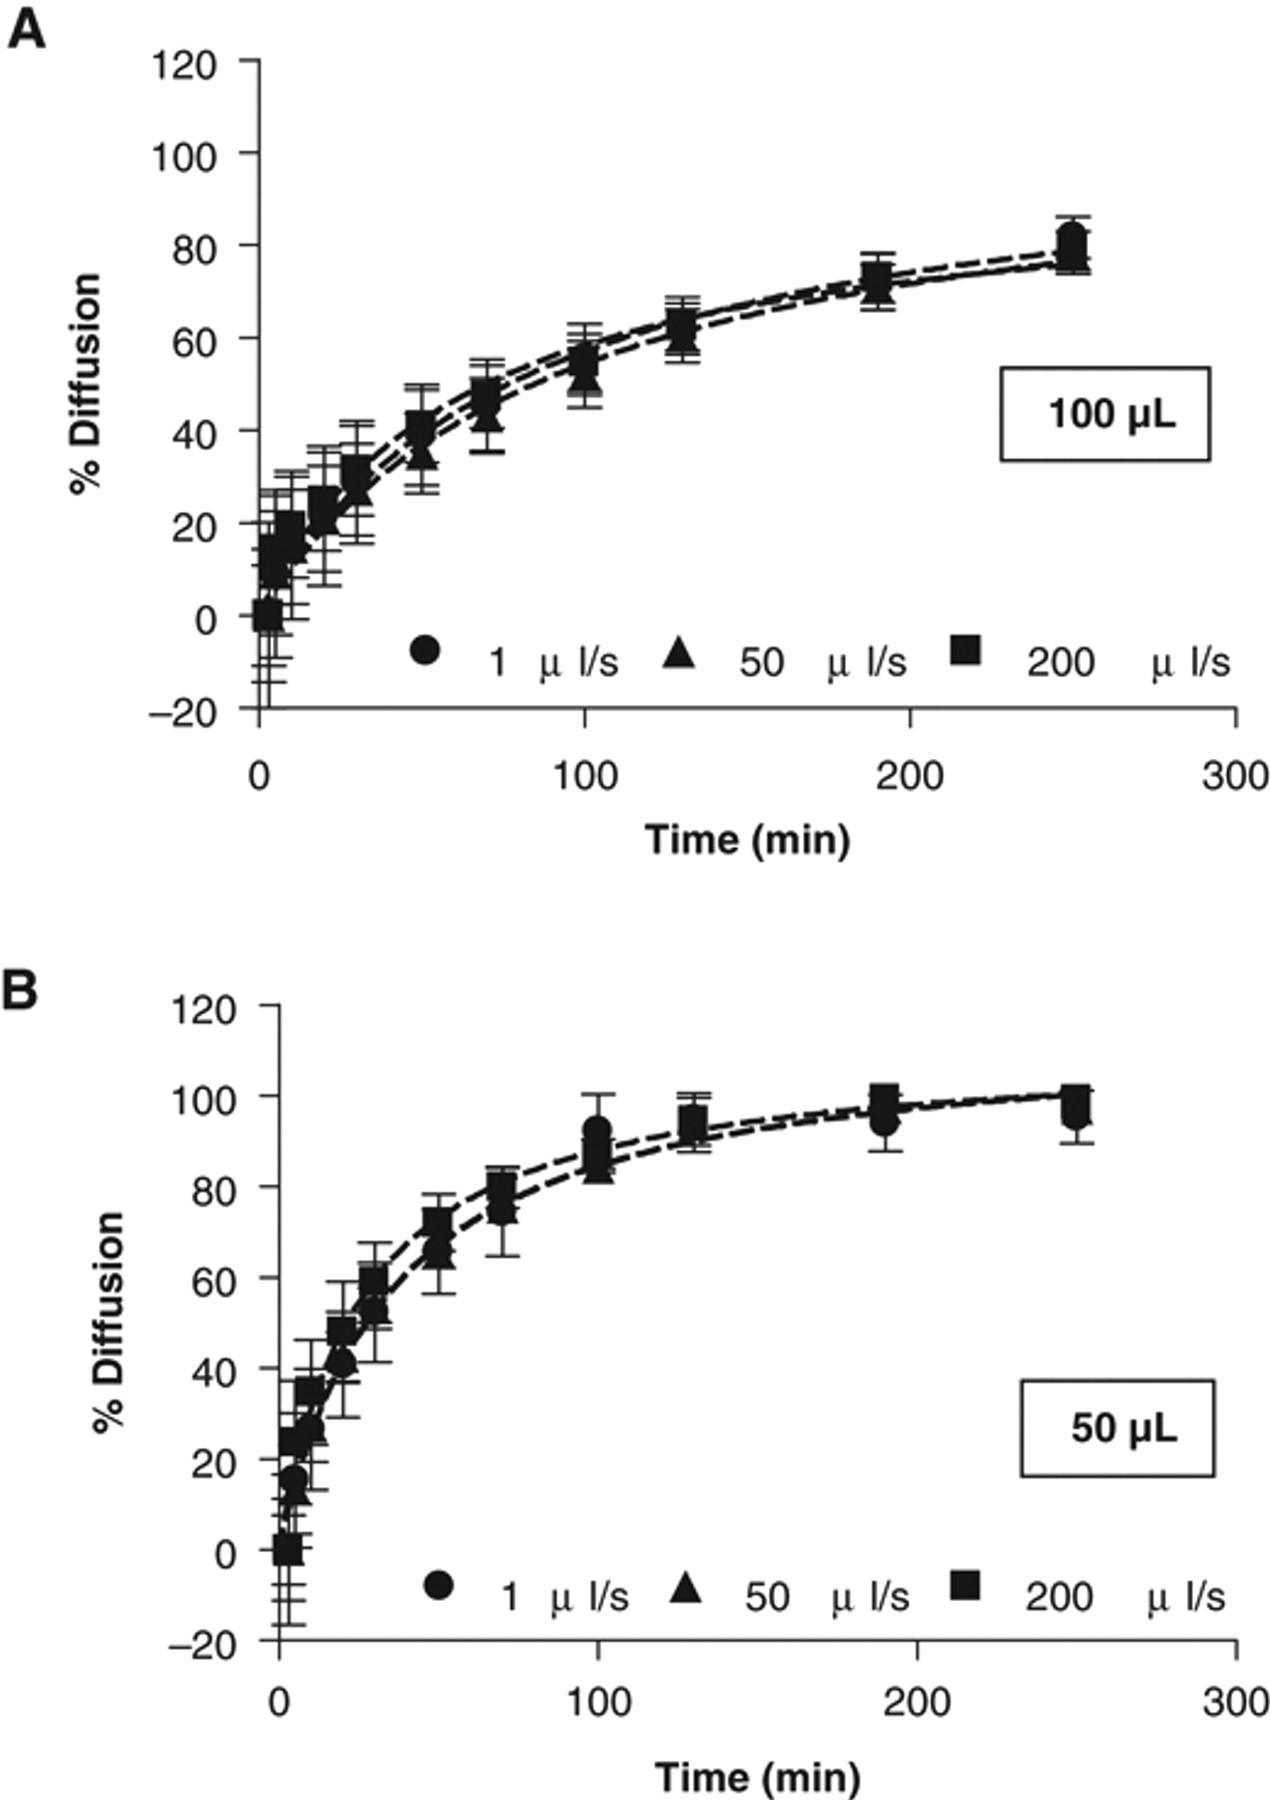
Effect of dispensing speed on homogenization. (
Plate centrifugation
To identify a mixing method able to quickly and completely mix DMSO in aqueous buffer, we determined the rate of diffusion immediately after mixing. In considering its application in screening, an appropriate mixing method should achieve 100% of diffusion without any additional incubation steps.
A short centrifugation at 1200 rpm did not show improved DMSO diffusion, irrespective of the volume tested ( Fig. 4 ; 10% to 20% of diffusion after 320 s). Approximately 40% diffusion was observed in 50 µL when the centrifugation time was increased to 10 min, whereas no increase in diffusion was obtained when 100 µL was used as compared with the short centrifugation time. An average diffusion percentage of 40% was not considered sufficient to be a method of choice for compound homogenization in HTS or HCS.
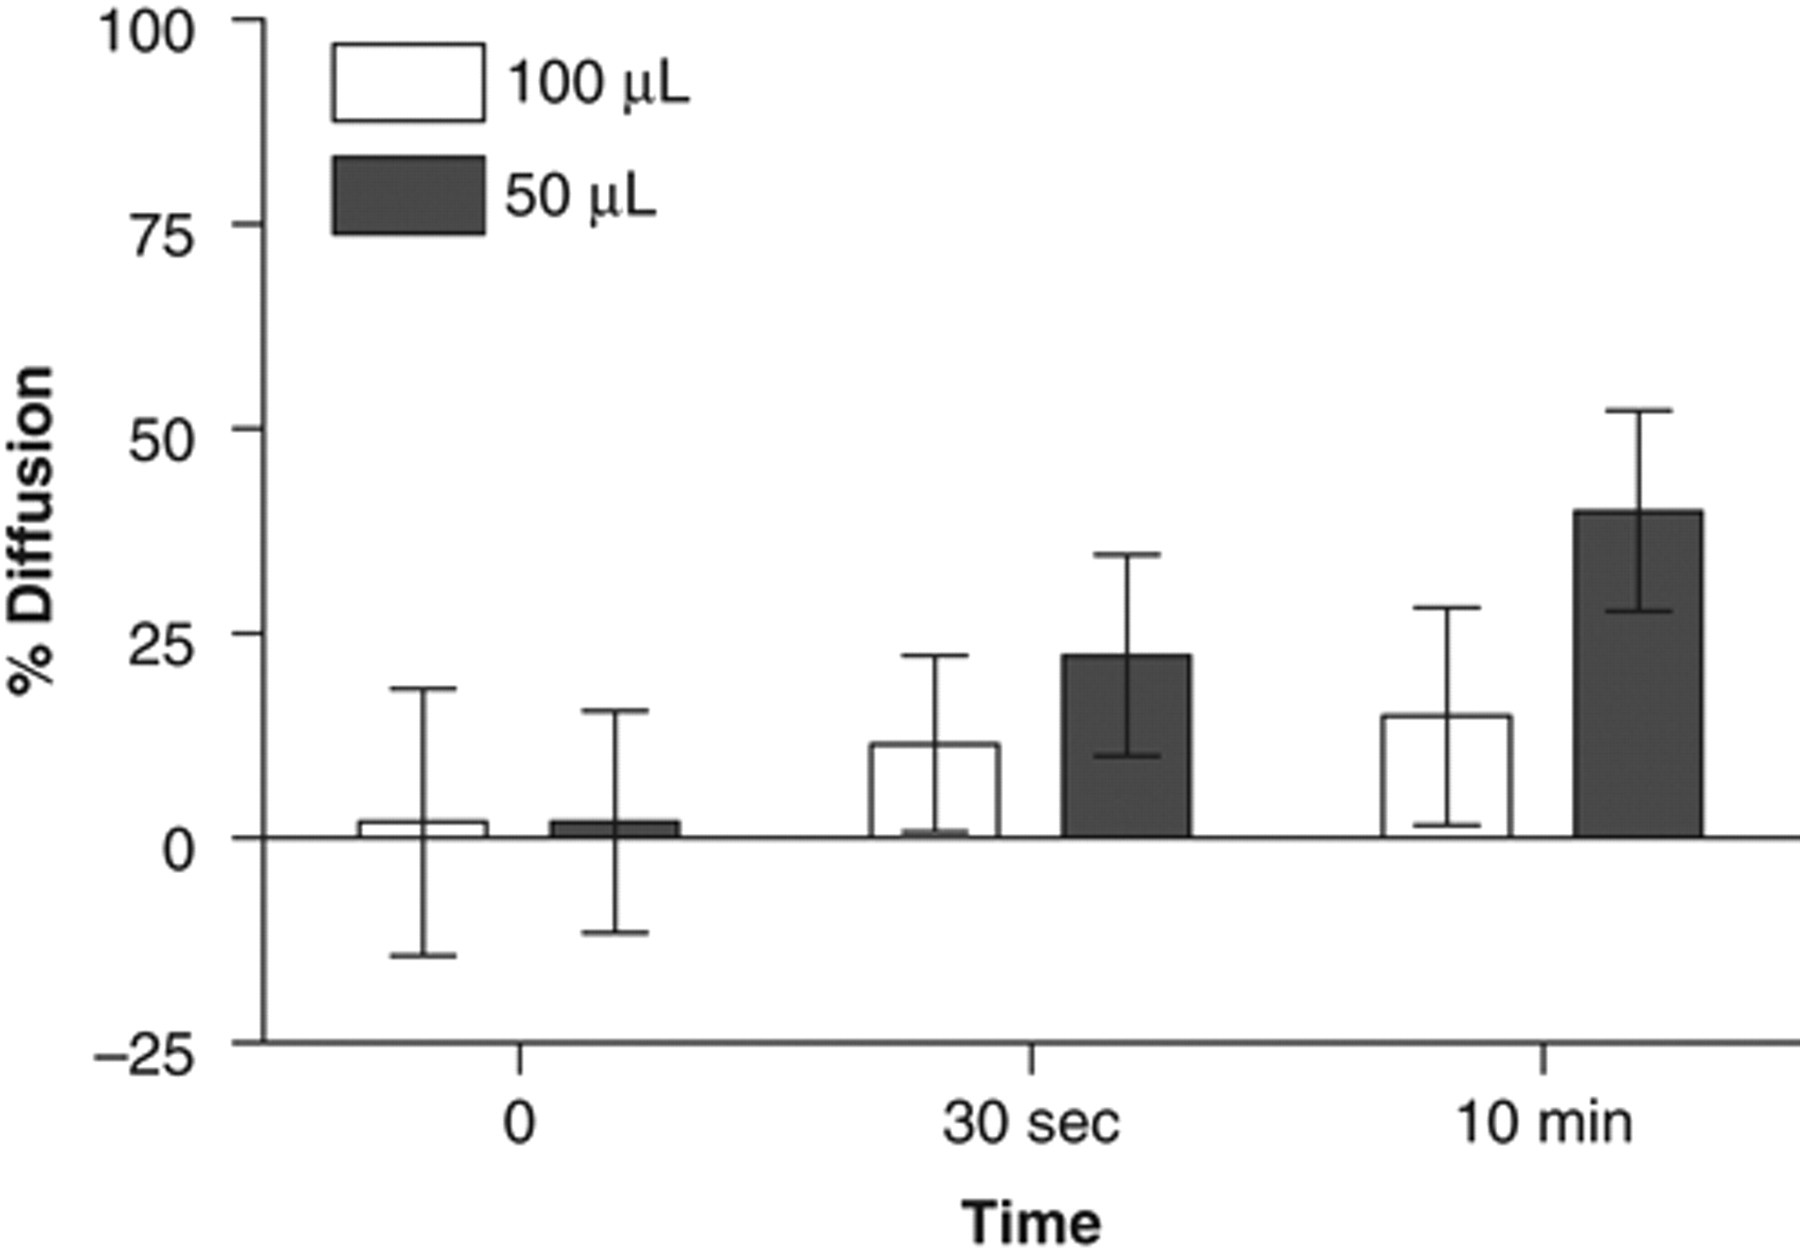
Effect of plate centrifugation on homogenization. One microliter or 500 nL of fluorescein dissolved in 100% DMSO was dispensed with the PreSys into assay plates prefilled with 100 µL (white columns) or 50 µL (gray columns) of assay buffer, respectively. Plates were then centrifuged at 1200 rpm. Pictures were taken immediately after dye addition and after centrifugation. Data are expressed as mean ± SD from 2 independent experiments (n = 48).
Plate shaking
Shaking is a generally accepted practice in HTS when low-volume plate formats are used. Under shaking, a vortex is formed in the assay buffer, which quickly mixes the solutions present in the well. Two different shaking speeds (600 rpm and 1200 rpm, Fig. 5A and 5B , respectively) were tested for their ability to homogenize a DMSO-fluorescein mixture diluted 100 times in a final assay volume of 50 µL or 100 µL. Shaking at 600 rpm did not have an effect on the diffusion, which might be explained by a lack of vortex due to a higher surface tension and lower surface area in 384-well versus 96-well plates. By contrast, diffusion was complete after 30 s of shaking at 1200 rpm when 50 µL was used. However, shaking at 1200 rpm did not have a similar effect when the assay volume was 100 µL, even when the shaking time was increased to 10 min. The vortex in a 384-well format was difficult to achieve and consequently might explain these mixed results. The effect of high-speed plate shaking on the cell layer was determined on HEK293 cells seeded in plates coated with fibronectin. As shown in Figure 5C , 10 min of plate shaking at 1200 rpm had only a small negative effect on cell adherence (arrows); most of the cells were still properly attached to the well bottom. Similar results were obtained with Hela cells without fibronectin (not shown). Shaking appears to be an efficient mixing method suitable for classical cell lines used in HCS. However, this mixing method seems to be inefficient when assay volumes larger than 50 µL are used in a 384-well plate format. Higher shaking speed may produce sufficient vortex for efficient mixing, but it will also have a negative effect on the cell layer. When shaken at 2400 rpm for 30 s, HEK293 cells plated with fibronectin exhibited a round morphology, and most of the cells were detached (not shown).
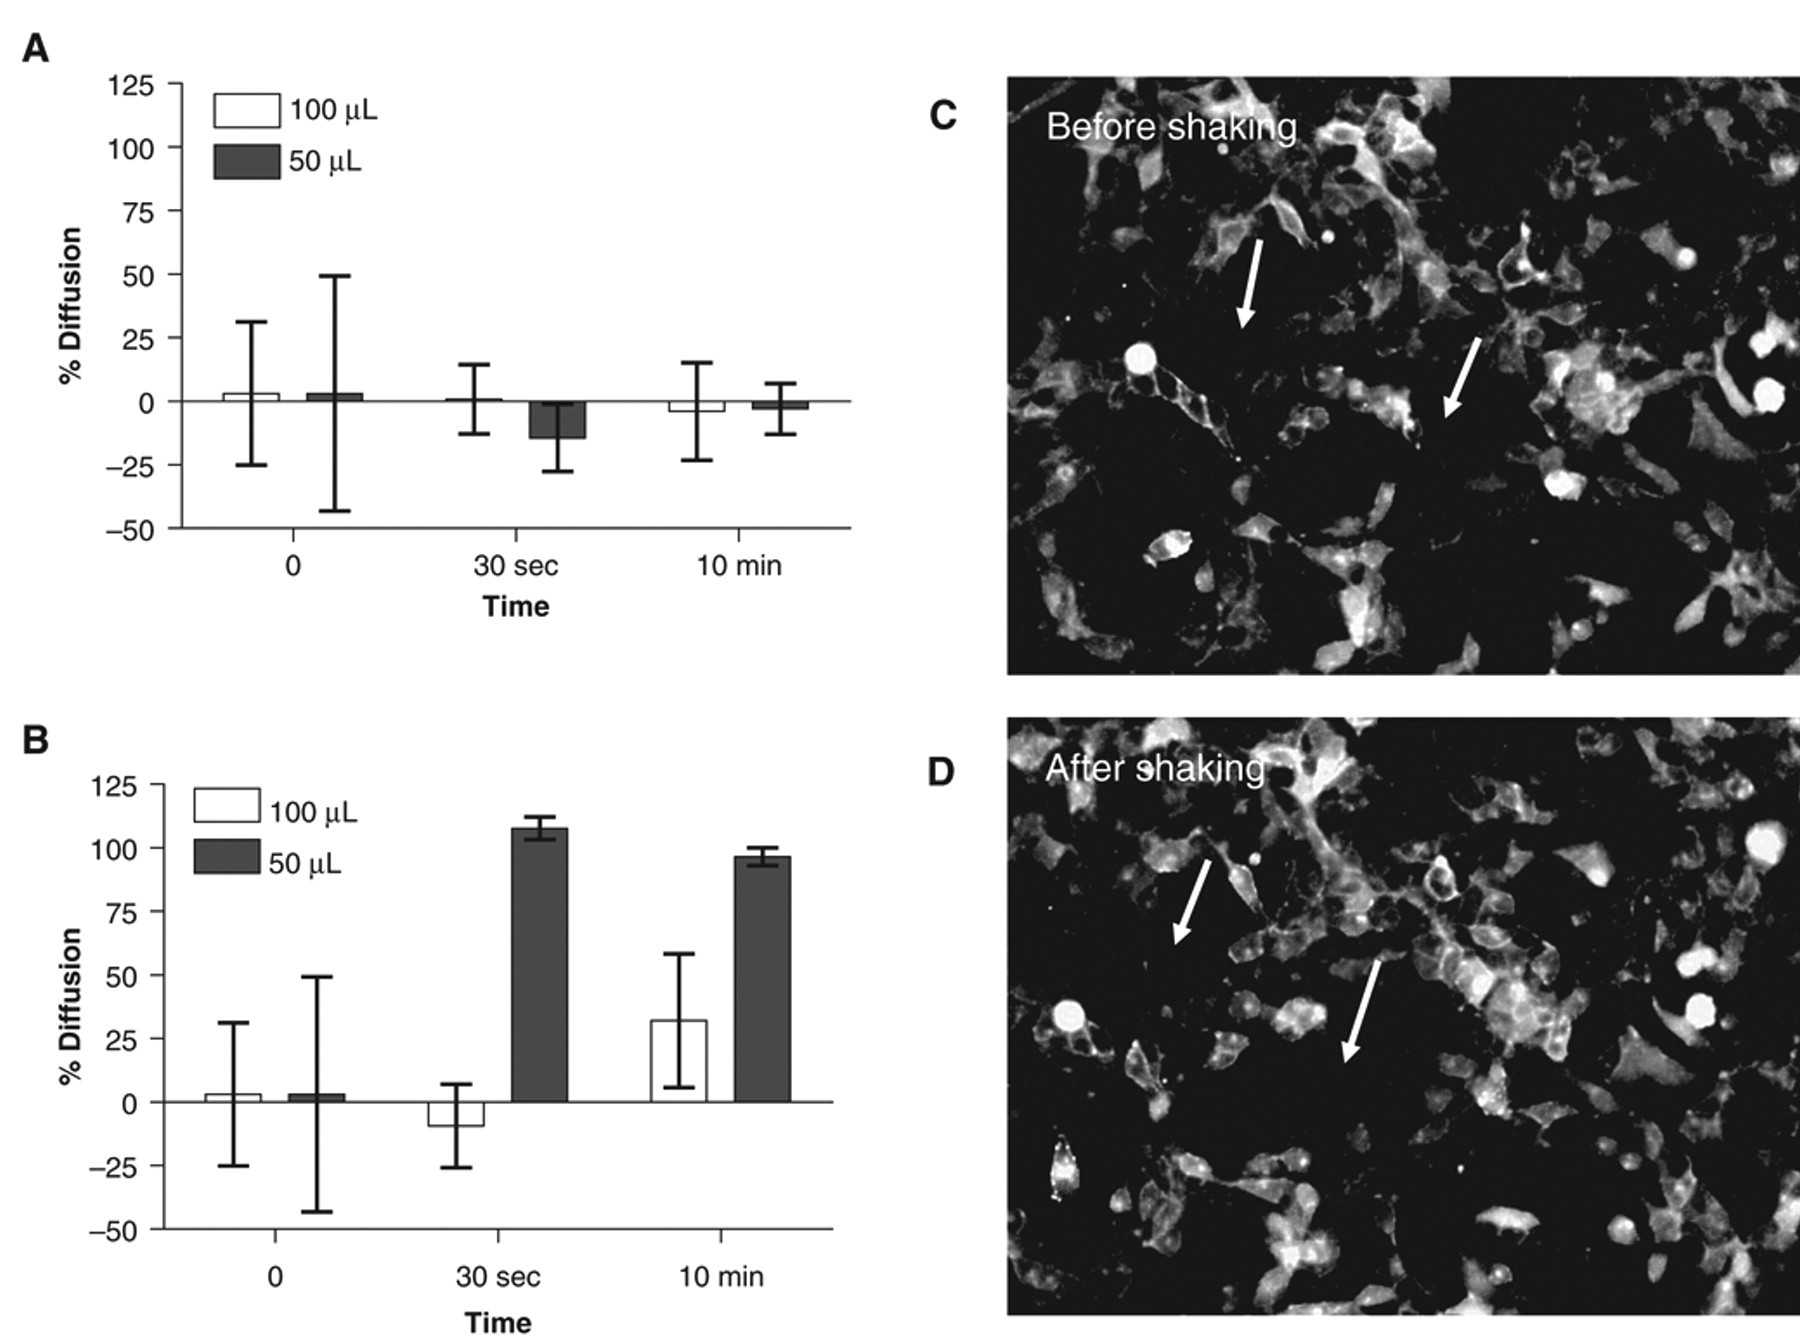
Effect of plate shaking on homogenization. One microliter or 500 nL of fluorescein dissolved in 100% DMSO was dispensed with the PreSys in assay plates prefilled with 100 µL (white columns) or 50 µL (gray columns) of assay buffer, respectively. Assay plates were then shaken for either 30 s or 10 min at either (
Buffer bulk dispensing
To create a controlled turbulence able to achieve complete homogenization, we evaluated the effect of a bulk addition of aqueous buffer performed immediately after DMSO dispensing. Especially important is the ratio between the volume already present in the assay well and the volume added for homogenization; this ratio should be optimized to avoid any toxic or detaching effect on the cell layer. In Figure 6A , 0.5 µL of fluorescein dissolved in 100% DMSO was added to 25 µL of assay buffer. The resulting final percentage of DMSO was 2%. Immediately after DMSO-fluorescein dispensing, an additional 25 µL of assay buffer was added with the PreSys (now 1% final DMSO concentration, 50 µL final volume, and 50:50 ratio between 2 aliquots of buffer). Diffusion kinetics was measured over 30 min. A similar experiment was performed with 50 µL instead of 25 µL (final volume equal to 100 µL; Fig. 6A ). The results of both experiments indicated complete homogenization of DMSO independent of the final assay volume at time = 0 (i.e., immediately after bulk addition). The ratio of 50:50 was chosen as a reasonable ratio, as the addition of a larger buffer volume may have detached the cells because of a flux force as cells would not have been protected by a sufficient layer of buffer in the well. In addition, a minimum of 25 µL of cell culture buffer was determined to be needed to keep the cells in a healthy condition for screening, especially if the cells are seeded the day before screening.
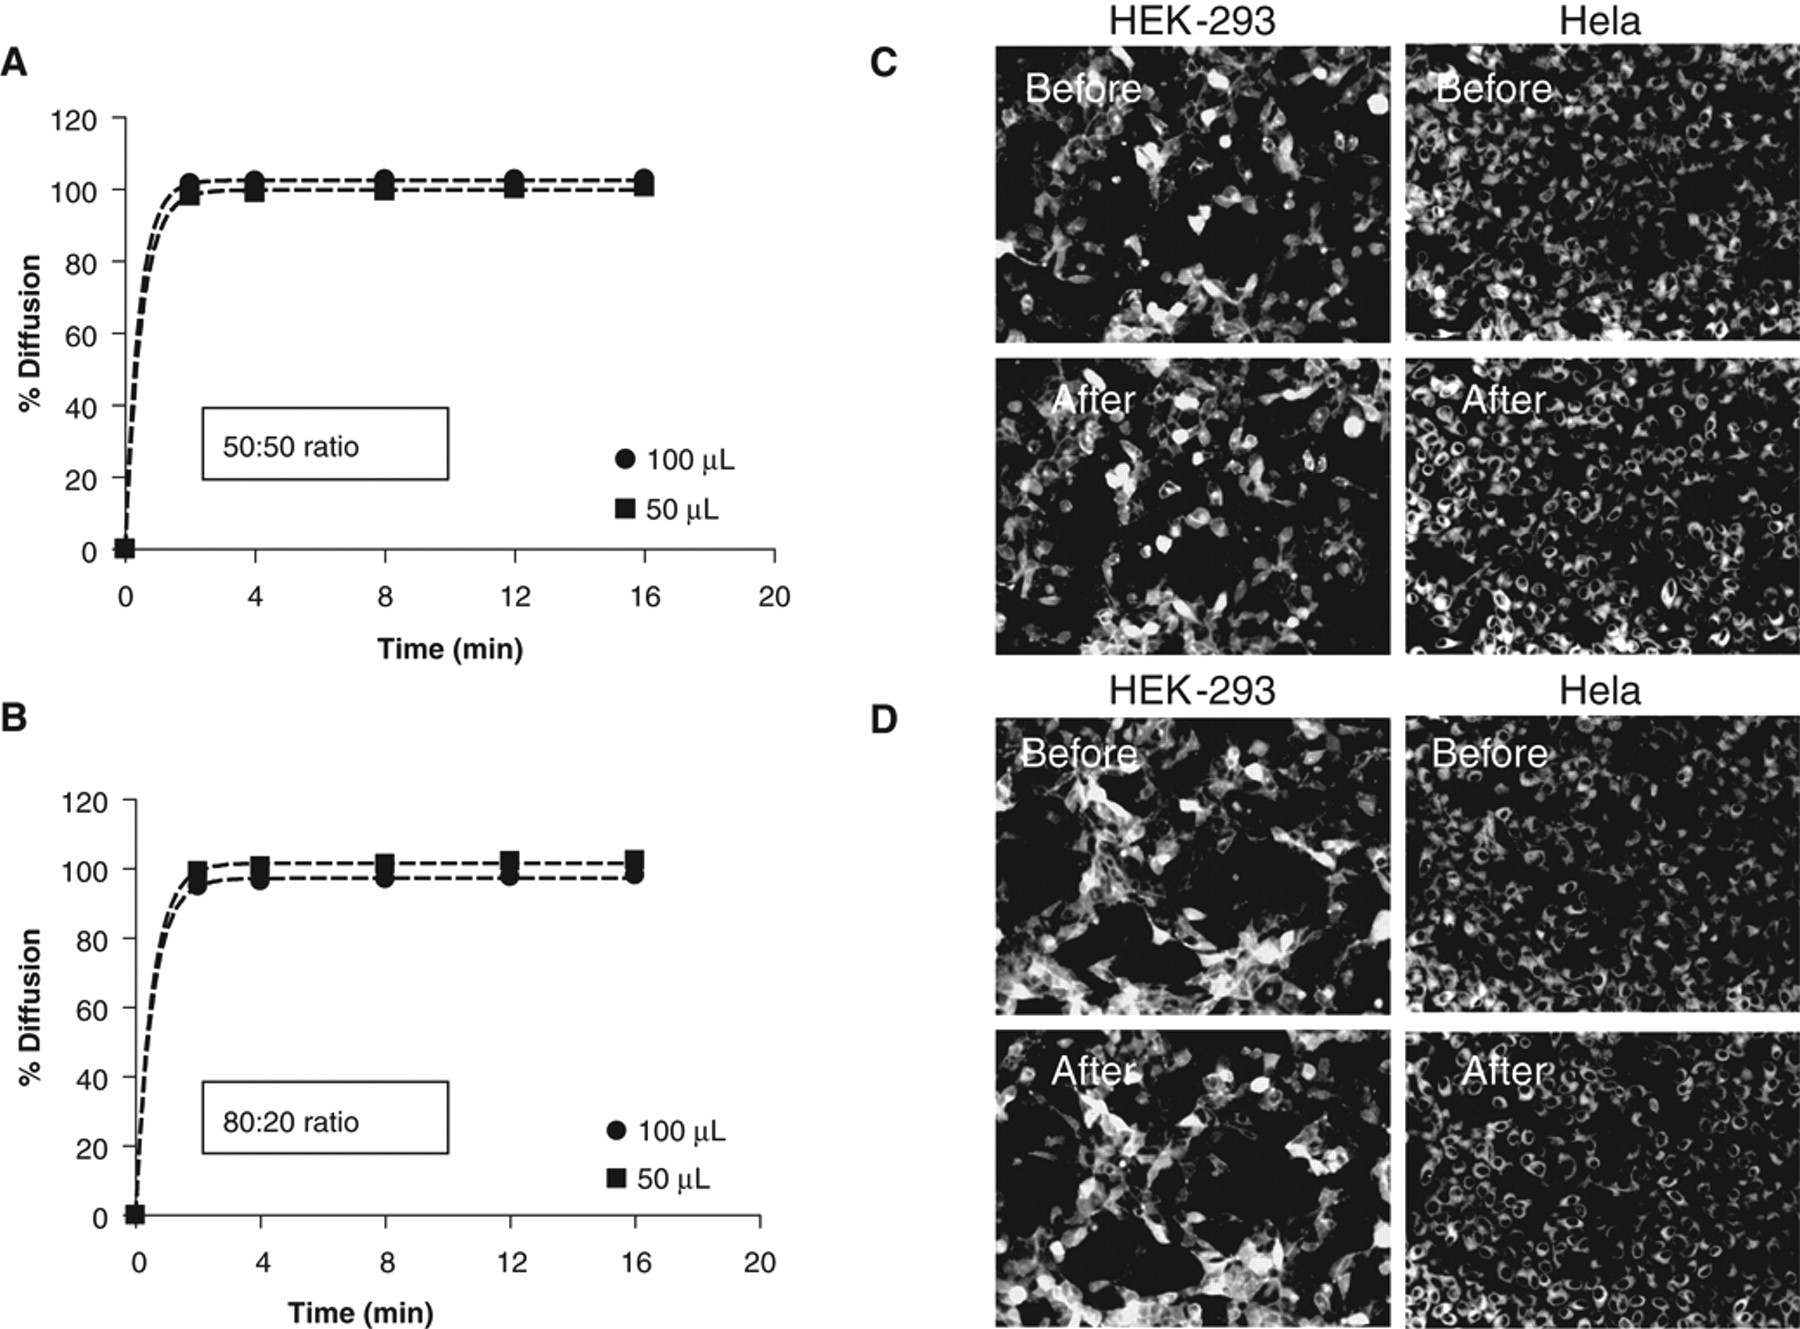
Compound homogenization with buffer bulk addition. One microliter or 500 nL of fluorescein dissolved in 100% DMSO was dispensed with the PreSys into assay plates prefilled with assay buffer. (
To minimize the risk of cell detachment and to reduce the DMSO concentration immediately after compound dispensing, we tested a ratio of 80:20 (40 µL/80 µL of buffer present in the assay plate before compound addition, 10 µL/20 µL added after compound dispensing). Complete DMSO diffusion was achieved with the same kinetics as with a ratio of 50:50, which emphasizes the efficiency of this mixing method ( Fig. 6B ). The bulk addition of volume as small as 10 µL of buffer is sufficient to obtain complete mixing of compound dissolved in pure DMSO in less than 2 min. It is likely that the real time for complete homogenization is even faster, but we could not measure it as 2 min was the minimum time required to transfer the assay plate from the pipettor to the Opera™ reader and to perform the acquisition. This time, however, is suitable for most of the cellular assays used in HCS. For example, G-protein-coupled receptor (GPCR) internalization, one of the main HCS assays used in drug discovery, requires an average of 60 min to be fully detectable.
The subsequent bulk addition of buffer did not negatively affect cell layer, as shown in Figure 6C , D with Hela cells and the very fragile Hek293 cells. The short incubation with a higher DMSO percentage before buffer addition for mixing, especially when a 50:50 ratio was chosen (2% DMSO), does not seem to be toxic for cells based on the physical appearance of the cells.
Conclusions
Rapid mixing in 384-well plate is difficult to achieve compared to lower density plates and remains a challenge for efficient screening assay development. This issue becomes even more critical when HCS is considered as rapid mixing should not detach or affect cells but should be fast enough to fit with biological kinetics and to avoid DMSO toxicity for cells. We have developed a simple quantification method to study diffusion in microwell plates regardless of plate format, buffer, or liquid handler used. Our results demonstrated that fast and efficient mixing is obtained either by high-speed shaking or by bulk addition of aqueous buffer. Both methods did not disrupt adherence of cells, making them suitable for high-content/throughput screening. However, efficient mixing by plate shaking is limited to assay volumes around 50 µL, which could represent a bottleneck in some HCS assays. Bulk addition is efficient for any volume, but the ratio between initial volume in the well and the volume added for mixing should be determined carefully on a case-by-case basis. In our hands, ratios between 50:50 and 80:20 achieved complete mixing in a reasonable time that was suitable for our assay kinetics. Therefore, bulk addition is a simple, cheap, fast, and versatile method, making it suitable for virtually any type of biochemical or cellular HTS or HCS assay. Bulk mixing applied in this study after mainly noncontact dispensing may represent a faster and more efficient mixing method than the classical up-and-down mixing with tips when tip-based technologies are used for compound dispensing.
In terms of validation, this mixing method has been successfully used for a 120,000-compound high-content screen with HEK293 adherent cells seeded the day before compound addition in 40 µL of cell culture medium. Homogenization was performed by the addition of 10 µL of PBS containing a cellular dye immediately after the addition of 0.5 µL of compound dissolved in 100% DMSO (data not shown). Both cell labeling and compound mixing were done by a single-step addition, which increases our assay throughput compared with other mixing methods.
Footnotes
Acknowledgements
The authors thank Priscille Brodin and Lisa Cechetto for critical reading of this paper.
References
Supplementary Material
Please find the following supplemental material available below.
For Open Access articles published under a Creative Commons License, all supplemental material carries the same license as the article it is associated with.
For non-Open Access articles published, all supplemental material carries a non-exclusive license, and permission requests for re-use of supplemental material or any part of supplemental material shall be sent directly to the copyright owner as specified in the copyright notice associated with the article.