
Abstract
Continuous exposure of a pancreatic cancer cell line MIA PaCa-2 (MiaS) to gemcitabine resulted in the formation of a gemcitabine-resistant subline (MiaR). In an effort to discover kinase inhibitors that inhibited MiaR growth, MiaR cells were exposed to kinase inhibitors (PKIS-1 library) in a 384-well screening format. Three compounds (UNC10112721A, UNC10112652A, and UNC10112793A) were identified that inhibited the growth of MiaR cells by more than 50% (at 50 nM). Two compounds (UNC10112721A and UNC10112652A) were classified as cyclin-dependent kinase (CDK) inhibitors, whereas UNC10112793A was reported to be a PLK inhibitor. Dose–response experiments supported the efficacy of these compounds to inhibit growth and increase apoptosis in 2D cultures of these cells. However, only UNC10112721A significantly inhibited the growth of 3D spheroids composed of MiaR cells and GFP-tagged cancer-associated fibroblasts. Multiplexed inhibitor bead (MIB)–mass spectrometry (MS) kinome competition experiments identified CDK9, CLK1-4, DYRK1A, and CSNK1 as major kinase targets for UNC10112721A in MiaR cells. Another CDK9 inhibitor (CDK-IN-2) replicated the growth inhibitory effects of UNC10112721A, whereas inhibitors against the CLK, DYRK, or CSNK1 kinases had no effect. In summary, these studies describe a coordinated approach to discover novel kinase inhibitors, evaluate their efficacy in 3D models, and define their specificity against the kinome.
Keywords
Introduction
Pancreatic cancer has a 5-year survival rate of approximately 5%. Existing cytotoxic treatments such as gemcitabine, a frontline nucleoside analog therapeutic for this and other cancers, have a high failure rate and do not significantly improve overall pancreatic cancer patient survival rates.1,2 Oncogenic K-Ras mutations are present in >90% of pancreatic cancer cases. Despite the knowledge that mutant K-Ras proteins (K-Ras G12V, G12C, etc.) are strongly linked to pancreatic cancer, attempts to drug this protein have been largely unsuccessful.3–5 Thus, there is a great need to discover and develop alternative therapeutics that can be used either alone or in combination with existing treatments to better treat pancreatic cancer. Considerable effort has been made to identify and disrupt protein kinases or signaling pathways activated by oncogenic K-Ras. 6 While one approach has been to target known K-Ras regulated pathways such as MAPK, an alternative approach is to screen small-molecule libraries for growth inhibition to identify potential targets. Recently, a compilation of kinase inhibitors from GlaxoSmithKline and Novartis was made publicly available (Structural Genomics Consortium [SGC] PKIS library). This kinase inhibitor library provides a wide variety of different chemical scaffolds that may provide potential lead compounds for further development.7,8
Determining kinase inhibitor specificity is critical to identifying the therapeutic targets of a given compound. To study both the on-target and off-target effects of kinase inhibitors, a practical drug competition assay has been developed to successfully identify the kinases directly affected. This method is based on kinase capture on immobilized kinase inhibitors known as multiplexed inhibitor bead (MIB)–mass spectrometry (MS), a modified version of the KinoBead approach. 9 Combined with dose-dependent exposure of cells to a given inhibitor, MIB-MS can be used to define inhibitor specificity against hundreds of kinases in a single experiment. In addition, this method can be used to evaluate kinome perturbations in response to kinase inhibitors or the development of acquired drug resistance.10–13
Three-dimensional (3D) cancer models (spheroids and organoids) offer the promise of systems that are more representative of tumors and the tumor environment. Development of these models is vital for future cancer drug discovery efforts.14,15 Two-dimensional (2D) models commonly used for drug screening may not be sufficient to determine whether a compound will be effective in more complex 3D settings.16,17 Thus, the application of 3D models to compound analysis has been a growing trend in recent years, with multiple 3D methods being developed and utilized for drug screening.18,19 Many of these models are based on co-cultures with other cell types (i.e., fibroblasts) or cells that are believed to contribute to the transformed phenotype and/or invasiveness of the tumor cells.20,21 Likewise, stromal–tumor cell interactions have become an actively studied area in cancer drug resistance.22,23
The overall objective of these studies was to test a defined kinase inhibitor library (PKIS-1) against a gemcitabine-resistant pancreatic cancer cell line (MiaR cells); identify “hits,” compounds that inhibit cell growth by greater than 50%; test these against co-culture spheroids of MiaR cells and green fluorescent protein–cancer-associated fibroblasts (GFP-CAFs); and establish the kinase targets through MIB-MS kinome competition assays. Select kinase targets identified in these studies were validated by Western blotting and additional inhibitor experiments ( Fig. 1 ). The results of these studies demonstrate the efficacy of our approach to identify a small-molecule inhibitor, test its effects in 3D co-culture systems, and identify the primary kinase targets that contribute to growth inhibition of gemcitabine-resistant pancreatic cancer cells.
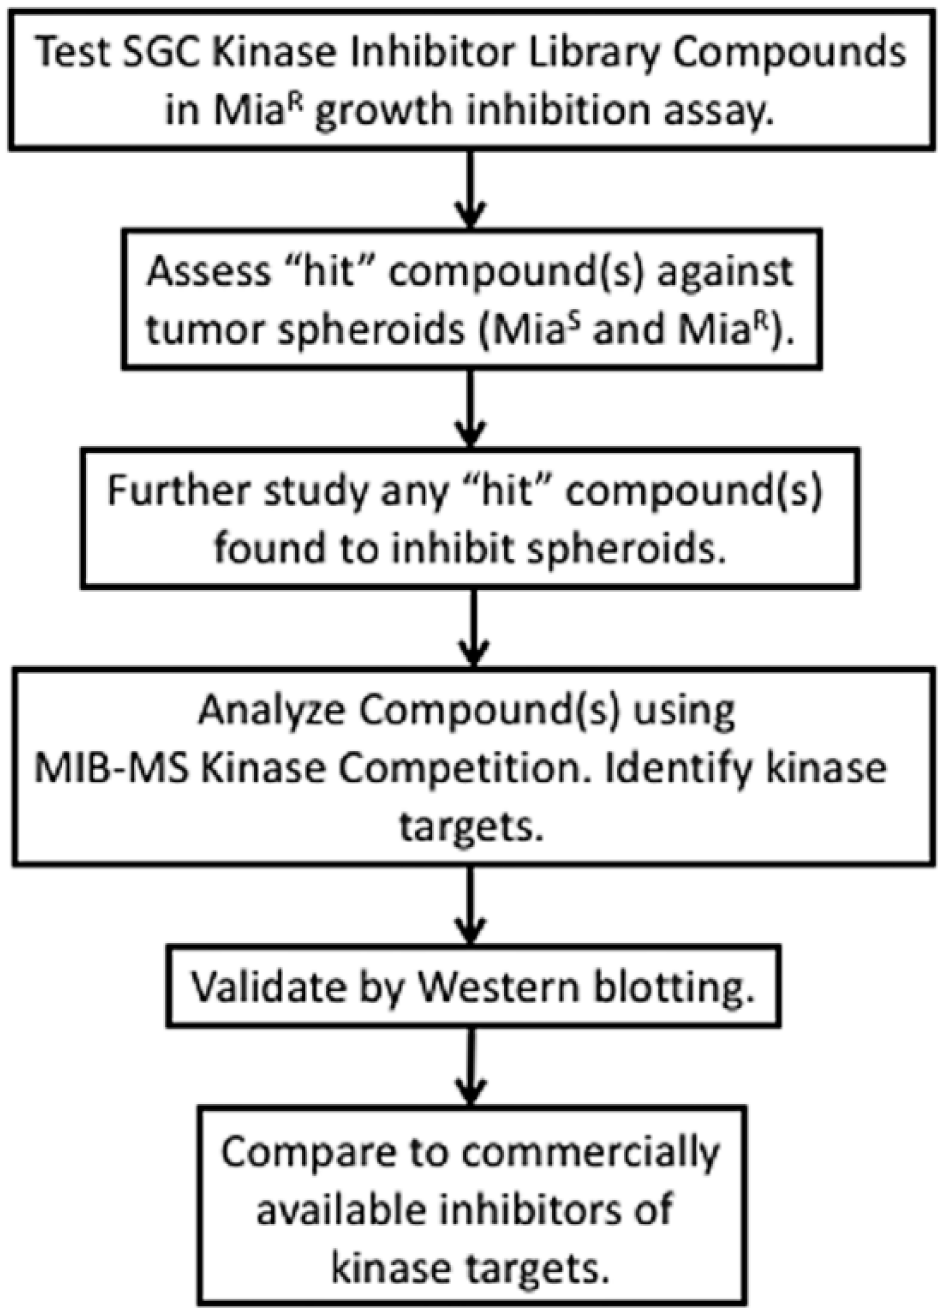
Schematic workflow of the drug screening/kinome profiling method. Shown is our strategy to discover novel kinase inhibitors and establish their specificity by MIB-MS. Compounds from the SGC PKIS-1 kinase inhibitor library were first tested for growth inhibition against MiaR at 50 nM. A hit compound, UNC10112721A (UNC-721A [also known as GW779439X]), was found to cause >50% growth inhibition and was further tested for efficacy using a 3D co-culture spheroid model. It was then kinome profiled using the MIB-MS competition assays to identify specific kinase targets. Target kinases were validated by inhibition and Western blotting.
Materials and Methods
Mammalian Cell Culture
All cell lines used in this study were maintained in RPMI 1640 (Gibco, Waltham, MA) supplemented with 5% fetal bovine serum and 1% Antibiotic-Antimyotic (Gibco). MIA PaCa-2 pancreatic cancer cells (MiaS) and CAFs constitutively expressing GFP were graciously provided by the Yeh laboratory (University of North Carolina [UNC]). To create the gemcitabine-resistant MiaR cells, wild-type MIA PaCa-2 cells were first cultured in media containing 5 nM gemcitabine. After 2 weeks, cells were switched to gemcitabine-free media for 1 week. Cells were then exposed to media containing gemcitabine at increasing concentrations. This process was continued for 4 months, until the cells could be indefinitely cultured in media containing 50 nM gemcitabine. As shown in Supplemental Figure S1 , the MiaR cells showed a fivefold increase in resistance to gemcitabine compared with MiaS cells, with IC50 values of 8.7 and 38.7 nM, respectively.
Compound Screening Assay
The PKIS-1 kinase inhibitor library was kindly provided by the Structural Genomics Consortium (SGC) at UNC at Chapel Hill. This library contained 367 compounds in a 384-well format. These compounds were assessed by liquid chromatography (LC)–MS and were found to be ≥98% pure, with most containing no detectable impurities. The PKIS-1 compounds were diluted with DMSO to a final concentration of 1 mM, with no visible precipitation occurring, and stored at −20 °C until used. MiaR cells were seeded onto Greiner clear, flat-bottom, 384-well assay plates at a density of 5000 cells/well. After 24 h, vehicle control (DMSO) or PKIS-1 compounds were added to a final concentration of 50 nM on three identical plates using a Biomek FXP Laboratory Automation Liquid Handling Workstation (Beckman Coulter, Brea, CA). The final concentration of DMSO in these experiments did not exceed 0.1%. The Biomek FXP, with a 384-well enhanced selective-tip multichannel pipetting head and disposable Biomek AP384 P30 sterile tips, was used to pipette and dispense the desired volumes from the source compound plate and intermediate plates using a custom technique with the standard scaling factor and offset values of 1 and 0, respectively. After incubation of the cells with the compounds in 5% CO 2 for 72 h, cell viability was determined using CellTiter-Glo 3D per the manufacturer’s protocol (Promega, Madison, WI, cat. 7570) using a PHERAStar FS microplate reader (BMG Labtech). The instrument was formatted to use the luminescent optic module with a focal height of 13.5 mm, a setting time of 0.2 s, and a measurement interval of 0.35 s. Compounds found to inhibit growth of the cells by greater than 50% (from triplicate analysis) were chosen for further evaluation.
Development and Testing of a 3D Spheroid Model
Spheroids were formed by seeding MiaS or MiaR cells in a 96-well, low-attachment plate (Nexcelom. Lawrence, MA) and incubating these cells for 24 h to allow spheroids to form. Twenty-four hours was the earliest time point showing spheroid formation. The following time points showed minimal to no change in spheroid definition. Our definition of a spheroid is a stable, not easily disturbed aggregation of cells with a uniform spheroidal shape. Another key feature of these spheroids is the formation of a visible layer or boundary surrounding the spheroid. To form co-culture spheroids, we co-cultured tumor cell lines together with GFP-tagged CAFs. The GFP-CAFs were cultured as described above and co-culture 3D spheroids were developed by combining and mixing the tumor cell lines (either MiaS or MiaR) with the GFP-CAFs in a 1:1 ratio (5000:5000 cells) and distributing them into a 96-well, low-attachment plate at 100 µL per well. This ratio was determined to be optimal and was based on CAF/tumor cell ratios from a previous study. 24 The two types of co-cultured spheroids, the MiaS and the MiaR, had diameters that ranged from 100 µm to 150 µm in all of the wells.
Select kinase inhibitors were tested using a wide range of concentrations (1 nM to 1 µM) to ensure both minimum and maximum cell inhibition. In order to examine if co-culturing GFP-CAFs with the MiaS/MiaR cells affected drug efficacy in 3D formats, different spheroid compositions were compared. Three different spheroid configurations were included: the tumor cell lines alone, GFP-CAF cells alone, and the combination of the tumor cell lines and GFP-CAFs (1:1 ratio). Each of these spheroid types were incubated with UNC-721A for 72 h (96 h total when including the 24 h spheroid formation period) and the cell growth data collected as stated above. The images were taken using an Axio Scope.A1 Polarized Light Microscope (Zeiss) at 10× objective.
Kinome Analysis Using MIB-MS
MIB-MS kinome profiling was used to examine the direct kinase targets of UNC-721A by cell-based, dose-dependent competition assays. Four 15 cm plates of the MiaR cells were grown under normal culture conditions and were incubated briefly (1 h), with UNC-721A at three different concentrations, 3, 30, and 300 nM, with a fourth control plate containing only vehicle (0.1% DMSO). Cells were washed with PBS (2×) and harvested in MIB lysis buffer (50 mM HEPES, pH 7.5, 150 mM NaCl, 0.5% Triton X-100, 1 mM EDTA, 1 mM EGTA, 10 mM NaF, 2.5 mM NaV04, Protease Inhibitor Cocktail [Roche, Basel, Switzerland], and Phosphatase Inhibitor Cocktails 2 [Sigma, St. Louis, MO] and 3 [Sigma]). The samples were sonicated and clarified by centrifugation at 16,000 rcf for 15 min, and the supernatant was transferred to clean 1.5 mL centrifuge tubes. The protein concentration of each sample was determined using a Bradford assay (Bio-Rad, Hercules, CA) and divided into samples containing 5 mg of total protein. These samples were then adjusted to contain a final concentration of 1 M NaCl and applied to MIB columns containing six immobilized pan-kinase inhibitors (PP58, Purvalanol B, CTx-0294885, VI-16832, UNC-8088A, and UNC-2147A) in a total volume of 200 μL. The MIB procedure for kinase peptide isolation, LC-MS specifications, and data analysis were followed exactly as described in a recent publication. 25
Western Blot Analysis
MiaR cells were grown in 2D, 10 cm dishes and treated with 300 nM UNC-721A dissolved in DMSO for times ranging from 1 to 4 h. The samples were harvested using MIB-MS lysis buffer (above), and determination of protein levels was performed by Bradford analysis as described above. The proteins amounts were normalized and the samples were mixed with 4× sample buffer and 20 μg of each sample applied to sodium dodecyl sulfate (SDS)–polyacrylamide gel electrophoresis. The proteins were transferred to polyvinylidene difluoride (PVDF) and the membrane blocked with 5% bovine albumin in Tris-buffered saline with 0.05% Tween-20 (TBST) for 1 h at room temperature. Primary antibodies for MCL-1 (Santa Cruz, Santa Cruz, CA), pSRSF (EMD Millipore, Darmstadt, Germany), tSRSF1 (Thermo Fisher, Waltham, MA), tSRSF6 (Invitrogen, Waltham, MA), PARP (Cell Signaling, Danvers, MA), CDK9 (Santa Cruz), pCDK9 (Cell Signaling), RNA polymerase II (phospho Ser2, Abcam, Cambridge, UK), and β-Actin (Santa Cruz) were diluted in 5% bovine serum albumin (BSA)/TBST, and the membranes were incubated overnight at 4 °C. The membranes were washed three times with TBST, followed by incubation in horseradish peroxidase (HRP)-conjugated secondary antibodies (Promega) in 5% nonfat dry milk in TBST. The blots were imaged using the ChemiDoc Touch Imaging System and ECL reagent (Bio-Rad).
Kinase Inhibitor Testing
Kinase inhibitors specific to individual kinase targets identified by MIB-MS were further tested for growth inhibition of the 3D spheroids. This included inhibitors of CDK9, CLK4, CSNK1δ/ε, and AURKA kinases. The inhibitors used were CDK9-IN-2 (MedChem Express, Monmouth Junction, NJ, cat. HY-16462), ML167 (Selleckchem, Houston, TX, cat. S7509), PF 670462 (Tocris, Minneapolis, MN, cat. 3316), and Alisertib (ApexBio, Hsinchu City, Taiwan, cat. A4110), respectively. MiaS and MiaR co-culture spheroids were incubated with each of these kinase inhibitors at a variety of concentrations, and cell viability was analyzed using CellTiter-Glo 3D and a PHERAStar plate reader.
Molecular Modeling
Molecular modeling was performed using the Schrodinger-2016 software suite (Schrodinger, Inc., New York, NY). The x-ray structure of CDK9 in complex with a thiazol-aminopyrimidine inhibitor (PDB ID: 4BCF) was downloaded from the Protein Data Bank. The compound was modified to UNC-721A (also known as UNC-366A), and the geometry of the resulting complex was optimized using the OPLS3 force field. This optimization routine adjusts all parts of the ligand and the protein in order to minimize the energy of the ligand–protein interaction.
Results
Initial Screening and 2D Viability Assays
We tested the PKIS-1 library, a collection of 367 publicly available kinase inhibitors, 26 to identify kinase inhibitors capable of inhibiting the growth of the gemcitabine-resistant MIA PaCa-2 (MiaR) cells. Three compounds showed >50% growth inhibition when tested at a concentration of 50 nM against the MiaR cell line: UNC10112721A, UNC10112652A, and UNC10112793A. Cell viability was inhibited by 93.9%, 93.1%, and 84.4% by these compounds respectively, when compared with the DMSO control samples. This assay was repeated in quadruplicate. The specificity of these three kinase inhibitors was previously reported in both Nanosyn data and other literature. 7 UNC10112721A (UNC-721A [also known as GW779439X]) was reported to be a broad CDK/CLK kinase inhibitor. Since UNC-721A demonstrated the most potent dose-dependent inhibition of cell growth in both MiaS and MiaR cell lines (IC50 values of 20 ± 0.4 nM and 24 ± 0.6 nM, respectively), compared with UNC-652A and UNC-793A, this compound was selected for further study ( Fig. 2 ).
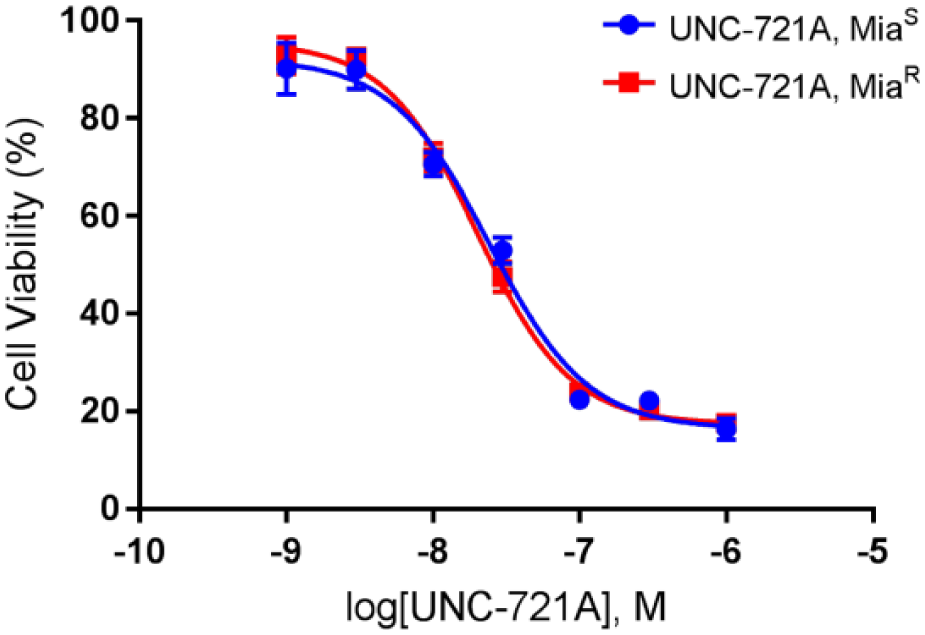
Dose-dependent inhibition of MiaS and MiaR cells by UNC-721A. UNC-721A was tested for growth inhibitory effects in both MiaS and MiaR cells in a 2D format for 72 h. Both cell lines were seeded at 10,000 cells/well, and the concentrations of UNC-721A ranged from 1 µM to 1 nM. Cell viability was measured by CellTiter-Glo 3D assays in triplicate. Shown is a representative figure from n = 3 independent experiments. The IC50 values for MiaS and MiaR were determined to be 20 ± 0.4 nM and 24 ± 0.6 nM, respectively.
3D Spheroid System and Viability Assays
We developed 3D spheroid models, including co-culture models, to evaluate the efficacy of select compounds in potentially more realistic models of drug resistance. We co-cultured equal numbers of a GFP-CAF cell line with MiaS or MiaR cells in low-adherence, 96-well plates until stable spheroids formed (~24 h). As shown in Figure 3A , when combined with GFP-CAF cells, the cells at the bottom of the well formed a tightly organized circular shape, while the MiaS or MiaR cells without the GFP-CAFs formed a large, loose aggregation at the bottom of the well without evidence of clear spheroid formation. By contrast, there appears to be some cooperation between the MiaS or MiaR cell lines and the GFP-CAFs that facilitates the formation of a more tightly organized spheroid.
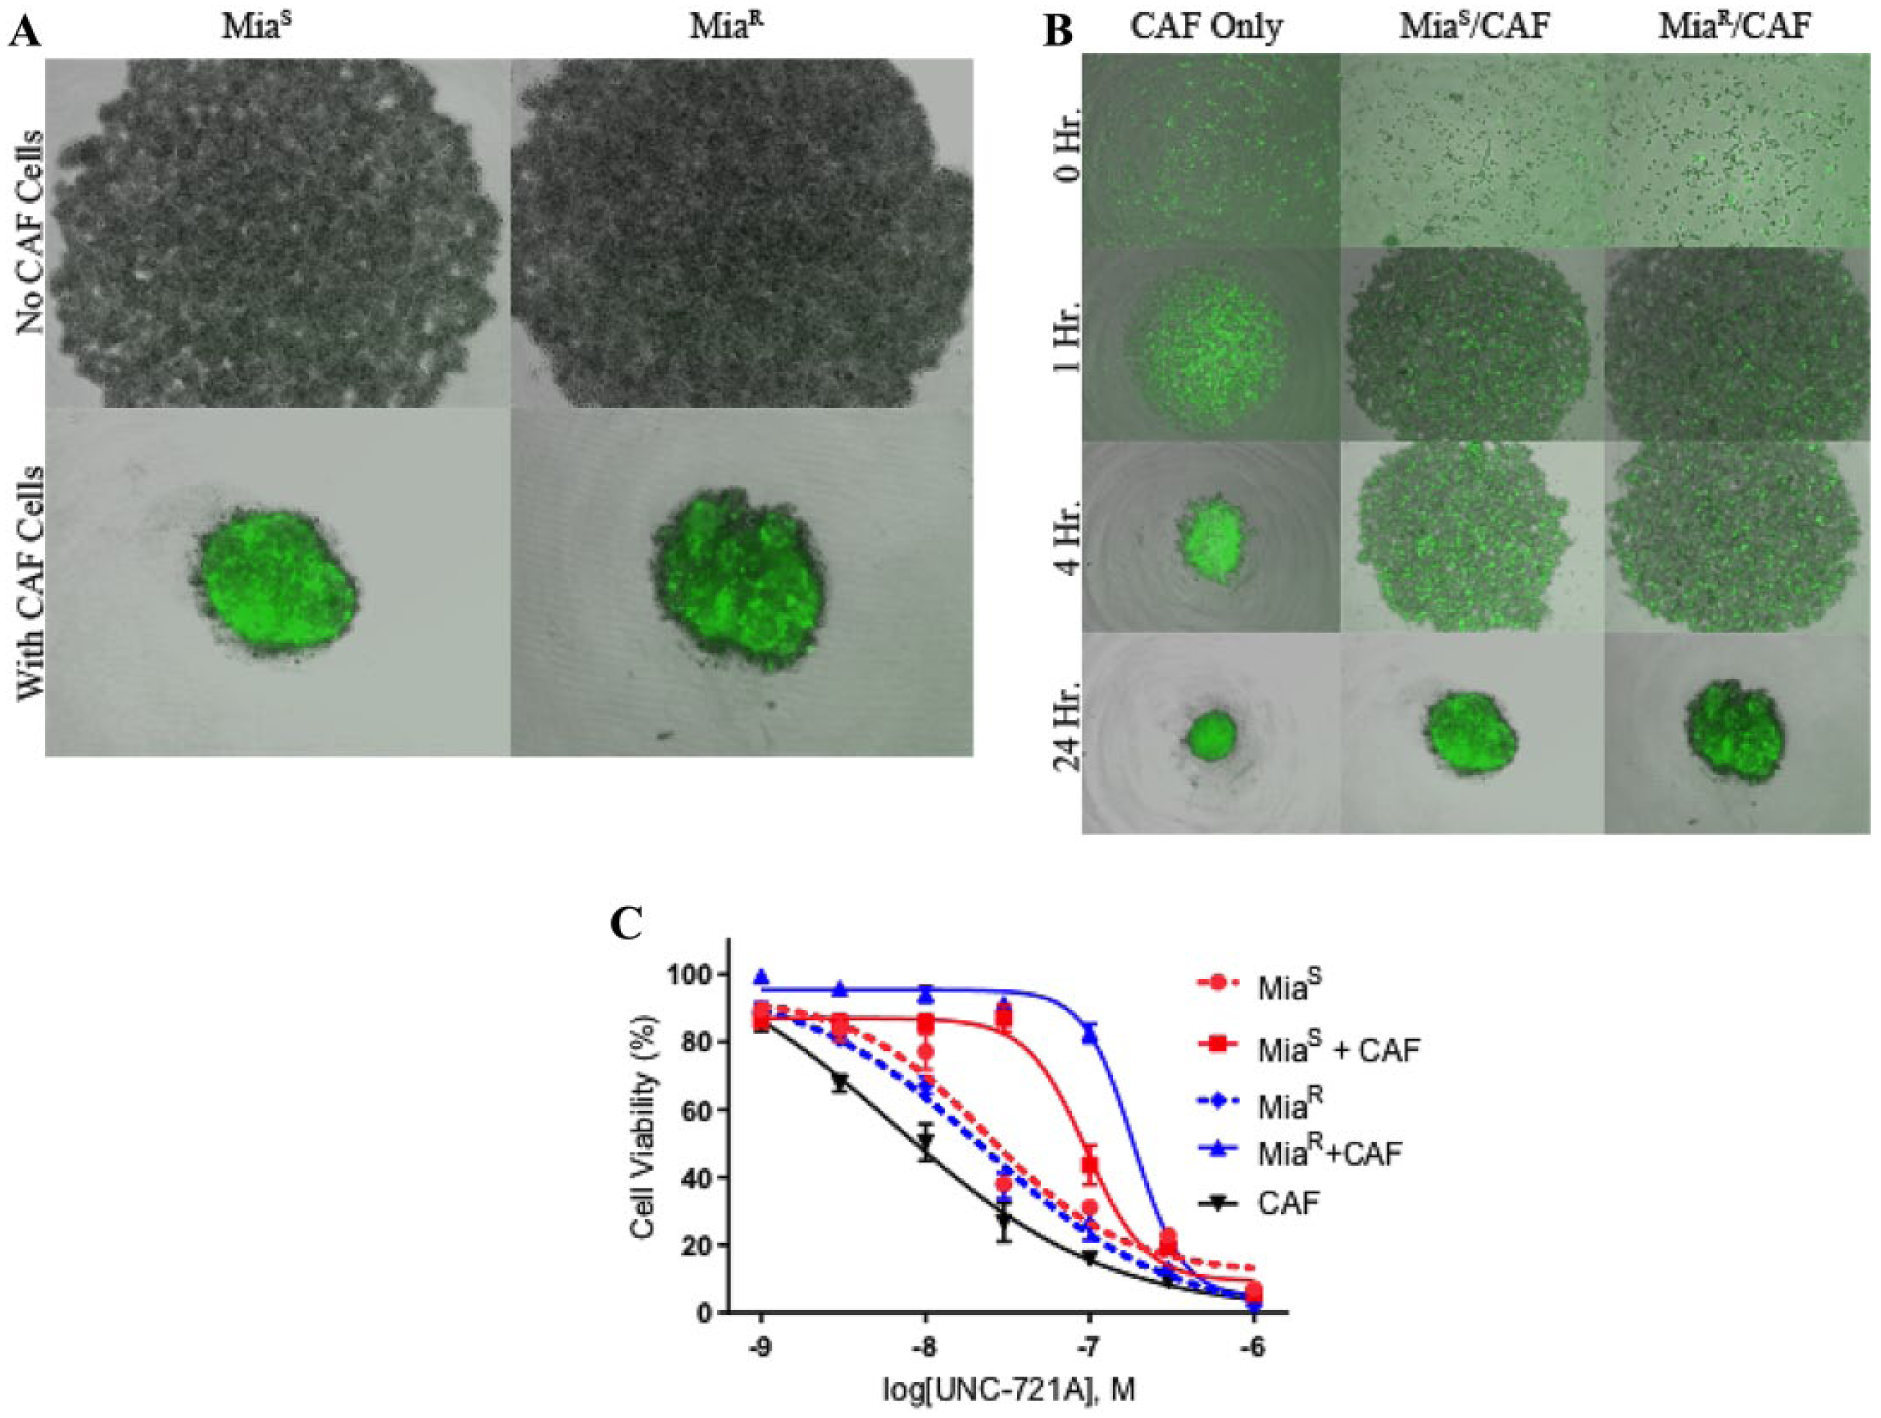
Analysis of a co-culture spheroid tumor model and subsequent testing with UNC-721A. Spheroids were composed of a 1:1 ratio (5000:5000 cells/well) of MiaS or MiaR cells and GFP-CAF cells. (
In order to better characterize the development of these spheroids, a 24 h time course was performed with images being taken at 0, 1, 4, and 24 h. The three conditions tested were the GFP-CAFs alone, MiaS cells combined with GFP-CAFs, and MiaR cells combined with GFP-CAFs ( Fig. 3B ). As seen in Figure 3 , the GFP-CAFs alone quickly formed a very small, tightly bound spheroid shape that was brightly fluorescent. The co-culture spheroids also formed tight (albeit, not as tightly as the GFP-CAFs alone), partially fluorescent spheroids. The formation of these spheroids followed similar timing, with the cells aggregating over the span of 4 h, but not forming stable spheroids until 24 h after seeding. One noticeable difference between the two types of spheroids was that the MiaR cells did not aggregate as tightly as the MiaS cells initially, which may have resulted in a less compact and organized spheroid structure after 24 h.
Once established, our first goal was to examine the influence of the GFP-CAF cells on tumor cell viability in the presence or absence of the UNC compounds. To accomplish this, MiaS or MiaR cells or spheroids formed with GFP-CAF cells were treated with the UNC compounds or carrier (DMSO) for 72 h (96 total when including the 24 h spheroid formation) and assayed for growth inhibition. Different cell compositions were tested: tumor cell lines (MiaS or MiaR cells) only, GFP-CAFs only, and MiaS or MiaR plus GFP-CAF co-cultures. As shown in Figure 3C , there was a shift in the IC50 values observed after inclusion of GFP-CAFs with the tumor cell lines, with a ~7-fold increase in the MiaR (23 ± 0.3 nM compared with 154 ± 0.5 nM) and an almost 2-fold increase in the MiaS co-culture spheroids (23 ± 0.5 nM compared with 42 ± 0.2 nM). When spheroids consisting of only GFP-CAFs were treated with UNC-721A, the IC50 value (6 ± 0.4 nM) was substantially lower than that of either of the co-culture spheroids.
We also tested the efficacy of UNC-721A on MiaS or MiaR cells grown in combination with GFP-CAFs in 3D format ( Fig. 3C ). Combined in a 1:1 ratio with GFP-CAFs, these cells were treated with UNC-721A at multiple concentrations ranging from 1 nM to 1 μM and viability was measured by CellTiter-Glo 3D cell proliferation assay. When incubated with UNC-721A, the MiaS and MiaR spheroids had IC50 values of 42 ± 0.5 nM and 154 ± 0.2 nM, respectively ( Suppl. Fig. S2 ). These data indicate a greater resistance of MiaR cells, compared with MiaS cells, when co-cultured with GFP-CAF cells in the 3D format. Compared with the 2D monolayer format, the 3D spheroids appear to have a much lower sensitivity to UNC-721A. For the MiaS cells, we observed a twofold increase in IC50, while in the MiaR cells, we determined a nearly sevenfold increase in IC50 ( Suppl. Table S1 ).
Kinase Inhibitor Specificity Profiling by MIB-MS
MIB-MS is a powerful method to evaluate kinase inhibitor specificity by competition binding assays. 27 Composed of type I kinase inhibitors, kinases bind to MIBs through interactions with the ATP pocket. Incubating cells (or cell lysates) with a small-molecule kinase inhibitor can allow us to identify direct kinase targets by occupation of the ATP binding site and prevention of subsequent MIB binding. Kinase targets of the tested inhibitor display a dose-dependent reduction in quantification by MS ( Fig. 4A ).
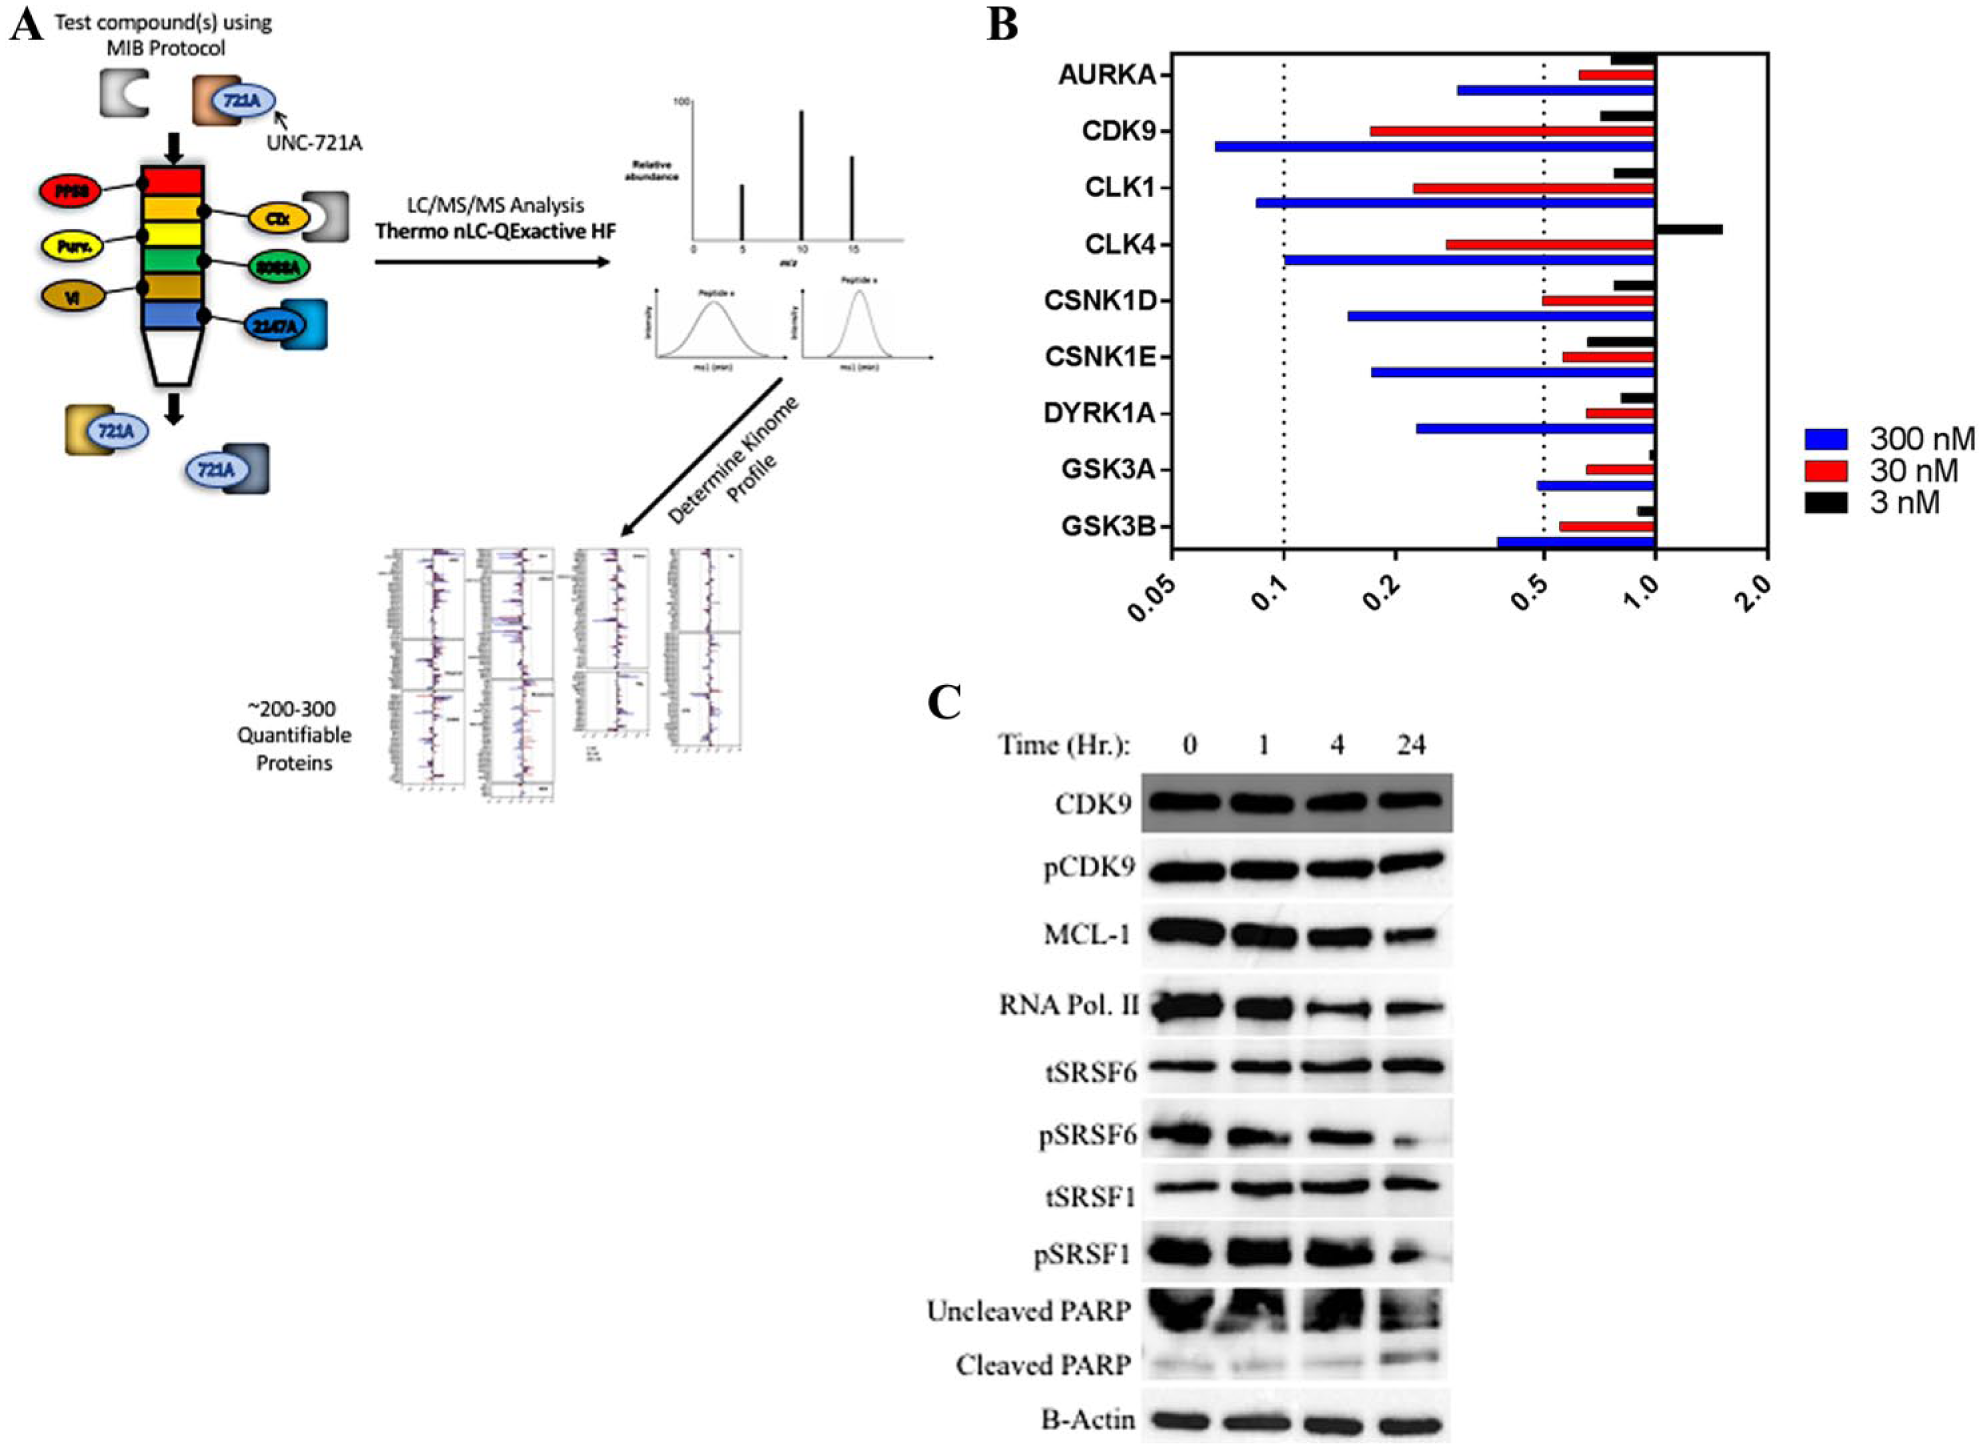
MIB-MS kinome profiling to determine inhibitor specificity. (
The MIB-MS competition assay was performed by briefly (1 h) treating 2D MiaR cells with three different concentrations of UNC-721A (3, 30, and 300 nM) and comparing the results to those of cells treated with vehicle control (0.1% DMSO). Lysates were prepared and applied to MIB-MS columns as described in Materials and Methods. Kinase abundance was quantified by label-free quantification (MAXQuant), and abundance ratios for drug treatments were calculated relative to the DMSO control. The complete kinome data from this analysis are plotted as fold change in Supplemental Figure S3 . From this, we observed a number of kinases that showed dose-dependent loss in MIB binding, including CDK9, CLK1, CLK4, DYRK1A, CSNK1δ/ε (CK1 delta/epsilon), GSK3A/B, and AURKA ( Fig. 4B ). We were particularly interested in the changes observed with the CLK and CDK9 kinases, as both kinases showed the largest dose-dependent reduction in MIB binding.
Kinase Validation
To validate inhibition of kinase activity by UNC-721A in cells, phosphorylation of select kinase substrates was analyzed by immunoblot using phospho-specific antibodies. Two-dimensional MiaR cells were treated with UNC-721A, and the activities of CLK1, CLK4, CDK9, and DYRK1A were examined by immunoblotting for known phosphoprotein substrates ( Fig. 4C ). Total CDK9 levels were largely consistent across all time points with a slight decrease observed after 4 h. Phospho-CDK9 also followed this pattern, with similar uniformity across all time points. Consistent with inhibition of CDK9, the MCL-1 protein (a marker for CDK9 inhibition 28 ) decreased strongly with increasing UNC-721A treatment time. We also examined the effects of UNC-721A on a direct substrate of CDK9, RNA polymerase II (Ser 2). Phosphorylation of this site also strongly decreased over the time course treatment. Because our MIB results indicated that UNC-721A was also acting as a CLK inhibitor, we tested its effects against a known CLK substrate. The CLK1/4 substrate, phospho-SRSF1, showed a progressive decrease over time after UNC-721A treatment, while total SRSF1 protein was unaffected. Finally, the DYRK1 substrate, phospho-SRSF6, was also found to decrease with increasing time after UNC-721A treatment, while the total SRSF6 was unchanged. Thus, these studies support the dose-dependent inhibition of CDK9, CLK1/4, and DYRK1 kinases by UNC-721A, as shown in the MIB-MS competition experiments.
To determine the effects of UNC-721A on cell death, we measured PARP cleavage as a measure of apoptosis. After incubation with 300 nM UNC-721A for 1, 2, and 4 h, we observed a gradual but consistent increase in PARP cleavage throughout the time course ( Fig. 4C ). Similarly, there also appeared to be a decrease in total PARP from 1 to 4 h. These data indicated a small, but significant level of apoptosis occurring in the cells when treated with 300 nM UNC-721A over a short time course.
CDK9 Kinase Assay and Molecular Modeling Analysis
To investigate CDK9 as a potential target for inhibition by UNC-721A, an aliquot of the compound was analyzed using the Thermo Fisher SelectScreen kinase assay against purified CDK9/cyclin T1. The concentrations of UNC-721A tested ranged from 1 µM to 0.495 nM, and this kinetic assay was used to determine the IC50 of CDK9 at its Km. As seen in Figure 5A , the assay showed that UNC-721A was a potent inhibitor of CDK9, with the IC50 determined to be 0.603 nM. Using the Thermo Fisher in vitro kinase activity assay, other CDKs and other kinases were found to be inhibited when tested with 30 nM UNC-721A ( Suppl. Fig. S4 ). Of these, only DYRK1A, CLK4, CDK16, and CDK17 were inhibited to a similar level as CDK9. While the DYRK1A and CLK4 inhibition data were also observed by MIB-MS competition experiments, neither CDK16 nor CDK17 showed significant inhibition using this assay. Furthermore, to gain structural insight into the inhibitory effects of UNC-721A, a model of CDK9 in complex with UNC-721A was constructed ( Fig. 5B ). An x-ray structure of CDK9 in complex with a related thiazol-aminopyrimidine compound (PDB ID: 4BCF) was used as a high-confidence template for our model. The binding mode of UNC-721A suggests that its potency is mainly driven by the core aminopyrimidine group forming two hydrogen bonds to the hinge motif backbone. The aminopyrimidine is further stabilized by highly effective hydrophobic interactions with side chains of Ala46 and Leu156 in CDK9. The compound’s piperazine group is mainly exposed to solvent and is likely to form an ionic bond with Asp109. The binding pose of UNC-721A is consistent with its high potency and may provide guidance for further optimization of its potency and selectivity.
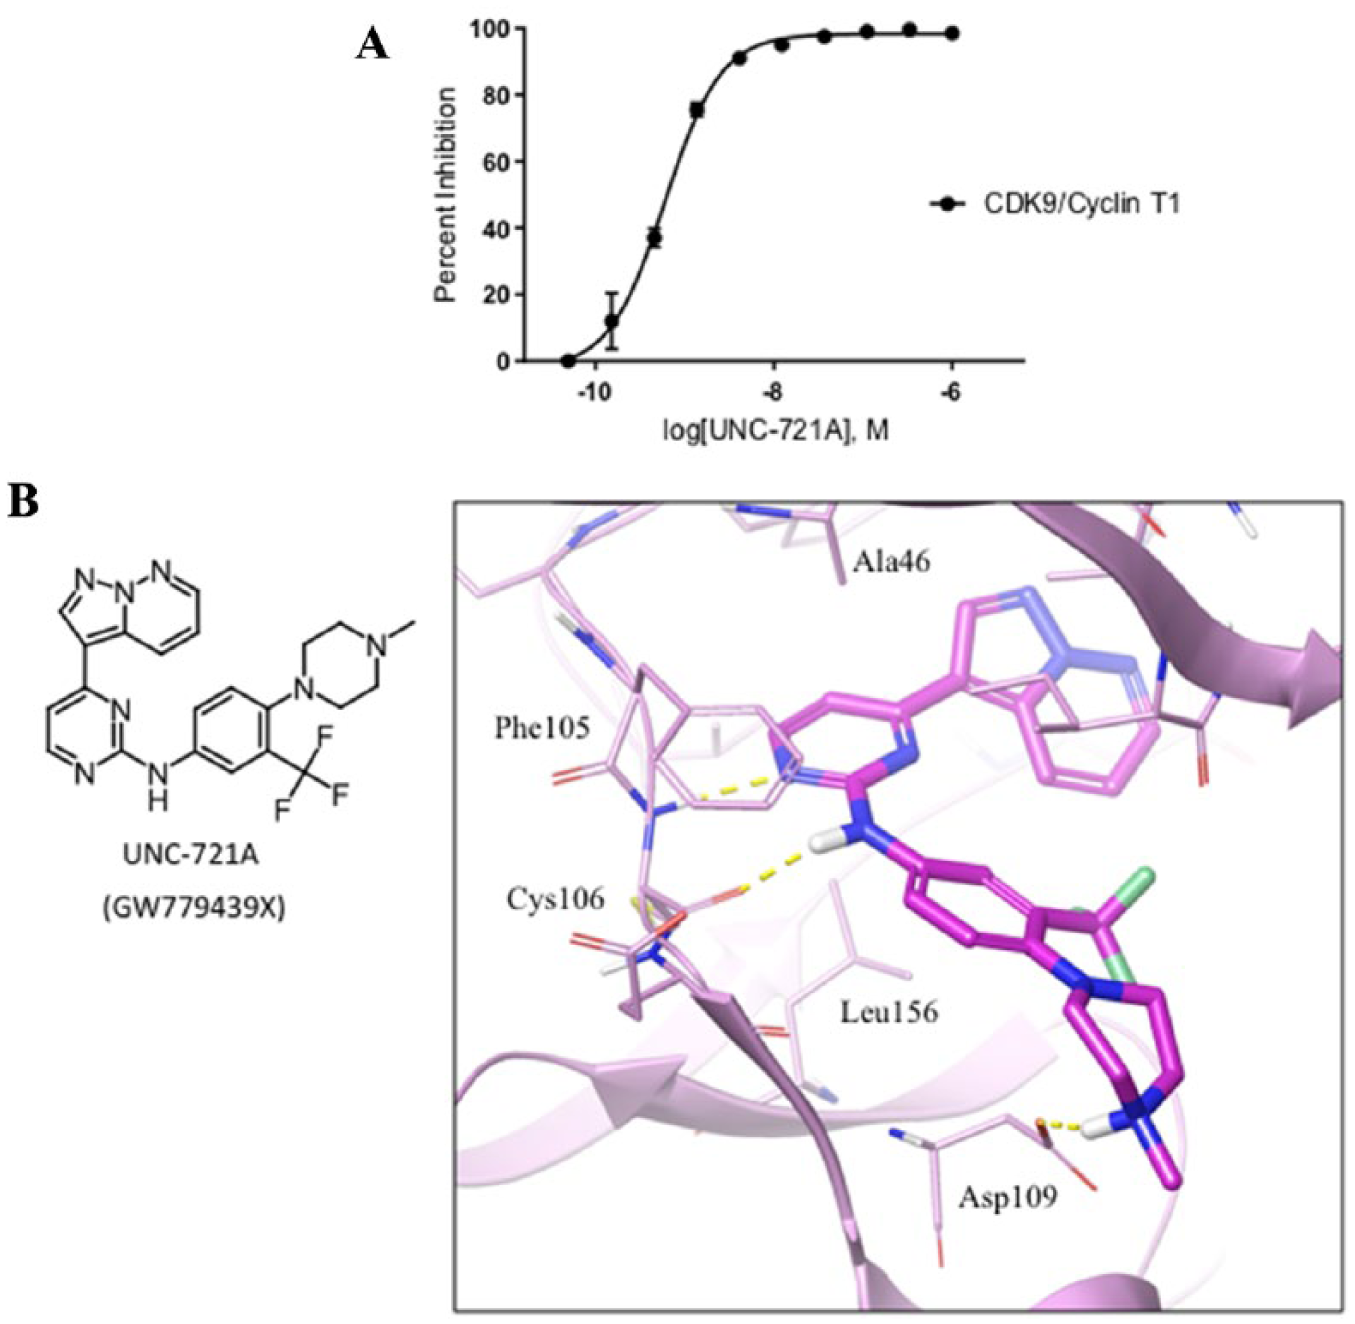
Thermo Fisher SelectScreen kinase assay results and modeling of UNC-721A within the CDK9 active site. (
Kinase Inhibitor Validation
To further examine which of the putative kinases were responsible for the observed growth inhibition by UNC-721A, additional kinase inhibitors were tested for growth effects in 2D format. Specifically, we tested inhibitors of CLK1/4 (ML167), CSNK1δ/ε (PF670462), AURKA (Alisertib), and CDK9 (CDK-IN-2), but only the CDK9 inhibitor was effective in 2D format. Therefore, it was further investigated in 3D co-culture format ( Fig. 6 ). CDK-IN-2 more potently inhibited MiaR/CAF than MiaS/CAF in 2D co-cultures, with IC50 values of 94 + 0.3 nM and 29 + 0.4 nM, respectively ( Fig. 6A ); CDK-IN-2 was further investigated in the 3D format. CDK-IN-2 was also very effective at inhibiting both MiaS and MiaR spheroid growth ( Fig. 6B ), with IC50 values of 610 ± 0.4 nM and 181 ± 0.1 nM, respectively.
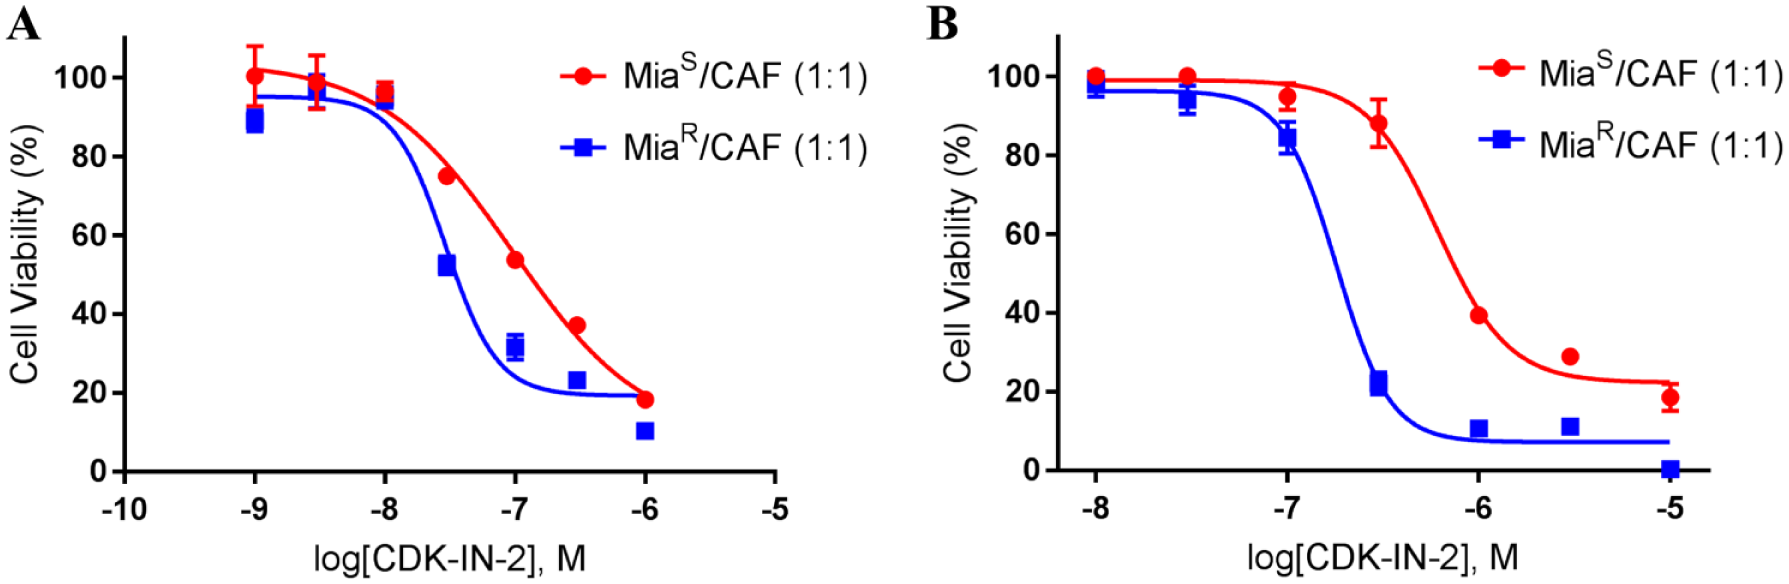
CDK-IN-2 2D and 3D cell viability responses. CDK-IN-2, a selective CDK9 inhibitor, was used to compare the effects on cell growth to that observed with UNC-721A. Cell viability assays were done in both 2D and 3D spheroid format as described above (CellTiter-Glo 3D). The cells consisted of a 1:1 ratio (5000:5000 cells/well) of MiaS or MiaR cells combined with GFP-CAF cells, and they were treated for 72 h and analyzed as above. (
Discussion
Discovering novel compounds that prevent or overcome acquired drug resistance could greatly assist in the development of new treatments for cancer. Pancreatic is one of the most difficult cancers to treat because of the rapid appearance of acquired resistance to cytotoxic agents such as gemcitabine and the limited effectiveness of therapeutic cocktails like Folfirinox. 29 While mutated K-Ras is a well-established target, inhibiting K-Ras itself has proven virtually impossible. Instead, inhibiting known K-Ras-activated kinase pathways has shown promise. 30 However, this requires the full knowledge of the K-Ras-stimulated kinase pathways and the identification of selective inhibitors to them. Even then, many of these targeted approaches may fail due to a lack of inhibitor specificity, resilience of the kinome, or physical properties of the tumor determined by stromal–tumor cell interactions.31,32 Thus, the goal of our study was to apply an integrated proteomics approach to first identify effective kinase inhibitors in an unbiased screen, then to identify their respective kinase targets, and ultimately to evaluate their efficacy in a 3D model of gemcitabine-resistant cells. The results of our studies demonstrate the feasibility of this approach and the successful identification of a compound whose growth inhibitory actions are consistent with inhibition of CDK9.
We developed a gemcitabine-resistant cell line MiaR with the interest of providing a cell model for kinase inhibitor screening. The PKIS-1 library was chosen because of its fairly broad representation of kinase inhibitor classes.7,8 While only three compounds were identified in our screen, this may in part be due to the fact that we screened at a relatively low concentration (50 nM). Two of the compounds (UNC-721A [GW779439X] and UNC10112652A) were structurally similar and reported to be broad CDK inhibitors, whereas the third was reported to be a PLK inhibitor (UNC10112793A). 7 UNC-721A was studied further because it was the only compound that showed inhibitory effects in our 3D cell model. Although consistent with the Nanosyn data showing that UNC-721A inhibited CDK9 and CLK4, our MIB kinome profiling data demonstrated that this compound did not broadly inhibit CDKs as reported. 7 In fact, from the MIB data, UNC-721A appears to be more selective than many CDK inhibitors. 33 The selectivity that we observed may in part due to conditions under which we assayed (i.e., cellular assay with physiological ATP and kinase concentrations).
Additional kinase assays and molecular modeling confirmed that UNC-721A is a potent inhibitor of CDK9. Recent studies have suggested that CDK9 is a promising target, and the “first-in-class” CDK9 inhibitor has been entered into clinical trials. 34 Inhibition of CDK9 and the pTEF complex is expected to block RNA polymerase II-dependent transcription of MCL-1 and other important genes. 35 We also observed weak inhibition of CDK16 and CDK2 in a dose-dependent manner by MIBs, a result consistent with earlier studies. 36 Whether inhibition of CDK16 and CDK2 also contributes to the effects of UNC-721A on cell growth remains to be determined. While we also confirmed potent CLK4 inhibition by UNC-721A, known CLK4 inhibitors had no effects on MiaR growth, either alone or in combination with a CDK9 inhibitor (data not shown).
The effects of UNC-721A were also examined against a panel of purified CDK enzymes using a commercial kinase activity inhibition assay (Thermo Fisher SelectScreen). Consistent with the Nanosyn data, this compound was shown to inhibit multiple CDK kinases under the conditions used in these assays ( Suppl. Fig. S4 ). Although several other CDKs, as well as DYRK1A and CLK4, were inhibited by UNC-721A (as mentioned above), the most potent effects were observed against CDK9 ( Fig. 5A , IC50 0.603 nM). Thus, these results demonstrate that, although not monospecific, UNC-721A is a potent CDK9 inhibitor. Recently, Klaeger et al. demonstrated the efficacy of the kinase inhibitor bead competition assay to profile inhibitor specificity. 37 Interestingly, using this approach our data suggested that UNC-721A was much more selective than suggested by the Nanosyn or the Thermo Fisher data. There are a number of potential explanations for these differences. For one, in our assays, inhibitors were added directly to cells and kinase inhibition determined by MIB binding. This requires that the compounds are cell permeable, are able to compete with physiological intracellular ATP concentrations (>1 mM), and remain tightly bound to the kinase through cell lysis and subsequent analysis. Thus, a potential caveat with our assays is that they may favor tight binding kinase inhibitors. Additionally, if a kinase is not highly expressed in a particular cell type, it may not be detected by the mass spectrometer. This was not the case in our experiments as a large number of CDK kinase peptides were detected in our analysis but were simply not competed off the beads in a dose-dependent manner with UNC-721A. These results suggest that our approach, using inhibitor bead competition assays, may give a more specific profile of the kinase targets for a kinase inhibitor in a given cell type. Based on these considerations, our results suggest that UNC-721A is a more selective kinase inhibitor than indicated by either the Nanosyn or Thermo Fisher data.
There is a large body of literature on methods to form spheroids. 38 While many of these add extracellular matrix (i.e., agar or Matrigel) or other materials, 39 our goal was to develop a minimalistic approach to facilitate the application of spheroids to drug screening platforms. A second goal was to develop a simple co-culture system. Our data suggest that this approach is reproducible in terms of both the time and approximate size of spheroid formation, despite some minor differences in morphology observed. While the MiaS cells formed symmetrical, uniform spheroids, the MiaR cells appeared to form spheroids with uneven distribution of GFP-CAF cells, with the fibroblasts aggregating into clusters throughout the spheroid. These observations suggest that the development of gemcitabine resistance in the MiaR cell line may result in physiological or cell signaling changes that influence the morphology of these cells.
Studies have shown that interactions between tumor and stromal cells can lead to increased drug resistance. 39 Our results confirm the importance of examining drug responses in 3D co-culture models. While our initial screens were performed in a 2D format, only one compound (UNC-721A) remained effective in the 3D models. Importantly, the different IC50 values that we observed between the 2D and 3D models show a clear discrepancy between the commonly used 2D drug screening approach and the more complex 3D models or co-culture methods. Most striking was the shift in drug potency observed when MiaR or MiaS cells were co-cultured with GFP-CAFs in 3D. Thus, 3D cell co-culture models may reflect actual tumor drug responses better and aid in the identification of novel molecules that are ultimately more effective.
A potential issue that could arise from the use of spheroids for drug screening is the permeability of the spheroid to the compounds being testing. As seen in the figures, UNC-721A and gemcitabine both showed reduced potency in the 3D spheroid model. While this could be attributed to a physical form of resistance being developed due to the interactions between the MiaS or MiaR cells and the GFP-CAF cells, this remains to be determined. There is the potential that these compounds are simply less effective at penetrating the spheroids’ outer layer, resulting in more compound being required to achieve the same growth inhibition. Alternatively, changes in cell signaling induced by CAF–tumor cell interactions may also induce mechanisms of resistance or antiapoptosis.
One of the goals of this research was to determine if we could identify a compound that would “synergize” with gemcitabine. The combined treatment of gemcitabine and UNC-721A was examined against both MiaS and MiaR cells to test for potential synergy between these compounds. A single gemcitabine concentration was chosen for each cell line in both the 2D and 3D assays based on the IC50 values found in the 2D/3D cell viability assays for gemcitabine seen in Supplemental Figure S5 . The IC50 values for the gemcitabine treatment on MiaS or MiaR plus GFP-CAFs in 2D format were 6.2 ± 0.3 nM and 24 ± 0.4 nM, respectively. However, an IC50 value was unable to be determined in the 3D assay due to the fact that gemcitabine treatment never obtained >50% inhibition in the 72 h assay. Because of this, a set concentration of 5 µM gemcitabine was chosen and tested in the 3D combination assay of UNC-721A plus gemcitabine in both the MiaS and MiaR spheroids. This allowed for comparisons between the two cell lines and the effects of the combination of the two drugs. However, neither the MiaS or MiaR cell viability responses, alone or in combination with gemcitabine in 2D co-cultures, showed significant enhancement with that observed for UNC-721A alone for the two cell lines ( Suppl. Fig. S6A ). When tested in the 3D co-culture, there was also no significant difference between the gemcitabine-only treatment and the combination of gemcitabine and UNC-721A ( Suppl. Fig. S6B ). Although UNC-721A did not show synergistic inhibitory effects with gemcitabine, this compound was found to be effective at inhibiting gemcitabine-resistant cells, particularly in 3D co-culture models.
In conclusion, our unbiased screen resulted in the discovery of a compound effective against a model of gemcitabine-resistant pancreatic cancer cells. MIB-MS kinome competition experiments identified the major kinase targets inhibited by the compound, with the most significant inhibitory effects consistent with inhibition of CDK9. Lastly, we demonstrate the development and application of a simple co-culture 3D spheroid model, consisting of both a tumor cell line and GFP-CAFs. Based on the shift in UNC-721A potency between the 2D and 3D co-cultures, we concluded that the 3D co-culture spheroids are a good system to further investigate mechanisms of drug resistance. Future studies will further analyze the relationship between the tumor cell lines and GFP-CAFs to better understand the cellular interactions that contribute to the progression of drug resistance.
Supplemental Material
DS_773045 – Supplemental material for Application of Integrated Drug Screening/Kinome Analysis to Identify Inhibitors of Gemcitabine-Resistant Pancreatic Cancer Cell Growth
Supplemental material, DS_773045 for Application of Integrated Drug Screening/Kinome Analysis to Identify Inhibitors of Gemcitabine-Resistant Pancreatic Cancer Cell Growth by Linas J. Krulikas, Ian M. McDonald, Benjamin Lee, Denis O. Okumu, Michael P. East, Thomas S. K. Gilbert, Laura E. Herring, Brian T. Golitz, Carrow I. Wells, Allison D. Axtman, William J. Zuercher, Timothy M. Willson, Dmitri Kireev, Jen Jen Yeh, Gary L. Johnson, Antonio T. Baines, and Lee M. Graves in SLAS Discovery
Footnotes
Acknowledgements
We are grateful to the staff of UNC Michael Hooker Proteomics Core Facility for their help with running samples, and data acquisition and analyses. We are thankful to the Structural Genomics Consortium for supplying their inhibitor library and providing technical support. We would also like to thank the National Institutes of Health (R01 CA199064 and U01-MH104999-01), the Triangle Center for Evolutionary Medicine (L.M.G. and A.T.B.), and the UNC University Cancer Research Fund (L.M.G.) for their support of this research.
Supplemental material is available online with this article.
Declaration of Conflicting Interests
The authors declared no potential conflicts of interest with respect to the research, authorship, and/or publication of this article.
Funding
The authors received no financial support for the research, authorship, and/or publication of this article.
References
Supplementary Material
Please find the following supplemental material available below.
For Open Access articles published under a Creative Commons License, all supplemental material carries the same license as the article it is associated with.
For non-Open Access articles published, all supplemental material carries a non-exclusive license, and permission requests for re-use of supplemental material or any part of supplemental material shall be sent directly to the copyright owner as specified in the copyright notice associated with the article.