
Abstract
The application of multiplexed imaging technologies in phenotypic drug discovery (PDD) enables profiling of complex cellular perturbations in response to drug treatment. High-content analysis (HCA) is among the most pursued approaches in PDD, with a proven capability to identify compounds with a given cellular mechanism of action (MOA), as well as to unveil unexpected drug cellular activities. The ability of fluorescent image-based cytometric techniques to dissect the phenotypic heterogeneity of cell populations depends on the degree of multiplexing achievable. At present, most high-content assays employ up to four cellular markers separately detected in distinct fluorescence channels. We explored the possibility to increase HCA multiplexing through analysis of multiple proliferation markers in the same fluorescence channel by taking advantage of the different timing of antigen appearance during the cell cycle, or differential intracellular localization. Simultaneous analysis of DAPI staining and five immunofluorescence markers (BrdU incorporation, active caspase-3, phospho-histone H3, phospho-S6, and Ki-67) resulted in the first six-marker high-content assay readily applicable to compound MOA studies. This approach allows detection of rare cell subpopulations, unveiling a high degree of phenotypic heterogeneity in exponentially growing cell cultures and variability in the individual cell response to antiproliferative drugs.
Keywords
Introduction
Genetic and epigenetic heterogeneity of tumors is strongly implicated in drug resistance.1–3 Cancer is believed to originate from a single cell, which accumulates a series of genetic alterations leading to uncontrolled proliferation and progresses through distinct histopathological stages. Simplistically, two alternative models of cancer evolution have been proposed: one model takes into account a stochastic origin of phenotypically distinct subpopulations, some of them eventually resistant to anticancer therapies and able to give relapse of the disease.4,5 The hierarchical model, on the contrary, contemplates the existence of the so-called cancer stem cells or tumor-initiating cells, which possess undefined proliferative capability and are intrinsically resistant to conventional chemotherapy6,7; some hybrid theories postulate a stochastic origin of cancer stem cells.8,9 The validity of both models is still debated,6,7,10,11 but experimental evidence supports the clonal origin of tumors. The appearance of intratumor genetic heterogeneity in later stage cancers implies that evolutive pressure operates to select for successful cell phenotypes arising, or already present, within the tumor mass. 2
Primary cancer cells are considered models more closely recapitulating the complexity of the real disease, as compared with cancer cell lines, and are being increasingly exploited in cancer biology. Nevertheless, cancer cell lines, which are clonally derived by definition, still represent valuable models for in vitro and in vivo studies and for oncology drug discovery purposes.
It is common experience to observe phenotypic heterogeneity in cultures of genetically identical cells.1,12 Some studies12–14 have sought to address the origin of phenotypic heterogeneity in clonal cell populations in vitro, identifying, among the causes, stochastic gene expression fluctuations in individual cells (“genetic and epigenetic noise”). In addition to “intrinsic” factors, the initiation of a phenotypic switch in clonal cell populations in vitro could also be ascribed to “extrinsic” factors, such as the local cell density or the frequency of cell-cell contacts. 13 According to the hierarchical model, stem cell–like cancer cells can be found in cancer cell line populations,15,16 thus adding a further level of complexity. Besides stochastic factors affecting gene expression of genetically identical cells, it is known that cancer cell lines are characterized by aneuploidy and genetic instability, which cause the appearance of diverse genetic variants at each cell division and, eventually, heterogeneous cell populations.17,18 The extent of genetic instability in cancer cell lines can be inferred, for example, from the recent complete genomic and transcriptomic characterization of the most widely used cell line, HeLa. 19 The results unveiled extensive genomics rearrangements, which result in a high level of aneuploidy, numerous chromatin structural variants, and different expression patterns from those in normal human tissues.
Breaking down the phenotypic heterogeneity of in vitro tumor cell populations would therefore appear essential to increase our understanding of cancer biology and to study individual cell response to anticancer drugs. The identification of rare in vitro subpopulations, which reflect different phenotypic conditions, largely rely on the use of multiplexed cytometric techniques, including flow and stationary (image-based) cytometry, usually defined as “high-content screening” (HCS). Fluorescence-based HCS assays usually employ fluorescent dyes, antibodies, or fluorescent proteins to detect molecular markers or to report complex cellular processes. Arguably, the greater the number of independent markers that can be evaluated simultaneously, the higher the probability of identifying phenotypically distinct subpopulations.
Recent highly multiplexed flow cytometry approaches take advantage, for example, of the use of Zenon antibody labeling reagents, 20 quantum dots, 21 semiconducting polymer dots, 22 inductively coupled plasma–mass spectrometry detection, 23 or imaging flow cytometers such as the Amnis (Seattle, WA) ImageStream system. 24 The number of independent cellular markers that can be simultaneously analyzed by immunostaining with these approaches is strikingly high, reaching tens of parameters in some cases, but all require detachment of adherent cells and do not allow restaining and reanalysis of samples. Moreover, no information is retained on the adherent morphology of cells or cell position–associated data (e.g., the local cell density). It is known that the local environment and cell-cell interactions greatly influence the individual cell phenotype of in vitro cell cultures 25 : the knowledge of this kind of information appears to be relevant to provide further insight on the origin and consequences of phenotypic heterogeneity.
HCS is particularly suited for multiparameter cell population studies and allows, in addition to specific marker-related parameters, collection of morphology and positional data at the single cell level.26,27 Most commercial HCS platforms are able to simultaneously acquire up to four fluorescence channels, but they are rarely employed together in a single acquisition. Consequently, image-based phenotypic assays described in literature usually employ up to three or four markers acquired in different fluorescence channels, each dedicated to one distinct probe.27–29 Some approaches have been described to increase multiplexing of image-based analyses, including sequential antibody staining and de-staining protocols30,31 or multicolor imaging and generation of pseudo-channels. 32 However, these methods need laborious staining protocols or image analysis procedures and are not easily applicable in screening contexts. To date, no high-content assays applicable to screening contexts have been described for the simultaneous analysis of more than four independent markers. For immunofluorescence-based assays, a further increase of multiplexing is often limited by technical constrains linked to fluorescence signal crosstalk or to the availability of primary antibodies from different species suitable for combination.
We present here a novel approach to increase multiplexing in HCS: multiple markers were probed in a single fluorescence channel, taking advantage of the different timing of antigen appearance during the cell cycle or differential intracellular localization. Combining anti–5-bromo-2′-deoxyuridine (BrdU) and anti–phospho-histone H3 immunofluorescent detection in the same fluorescence channel, we succeeded in the identification of S phase and mitotic cells using a single fluorescence channel. Moreover, the proliferation markers Ki-67 and phospho-S6 ribosomal protein were combined in the same channel and separately detected, exploiting their different intracellular localizations (nuclear speckles and cytoplasm, respectively).
Histone H3 phosphorylation (Ser10) and BrdU incorporation are well-established markers of mitosis and active S phase, respectively; we previously described a quadruple staining approach for simultaneous analysis of DNA content (4,6-diamidino-2-phenylindole [DAPI]), BrdU incorporation, cyclin B1 expression, and histone H3 phosphorylation using nuclease treatment prior to BrdU immunostaining. 28 Ki-67 and phospho-S6 (Ser235/236) are markers for cell proliferation: both are detected in all active phases of the cell cycle and disappear in quiescent cells. 33 Ki-67 function is associated with ribosomal RNA synthesis, 34 whereas S6 protein plays a role in protein synthesis, as it is phosphorylated by kinases downstream of the Akt/mTOR pathway and couples cell growth with cell cycle progression. 35 These four markers (p-H3, BrdU, Ki-67, and p-S6) were further combined with a DNA dye (DAPI) and anti–cleaved caspase-3 antibody staining, a specific marker for apoptotic cells, in two additional fluorescence channels, resulting in the first six-marker high-content assay readily applicable to compound mechanism-of-action studies.
The highly multiplexed phenotypic assay described here was validated and employed to investigate the proliferative heterogeneity of asynchronously growing populations of the osteosarcoma cell line U-2 OS and of the cervix carcinoma cell line HeLa. We report phenotypic high-content fingerprints for different cell cycle phases and show that they are reproducible and consistent with cellular morphology. Surprisingly, our data demonstrate that individual cells with different proliferative capability, as revealed by Ki-67 and p-S markers, exist in all cell cycle phases of asynchronous cell populations. Moreover, cellular perturbations induced by four antiproliferative compounds with distinct mechanism of action (nocodazole, hydroxyurea, the PI3K inhibitor LY-294,002, and the Aurora kinases inhibitor PHA-739358 36 ) were studied as proof of concept for the application of this six-marker phenotypic assay in phenotypic drug discovery.
Materials and Methods
Antibodies and Reagents
Polyclonal goat anti–cleaved caspase-3 antibody (h176) was purchased from Santa Cruz Biotechnology (Santa Cruz, CA); polyclonal rabbit anti–human Ki-67 antibody was purchased from Abcam (Cambridge, UK); polyclonal rabbit anti–phospho-S6 (Ser235/236), monoclonal murine anti–phospho-histone H3 (Ser10), and polyclonal rabbit anti–phospho-histone H3 (Ser10) antibodies were obtained from Cell Signaling Technology (Danvers, MA); anti-BrdU murine monoclonal antibody and nuclease reagent were provided within the Cell Proliferation Fluorescence Kit (GE Healthcare, Little Chalfont, Buckinghamshire, UK); Cy2-conjugated anti–goat immunoglobulin G (IgG), Cy3-conjugated anti–rabbit IgG, and Cy5-conjugated anti–mouse IgG AffiniPure donkey antibodies were purchased from Jackson ImmunoResearch (Newmarket, Suffolk, UK); BrdU, DAPI, LY-294,002 hydrochloride (LY), hydroxyurea, nocodazole, 37 wt. % formaldehyde solution, and Triton X-100 were obtained from Sigma-Aldrich (St. Louis, MO). The Aurora kinase inhibitor PHA-739358, previously described, 36 was synthesized at Nerviano Medical Sciences (Nerviano, Italy).
Cell Cultures and Treatments
The osteosarcoma cell line U-2 OS, obtained from the American Type Culture Collection (ATCC, Manassas, VA), was grown in McCoy’s medium (Gibco/Life Technologies, Gaithersburg, MD) supplemented with 10% (v/v) heat-inactivated fetal bovine serum (FBS) (Life Technologies, Carlsbad, CA), 2 mM L-glutamine, 100 U/mL penicillin, and 100 mg/mL streptomycin. The cervix carcinoma cell line HeLa, obtained from the European Collection of Cell Cultures (ECACC, Porton Down, UK), was cultured in Eagle’s minimum essential medium with Earle’s balanced salt solution (Gibco/Life Technologies) supplemented with 10% (v/v) heat-inactivated FBS (Life Technologies), 2 mM L-glutamine, 1% nonessential amino acids, 100 U/mL penicillin, and 100 mg/mL streptomycin. Cells were maintained at 37 °C in a humidified atmosphere with 5% CO2 by passing three times a week. Cell line identities were verified by short tandem repeat (STR) profiling using the 16 loci AmpFlSTR Identifiler Direct PCR Amplification Kit (Applied Biosystems/Life Technologies, Carlsbad, CA). High-content analysis experiments were performed in 96-well microplates, seeding cells at a density of 8000/well in black clear-bottom plates (µClear; Greiner Bio-One, Frickenhausen, Germany) overnight before treatments. Compound treatments were performed at the indicated concentrations for 4 h (LY-294,002) or for 20 h (nocodazole, hydroxyurea, and PHA-739358). BrdU 50 µM was added to all samples for the indicated incubation times at the end of treatments and at least for 30 min before fixation.
Fluorescence Immunocytochemistry
For immunofluorescence staining, cells were fixed for 30 min by adding 100 µL formaldehyde 7.4% solution to 100 µL medium to minimize cell detachment, and then cells were washed with phosphate-buffered saline (PBS) and permeabilized with PBS solution containing 0.1% Triton X-100 and 1% bovine serum albumin (BSA; staining solution) for 30 min. Single, double, and triple immunofluorescences were performed as already described. 28 Briefly, primary antibodies were added together at the recommended dilution in staining buffer and incubated for 1 h at 37 °C. Anti-BrdU antibody was diluted 1:100 in nuclease solution (GE Healthcare). Primary antibodies solution was removed, cells were washed twice with PBS, and secondary antibodies were added in staining solution containing 1 µg/mL DAPI. After incubation for 1 h at 37 °C, cells were washed twice with PBS, and 200 µL PBS was left in each well. Five-marker immunofluorescence was performed by adding together anti–cleaved caspase-3 (1:50), anti–Ki-67 (1:50), and anti–phospho-S6 (1:100) antibodies in staining buffer, followed by incubation overnight at 4 °C. The first antibody solution was removed, and anti-BrdU antibody diluted 1:100 in nuclease solution (GE Healthcare) was added together with anti–phospho-histone H3 (1:100). Cells were incubated at 37 °C for 1 h and washed twice with PBS, and secondary anti–goat, anti–rabbit, and anti–mouse IgG antibodies were added together in staining buffer containing 1 µg/mL DAPI. After incubation for 1 h at 37 °C, cells were washed twice with PBS, and 200 µL PBS was left in each well. All liquid handling was performed using a Biomek 2000 robotic station (Beckman Coulter, Fullerton, CA).
Image Acquisition and High-Content Analysis
The ArrayScan VTI High Content Screening reader (Thermo Fisher Scientific, Pittsburgh, PA) was used to perform single-cell multiplexed immunofluorescence analysis. The platform is based on an inverted epifluorescence microscope (Zeiss, Thornwood, NY) equipped with a motorized stage, which automatically scans fields in microplates. For each field, four fluorescence signals (blue, green, red, and far-red) were collected with a 10× objective by exposing samples for fixed times and stored in four channels (Ch1, Ch2, Ch3, and Ch4, respectively). At least 20 fields were scanned per well and automatically analyzed within a single measurement by means of the Compartmental Analysis V3 BioApplication software (Thermo Fisher Scientific), which allows quantitative analysis of multiple phenotypic parameters at the single-cell level, including nuclear area and shape, DNA content (DAPI intensity), total and average fluorescence intensity in the nuclear and cytoplasmic compartments, and count and analysis of nuclear and cytoplasmic spots.
Imaging Statistical Data Analysis
Two-dimensional dot plots and fluorescence distribution histograms were generated using Excel software (Microsoft, Redmond, WA). The entire fluorescence range (1–4095) of ArrayScan data was subdivided into 200 bins. Three-dimensional plots, hierarchical cluster analysis, heat map visualizations, and multidimensional analyses of cell subpopulations were performed using SpotFire software (Tibco, Palo Alto, CA). Up to 17 cellular parameters (
Results
High-Content Analysis of Multiple Markers in a Single Fluorescence Channel: Method Setup and Validation
Two adherent cancer cell lines, U-2 OS and HeLa, were used as experimental models to set up a multiparameter phenotypic assay for cell cycle and cell proliferation studies. We explored the technical feasibility of analyzing two independent cellular markers using a single fluorescence channel with the ArrayScan HCS reader. The strategy followed in the present study is depicted in Figure 1 .
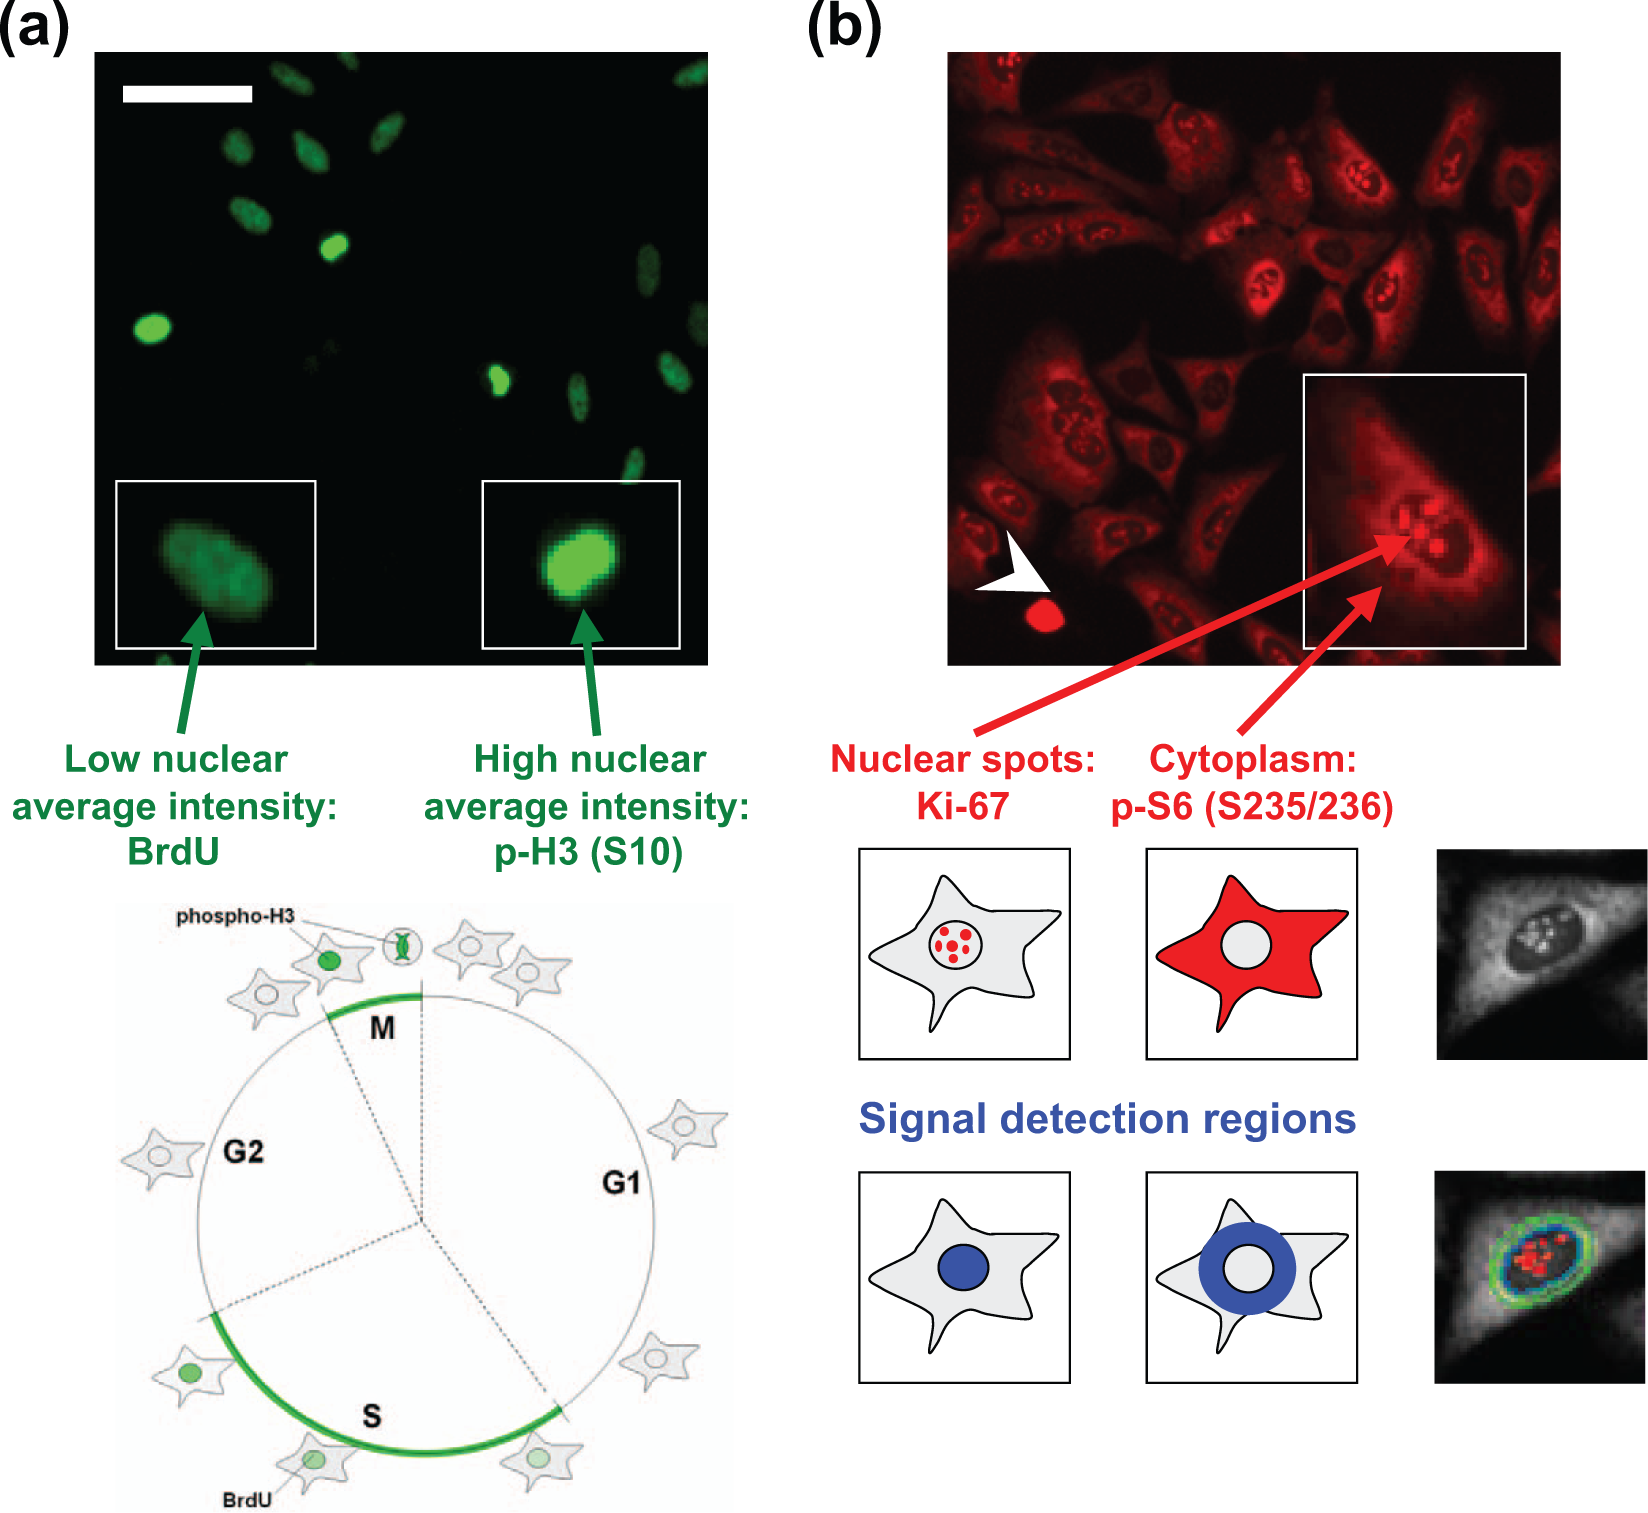
Immunostaining and high-content analysis of multiple markers in a single fluorescence channel. (
Cells were seeded in 96-well plates, exposed to 50 µM BrdU for 30 min, and then stained with a mixture of murine phospho-histone H3 (ser10) and murine anti-BrdU antibodies, subsequently revealed with the same Cy5-conjugated anti–mouse secondary antibody ( Fig. 1a ). We previously demonstrated that, to maintain cell morphology integrity, immunofluorescence detection of BrdU incorporation together with additional markers is possible using a nondestructive staining procedure based on nuclease treatment. 28 Mitotic and S phase cells can be respectively identified through detection of BrdU and p-H3 signals in the same fluorescence channel, taking advantage of their appearance in different cell cycle phases and exploiting their different nuclear average signal (low for BrdU, high for p-H3) and nuclear morphology. Immunostaining for BrdU and p-H3 is therefore mutually exclusive: no cell can be double positive if BrdU is administered for a sufficiently short time before fixation to prevent cells that incorporated BrdU from entering mitosis.
Another approach exploited for double marker staining takes advantage of the different subcellular localization of markers. Figure 1b shows a representative image of U-2 OS cells stained with rabbit anti–Ki-67 and rabbit p-S6 (Ser235/236) antibodies, followed by Cy3-conjugated secondary anti–rabbit antibodies. These two well-characterized proliferation markers localize in distinct subcellular compartments in interphase cells if nuclear envelope integrity is not compromised: p-S6 signal is found only in the cytoplasm, whereas Ki-67 localizes within the nucleus in a cell cycle–dependent manner. During early G1, Ki-67 forms a large number of discrete foci throughout the nucleoplasm, whereas during late G1, S, and G2 phases, it is located in the nucleolus. 38 Both conditions equally appear as nuclear speckles, easily quantifiable by high-content analysis of the nuclear compartment defined by DAPI staining. Phospho-S6 signal can be quantified by ArrayScan image analysis algorithms through definition of a cytoplasmic region of interest defined by a ring expanded outside the nuclear compartment. Nuclear envelope integrity is compromised in two defined cellular conditions: mitosis and cell death, including apoptosis. In these conditions, Ki-67 and p-S6 are no longer spatially segregated, and there is no possibility to selectively discriminate their specific signals if acquired in the same fluorescence channel. For this reason, it is necessary to develop a hierarchical cell classification approach to immediately define mitotic and dead (necrotic or apoptotic) cells using specific phenotypic markers such as phospho-histone H3, active caspase-3, DNA content, and nuclear morphology. Therefore, all remaining interphase cells are suitable for Ki-67 and phospho-S6 analysis.
We demonstrate the technical feasibility of double anti-BrdU and anti–p-H3 immunofluorescence analysis using the same secondary antibody by independent co-localization of the p-H3 signal. Figure 2a shows a representative field of asynchronously growing U-2 OS cells pulsed for 30 min with 50 µM BrdU and stained with a mixture of murine anti–p-H3, murine anti-BrdU, and rabbit anti–p-H3 antibodies, subsequently revealed with Cy5-conjugated anti–mouse and Cy2-conjugated anti–rabbit antibodies. Biparametric analysis of Cy2 and Cy5 fluorescence intensity revealed three cell clusters, as exemplified in Figure 2b : the mean fluorescence intensities (MFIs) of Cy2/Cy5 double-negative cells (A, B, and C), putatively BrdU–/p-H3–, are around 5 and 20, respectively. Cells G, H, and I, double Cy2/Cy5 double positives (MFIs around 120 and 1000, respectively), represent mitotic p-H3+ cells. Cells D, E, and F are negative for Cy5 staining (average MFI: 5) and show an intermediate Cy2 fluorescence intensity (average MFI: 250): the cells of this last cluster are surely p-H3– and, therefore, by exclusion, represent S phase cells BrdU+. An identical experiment was conducted using HeLa cells, with similar results (not shown). These results confirm that, by carefully selecting low and high thresholds for Cy5 intensity values, it is possible to discriminate p-H3+ from BrdU+ cells acquired with the same secondary fluorescent antibody simply on the basis of their different nuclear average fluorescence intensity.
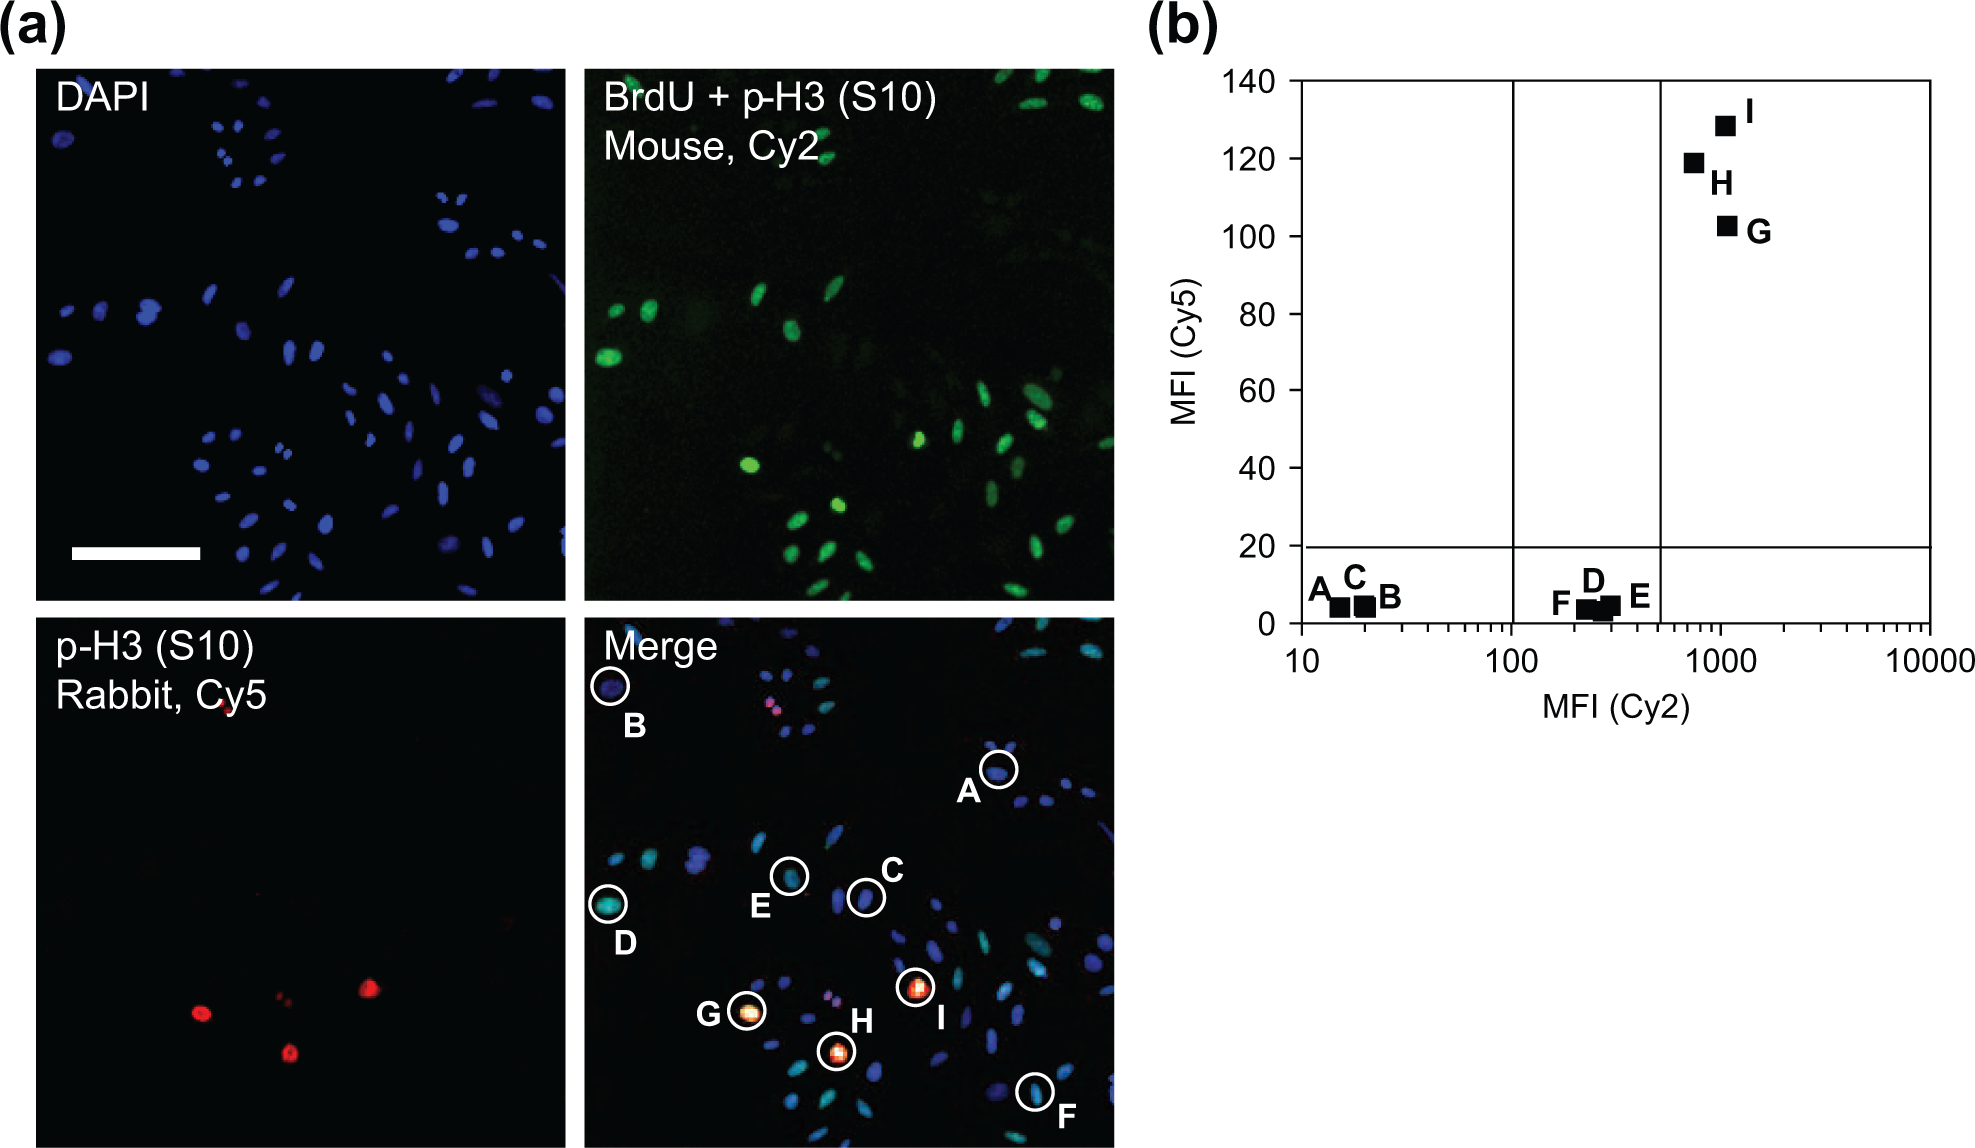
Validation of anti–5-bromo-2′-deoxyuridine (BrdU) and anti–phospho-histone H3 double staining in the same fluorescence channel. (
We next investigated the effect of different BrdU pulse times on the reciprocal distributions of BrdU+ and p-H3+ cells acquired in a single fluorescence channel.
As expected for longer BrdU incubation times, cells incorporate higher BrdU amounts during the S phase, resulting in increased MFI of BrdU positively stained cells and artifactual overestimation of p-H3+ cells, which actually are bright BrdU+ cells. Collectively, these data demonstrate that only a short BrdU pulse (30 min) allows accurate double BrdU/p-H3 quantification with the staining protocol developed.
The two-channel DAPI/BrdU/p-H3 assay was validated treating cells with cell cycle inhibitors to verify that drug-induced cell cycle perturbations could be correctly detected. We cultured U-2 OS cells in the presence of hydroxyurea (HU), used to induce cell cycle arrest at the G1/S border, or nocodazole (Noc) to block cells in mitosis. Cells were seeded in 96-well plates in replicate and left untreated (Ctrl) or alternatively treated for 20 h with 10 mM HU or 0.1 µM Noc. Cells were fixed after a 30-min BrdU pulse and then processed as described and analyzed with the ArrayScan HCS reader. DNA content distribution histograms obtained from DAPI fluorescence confirmed specific cell cycle arrest with the two drugs ( Fig. 3 ). Representative results from biparametric analyses of DAPI together with single anti-BrdU and anti–p-H3 immunostaining, or a mixture of them, are also reported in Figure 3 . The fluorescence patterns of untreated controls clearly appear perturbed by treatments: at the doses investigated, HU completely abrogated BrdU and p-H3 fluorescence signals, whereas Noc induced a decrease of BrdU+ cells (from 33.7% to 16.6%) and markedly increased p-H3+ cells (from 1.9% to 13.3%) and G2 phase, according to its mechanism of action as a mitotic inhibitor.
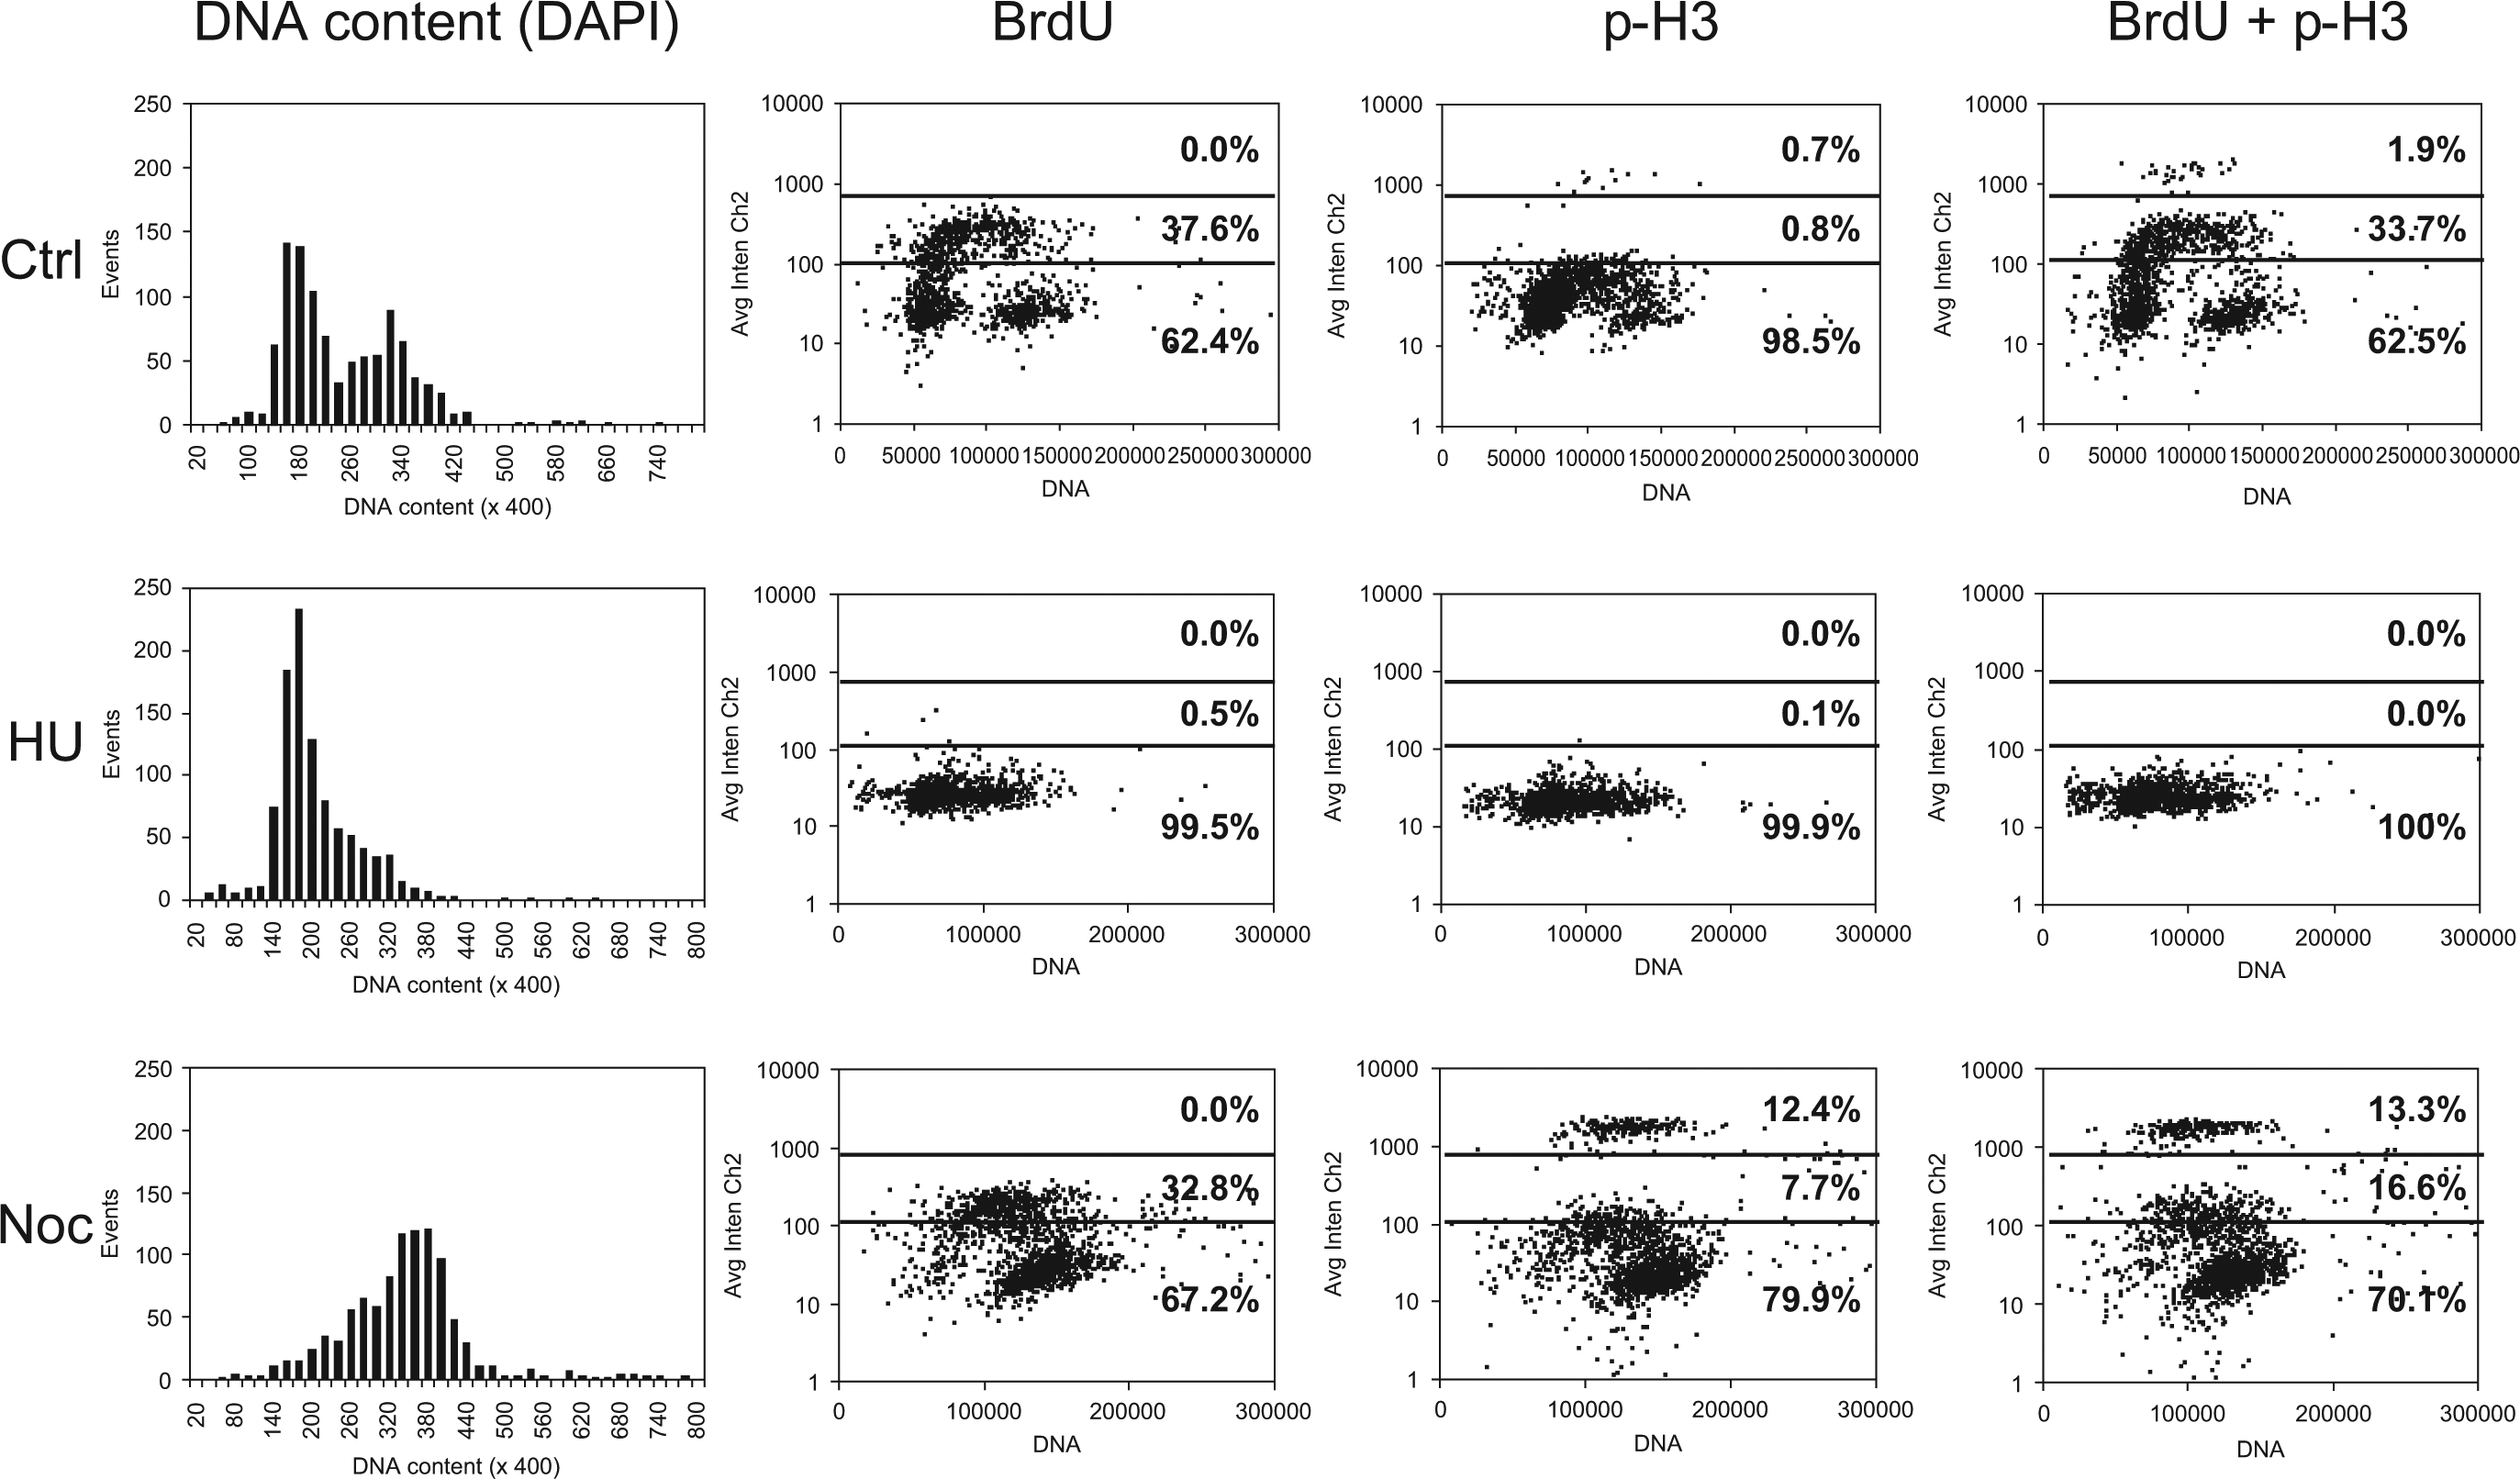
Biparametric analysis of DNA content versus 5-bromo-2′-deoxyuridine (BrdU) and p-H3 fluorescence of U-2 OS treated with 10 mM hydroxyurea (HU) or 0.1 µM nocodazole (Noc) for 20 h. Untreated cells (Ctrl) and cells treated with HU or Noc were stained with DAPI and the distributions of nuclear total fluorescence intensity (proportional to DNA content) were reported in the left histograms. DAPI fluorescence range was subdivided into 200 bins. After a 30-min BrdU pulse, cells were stained with anti-BrdU and anti–phospho-histone H3 antibodies, separately or in combination. Nuclear average fluorescence intensity values (AvgIntenCh2) associated with BrdU and phospho-histone H3 were acquired in the same fluorescence channel (Cy5) and reported as dot plot versus DAPI fluorescence (right graphs). Two arbitrary thresholds (dotted lines) were applied to Cy5 fluorescence to determine negative cells; positively stained cells (intermediate intensity), corresponding to BrdU+ cells; and positively stained cells (high intensity), corresponding to p-H3+ cells. At least 1400 cells were scored to create the dot plots; the percentage of cells in each sector was calculated and reported within the graphs.
Development of a Six-Marker High-Content Assay for Proliferation Studies
Anti-BrdU and anti–phospho-histone H3 (Ser10) antibodies were further combined with anti–phospho-S6 (Ser235/236), anti–Ki-67, and anti–active caspase-3 antibodies and DAPI to develop a six-marker high-content assay following the protocol described in the Materials and Methods.
Combining Ki-67, p-S6, BrdU, p-H3, and active caspase-3 staining, various cell phenotypes emerged, as exemplified in Figure 4 . As mitotic and apoptotic cells can be easily identified, interphase cells present instead complex patterns of BrdU, Ki-67, and p-S6 staining: the majority of interphase cells are actively proliferating (p-S6+/Ki-67+), and a small fraction of them are resting (p-S6–/Ki-67–). Surprisingly, rare p-S6+/Ki-67– or p-S6–/Ki-67+ cells can be observed within both BrdU+ and BrdU– subpopulations. The level of accuracy of the multiplexed assay developed, corroborated by visual inspection of individual cells, allows us to exclude any staining artifacts for these rare phenotypes.
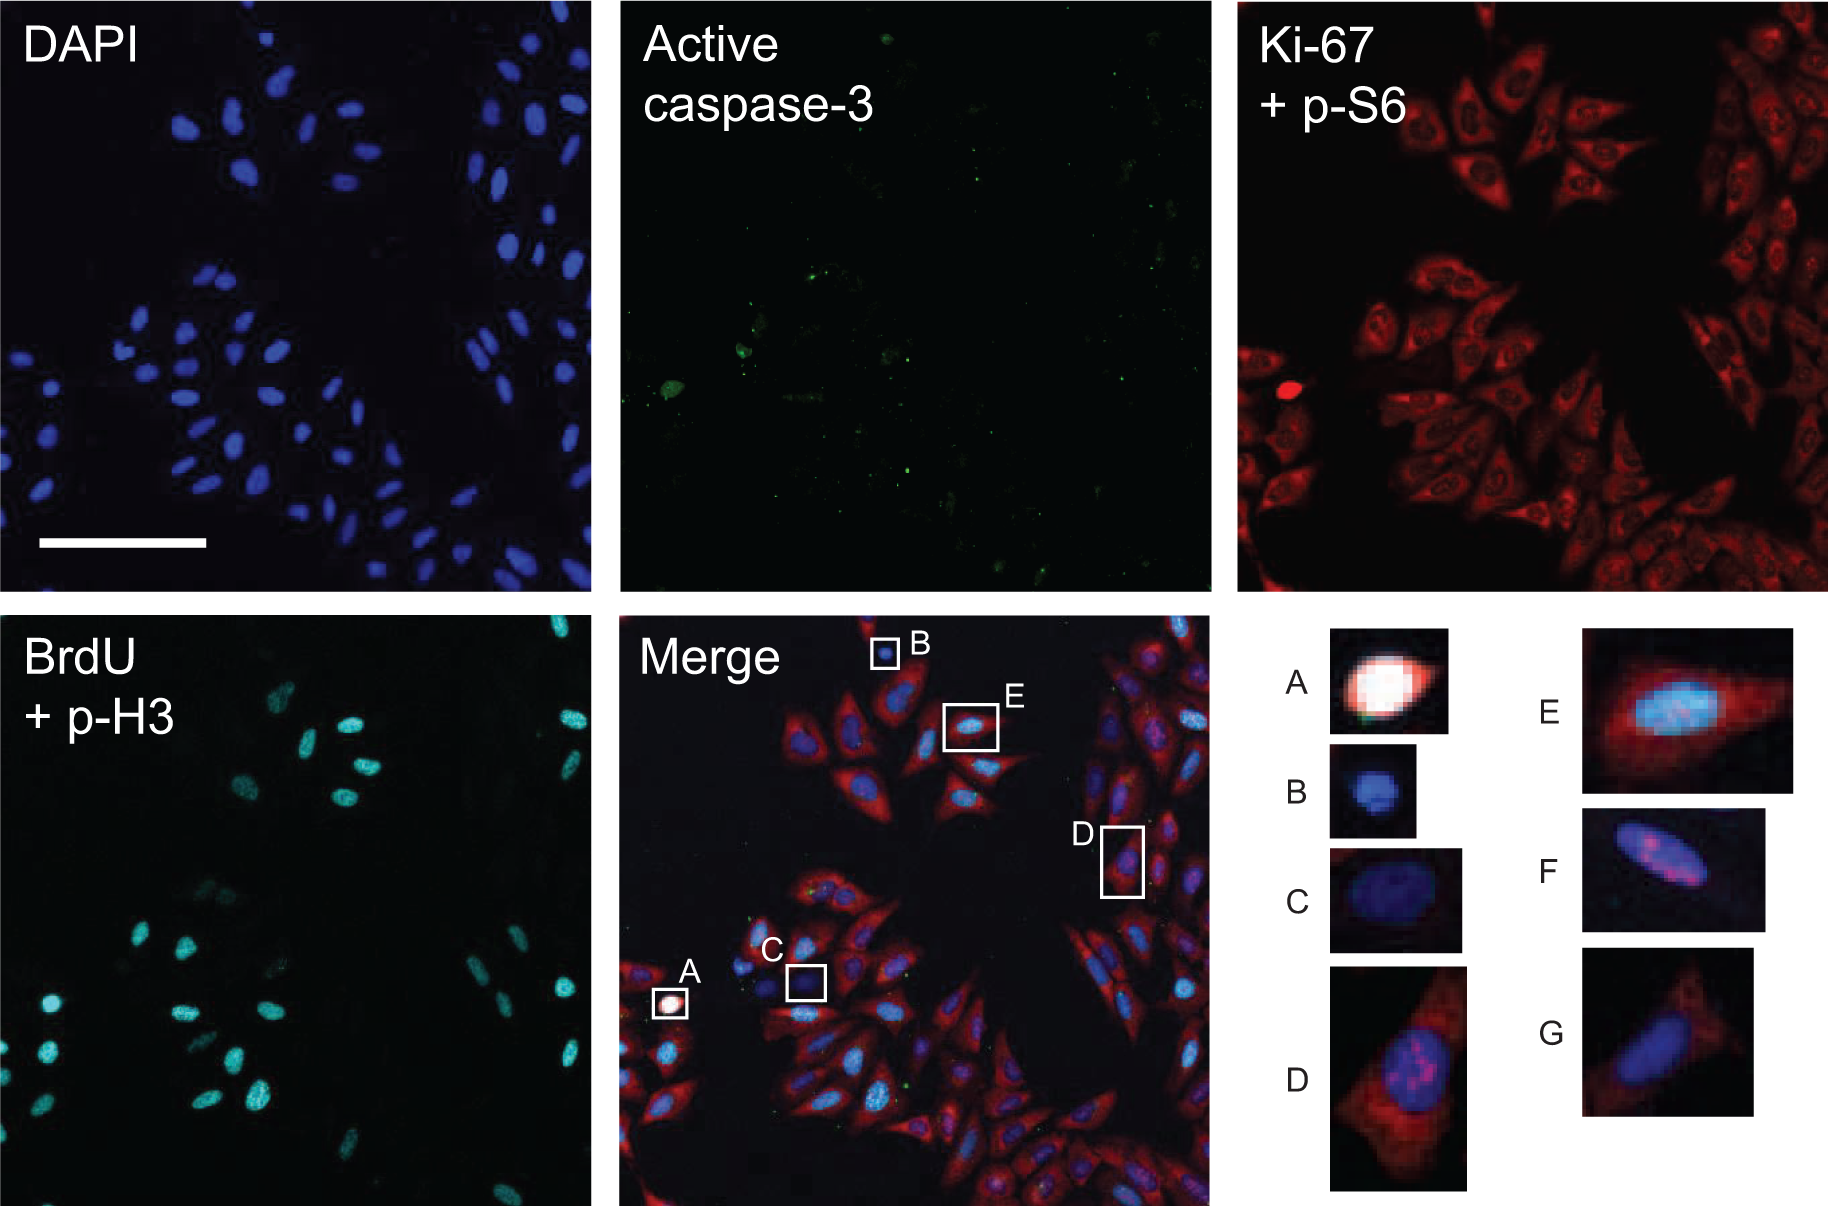
Representative field of asynchronously growing U-2 OS cells subjected to six-parameter staining procedure and image acquisition with the ArrayScan HCS reader in four fluorescence channels: DAPI (blue), active caspase-3 (Cy2, green), Ki-67 plus phospho-S6 (Cy3, red), and 5-bromo-2′-deoxyuridine (BrdU) plus phospho-histone H3 (Cy5, far-red). Different cell phenotypes can be visually identified in this representative field. A: mitotic; B: apoptotic; C: G0 phase (Ki-67–/p-S6–/BrdU–/p-H3–); D: G1 phase (Ki-67+/p-S6+/BrdU–/p-H3–); and E: active S phase (Ki-67+/p-S6+/BrdU+/p-H3–). Cells F and G, not present in the field shown, are representative of Ki-67+/p-S6– (F) and Ki-67–/p-S6+ resting cells (G). Bar: 100 µm.
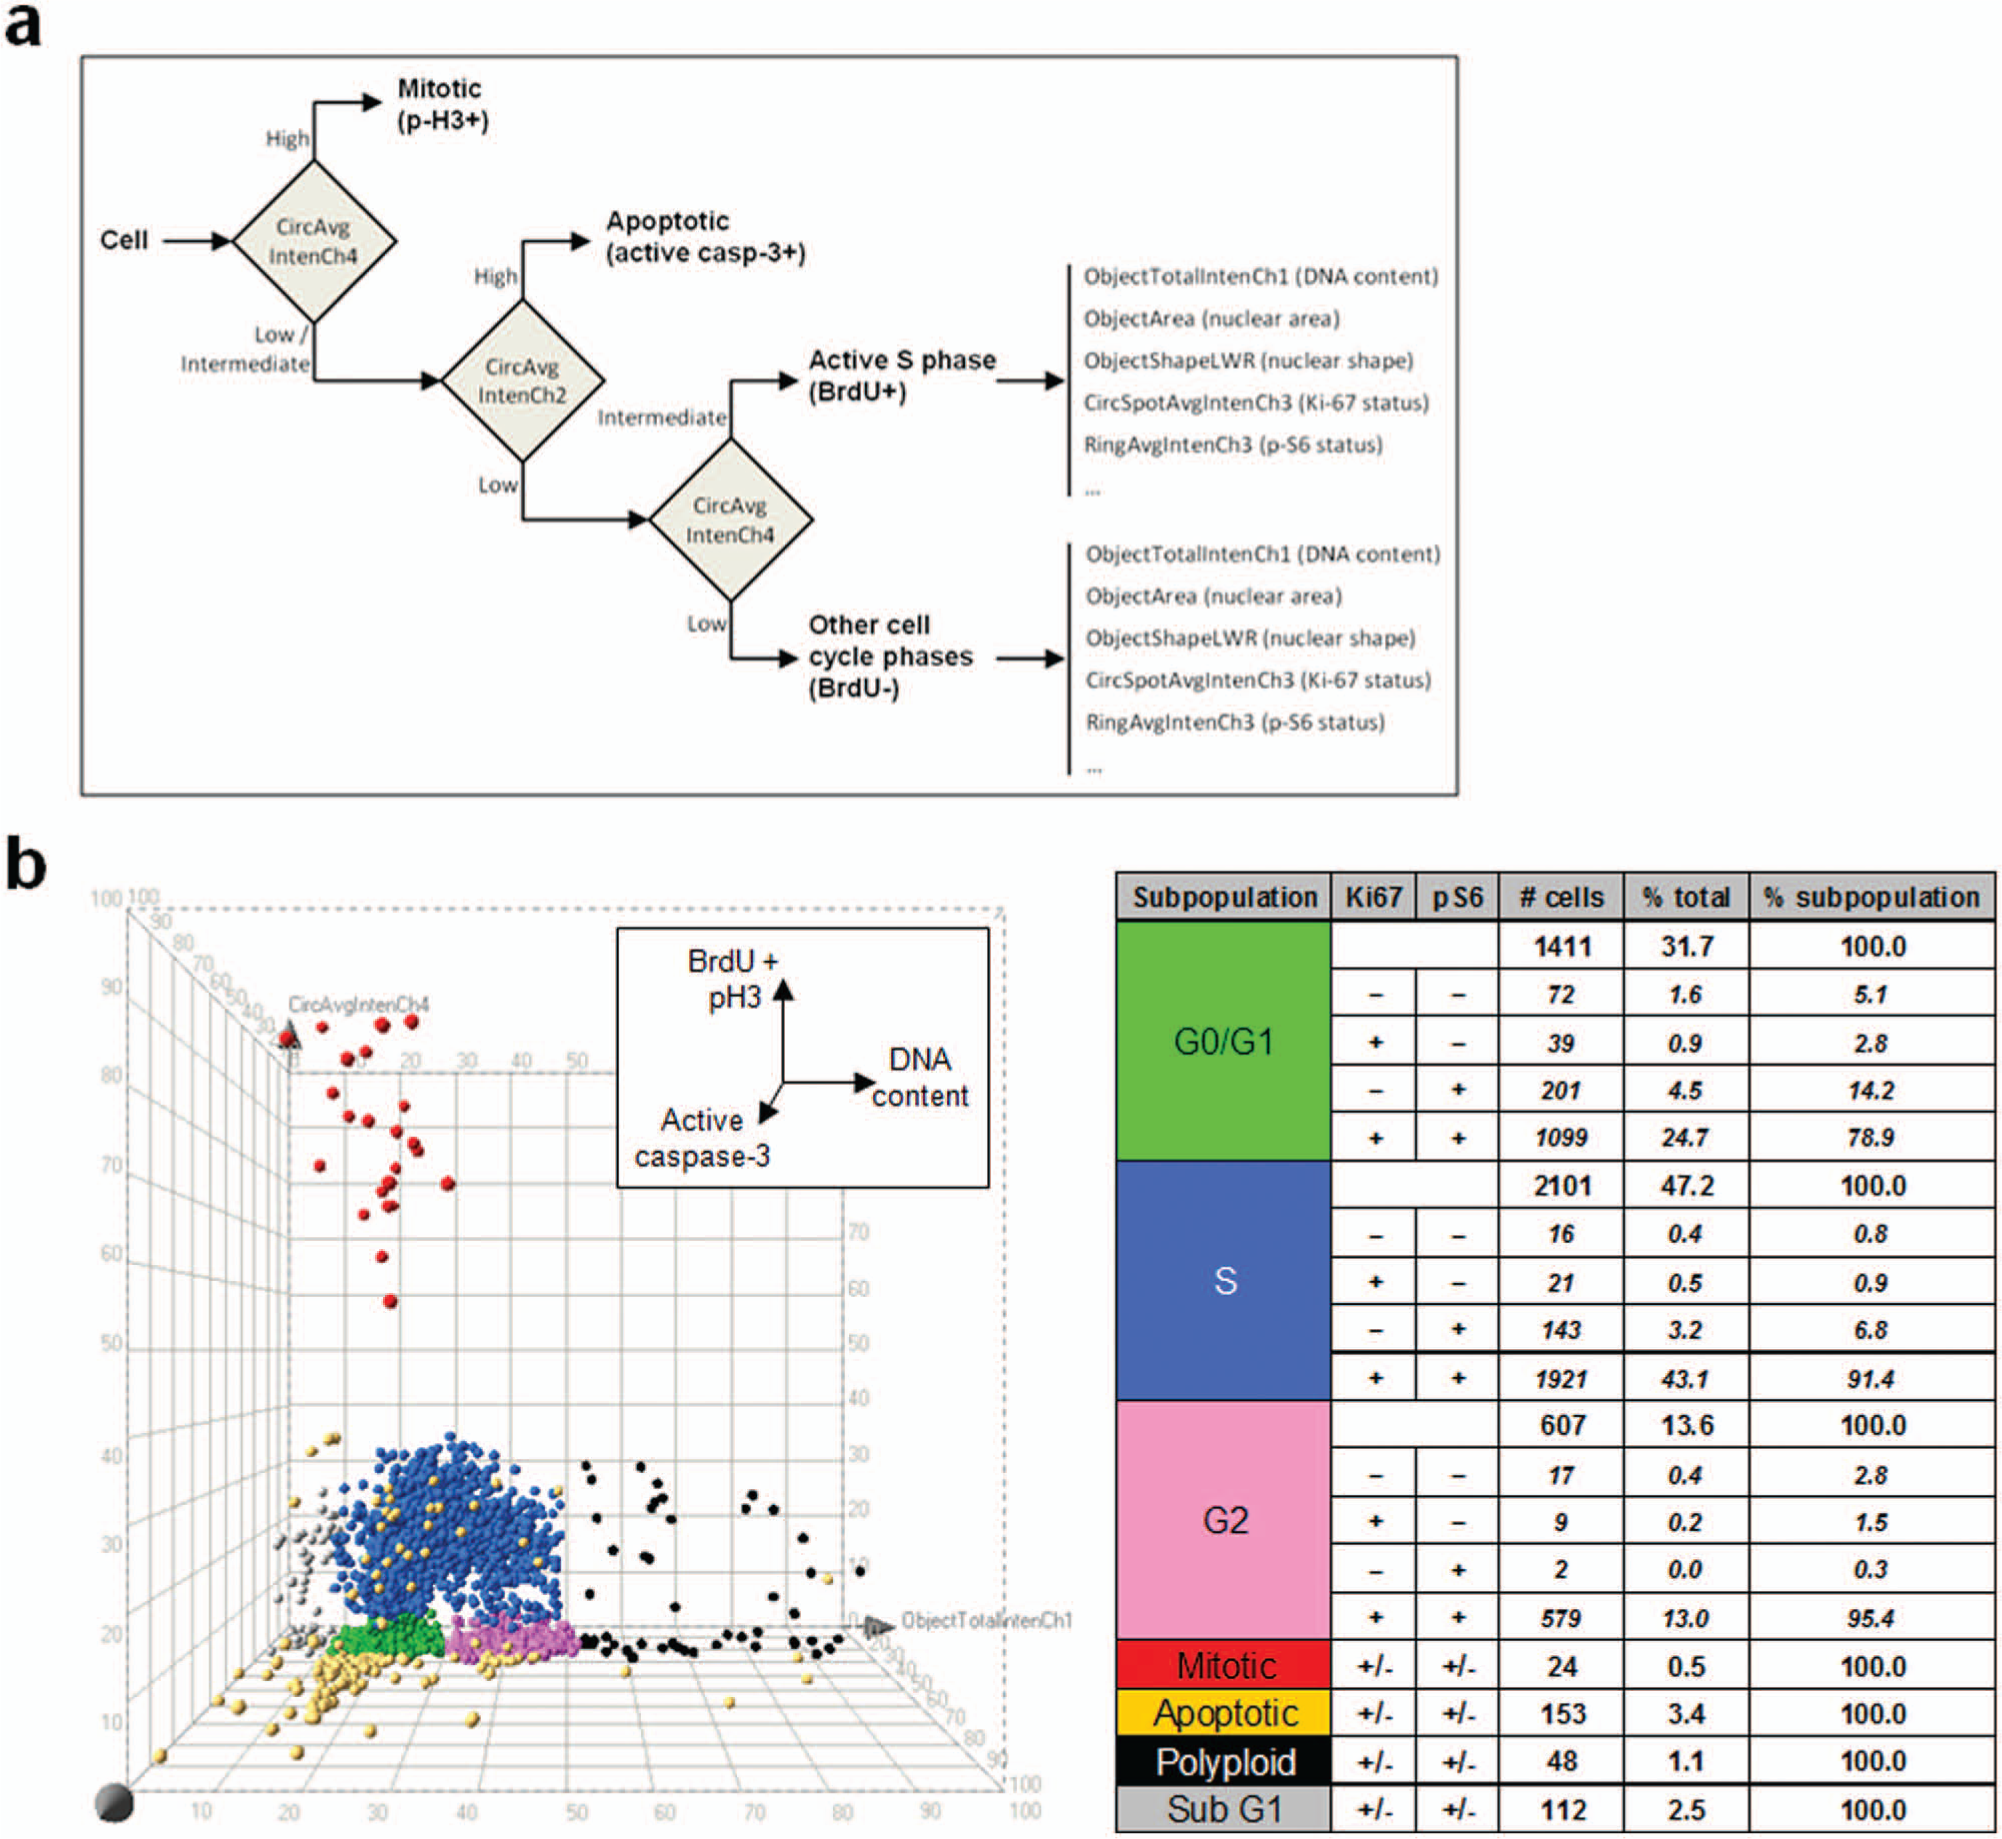
To sort individual cells into defined phenotypic categories, a hierarchical strategy
29
was applied for cell classification on the basis of the six independent markers considered together (
Figure 5a
). Each cell was described by the combination of 17 high-content analysis parameters, detailed in
(
The 3D plot in Figure 5b (DNA content/active caspase-3/BrdU/p-H3) provides a representation of the degree of phenotypic heterogeneity encountered among 4500 asynchronously growing U-2 OS cells, based on cell cycle and cell proliferation markers. A first-level classification, performed by applying arbitrary thresholds in the 3D plot, defined seven populations (G0/G1, S, G2, M, apoptotic, polyploid, and sub-G1). For interphase cells (G0/G1, S, and G2), four subpopulations were additionally categorized, based on proliferative status reported by Ki-67 and p-S6: Ki-67+/p-S6+, Ki-67+/p-S6–, Ki-67–/p-S6+, and Ki-67–/p-S6–. The table in Figure 5b shows the total number of cells belonging to each subpopulation and the percentages relative to the entire population.
No signal crosstalking was observed across the four fluorescence channels (Ch1–4) using the staining protocol described, with the exception of mitotic cells. Phospho-H3+ cells, corresponding to those with high Cy5 fluorescence intensity, show increased fluorescence intensity also in Ch2 channel (active caspase-3). This is clearly appreciable, for example, for the cell “A” in Figure 4 . These cases can be simply disambiguated by exploiting the multiparametric nature of the approach. As shown in Figure 5b , p-H3+ cells (red cloud) form a well-defined cluster in 3D plots: these cells can be unambiguously classified as mitotic on the basis of their nuclear morphology and the relatively high nuclear Cy5 fluorescence intensity in the channel 4 (BrdU/p-H3 fluorescence). Visual inspection of cells belonging to this cluster confirmed mitotic morphology, whereas apoptotic cells grouped in the active caspase-3+/BrdU–/p-H3– region (yellow cloud).
A K-means cluster analysis
37
was applied to the same cell population of
Figure 5b
, based on the complete set of 17 parameters generated by high-content analysis. Unsupervised clustering results are shown as a heat map in
Finally, we applied six-marker analysis and 3D visualization to investigate the phenotypic effects of antiproliferative drugs with a distinct mechanism of action (
Fig. 6
). U-2 OS cells were treated for 4 h with 50 µM LY or for 20 h with 1 µM PHA-739358 or 10 mM HU. LY is a PI3K/mTOR inhibitor that inhibits S6 (Ser235/236) phosphorylation. A short LY treatment is not expected to affect the cell cycle but to completely inhibit PI3K/mTOR signal transduction, resulting in the abrogation of S6 phosphorylation. HU inhibits the enzyme ribonucleotide reductase and impairs the synthesis of deoxyribonucleotides, resulting in the block of DNA synthesis and cell cycle arrest in G1/S, as shown in
Figure 3
. The Aurora kinases inhibitor PHA-739358
36
inhibits histone H3 (Ser10) phosphorylation and induces cell cycle block in G2/M and the appearance of polyploid cells as a consequence of endoreplication.
Figure 6
shows representative fields of U-2 OS untreated or treated with the three compounds and processed for DAPI/BrdU/p-H3/Ki-67/p-S6/active caspase-3 staining (
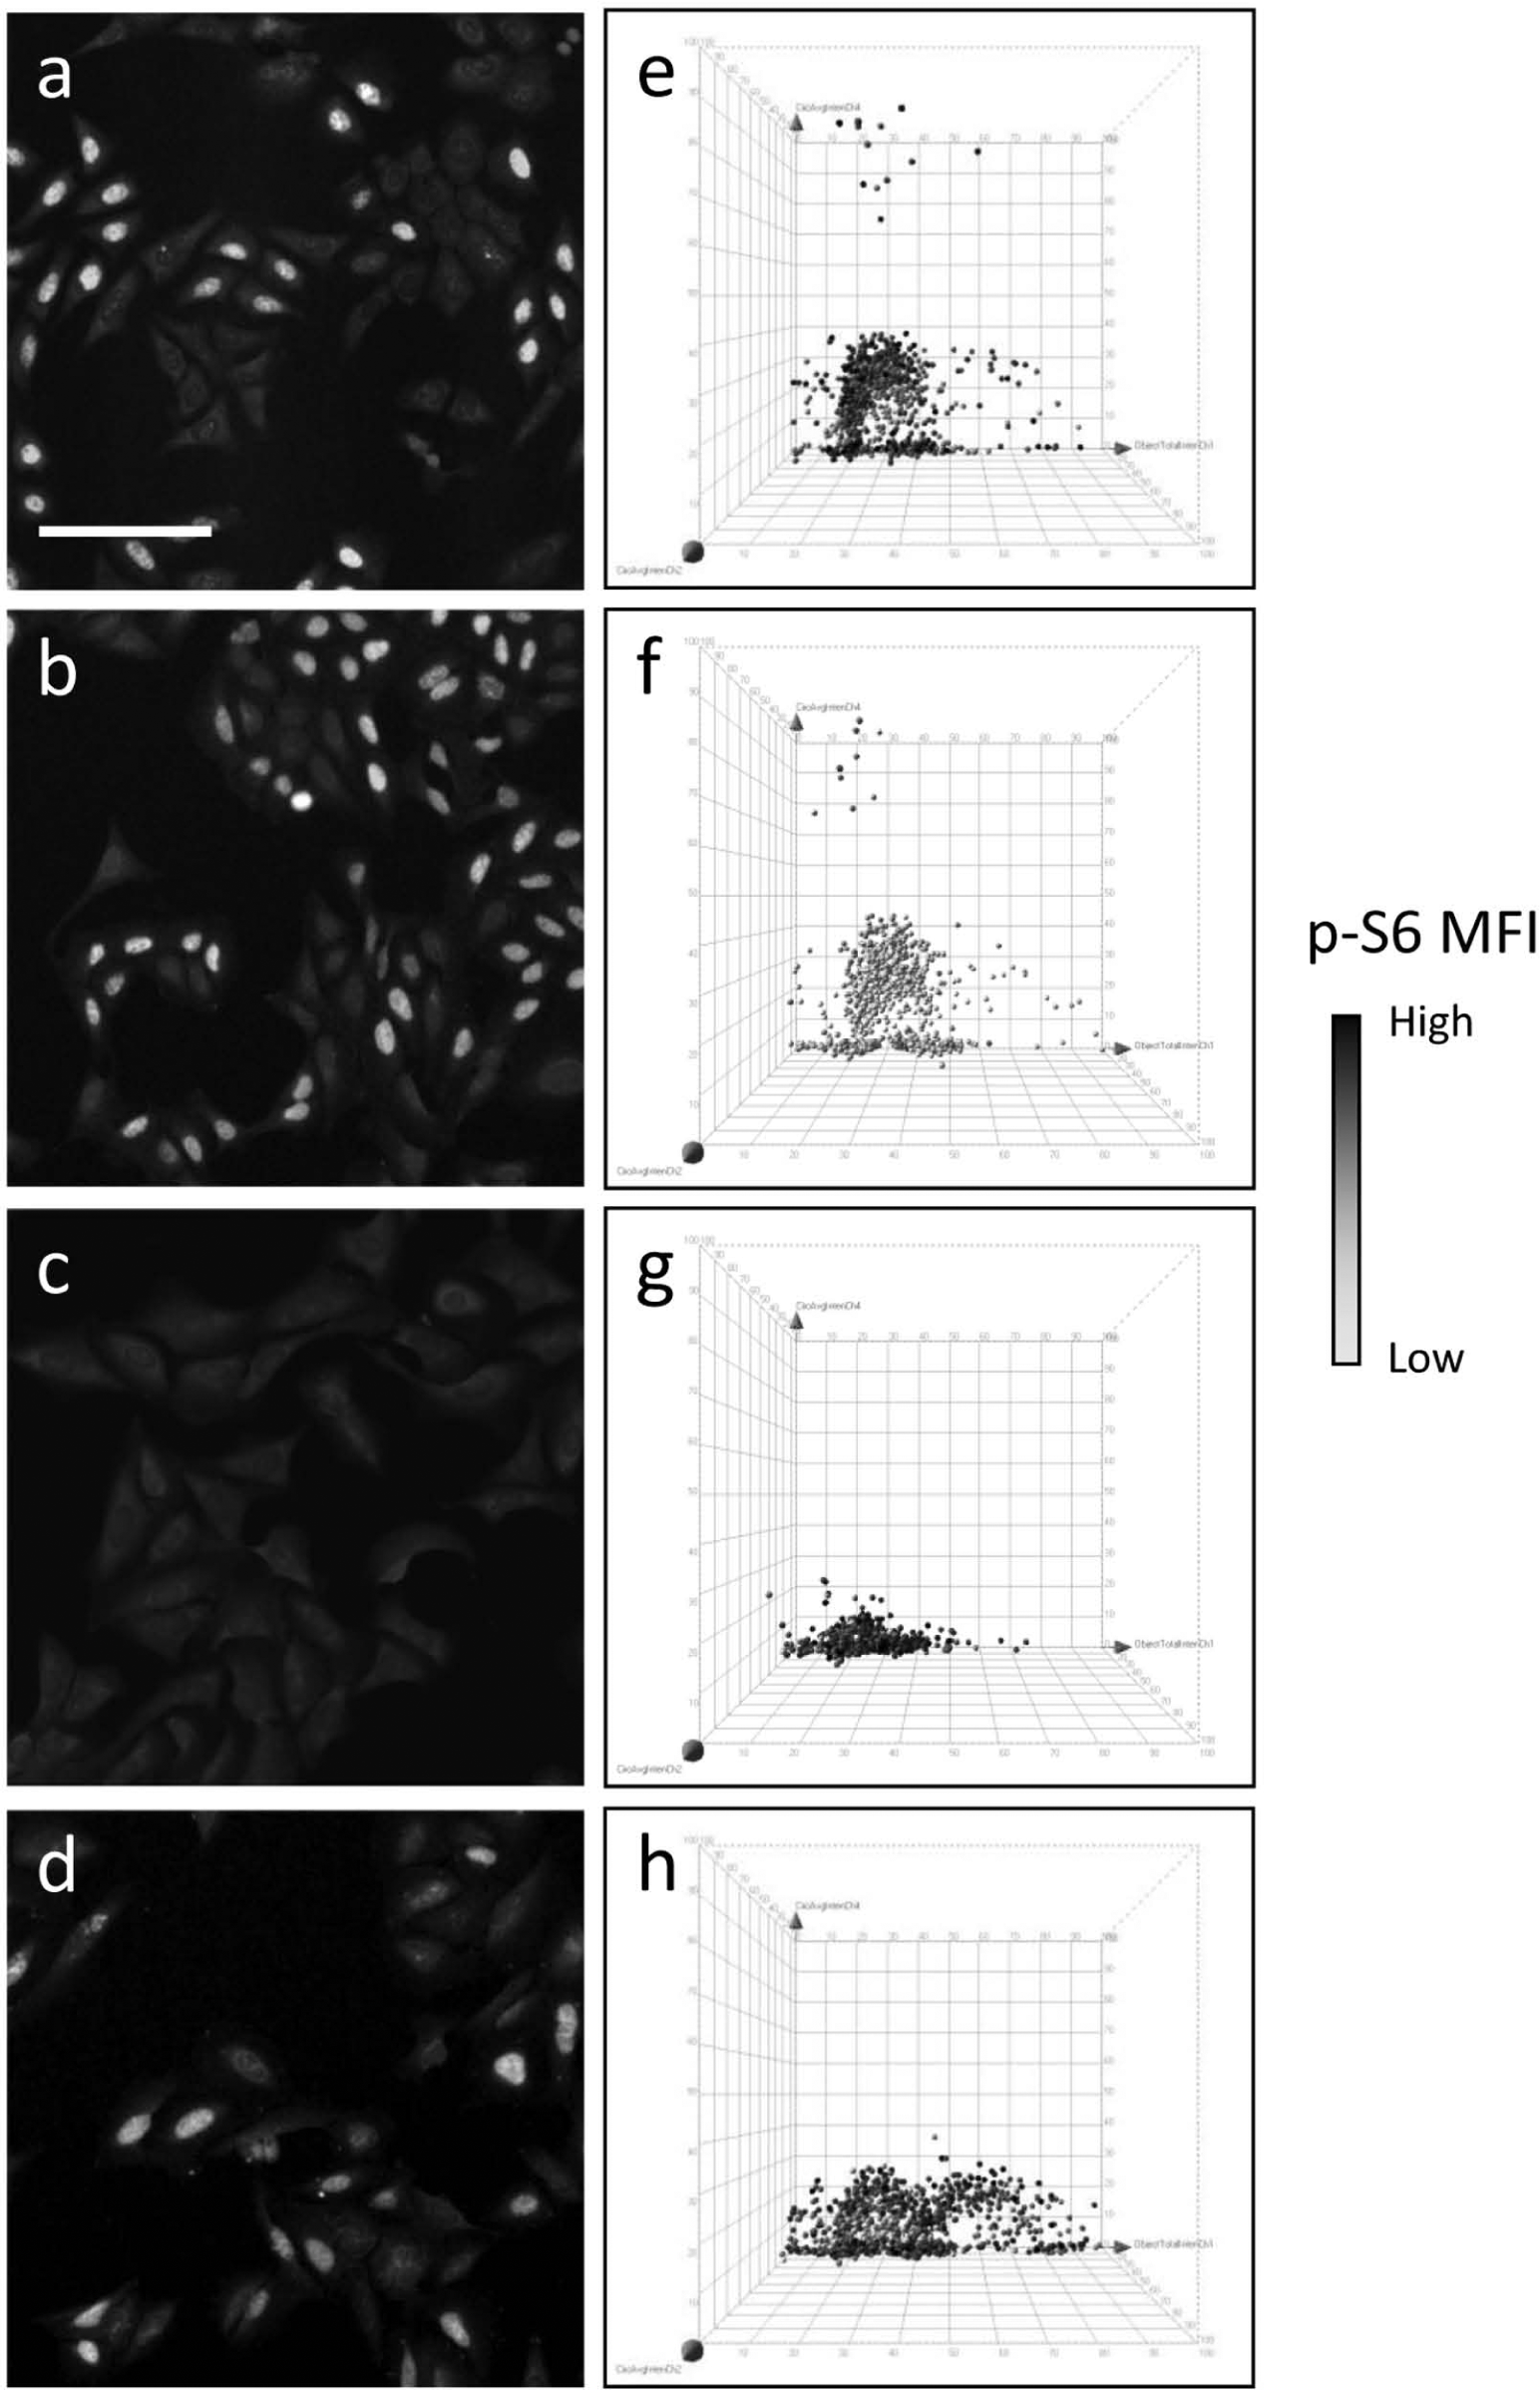
Representative fields of U-2 OS cells untreated (
Discussion
Here we present the first six-marker high-content assay for cell cycle and proliferation studies and show that live, but nonproliferating, cells can be found in any phase of the cell cycle. Our data confirm the observation of other authors that in vitro clonal cell cultures possess a high underlying heterogeneity and are formed by phenotypically diverse subpopulations.1,25 By using a true six-marker multiplexed high-content assay, we show that such heterogeneity translates into different proliferative capability in individual cells. We employed two well-characterized markers, Ki-67 and phospho-S6 (Ser235/236), to assess the proliferative status of individual cells in distinct cell cycle phases, as defined by DAPI/BrdU/p-H3/active caspase-3 co-immunostaining. Good reciprocal correlation of Ki-67, phospho-S6, and BrdU incorporation indexes has been previously shown both in vitro28,39 and in vivo, 40 but no cytometric data have so far demonstrated that these three markers may diverge in rare cells.
Seven cell cycle populations (G0/G1, S, G2, M, apoptotic, polyploid, and sub-G1) were defined following multiplexed analysis ( Fig. 5 ). We identified nonproliferating cells across all cell cycle phases. The presence of nonproliferating (Ki-67–/p-S6–) cells in the G1 phase is expected: these are usually defined as quiescent “G0” cells, which can be terminally differentiated cells or cells that have not yet passed through the so-called restriction point at G1 reentry. Surprisingly, we found Ki-67–/pS6–, Ki-67+/pS6–, and Ki-67–/pS6+ cells even among BrdU+ cells, indicating that protein synthesis can be suspended during active DNA replication. It is interesting to note that proliferating (Ki-67+/p-S6+) cells are not equally distributed among cell cycle phases, but their fraction increases from G1 to S and G2 (78.9%, G1; 91.5%, S; and 95.4%, G2), indicating that protein synthesis is required more in advanced phases. The observation of a consistent fraction of Ki-67–/p-S6+ cells in the G1 phase (14.2%) is in agreement with previous data showing that the p-S6 signal appears more quickly than Ki-67 during cell cycle reentry of resting cells. 33
We exclude that the proliferative status might be influenced by external factors in our experiments, since individual quiescent cells can be found uniformly scattered among a multitude of Ki-67+/pS6+ cells (e.g., cell “C” in Fig. 4 ). The observation that individual cells with uncommon proliferative phenotypes are homogeneously dispersed in asynchronously growing populations, and not associated with a particular environment (e.g., high local cell density), is in agreement with the “intrinsic” model postulated by Stockholm and coworkers 13 to explain the phenotypic heterogeneity of a clonal cell population in vitro. It is important to underline that only a nondestructive image-based technique such as HCA is able to provide cell morphology and cell positioning–associated information. The mechanism of action of three test compounds (LY, HU, and the Aurora kinases inhibitor PHA-739358) was investigated with our highly multiplexed approach, which successfully confirmed the expected phenotypes.
Our data demonstrate that asynchronously growing cell line populations possess an intrinsic variability in cell cycle dynamics, and a fraction of nonproliferating cells can be found in any cell cycle phase. It can be hypothesized that these cells are committed to programmed cell death, in a condition that precedes caspase activation, and slow down protein synthesis. Alternatively, these cells could be senescent or bear genomic mutations that are not compatible with proliferation and viability. These data might also suggest that exiting and reentering the cell cycle are not uniquely restricted to the G0-G1 transition, but cells can become quiescent and suspend protein synthesis even during active S or G2 phases. It would be interesting to investigate further the phenotypic features of these rare cells by adding stemness or stress markers to the multiparametric approach presented here. It has been demonstrated, for example, that up to 3% to 5% of cells within U-2 OS cell line populations display features typical of stem cells, including expression of the antigen CD133. 16
The highly multiplexed approach presented here contributes to improving the multidimensional analytical power of high-content analysis, thus allowing analysis of intact cells and cell subpopulations with an unprecedented degree of accuracy for a high-content assay. The ease of our analytical approach lends itself to compound screening for phenotypic drug discovery, particularly to investigate the response of rare cell subpopulations to drug treatments.
Footnotes
Acknowledgements
We thank Arturo Galvani for useful discussion.
Declaration of Conflicting Interests
The authors declared no potential conflicts of interest with respect to the research, authorship, and/or publication of this article.
Funding
The authors received no financial support for the research, authorship, and/or publication of this article.
References
Supplementary Material
Please find the following supplemental material available below.
For Open Access articles published under a Creative Commons License, all supplemental material carries the same license as the article it is associated with.
For non-Open Access articles published, all supplemental material carries a non-exclusive license, and permission requests for re-use of supplemental material or any part of supplemental material shall be sent directly to the copyright owner as specified in the copyright notice associated with the article.