
Abstract
Recent advances in cell-based assays have involved the integration of single-cell analyses and microfluidics technology to facilitate both high-content and high-throughput applications. These technical advances have yielded large datasets with single-cell resolution, and have given rise to the study of cell population dynamics, but statistical analyses of these populations and their properties have received much less attention, particularly for cells cultured in microfluidic systems. The objective of this study was to perform statistical analyses using Pittsburgh Heterogeneity Indices (PHIs) to understand the heterogeneity and evolution of cell population demographics on datasets generated from a microfluidic single-cell-resolution cell-based assay. We applied PHIs to cell population data obtained from studies involving drug response and soluble factor signaling of multiple myeloma cancer cells, and investigated effects of reducing population size in the microfluidic assay on both the PHIs and traditional population-averaged readouts. Results showed that PHIs are useful for examining changing population distributions within a microfluidic setting. Furthermore, PHIs provided data in support of finding the minimum population size for a microfluidic assay without altering the heterogeneity indices of the cell population. This work will be useful for novel assay development, and for advancing the integration of microfluidics, cell-based assays, and heterogeneity analyses.
Keywords
Introduction
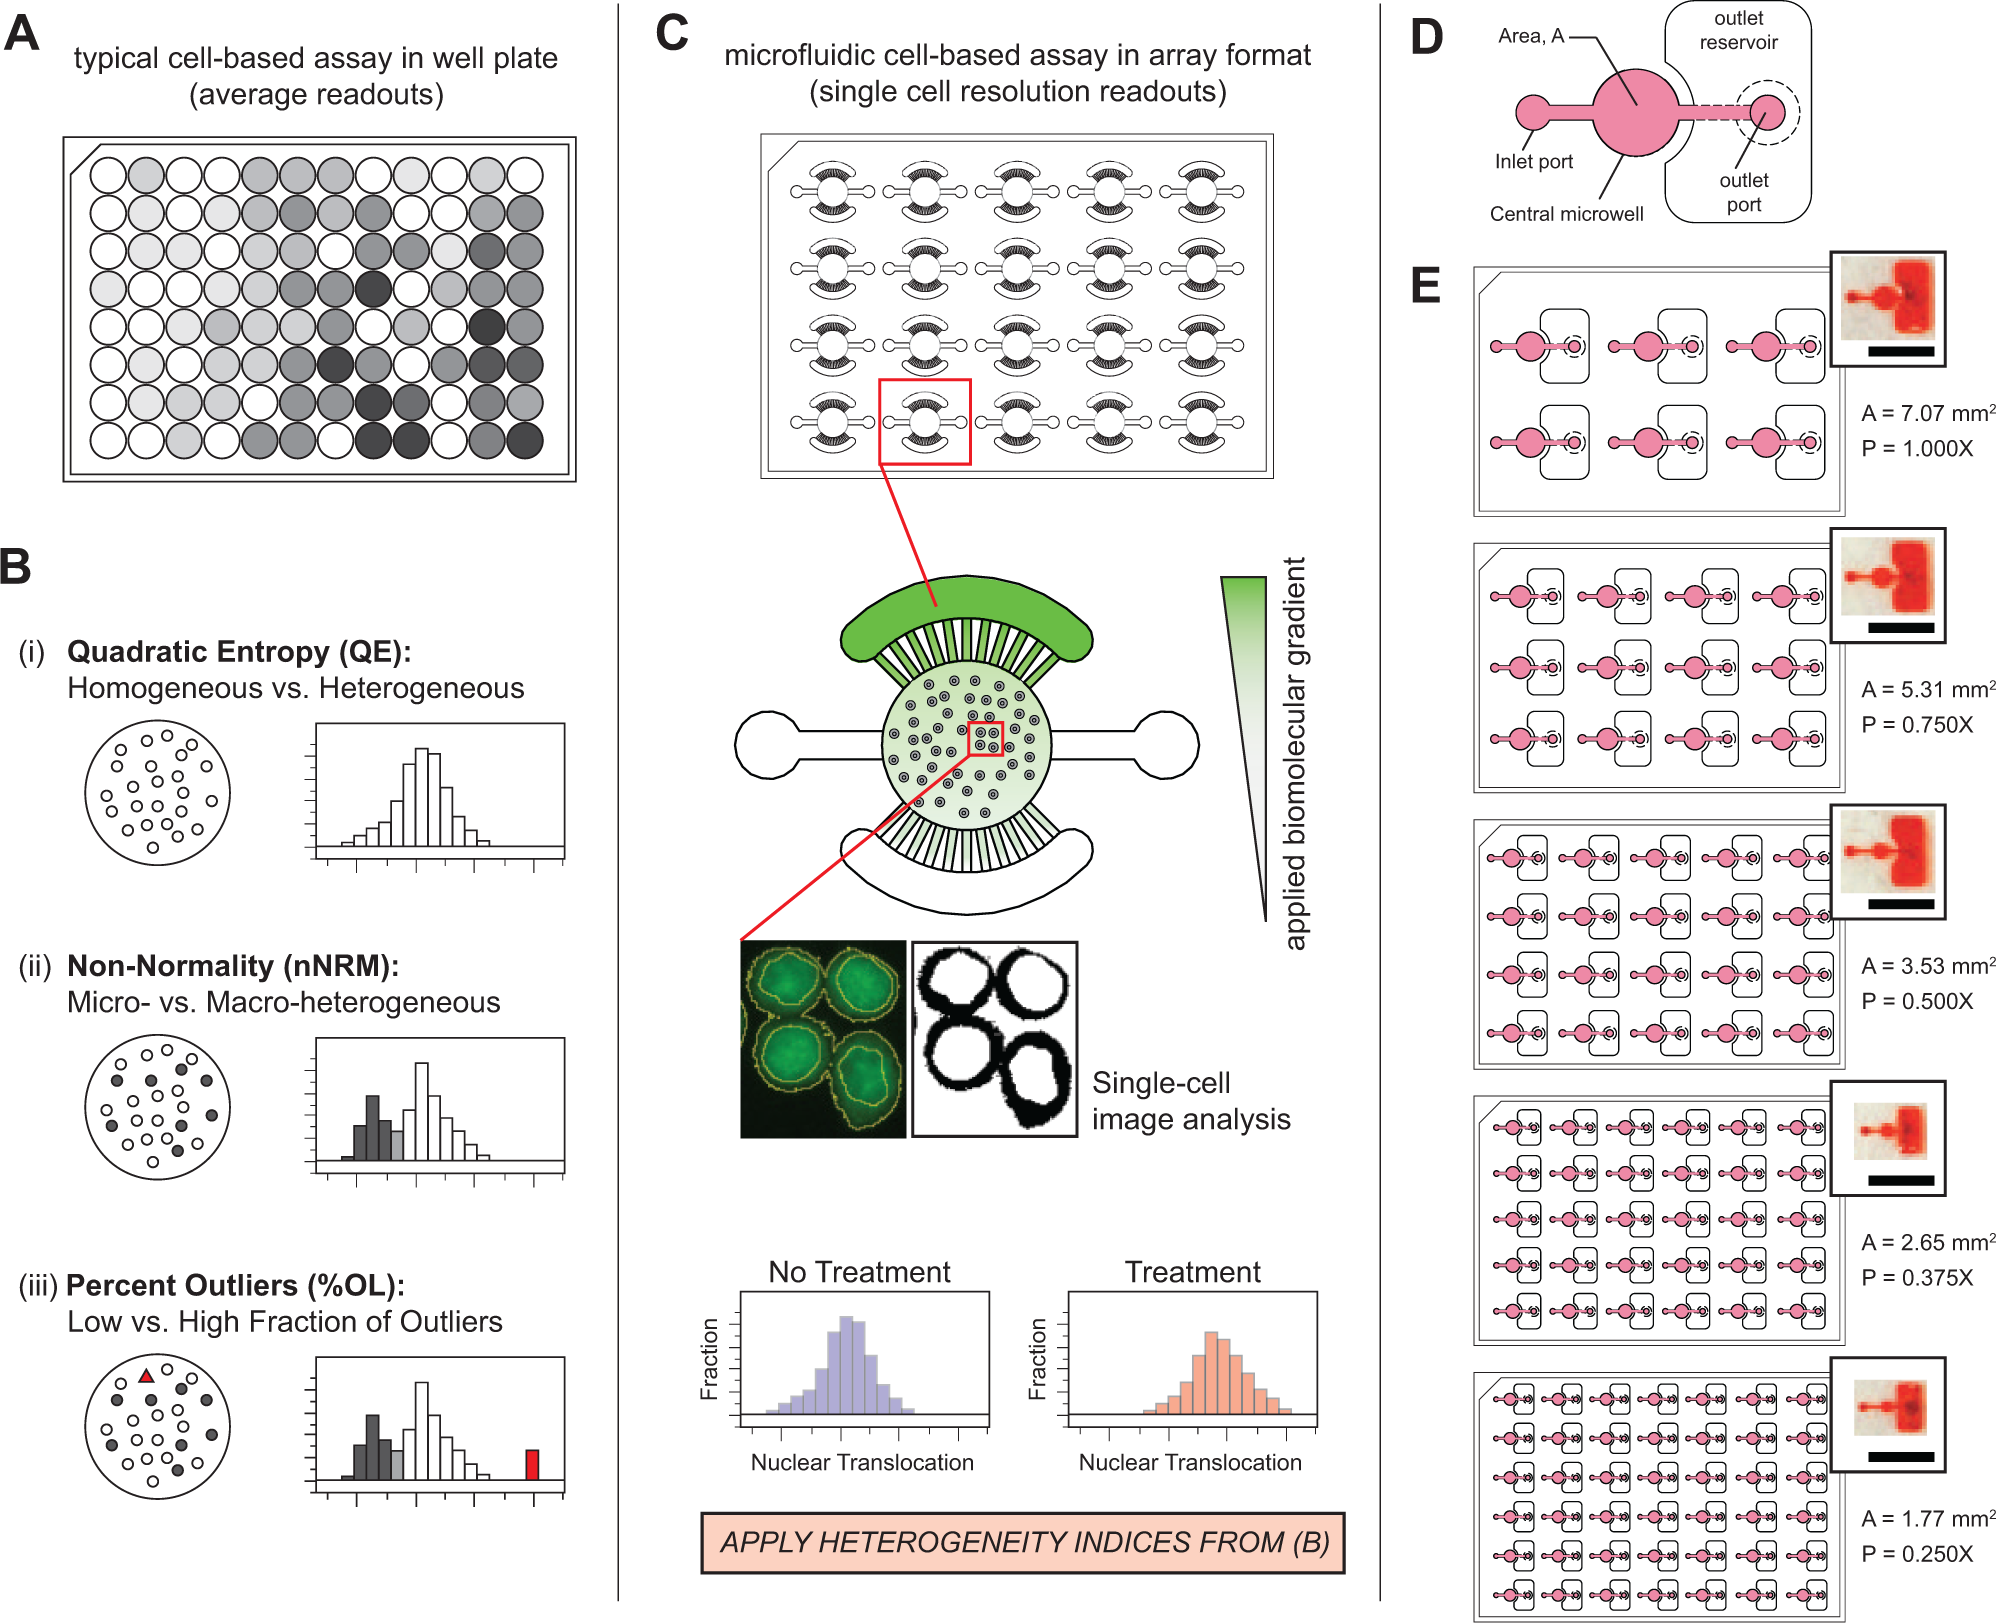
Cell-based assays are widely used in basic research, clinical studies, and the biotechnology and pharmaceutical industries for studying cell functions, examining clinical samples for diagnostic purposes, and drug discovery, among many other applications.1,2 Whether cell-based assays are used in high-throughput screening (HTS) of compound libraries, high-content screening (HCS) of cells under stimuli, or for the study of cell function and associated signaling mechanisms, the most commonly produced readouts generated by cell-based assays have been population-averaged responses ( Fig. 1A ). 3 Despite the usefulness of these assays in providing experimental evidence to specific biological questions, they have several important limitations. First, because most cell-based assays use population-averaged readouts, responses from individual cells or subpopulations are often masked when using only the average (or total) value. Second, traditional cell-based assays are most often in well plate formats with cells cultured on two-dimensional surfaces in monoculture ( Fig. 1A ) that do not sufficiently mimic the complexity of the in vivo microenvironment in vitro.3–5 Because more advanced cell-based assays are continually being developed, including those for testing clinical patient samples for personalized medicine applications,6,7 the ability to both minimize the consumption of precious patient samples and simultaneously maximize data output by analyzing whole cell populations is critical to achieving improvements and widespread adoption of these novel assays. Furthermore, new in vitro tools for executing these assays should be developed to also create more complex cell and tissue microenvironments that can mimic the in vivo microenvironment more closely.
(
Several cell-based assays have recently been developed that demonstrate these new considerations. First, researchers have developed single-cell resolution versions of population-averaged assays, including single-cell nuclear translocation analyses4,8 (as an alternative to the electrophoretic mobility shift assays [EMSAs] used for measuring transcription factor activation) ( Fig. 1C ), Western blots, 9 and cytotoxicity assays. 10 Second, advancements in the fields of microfluidics and microengineering have been leveraged to address the challenges associated with limited patient sample availability, in vitro device complexity, and throughput. Using microfabrication techniques, microfluidic tools have been designed and fabricated that can perform assays with significantly fewer cells,11–13 while more accurately mimicking complex in vivo microenvironments.14,15 One particular microfluidic device designed by Young et al. facilitated the coculture of nonadherent multiple myeloma (MM) cells, together with neighboring microenvironment cells (e.g., bone marrow stromal cells) using a small fraction of the cells required for corresponding well plate–based assays ( Fig. 1C ). 4 The device was subsequently applied to primary MM patient samples as a chemosensitivity and resistance assay (CSRA) to test patient sensitivity to the commonly used MM drug bortezomib (BTZ). 6 Moore et al. then further used the microscale single-cell nuclear translocation (μSCeNT) assay in the same system to study the dynamics of cytokine diffusion across the microfluidic system containing MM cells. 16 In both Moore et al. and Young et al., results from the μSCeNT assay were presented as entire cell population distributions, but comparisons between populations were generally made with only qualitative descriptions of how the cell population “demographics” shifted. Thus, while the acquisition of single-cell data and the use of microfluidics to better control microenvironmental factors were both important steps in the development of this assay, additional methods of analysis are needed to better quantify changes in population distributions, and help uncover more detailed information and insight about cell populations in experimental and clinical biology applications.
One approach to analyzing the cell populations within an assay more quantitatively is to examine and measure population heterogeneity. Nongenetic cellular heterogeneity, also known as phenotypic heterogeneity, is a characteristic present in populations of normal cells, clonal cell lines, and cancer cells.3,17,18 Phenotypic heterogeneity is a key contributor in stem cell fate decisions, cell physiology, and development, and is a major topic of interest in such areas as tumor therapeutics, disease management, and tumor diagnostics.19,20 In particular, Gough and his colleagues have made significant progress in describing, quantifying, and gleaning new insights from population heterogeneity associated with biological samples.3,17,21 Gough et al. compared the performance of several methods, and selected three specific heterogeneity indices (i.e., Pittsburgh Heterogeneity Indices [PHIs]) by which cell populations may be evaluated and classified depending on the degree of heterogeneity observed ( Fig. 1B ). The three key categories defined by the PHIs are (1) population diversity, which describes whether a population can be considered mostly homogeneous or heterogeneous; (2) nonnormality, which describes how much a distribution deviates from a normal distribution, and alludes to the presence of micro- or macroheterogeneities; and (3) the percent outliers (%OL) present in a distribution. 18 Gough et al. demonstrated their method by studying heterogeneity in STAT3 activation across populations of cal33 human head and neck squamous carcinoma cells treated with different cytokines, and in separate analyses using a range of compounds.17,21 Given these results, the ability to integrate heterogeneity indices together with improved cell-based assays and microfluidic cell culture platforms may further help researchers extract more valuable information from each experimental cell population.
The objective of this study was to perform heterogeneity analyses on datasets generated from a microfluidic single-cell-resolution cell-based assay, using specifically the PHIs developed by Gough et al., 3 to assess the ability of PHIs to extract new insights and trends from both existing and new experimental data. We describe the analysis of two separate datasets that were generated using the μSCeNT assay developed by Young et al. The first dataset was previously acquired as part of the work of Moore et al., with MM cells being stimulated by a range of concentrations of human recombinant IL-6, across various exposure times. 16 The second dataset was generated specifically for this study, and involved examining the effects of varying cell seeding population sizes in our assay ( Fig. 1D , E ), and then culturing and activating these cells in their different populations by treating with IL-6 and TNF-α to induce STAT3 And NF-κB nuclear translocation, respectively. Additionally, cytotoxicity assays were also performed with varying cell population sizes to acquire population-averaged data to include in the second dataset. The PHIs were applied to the datasets, and the results were analyzed to determine how population heterogeneity was affected quantitatively by the different treatments.
Materials and Methods
Microfluidic System Design and Fabrication
Each microfluidic system (or microsystem) consisted of a circular central microwell 500 µm in depth for trapping and culturing suspension MM cells ( Fig. 1D ). For microfluidic systems with targeted seeding populations of >2000 cells, each central well was connected to inlet and outlet ports with 0.5 mm wide and 200 µm deep channels. For microfluidic systems with targeted seeding populations of <2000 cells, each central well was connected to inlet and outlet ports with 0.3 mm wide and 200 µm deep channels. A 0.5 mm deep outlet reservoir was used for each microsystem to contain the media and prevent cross-contamination between microsystems. To ensure constant cell seeding density, a uniquely sized central well was fabricated and tested for each unique population size ( Fig. 1E ). Note that the microfluidic system used in the current study has been simplified from the previous design used for coculturing MM cells with neighboring bone marrow stromal cells. 16 The previous design contained additional features, such as side chambers and diffusion ports ( Fig. 1C ), which were not needed in this study.
All microfluidic devices were fabricated in poly(dimethylsiloxane) (PDMS) layers generated from SU-8 master molds made from soft lithography techniques, as previously described. 4 The master molds were used to create two unique PDMS layers, including a cell culture channel layer and an inlet/outlet port layer. These two layers, along with a 3-by-2-inch glass slide, were bonded together via oxygen plasma treatment to form a completed device.
Cell Preparation
The RPMI8226 (human B lymphocyte plasmacytoma cells, ATCC CCL-155) MM cell line was obtained from Cedarlane Labs (Burlington, ON). RPMI8226 cells were cultured at 37 °C and 5% CO2 in high-glucose Dulbecco’s modified Eagle’s medium (DMEM) containing 10% fetal bovine serum (FBS), 1% penicillin-streptomycin (P/S), and 1 mM HEPES buffer. RPMI8226 cells were seeded in T-25 culture flasks at seeding densities ranging from 0.75 to 1.5 × 10⁶ cells/mL, and were passaged every 2–3 days as needed. RPMI8226 cells were used in experiments up to a maximum of 15 passages.
Device Preparation and Cell Seeding
Device preparation and cell seeding procedures were similar to those previously described, 4 with minor changes, and are summarized here for clarity. Each microfluidic system within a fabricated device was disinfected with 70% ethanol (in deionized [DI] water) for 10 min, and then flushed with five volume replacements (VRs) of Dulbecco’s phosphate-buffered saline (DPBS), where one VR is equal to ~7.5 µL in microsystems culturing ~2500–5000 cells, and ~6 µL in microsystems culturing ~1250–1875 cells (as our targeted cell population sizes). Five VRs of DMEM media were flushed through each system, and care was taken to ensure a final DMEM media volume of 35–45 µL in the outlet reservoirs for assays studying nuclear translocation. A final DMEM volume of 0.02 μL per cell for viability assays was necessary to ensure that the drug was equally effective for all cell seeding populations. Note that this was not needed for nuclear translocation assays, which did not involve drug compounds. After priming with media, the device was placed in a Nunc OmniTray with sterile Kimwipes presoaked in DPBS. The OmniTray was placed in a bioassay dish with additional sterile DPBS-soaked Kimwipes, and this entire setup was placed in an incubator. For population size experiments, a different volume of RPMI8226 cell suspension (at a density of ~2.5 × 10⁶ cells/mL) was loaded into the central culture well of each microsystem, as follows: (1) 1250 cells = 4 µL loaded, 1875 cells = 5 µL loaded, 2500 cells = 6 µL loaded, 3750 cells = 7 µL loaded, and 5000 cells = 8 µL loaded. Note that these loading volumes were necessary to achieve confluence in the center well, and to compensate for some cell loss during seeding, caused by a proportion of cells not being trapped in the center well. Additionally, some cells remained in the inlet/outlet regions of the microsystems and were later removed from the system during VRs and outlet well aspiration. Note also that the cell population sizes above represented only our initial targets; subsequent cell counting of our actual populations in our wells showed consistently higher cell counts than these targets, with the same ratios maintained as desired (see Suppl. Table S1 for representative cell counts). Thus, for all results presented below, we opted to express population sizes in terms of a fraction of the maximum population size used, where the targeted 5000-cell population size is labeled “1.000X,” the targeted 1250-cell population size is labeled “0.250X,” and so on.
Reagents
Exogenous IL-6 (cat. no. 206-IL, R&D Systems, Minneapolis, MN) was reconstituted at 10 µg/mL in DPBS containing 0.1% bovine serum albumin (BSA), aliquoted, and then stored at –80 °C. IL-6 was serially diluted in DMEM media and warmed to 37 °C. Exogenous TNF-α (cat. no. PHC3015, Life Technologies, Waltham, MA) was reconstituted at 10 µg/mL in DPBS containing 0.1% BSA, aliquoted, and then stored at –80 °C. TNF-α was serially diluted in DMEM media and warmed to 37 °C. Carfilzomib (CFZ, PR-171 or Kyprolis) was obtained in lyophilized form, as a 25 mg mass from Selleckchem (S2853, Houston, TX), and was reconstituted in DI water and stored at –80 °C in 10 µM aliquots. The LIVE/DEAD Cell Viability Assay Kit (L3224, Thermo Fisher Scientific, Waltham, MA) was used to detect live and dead cells and determine drug cytotoxicity in microchambers. Calcein AM (live, green) and ethidium homodimer (dead, red) were used at a working concentration of 4 µM.
Dose–Response Experiments
MM cells were seeded and allowed to settle for 24 h before drug treatment. Dose–response experiments were performed using concentrations of CFZ or BTZ ranging from 0.1 to 1000 nM. A drug was thawed for 5 min, and then serially diluted to 1000, 100, 10, 1, and 0.1 nM in 500 µL of cell media within microcentrifuge tubes. After dilution, each tube was placed in a 37 °C water bath. After warming, drug treatments were applied with a single application of 20 µL per concentration into a microfluidic system. Each outlet was aspirated, and then 30–40 µL of each concentration was added to each microsystem. Care was taken to ensure a final DMEM drug media volume of 20 nL per cell for viability assays (because it was necessary to ensure the same number of drug molecules per cell for a given test concentration). Following 24 h of drug treatment, LIVE/DEAD reagents were diluted in 37 °C DMEM serum-reduced media (no. 11058-021, Life Technologies), warmed to 37 °C, and dispensed into microchambers in three sequential VRs, followed by aspiration of the outlet port. Devices containing LIVE/DEAD reagents were incubated at 37 °C for 45 min. Each microsystem was rinsed with five VRs of DPBS prior to imaging.
Nuclear Translocation Assays
The µSCeNT assay developed with this platform was previous described. 4 For experiments involving exogenous IL-6 and TNF-α, RPMI8226 cells were seeded into the central well, and allowed to settle and acclimate for 24 h. After 24 h, either IL-6 was diluted in culture media at a concentration of 150 ng/mL, or TNF-α was diluted in culture media at a concentration of 30 ng/mL. Three VRs were added to culture wells receiving cytokine treatment. IL-6-treated MM cells were fixed with three VRs of 10% neutral buffered formalin after 30 min of IL-6 exposure, and TNF-α-treated MM cells were fixed after 20 min of TNF-α exposure. All nontreated MM cells were fixed after 24 h of culture.
Immunocytochemical Staining
Mouse monoclonal IgG STAT3 antibody (124H6, no. 9139, Cell Signaling Technologies, Danvers, MA) was diluted at 1:400 in 3% BSA, and AlexaFluor-488 goat anti-mouse secondary antibody (A11001, Life Technologies) was diluted at 1:500 in 3% BSA. Rabbit monoclonal IgG RelA antibody (SC372, Santa Cruz Biotechnology, Santa Cruz, CA) was diluted at 1:200 in 3% BSA, and AlexaFluor-488 goat anti-rabbit secondary antibody (A11008, Life Technologies) was diluted at 1:400 in 3% BSA. Hoechst 33342 nuclear dye (Life Technologies) was diluted at 1:1500 in 3% BSA. A standard procedure consistent with that previously reported was executed for fixation, permeabilization, blocking, and staining, consisting of sequential VRs of reagents passively pumped through system microchambers. 4
Single-Cell Image Analysis
All fluorescent images for dose–response experiments were captured at room temperature using an Olympus IX83 inverted fluorescent microscope (Olympus Canada Inc., Richmond Hill, ON) with a UPlan 4× objective (NA = 0.13, through air; Olympus Canada Inc.) and an Orca Flash 4.0 charge-coupled device (CCD) camera (C11440-22CU, Hamamatsu, Japan). One image was captured per microsystem for each fluorescence channel (LIVE = green, DEAD = red) using MetaMorph software (version 7.10.0.119, Molecular Devices LLC, Sunnyvale, CA). Image analysis was performed using ImageJ and J’Experiment, a database management software package (J’Experiment or JeX, https://github.com/jaywarrick/JEX). The software calculated the ratio of live cells to total cells across the range of drug concentrations tested.
Fluorescence images for nuclear translocation assays were obtained with an EVOS FL Auto Cell Imaging System (Thermo Fisher Scientific) with a 20× objective (LPlanFL PH2, NA = 0.40). All images were captured using a monochrome high-sensitivity interline CCD camera built onto the EVOS FL Auto System. Images were analyzed for nuclear translocation of STAT3 or NF-κB within single cells as described previously. 4 Briefly, STAT3/NF-κB and Hoechst-stained cell images were collected and processed, and the nuclear translocation in each cell within an image was determined by calculating the ratio of the average nuclear intensity per pixel over the average cytoplasmic intensity per pixel of STAT3, using the following equation:
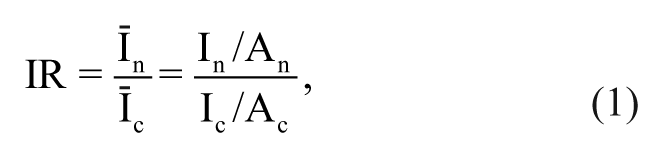
where In is the total nuclear intensity, An is the nucleus area, Ic is the total cytoplasm intensity, Ac is the cytoplasm area, Īn is the mean nuclear intensity, Īc is the mean cytoplasmic intensity, and IR is the intensity ratio. The entire image analysis procedure was automated and performed using J’Experiment. IR values were then summarized as cell population distributions across the range of populations being studied. Low IR values represented minimal nuclear translocation, while high IR values represented significant nuclear translocation and cell activation.
Heterogeneity Indices
A combined metrics approach called PHIs was defined by Gough et al.3,17 and applied here to quantitatively analyze the cell population distributions that were collected during single-cell resolution experiments. Quadratic entropy (QE) quantifies population diversity through a combination of distribution spread and the magnitude of the differences between IR responses for a cell population distribution, 17 and is calculated as shown in eq 2:
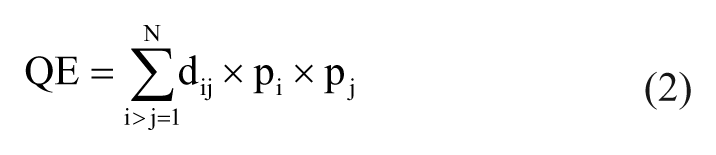
where pi is the probability distribution for each experimental cell population (sorted into bins of size 0.05 in IR value), pj is the transverse of this probability distribution, and dij is a distance matrix that linearly weighs these probabilities by the difference in IR bins. The Kolmogorov–Smirnov (KS) distance quantifies the shape of a distribution relative to a normal distribution, and is thus a measure of nonnormality. 17 The KS distance was calculated as shown in eq 3:
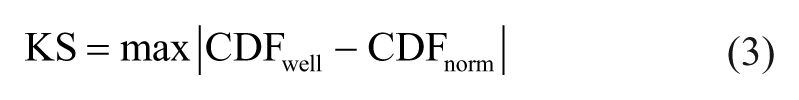
where CDFwell is the cumulative distribution of an experimental cell population, and CDFnorm is the cumulative distribution of a normal distribution with the same mean and standard deviation as the experimental cell population. Last, the %OL within a cell population distribution is calculated as shown in eq 4:
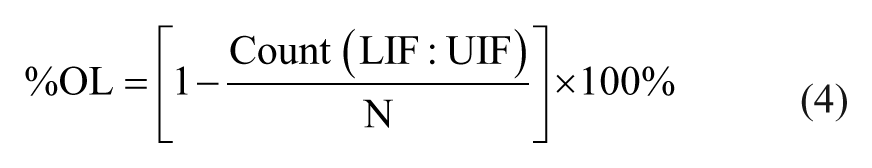
where Count (LIF:UIF) is the quantity of cells with IR values within the range of the lower and upper inner fence limits defined for a standard box plot, and N is the total number of cells within the cell population distribution being studied.
PHI Thresholds
After calculating PHI values for each cell population distribution, these values were segregated based on thresholds defined using negative controls. For retrospectively analyzed data, negative controls were 4 h experiments with no IL-6 treatment. For experiments studying the impact of decreasing cell seeding population size, negative control experiments were untreated cell distributions in which the maximum seeding population size across the range of populations tested was used (i.e., 1.000X in Fig. 2 ). Using these control experiments, three thresholds were calculated for each of the datasets studied in this work. The first threshold, for QE, was used to classify distributions as either homogeneous or heterogeneous, and this was done using eq 5:
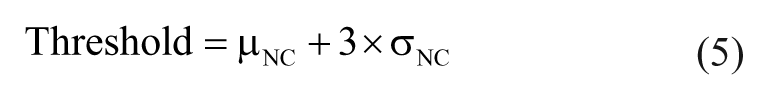
Retrospective analysis of previously published data and PHI data analysis. IR distributions for each of two replicates across three independent experiments (six total rows) for (
where μNC is the mean of the negative control replicates, and σNC is the standard deviation of all of the negative control replicates. All distributions classified as heterogeneous were further classified as either microheterogeneous or macroheterogenous using the KS values calculated for negative control experiments in eq 5. Last, %OL data were used to classify cell distributions as either “with outliers,” where a distribution of cells had more outliers than a typical normal distribution as defined for box plots (4.5%), 17 or “without outliers.” Using these three thresholds, cell populations were segregated as shown in Suppl. Fig. S1 .
Statistical Analysis
For all dose–response experiments, experimental conditions were tested in duplicate per experiment, and all experiments were repeated three times (n = 3). The mean IC50 value for each cell seeding population was determined by calculating the average live cell fraction for each concentration tested in three independent experiments. A dose–response curve was generated using these average values, producing a unique IC50 value for each seeding population.
For all nuclear translocation assays, experimental conditions were assayed in duplicate, and all experiments were repeated three times (n = 3). For nuclear translocation assay data analyzed visually by comparing distributions, population distributions represent the total cell population from each duplicate per experiment for a given condition.
For seeding population size experiments, mean QE values were calculated by including all experimental replicates (n = 3 for NF-κB, n = 4 for STAT3 μSCeNT assays) and duplicates for each test condition. The mean QE values for treated and untreated seeding populations were compared using two-sample t-tests without assuming equal variances. For convenience, two levels of statistical significance were specified for this analysis: p < 0.01 and p < 0.0005.
Results
We first performed a retrospective analysis of previous experimental data to assess the value of using PHIs as complementary metrics in our μSCeNT assay ( Fig. 2 ). The data were taken from previously published experiments that studied time-dependent diffusion profiles of IL-6 and its role in STAT3 activation within an established microfluidic cell culture system. 16 The dataset included measurements of STAT3 activation at four different time points (4, 8, 12, and 24 h), and three different initial concentrations of exogenous IL-6 (0, 10, and 100 ng/mL), allowing us to compare varying cell population distributions of STAT3 nuclear translocation in microfluidic systems in terms of IR.
Qualitative inspection of the different population distributions ( Fig. 2A–C , top) showed that as time and concentration increased, the IR population distributions shifted to the right, indicating increased nuclear translocation and STAT3 activation, as expected. However, it was difficult to determine whether increasing concentration or elapsed time led to a larger population shift just by visual inspection alone. The shape of each distribution was also observed to qualitatively change with increasing time up to 24 h. While the importance of this change in distribution shape is unknown, displaying and analyzing entire distributions in this manner enabled this observation in the first place. In contrast, when these distributions were condensed into a single mean IR value, and plotted for changing concentration and time ( Fig. 2A–C , mean IRs), these distribution features were completely masked. The only observations that could be made using the mean IR values were that (1) the mean IR values tended to increase with time when cells were treated with IL-6 ( Fig. 2B , C ), (2) the mean IRs increased between no-treatment and IL-6 treatment conditions, and (3) the mean IRs have noticeable variance between replicates. In general, however, summarizing distribution data down to mean values masks potentially important features and insights, as noted above.
We were next interested in assessing whether the application of PHIs would provide a more quantitative, and thereby a more useful, analysis of this dataset. The first index, QE, was used to quantify population diversity and classify each distribution as either homogeneous or heterogeneous. Using a black dashed line to denote the threshold QE value segregating homogeneous and heterogeneous distributions ( Fig. 2D-F , top row), we sorted QE values relative to this threshold value, landing within either the heterogeneous (red) or homogeneous (blue) regions on the graphs. (In subsequent KS and %OL plots ( Fig. 2D-F , middle and bottom rows, respectively), homogeneous distributions are shown as filled red circles and homogeneous distributions are shown as filled blue circles.) Next, distribution heterogeneity was further classified using goodness-of-fit (KS) tests to segregate only heterogeneous distributions into micro- and macroheterogeneous populations ( Fig. 2D-F , middle row). Last, the %OL present within a population was used to determine if excessive outliers were present, where “excessive” was defined as more outliers than are expected in a normal distribution (>4.5%). These points appeared above the threshold line in the plots in the bottom row of Fig. 2D-F .
Analysis of PHIs for our data led to additional observations and interesting trends. First, QE increased with IL-6 exposure time, and larger increases were observed over time for the two IL-6-treated populations. Also, the range of QE values increased with increasing exposure time. Relatively similar QE values were calculated for MM cells treated with IL-6 concentrations of 10 and 100 ng/mL, suggesting that exposure time affected STAT3 activation more than an increase in concentration from 10 to 100 ng/mL. All 4 h treatment times received homogeneous classification, regardless of treatment concentration, indicating that the distributions as a whole did not change under any condition until after 4 h. In summary, calculation of QE values enabled us to classify distributions as either homogeneous or heterogeneous, and showed that population diversity was also changing with concentration and exposure time.
In analyzing nonnormality in terms of the KS distance (eq 3), we observed that the majority of KS values were in the range of 0.04 < KS < 0.06, and only a few cases resulted in KS values exceeding the threshold and being classified as macroheterogeneous (12 and 24 h time points, for both 10 and 100 ng/mL IL-6). The middle row of Figure 2D-F shows six data points (four points for 12 h and two points for 24 h, all heterogeneous red) that exceeded the KS threshold, and which corresponded to several of the population distributions from Fig. 2B , C , where distributions were distinctly bimodal, and thus representative of a macroheterogeneity. The fact that only some of the experimental replicates (for the same condition) led to high KS values indicated high variability in the dataset (particular for the 12 h time point at 10 ng/mL IL-6). This variability between replicates was also observed in the mean IR values, but making this observation using KS values further helped identify the source of this variability as the nonnormality of different distributions across experiments.
Finally, %OL was analyzed ( Fig. 2D-F , bottom row), and results showed that %OL was similar to that of a normal distribution for short exposure times, and that %OL consistently decreased with longer exposure time. Both 12 h and 24 h exposure times yielded similar outlier rates, much less than the expected rate for a normal distribution (and only one case showed %OL exceeding the threshold).
Cell Seeding Population Analysis
After applying PHIs to analyze previous data, we sought to further apply PHIs to a new study designed to quantify the changes in population heterogeneity due to changing cell population sizes in our experiments. As stated above, patient sample yield is a critical limitation in clinical applications, and represents a major challenge when employing CSRAs as a potential tool to screen patient cells over a range of therapeutic options. Therefore, the choice of cell seeding size in each well of a CSRA (or other assay) is important because it impacts the amount of information that can be obtained from a fixed amount of precious sample, which will ultimately be used to guide therapeutic decisions. Reducing cell numbers per well (or microsystem) would significantly increase throughput, but this reduction must be achieved without adversely affecting the readout that will be reported.
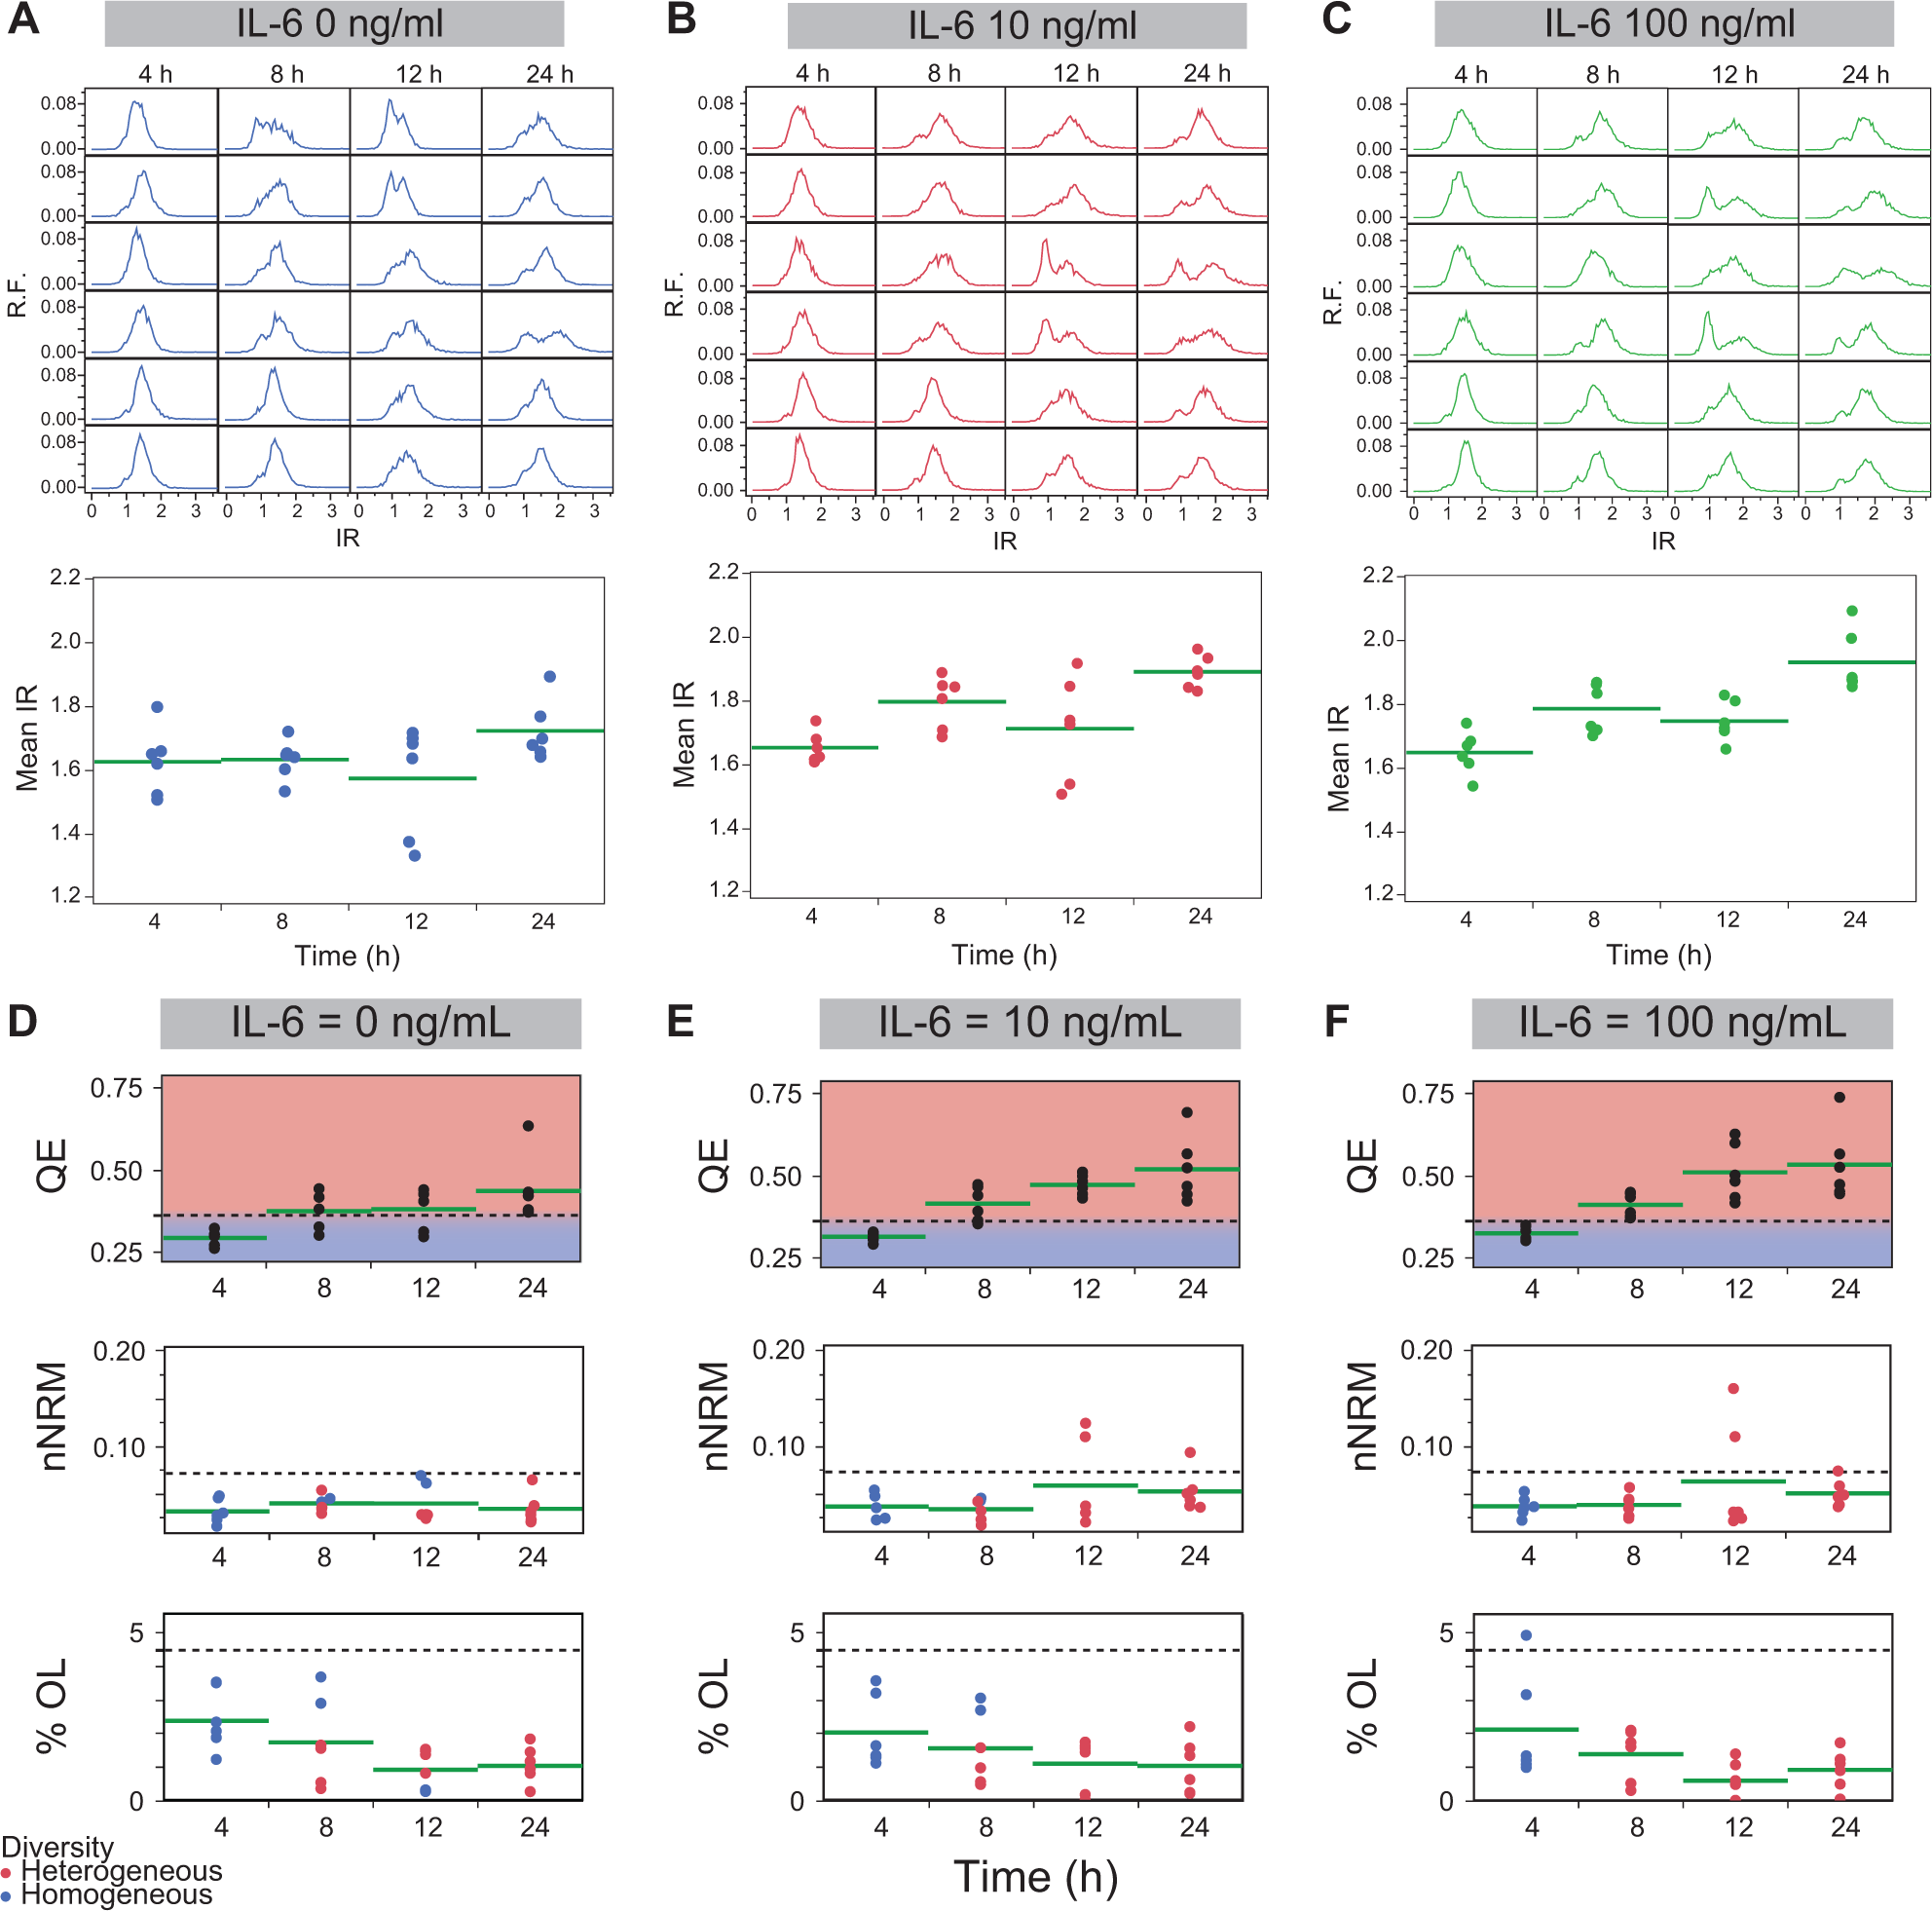
In this study, we first performed cytotoxicity assays, and obtained dose–response curves and corresponding IC50 values for each of five different cell seeding population sizes tested. Pak et al. recently employed cytotoxicity assays in a similar microfluidic platform (termed MicroC 3 ) for the testing of MM patient cells with BTZ to determine whether a patient would be responsive or resistant to BTZ treatment. 22 Based on these findings, we wanted to first assess the impact of changing population size on a simple metric like viability before we sought to detect more subtle changes to population distributions (e.g., IR values) in terms of PHIs. RPMI8226 cells tested in these experiments were treated with the MM drug CFZ. Previous viability experiments from our lab (unpublished) produced an IC50 value of ~102 nM when treating MM cells with CFZ in a PDMS microsystem, and we used this value as our reference. We tested population sizes that included 1250, 1875, 2500, 3750, and 5000 cells seeded (indicated as 0.250X, 0.375X, 0.500X, 0.750X, and 1.000X in Fig. 3 ). All dose–response curves were overlaid, illustrating consistent IC50 values between all cell population sizes ( Fig. 3F ). The fact that this cytotoxicity data showed very little change across the range of population sizes was an indication that it may be feasible to decrease the cell population size to as low as 0.250X (~1250 cells).
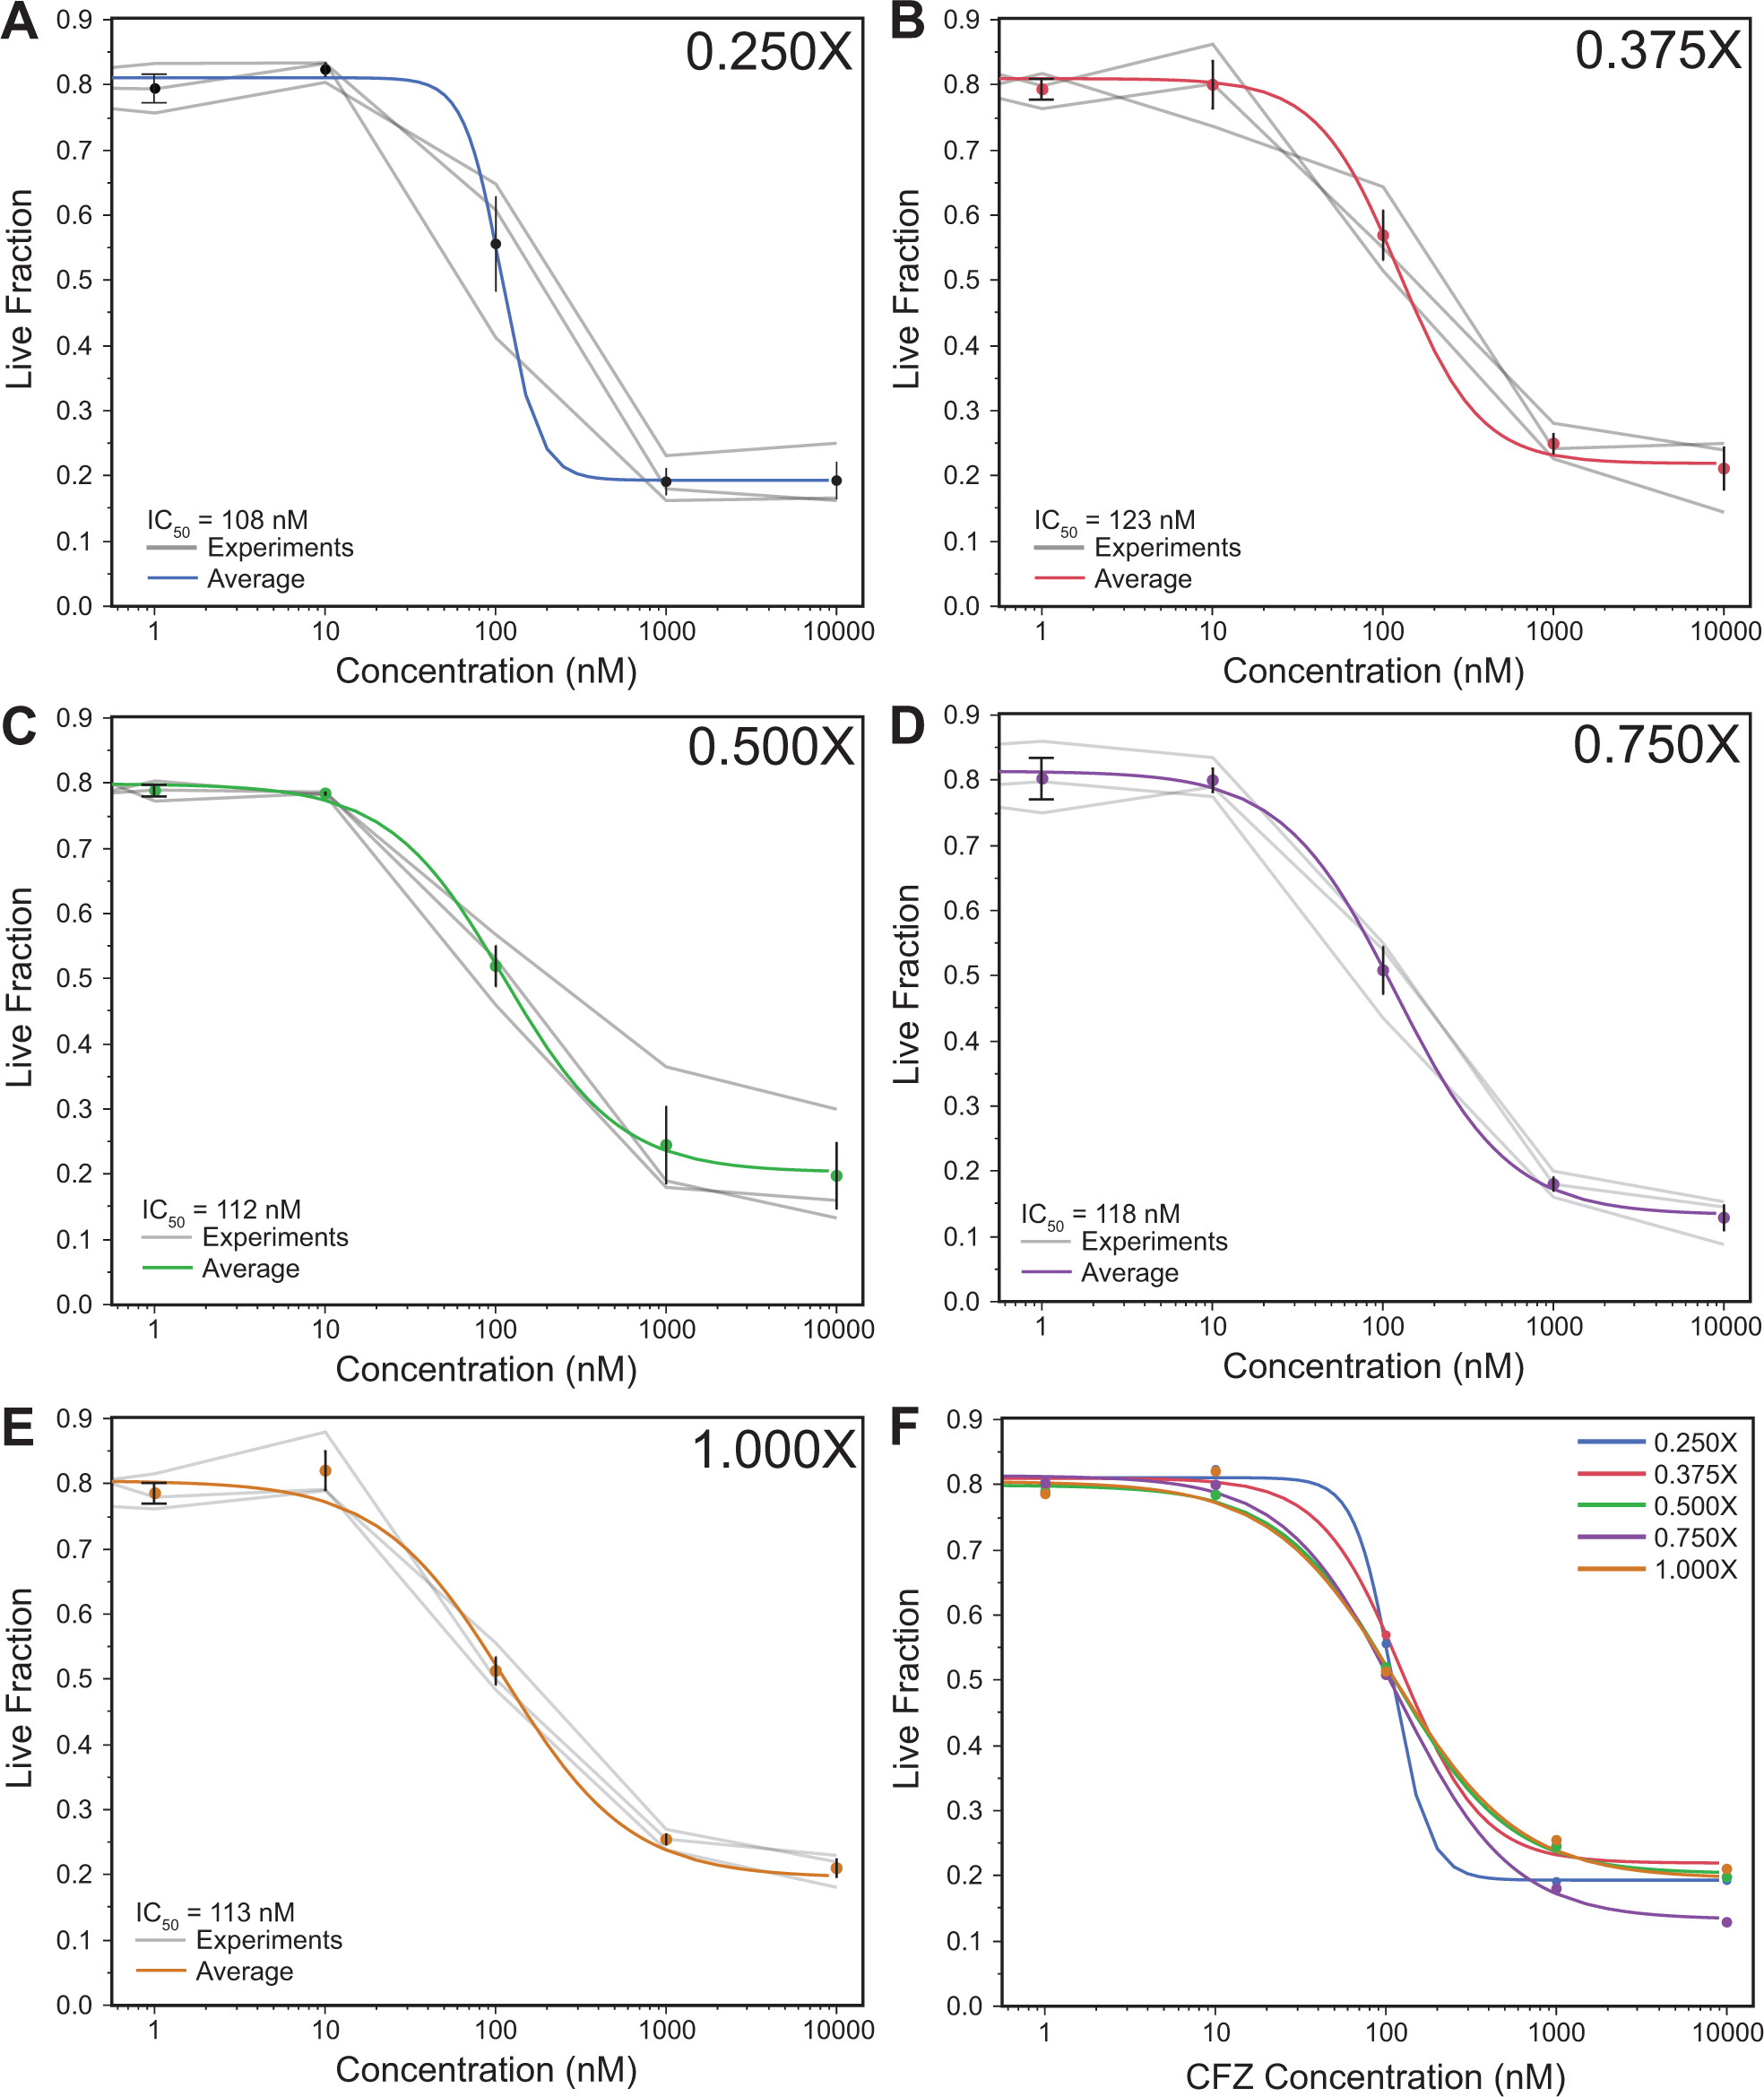
Dose–response curves for each cell population size tested. (
Subsequently, we performed μSCeNT assays to evaluate STAT3 and NF-κB activation in terms of PHIs for different cell population sizes to find potential patterns in the changes of population heterogeneity. We hypothesized that more subtle differences between population sizes may be detectable using heterogeneity indices applied to population distributions, and that these subtle differences would not have been observable via cytotoxicity assays alone. Similar to the data analysis presented in Figure 2A–C , the μSCeNT assay data was first analyzed by comparing distributions of cell population IRs, and studying how the shape of these IR distributions changed with and without cytokine treatment across various cell population sizes ( Suppl. Fig. S2A,D ). Next, μSCeNT data were analyzed by calculating the mean IR values for each experimental microsystem and comparing treated and untreated cell populations across the different cell population sizes ( Suppl. Fig. S2B,C,E,F ).
First, when we reviewed the population distributions created using μSCeNT assay data, we observed a smaller shift between the TNF-α-treated and untreated distributions for the 0.250X population size compared with all other population sizes ( Suppl. Fig. S2D ). In contrast, across all population sizes for IL-6 treatment, distributions of treated cells appeared to shift in a similar manner with respect to distributions of untreated cells ( Suppl. Fig. S2A ). We also observed that NF-κB and STAT3 distributions were more skewed at smaller population sizes, and distributions appeared more like normal distributions as population size increased ( Suppl. Fig. S2A,D ). Next, when we reviewed the mean IR values, we again observed a smaller shift for 0.250X population size in the TNF-α-treated populations compared with the untreated populations ( Suppl. Fig. S2E,F ). Overall, when we consider data from both the cytotoxicity and μSCeNT assays, the STAT3 and viability data both suggested that all population sizes responded similarly, whereas the NF-κB data showed a difference in activation when reducing population size down to 0.250X ( Suppl. Fig. S2 ).
When reviewing QE results for both STAT3 and NF-κB μSCeNT assays ( Figs. 4 and 5 ), almost all untreated cells were homogeneous, and all cytokine-treated cells were heterogeneous, and there was a clear division between treated and untreated IR distribution QE values for all population sizes of 0.375X and greater. The only exception was for the 0.250X population size, in which the treated and untreated population QE values overlapped ( Fig. 5A ), with no clearly defined separation present as observed for all other population sizes. The p value obtained for a two-sample t test comparing the TNF-α-treated and untreated cells for the 0.250X condition (p = 0.0244) was much greater than the p values calculated for all other populations (p < 0.0005), indicating that these two groups only barely reject the null hypothesis when compared with all other populations tested. The 0.250X population size produced KS and QE values that were shifted with respect to the remaining population sizes ( Figs. 4B , C and 5B , C ). The spread of the KS values was also observed to increase on occasion for the 0.250X population size compared with all other population sizes. %OL values were almost all below the threshold of 4.5% for all treatment conditions and population sizes. We observed a small increase in the spread of data points for the untreated 0.375X population size condition ( Fig. 4D ). Overall, the QE and KS values illustrated a quantifiable change in the PHIs of IR distributions when the population size decreased to 0.250X, suggesting that for this population size, the IR distribution may produce a biological response, unlike the other population sizes analyzed.
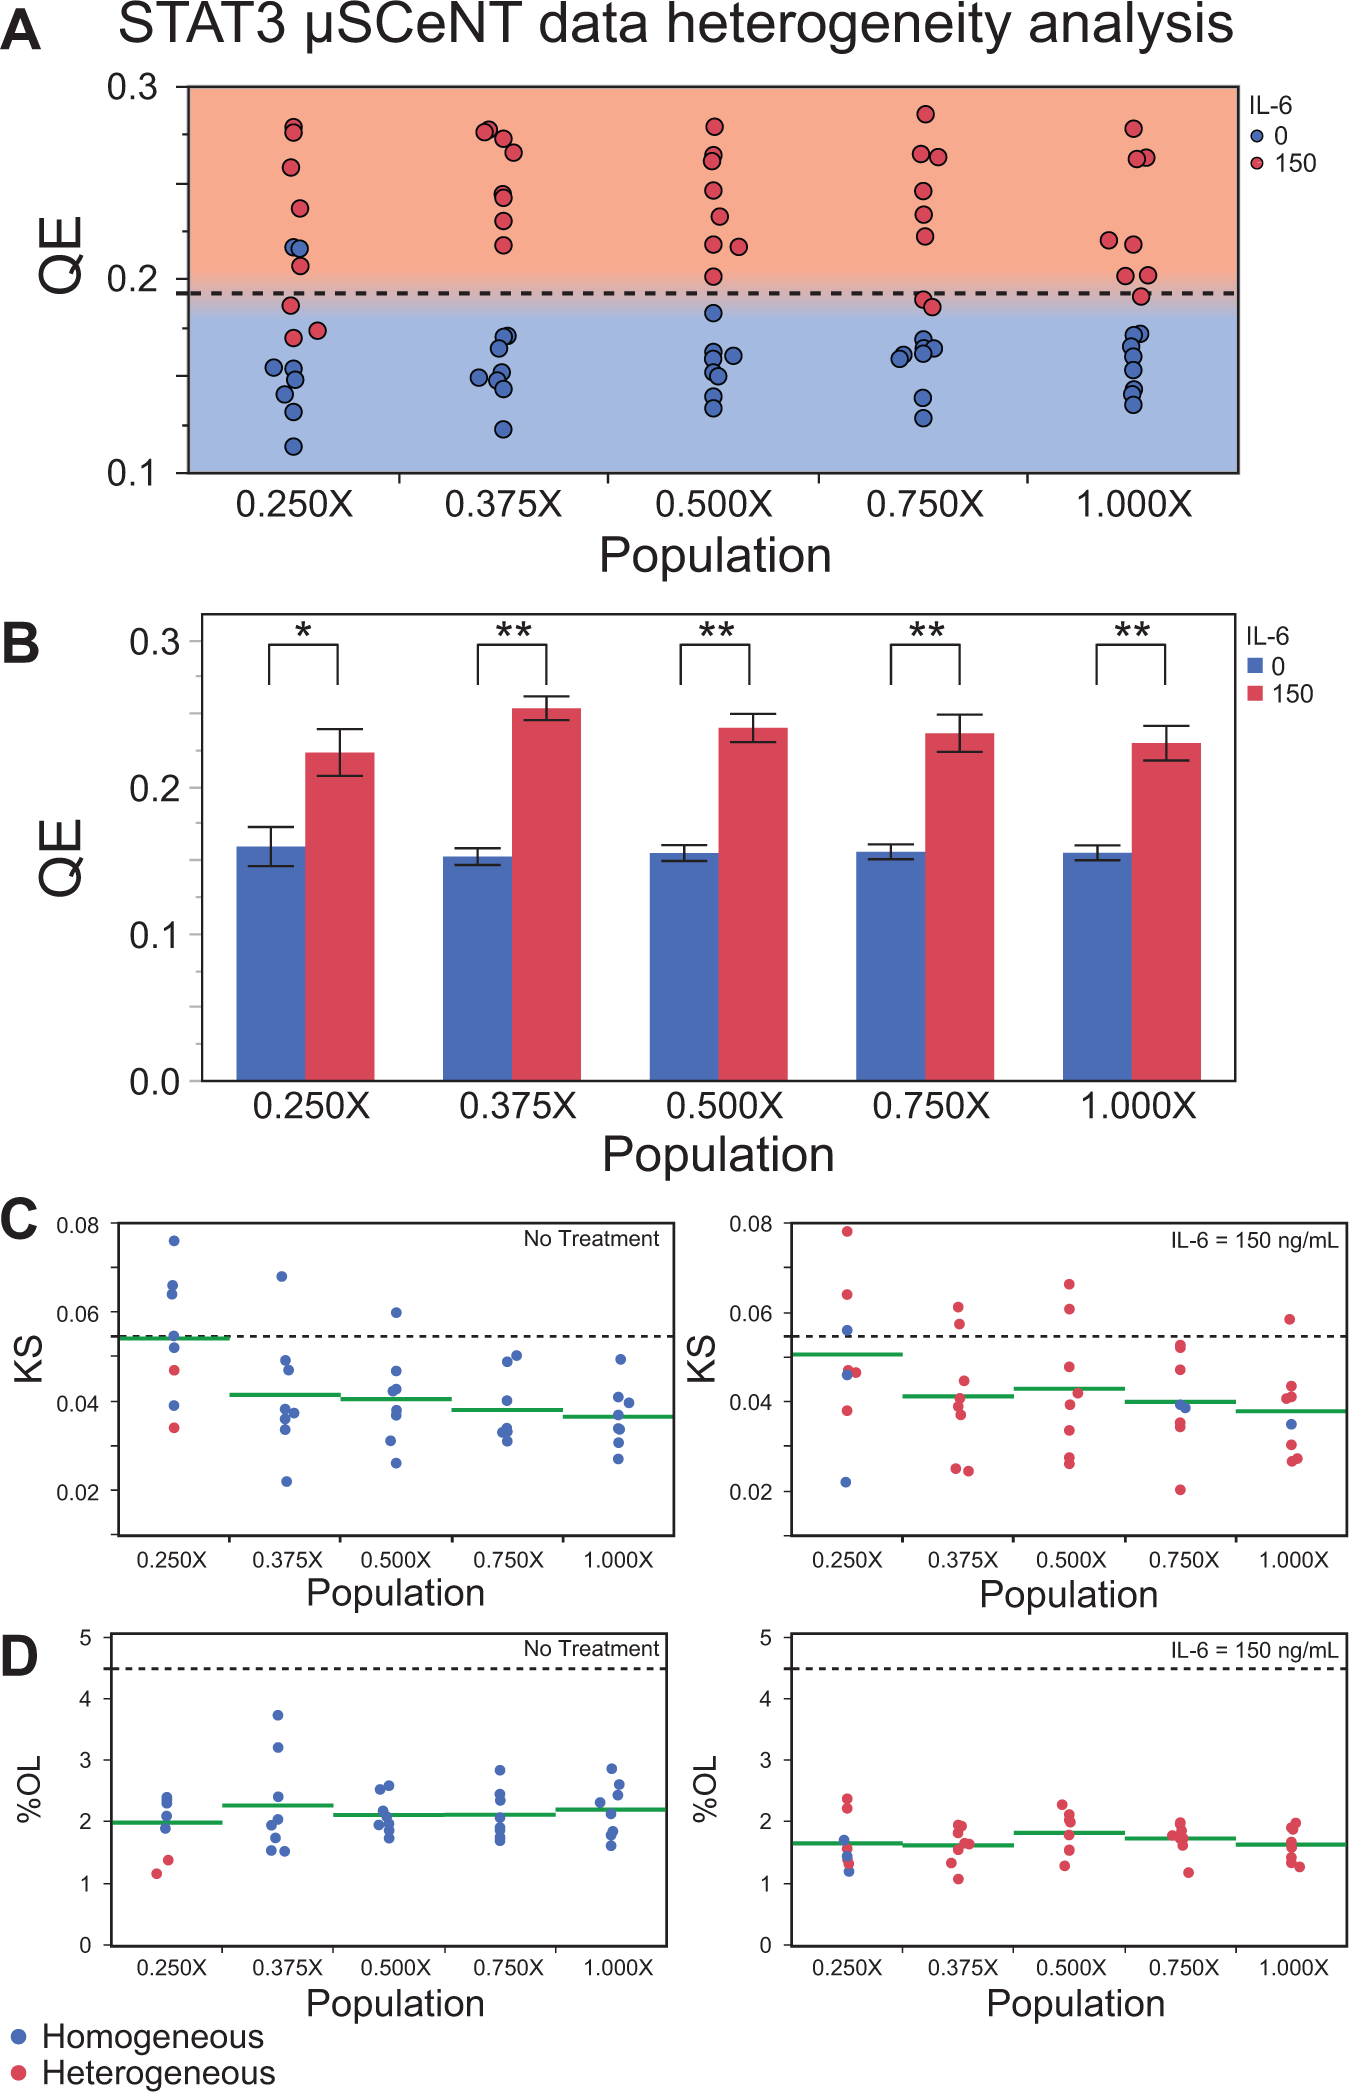
STAT3 μSCeNT data analyzed using PHIs. (
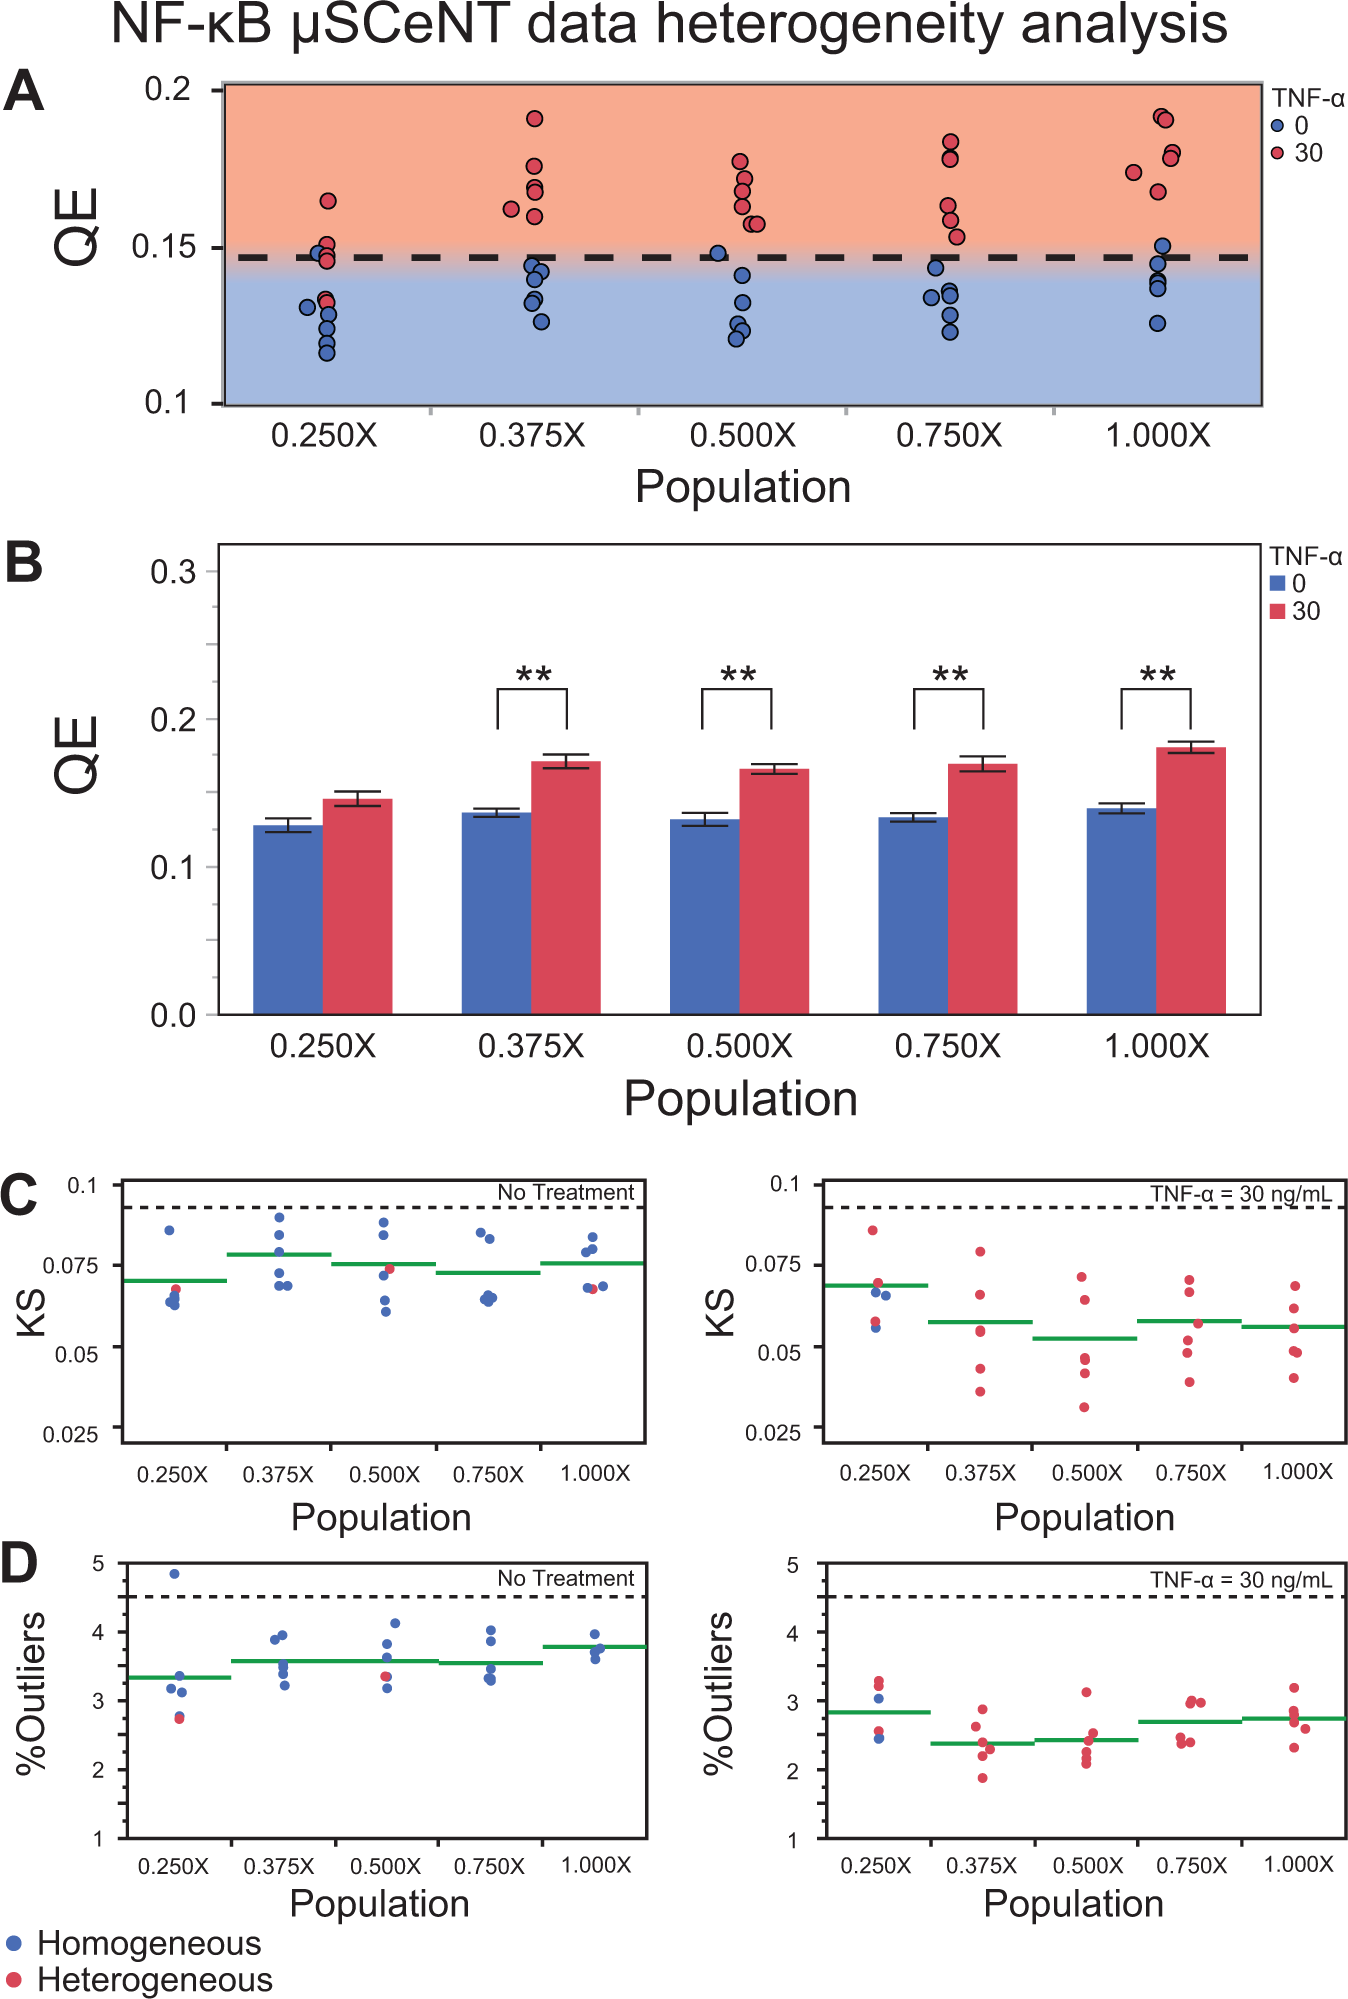
NF-κB μSCeNT data analyzed using PHIs. (
Discussion
By comparing qualitative and quantitative methods for analyzing cell population data, we showed that the PHI approach produced a more quantitative and insightful analysis of the dataset from which additional observations and trends may be detected. Two datasets were analyzed here, one obtained from a previously published study on diffusion profiles of small molecules in microfluidic systems, and a second set from new experiments performed to study the effect of decreasing cell population size in a given microsystem of an assay. When qualitative analysis methods were used (e.g., visual comparison of the “shifts” in a population distribution), it was difficult to establish clear trends, and identify subtle changes regarding how cell populations evolved. In addition, nonnormal IR distributions obtained by μSCeNT assays illustrate how averaging the response of a cell population to arrive at a mean IR value (similar to analysis by gel shift assays) leads to loss of information, and should only be reserved when normal population distributions are expected. In contrast to these methods, the use of PHIs enabled us to observe how changing exposure times and IL-6 treatment concentrations yielded heterogeneous populations, as well as trends observed as these treatments were varied. PHIs provided a method with which cell population distributions could be classified depending on the degree of heterogeneity measured. Furthermore, the PHIs prevented the loss of key information due to population averaging, which, as previously reported, is a major concern when developing cell-based assays. 4
Given the value of applying PHIs to analyze microsystem-derived cell population distributions (as demonstrated with our previous data), we hypothesized that PHIs may also be useful for analyzing the effects of changing the population size in our assays, since distribution shapes are clearly a function of population size, and reducing population size would be advantageous to the throughput of the assay. The effect of this population reduction was studied first using population-averaged cytotoxicity assays for which all population sizes appeared to respond similarly (i.e., produced similar IC50 values). Next, the impact of decreasing population size was studied using μSCeNT assays, and it was found that the smallest population size (0.250X, or ~1250 cells) was different in response compared with all other population sizes. These results suggested that a reduction in seeding population size to ~1250 cells (0.250X) may lead to different behaviors and thus a different readout from the assay, whereas a reduction to ~1875 cells (0.375X) may maintain the same cell behaviors and produce the same readouts as those obtained from ~5000 cells (1.000X). However, experiments using additional cell lines and patient samples would be necessary to provide further confirmation of these observations. The important point to consider here is that a reduction in population size (and in turn the cell seeding size or density) may be possible for microfluidic systems, from ~5000 to ~1875 (~2.7X decrease), and would be advantageous for increasing throughput and reducing consumption of precious samples. Many patients are unable to provide sufficient quantities of cells to allow the screening of potential treatment options.22,23 Reducing population size will not only allow more patients to qualify and be tested for individualized treatment selection, but also increase the range of potential therapies that can be tested, leading to a higher chance of finding the optimal therapeutic choice for a given individual.
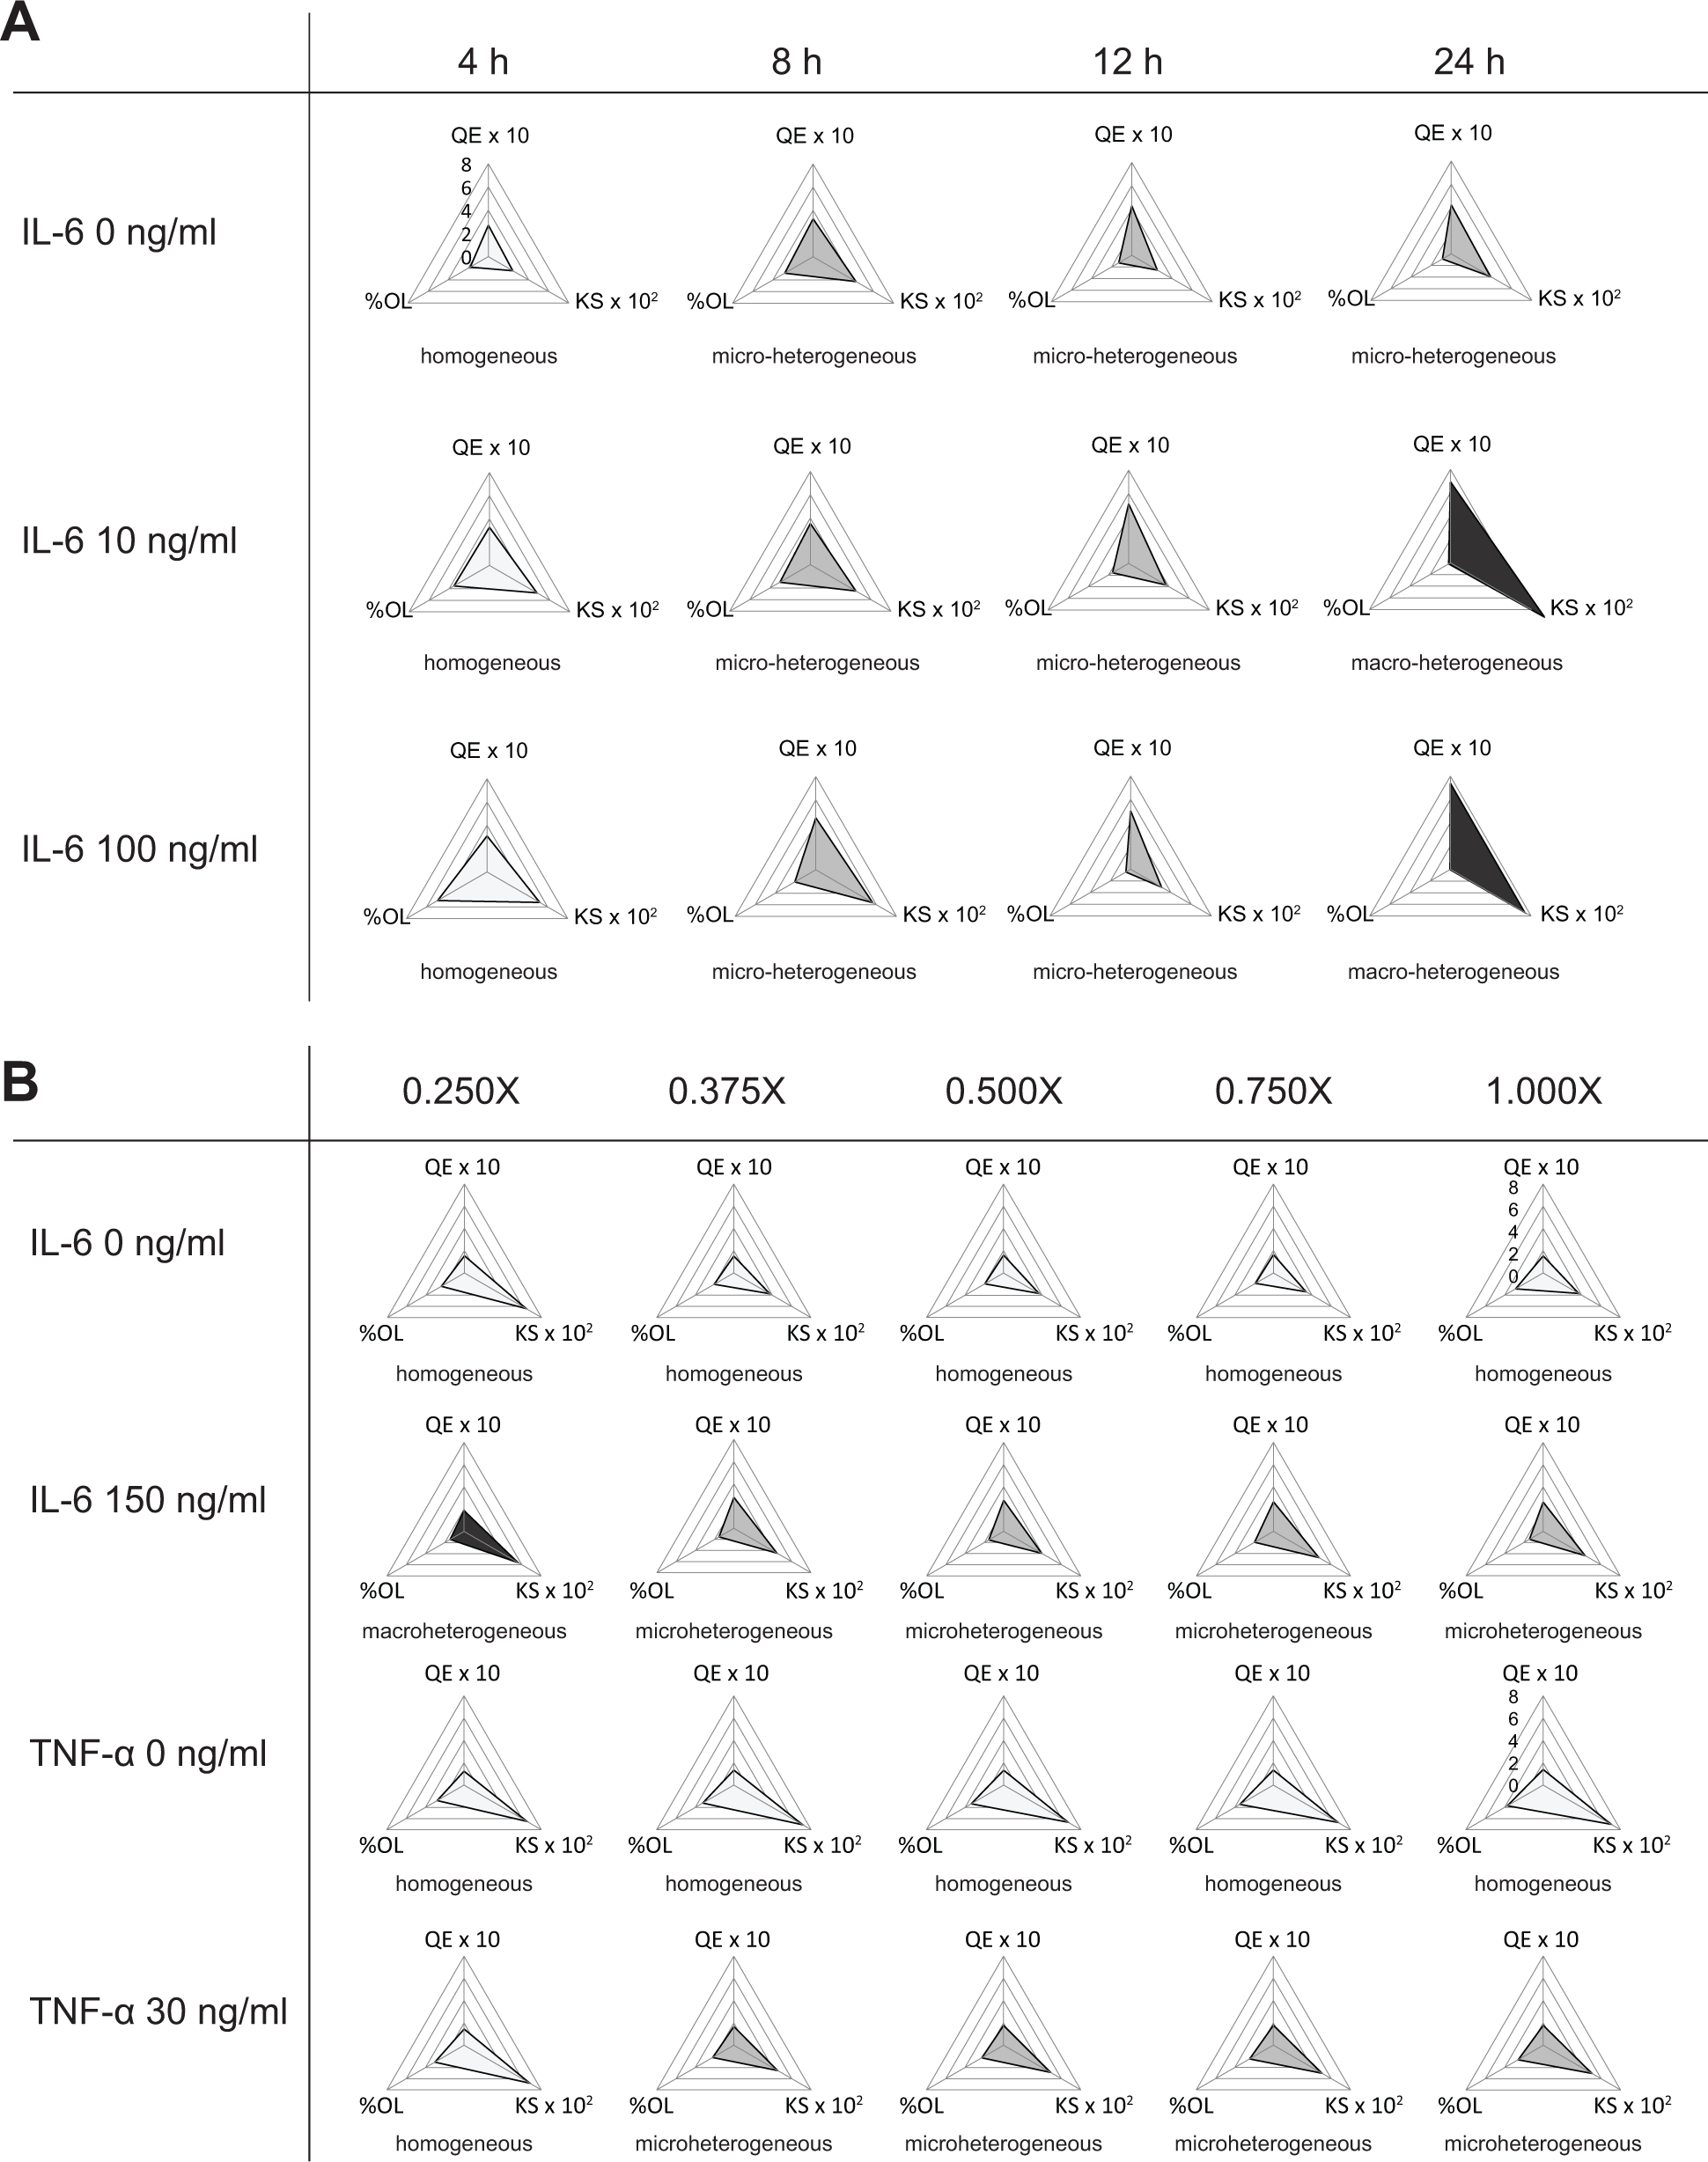
Overall, the use of PHIs for our previously published data gave us additional insight into the behavior of entire cell populations not previously described using only mean or averaged population IR values as the readout. Interestingly, this additional insight can be further presented as radar plots that visually “map” the extent of diversity, nonnormality, and %OL that appear in each cell population ( Fig. 6A , B ). Using these radar plots, we were able to identify a distinct change in cell population response as we increased IL-6 concentration and IL-6 treatment exposure time ( Fig. 6A ). Additionally, we were able to clearly identify a sudden change in population behavior ( Fig. 6B ) for the 0.250X population size, where microheterogeneities for IL-6 150 ng/mL treatment suddenly switched to macroheterogeneities, and microheterogeneities for TNF-α 30 ng/mL treatment suddenly switched to homogeneities. These observations were not detectable without the use of PHIs. Using these radar plots to present cell population data may give us another visual tool to describe the nature of the heterogeneity, and how this heterogeneity shifts or evolves under changing experimental conditions (e.g., time and concentration).
(
The use of radar plots as a tool to map the PHIs for each test condition was a simple way to visualize the evolution of population distributions in terms of heterogeneity. Indeed, the distributions themselves will contain all the original information and data, and a keen observer will likely be able to identify key population-based features from these distributions. The radar plots may serve as a useful alternative to specifically capture changes in diversity, nonnormality, and outlier effects, all displayed simultaneously to reveal which heterogeneity effects are dominant in a given scenario. Recently, researchers have studied population heterogeneity to help identify patient prognosis 24 and therapy selection, 25 and the use of simple, easy-to-interpret radar plots may be more attractive and visually intuitive to a potential end user, such as in a clinical setting or in drug discovery.
Overall, microfluidic cell culture systems are increasingly being developed as advanced cell-based assays, including for use as CSRAs for cancer therapy selection. Continued application of microfluidic systems in biology and medicine will rely on our ability to increase throughput, reduce rare sample consumption, and discover new ways to analyze data that capture important properties of entire cell populations, such as their heterogeneity. This study applied heterogeneity indices as quantitative metrics to analyze microfluidics-derived cell population data, and showed that these indices can provide a new way to look at the evolving cell population distributions within a microfluidic setting. Importantly, heterogeneity indices were employed to reveal that it may be possible to reduce population size within a given assay, but that a limit to this reduction exists before significant differences are detected by these heterogeneity indices. Thus, this study provides support for achieving more advanced and potentially more useful assays through the integration of microfluidics with heterogeneity analyses.
Footnotes
Acknowledgements
We acknowledge that E. W. K. has financial interests in Lynx Biosciences LLC, without any conflict of interest.
Supplementary material is available online with this article.
Declaration of Conflicting Interests
The authors declared no potential conflicts of interest with respect to the research, authorship, and/or publication of this article.
Funding
The authors disclosed receipt of the following financial support for the research, authorship, and/or publication of this article: the Cancer Research Society and the Natural Sciences and Engineering Research Council of Canada (NSERC) to E.W.K.Y., and from the NSERC CREATE Training Program in Organ-on-a-Chip Engineering & Entrepreneurship (TOeP) to T.A.M., and the Canadian Foundation for Innovation (CFI) for equipment and infrastructure support.
References
Supplementary Material
Please find the following supplemental material available below.
For Open Access articles published under a Creative Commons License, all supplemental material carries the same license as the article it is associated with.
For non-Open Access articles published, all supplemental material carries a non-exclusive license, and permission requests for re-use of supplemental material or any part of supplemental material shall be sent directly to the copyright owner as specified in the copyright notice associated with the article.