
Abstract
Three-dimensional tumor spheroid models have been increasingly used to investigate and characterize cancer drug compounds. Previously, the Celigo image cytometer has demonstrated its utility in a high-throughput screening manner for evaluating potential drug candidates in a 3D multicellular tumor spheroid (MCTS) primary screen. In addition, we have developed real-time kinetic caspase 3/7 apoptosis and propidium iodide viability 3D MCTS assays, both of which can be used in a secondary screen to better characterize the hit compounds. In this work, we monitored the kinetic apoptotic and cytotoxic effects of 14 compounds in 3D MCTS produced from the glioblastoma cell line U87MG in 384-well plates for 9 days. The kinetic results allowed the categorization of the effects from 14 drug compounds into early and late cytotoxic, apoptotic, cytostatic, and no effects. The real-time apoptosis and viability screening method can serve as an improved secondary screen to better understand the mechanism of action of these potential drug candidates identified from the primary screen, allowing one to identify a more qualified drug candidate and streamline the drug discovery process of research and development.
Keywords
Introduction
Three-dimensional (3D) multicellular tumor spheroid (MCTS) models have been increasingly used for screening potential drug candidates due to the better representation of the complex in vivo tumor microenvironments.1 –4 Recently, we have demonstrated an endpoint-based high-throughput screening (HTS) method of 3D MCTS using the Celigo image cytometer (Lawrence, MA), which showed a novel method to rapidly perform a primary screen to assess drug effects on the tumor spheroids. 5 After potential drug candidates have been identified, these compounds would require a secondary screen to further characterize their anticancer effects. However, performing an endpoint-based secondary screen may not generate enough data to better characterize the hits but rather only provides a confirmation from the primary screening results.
We have also recently developed a novel kinetic detection method for 3D MCTS using image cytometry, 6 which allowed the monitoring of changes in viability and apoptosis of the tumor spheroids in real time. In this work, we demonstrate the application of the kinetic detection method to screen and characterize the kinetic apoptotic and cytotoxic effects of 14 drug compounds for ~9 days ( Fig. 1 ). First, human glioblastoma U87MG cells were fluorescently stained with caspase 3/7 or propidium iodide (PI) from Nexcelom Bioscience (Lawrence, MA), then allowed to form tumor spheroids for 4 days. Next, the tumor spheroids were treated with different drug concentrations of the 14 drug compounds to characterize their effects. The tumor spheroids were monitored daily in the green and red fluorescent channels to observe and quantify the kinetic apoptotic and cytotoxic effects of the drug compounds. We were able to categorize the kinetic effects of the 14 drugs into early and late cytotoxic, apoptotic, cytostatic, and no effects.
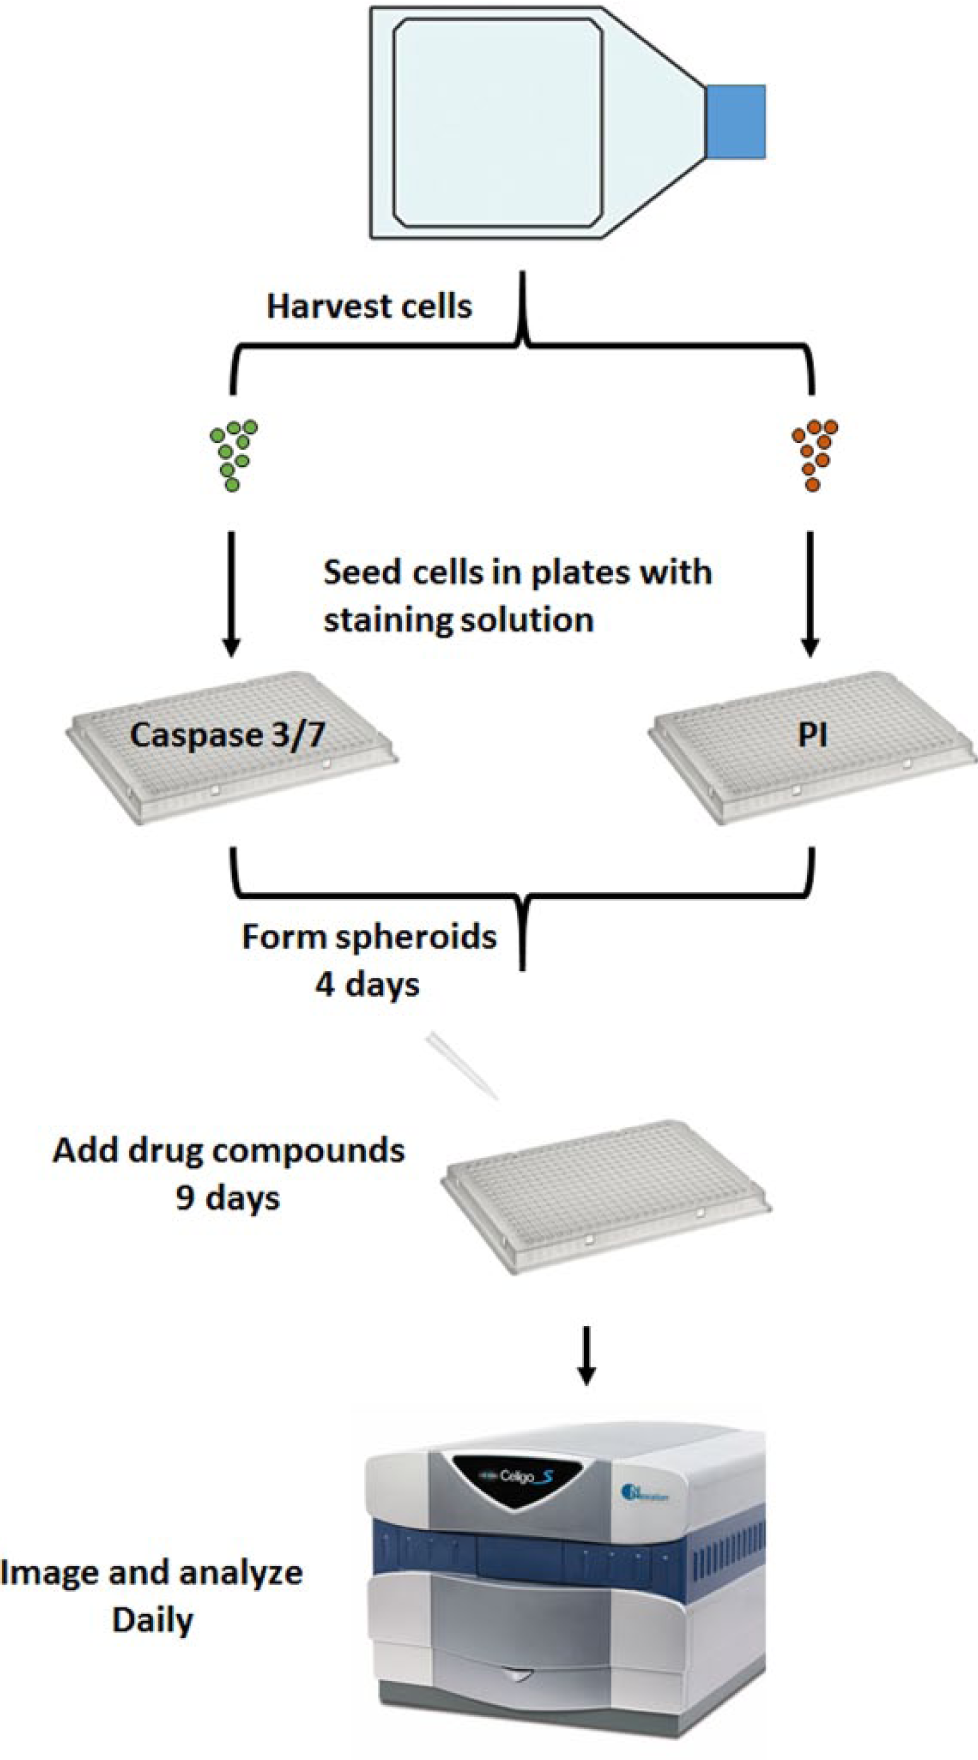
Experimental workflow of the real-time apoptosis and viability screening assay. First, U87MG cells were harvested from the flask. Next, the stained cells were seeded into two 384-well ultra-low attachment (ULA) plates with caspase 3/7 or propidium iodide (PI) staining solution. The plates were centrifuged and allowed to form spheroids in the incubator for 4 days. After the formation of spheroids, the drug compounds were added on day 4. The plates were imaged and analyzed daily for 9 more days using a Celigo image cytometer.
Furthermore, we also compared the effect of media replenishment on the drug effects, which did not display significant differences. Finally, the tumor spheroids were stained with Hoechst 33342 (Hoechst, Lawrence, MA) or calcein AM (Nexcelom Bioscience) for an endpoint measurement of spheroid diameter, caspase 3/7 fluorescent intensity, and calcein AM/PI fluorescence ratio. The endpoint data were compared to results obtained from previous publication, 5 which also showed no significant difference. The real-time apoptosis and viability screening method can serve as an improved secondary screen that can allow a better understanding of the potential drug candidates and their mechanism of action identified from the primary screen. As a result, one can triage these drug candidates more effectively, allowing them to be moved further downstream in the drug discovery research and development pipeline.
Materials and Methods
U87MG Cell Culture
U87MG cells (human glioblastoma adherent cell line, ATCC HTB-14) were cultured in Eagle’s minimal essential medium (EMEM) and Earle’s balanced salt solution (EBSS) basal media with 10% fetal bovine serum (FBS), 2 mM glutamine, 1% nonessential amino acids, and 1 mM sodium pyruvate (Gibco) in tissue culture (TC)-treated flasks at 37 °C and 5% CO2. The cultures were passaged when confluency reached ~80% to 90%.
Drug Compound Preparation
The kinetic anticancer effects of the 14 drug compounds ( Suppl. Table S1 ) were monitored on U87MG MCTS in real time. The drug compounds were generously donated by Dr. Steven Titus at the High Content Imaging and Discovery at National Center for Advancing Translational Sciences (NCATS). The drug compounds selected were sunitinib malate (compound 1),7,8 paclitaxel (compound 2),9,10 romidepsin (compound 3), 11 panobinostat (compound 4),12,13 GSK-2126458 (compound 5), 14 cisplatin A (compound 6), 15 bortezomib (compound 7), 16 carfilzomib (compound 8), 17 cisplatin B (compound 9), sorafenib (compound 10), 18 trametinib (compound 11), 19 BEZ-235 (compound 12), 20 staurosporine (compound 13), 21 and 17-AAG (compound 14). 22 The stock concentration of each drug was 10 mM in 100% DMSO, which was then diluted to 2× working concentrations of 20, 10, 5, 2, 1, 0.2, and 0.1 µM (10, 5, 2.5, 1, 0.5, 0.1, and 0.05 µM final concentrations) for the MCTS kinetic viability and apoptosis assays. The drug compound titrations were added to the wells in the 384-well plates on day 4 after the formation of the MCTS using the plate map shown in Supplemental Figure S1 .
Celigo Image Cytometer Instrumentation and Software
The 3D MCTS assays have been demonstrated on a Celigo image cytometer in previous publications.5,22 –24 The Celigo used a transmission and epifluorescence optical setup for one bright-field (BF) and four fluorescent (FL) imaging channels (blue, green, red, and far red) to perform plate-based image cytometry assays. Both BF and FL imaging channels used a high-power light-emitting diode (LED) for illumination and excitation. Each FL imaging channel used a specific fluorescent filter set for the corresponding colors: blue (excitation: 377/50 nm, emission: 470/22 nm), green (excitation: 483/32 nm, emission: 536/40 nm), red (excitation: 531/40 nm, emission: 629/53 nm), and far red (excitation: 628/40 nm, emission: 688/31 nm). The combined optics and digital imaging allowed variable imaging resolutions from 1 to 8 µm 2 /pixel, where a 2-µm 2 /pixel resolution was selected for tumor spheroid image acquisition and analysis. A typical image acquisition and analysis time for an entire 96- or 384-well ultra-low attachment (ULA) plate is less than 2 min using bright-field imaging. The Celigo has the ability to perform auto-focusing using contrast- or LED-based focus. For tumor spheroids, the focal plane was manually registered, and due to the large depth of focus of the proprietary optics (~15–20 µm), only one image was required instead of a Z-stack.
The Celigo software allowed the selection of different applications for analysis of 3D MCTS. The “Tumorsphere 1 + Mask” and “Tumorsphere 1 + 2 + Mask” applications were used to measure spheroid diameter and fluorescent intensities of calcein AM (green channel), caspase 3/7 (green channel), and PI (red channel). In addition, the Hoechst stain used the blue channel for image acquisition. The results were exported to Excel (Microsoft, Redmond, WA) for further graphical analysis of the apoptotic, cytotoxic, and cytostatic effects of each tested drug compound. The bright-field imaging was set to the “Mask” channel, while green/red/blue fluorescence channels were set to the “Tumorsphere” channels. After image acquisition, the tumor spheroids were identified in the bright-field images to measure the diameter and set as mask using the default software algorithm. Next, the program used the mask to measure the fluorescent intensities in the other channels. Finally, the analyzed fluorescent intensities as well as spheroid diameters were then exported to Excel files for further analysis.
Kinetic MCTS Apoptosis and Viability Screening Assay Protocol
To monitor apoptosis and viability changes of drug-treated MCTS, a working concentration of 4 µM for the caspase 3/7 fluorescent stain (excitation: 500 nm, emission: 530 nm, CS1-V0002-1) and 2 µg/mL for PI (excitation: 535 nm, emission: 617 nm, CS1-0109-5mL) were prepared in EMEM (EBSS) basal media, supplemented with 2 mM glutamine, 1% nonessential amino acids, and 1 mM sodium pyruvate to stain the cells.
The U87MG cells were trypsinized and washed with cell culture media and subsequently resuspended in the PI or caspase 3/7 staining solutions. Next, the caspase 3/7–stained U87MG cells were seeded at 500 cells/well (40 µL/well) in two 384-well ULA round-bottom microplates (ULA-384U; Nexcelom Bioscience). The step was repeated for PI-stained cells. After the U87MG cells were seeded in each well, the four plates were immediately centrifuged at 300 × g for 10 min to cluster cells in the bottom of the well and allowed to incubate for 4 days at 37 °C and 5% CO2 to form the MCTS.
After the formation of tumor spheroids on day 4, a total of 40 µL of the 2× drug compound titrations (final 10, 5, 2.5, 1, 0.5, 0.1, and 0.05 µM) and DMSO controls (final 0.02%–0.0003%, same as the dilution of the drug compounds) was added in triplicate wells ( Suppl. Fig. S1 ), and the four plates were incubated for 9 days (~217 h). Each microplate was scanned and analyzed daily using the image cytometer posttreatment. On each day of image acquisition, the MCTS diameters, caspase 3/7, and PI fluorescent intensities were measured and plotted for the control and treated samples at each tested drug concentration. In addition, the MCTS in one of the two caspase 3/7 and PI plates were washed with media on days 7 and 11 to determine if media replenishment could affect drug effects on the tumor spheroids. At the end of the experiment on day 13, the two caspase 3/7–stained plates were further stained with Hoechst (excitation: 361 nm, emission: 497 nm, CS1-0128-5mL) by gently removing 40 µL of media using automated pipettors and replaced with 40 µL of the stock staining solution (8 µg/mL in phosphate-buffered saline [PBS]), resulting in a final staining concentration of 4 µg/mL. The two PI-stained plates were further stained with calcein AM (excitation: 490 nm, emission: 520 nm, CS1-0119) by gently removing 40 µL of media and replaced with 40 µL of the stock staining solution (2 µM in PBS), resulting in a final staining concentration of 1 µM. The four plates were then incubated at 37 °C and 5% CO2 for 60 min prior to performing the Celigo image cytometric analysis.
Image Cytometric Analysis Protocol
Each caspase 3/7–stained and PI-stained plate was scanned daily using the “Tumorsphere 1 (Green) + Mask (BF)” or “Tumorsphere 1 (Red) + Mask (BF)” application in the software, respectively. The exposure times for the green and red channels were 60,000 and 20,000 µs, respectively. In addition, the MCTS were stained with Hoechst or calcein AM on day 9 at the end of the kinetic analysis, and the plates were scanned using the “Tumorsphere 1 (Green) + 2 (Blue) + Mask (BF)” or “Tumorsphere 1 (Red) + 2 (Green) + Mask (BF)” application, respectively. The exposure times for the green and blue channels were both 60,000 µs for caspase 3/7 and Hoechst imaging. The exposure times for the red and green channels were 20,000 and 5000 µs, respectively, for PI and calcein AM imaging.
For the analysis, the MCTS were first identified in the bright-field images, where the time-dependent spheroid diameters and fluorescent intensities of caspase 3/7 and PI were measured and directly exported into Excel for time course graphical generation. In addition, the endpoint average calcein AM and PI fluorescent intensities were used to calculate the ratio of
Results and Discussion
Comparison of Drug Screening Endpoint and Kinetic Results with or without Media Replenishment
One of the questions we would like answer in this experiment was to investigate if media replenishment can affect the overall drug effects on the U87MG MCTS. The endpoint results comparing spheroid size, caspase 3/7 fluorescence, and calcein AM/PI intensity ratio showed comparable drug effect trends ( Fig. 2 ) between samples with or without media replenishment. Using a drug compound effect scoring method, 5 the endpoint screening scores of each compound acquired in this experiment were highly comparable to the endpoint scores obtained in a previous publication 5 ( Suppl. Table S2 ), which demonstrated highly consistent and repeatable results. Interestingly, the spheroid sizes for the control and drug compounds that did not inhibit growth were noticeably larger by 100 µm, indicating that additional media nutrients may have allowed the spheroids to grow larger ( Fig. 2 ). Both caspase 3/7 and PI (increase in calcein AM/PI ratio) fluorescent intensities showed a slight decrease with media replenishment, as expected due to the removal of fluorescent molecules. In addition, Supplemental Figures S2 and S3 show the time- and dose-dependent drug effects on the tumor spheroids with or without media replenishment, respectively. The kinetic results showed comparable trends of spheroid size, caspase 3/7, and PI fluorescent intensities for all of the drug compounds, which demonstrated that media replenishment did not change the effects of the drugs.
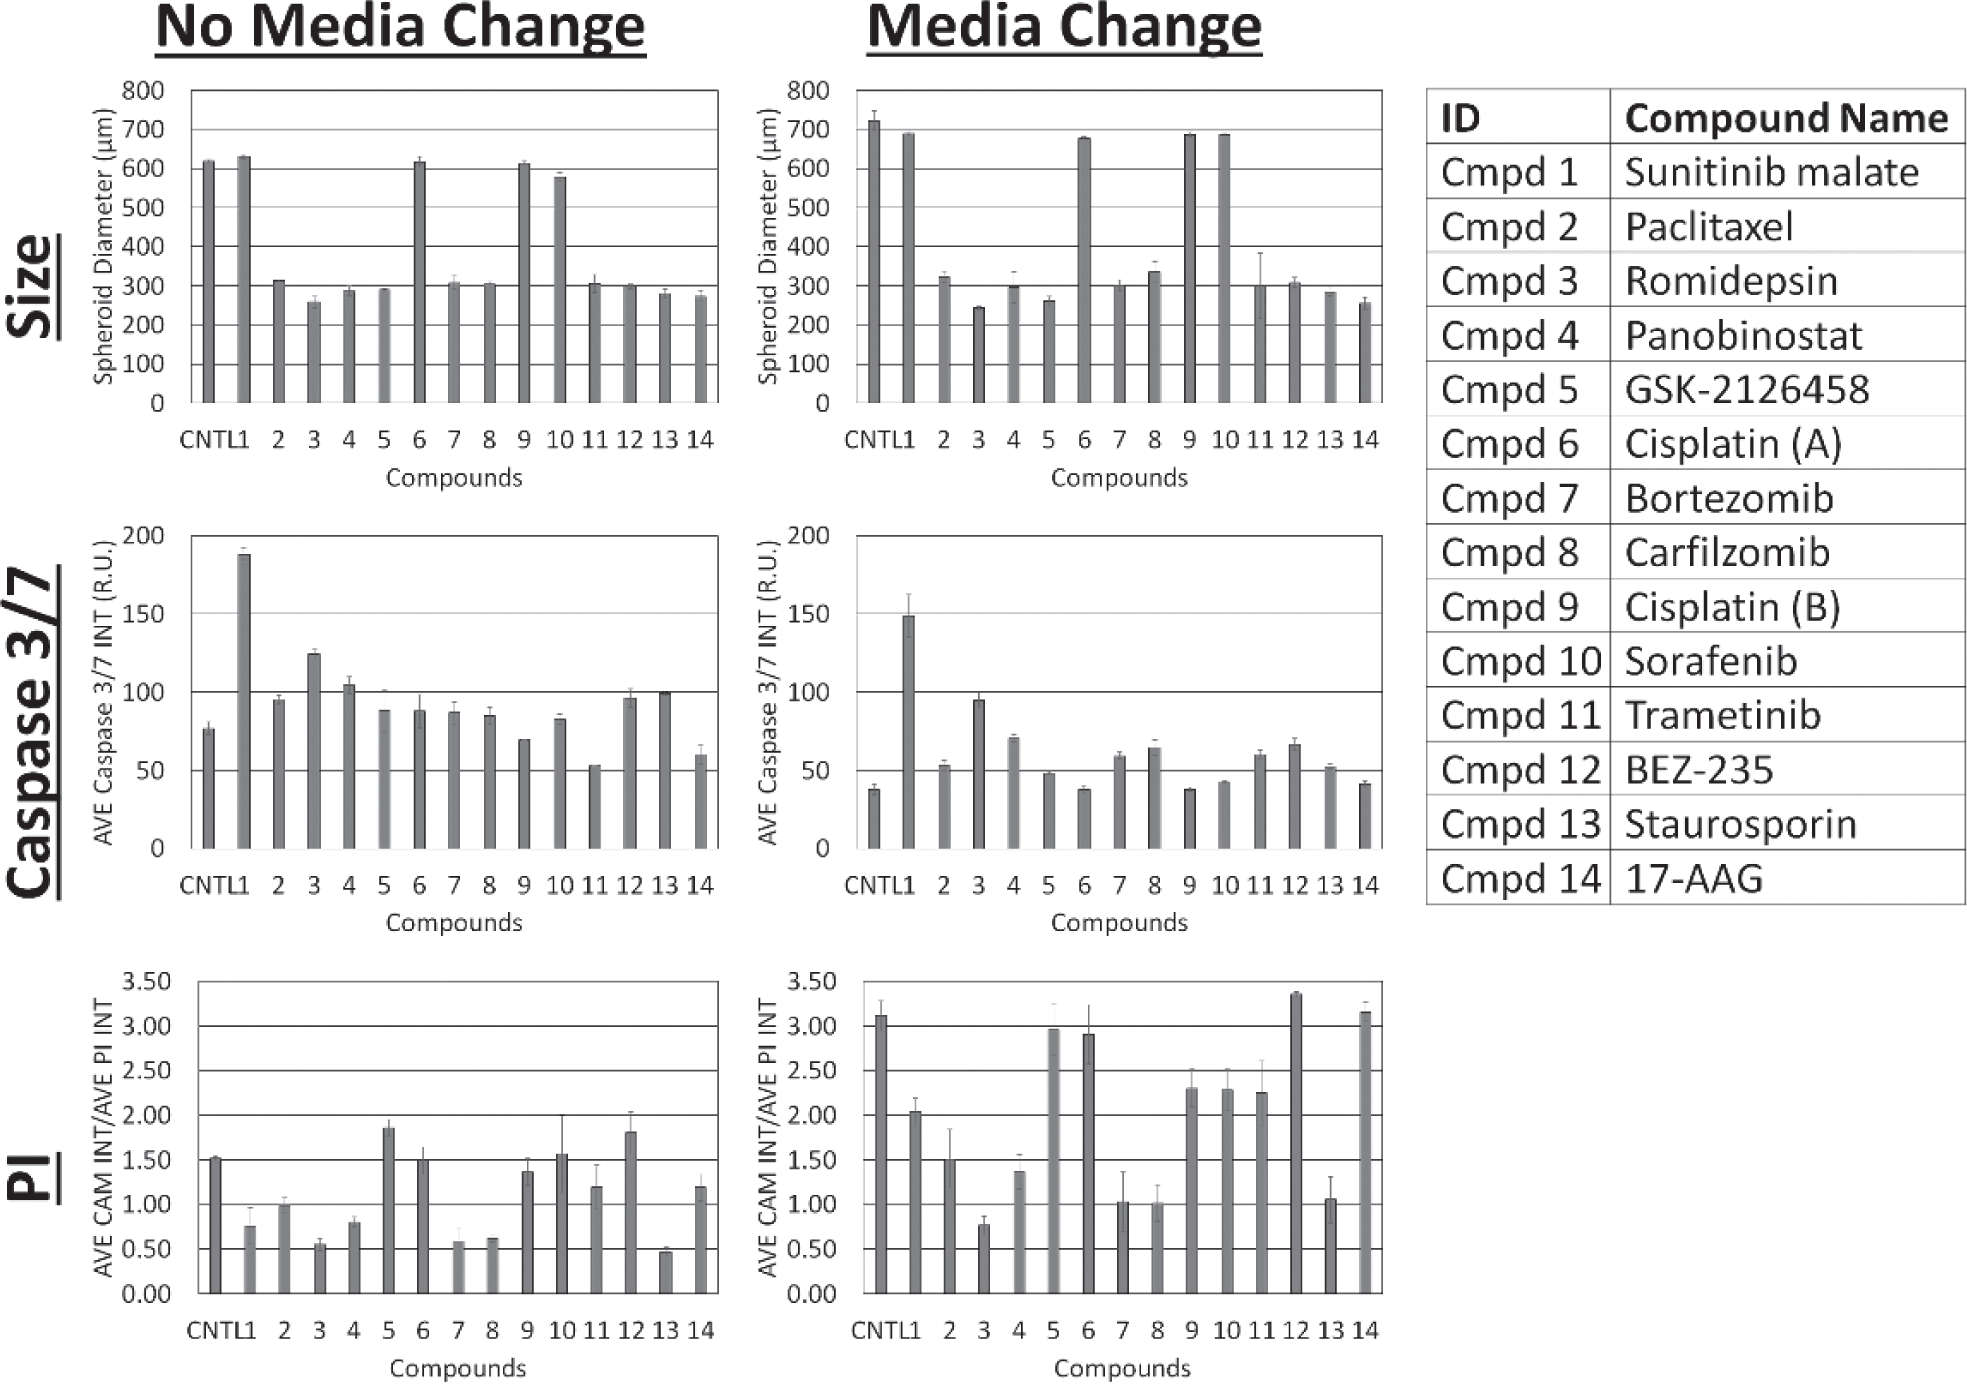
Endpoint graphs of tumor spheroid size, caspase 3/7 intensity, and calcein AM/propidium iodide (PI) fluorescence ratio with and without media replenishment. The results showed consistent trends for the three measured parameters (n = 6). However, an increase in spheroid size for the control and drugs without effects was observed. In addition, the caspase 3/7 and PI fluorescence showed reduction due to removal of fluorescent molecules after media replenishment. The results shown here were treated with 5 µM of drug compounds.
MCTS Apoptosis and Viability Real-Time Screening Results
The time course apoptosis and viability of MCTS were determined to characterize the kinetic effects of the 14 drug compounds. After examining the captured bright-field and fluorescent images, five distinct characteristics of drug effects could be categorized. Figure 3a,b shows examples of time course bright-field and fluorescent overlay images for caspase 3/7 (apoptosis) and PI (viability) with the endpoint fluorescent overlay images of Hoechst/caspase 3/7 and calcein AM/PI on day 9. The changes in caspase 3/7 and PI fluorescence can also be observed in the time-lapse videos ( Suppl. Video S1 ). The control spheroid showed increasing size as well as the formation of a necrotic core indicated by the bright caspase 3/7 and PI fluorescence. Sunitinib malate showed a normal increase in size and PI fluorescence, as well as a bright calcein AM signal, but the caspase 3/7 signals drastically increased. The background fluorescence was much higher than other drug compounds throughout the entire duration, which could be due to the autofluorescent property of sunitinib malate 25 ; thus, it was uncertain that the increase in caspase 3/7 signal was due to an increase in apoptosis or absorption of the drug compound into the spheroid. Therefore, it may be better to use another fluorescent color for caspase 3/7 to investigate the apoptotic effect of sunitinib malate. Paclitaxel showed a high level of growth inhibition, as indicated by the reduction in size of the MCTS compared to that of the control. Interestingly, a bright PI fluorescence core was initiated on day 4 and became brighter throughout the time course of the assay, but the caspase 3/7 fluorescence remained at a low level. GSK-2126458 also showed a high level of growth inhibition, and both caspase 3/7 and PI fluorescence were detected early at day 2 and remained relatively similar to the control throughout the time course of the assay. Upon the endpoint staining with calcein AM, we also observed a high signal that appeared to be on the periphery of the MCTS and outside of the PI necrotic core. Cisplatin A showed no observable drug-induced effects, similar to the control. Finally, bortezomib showed a high level of growth inhibition, where bright caspase 3/7 and PI fluorescence could be observed starting on day 2 and no viable staining on day 9 with the addition of calcein AM.
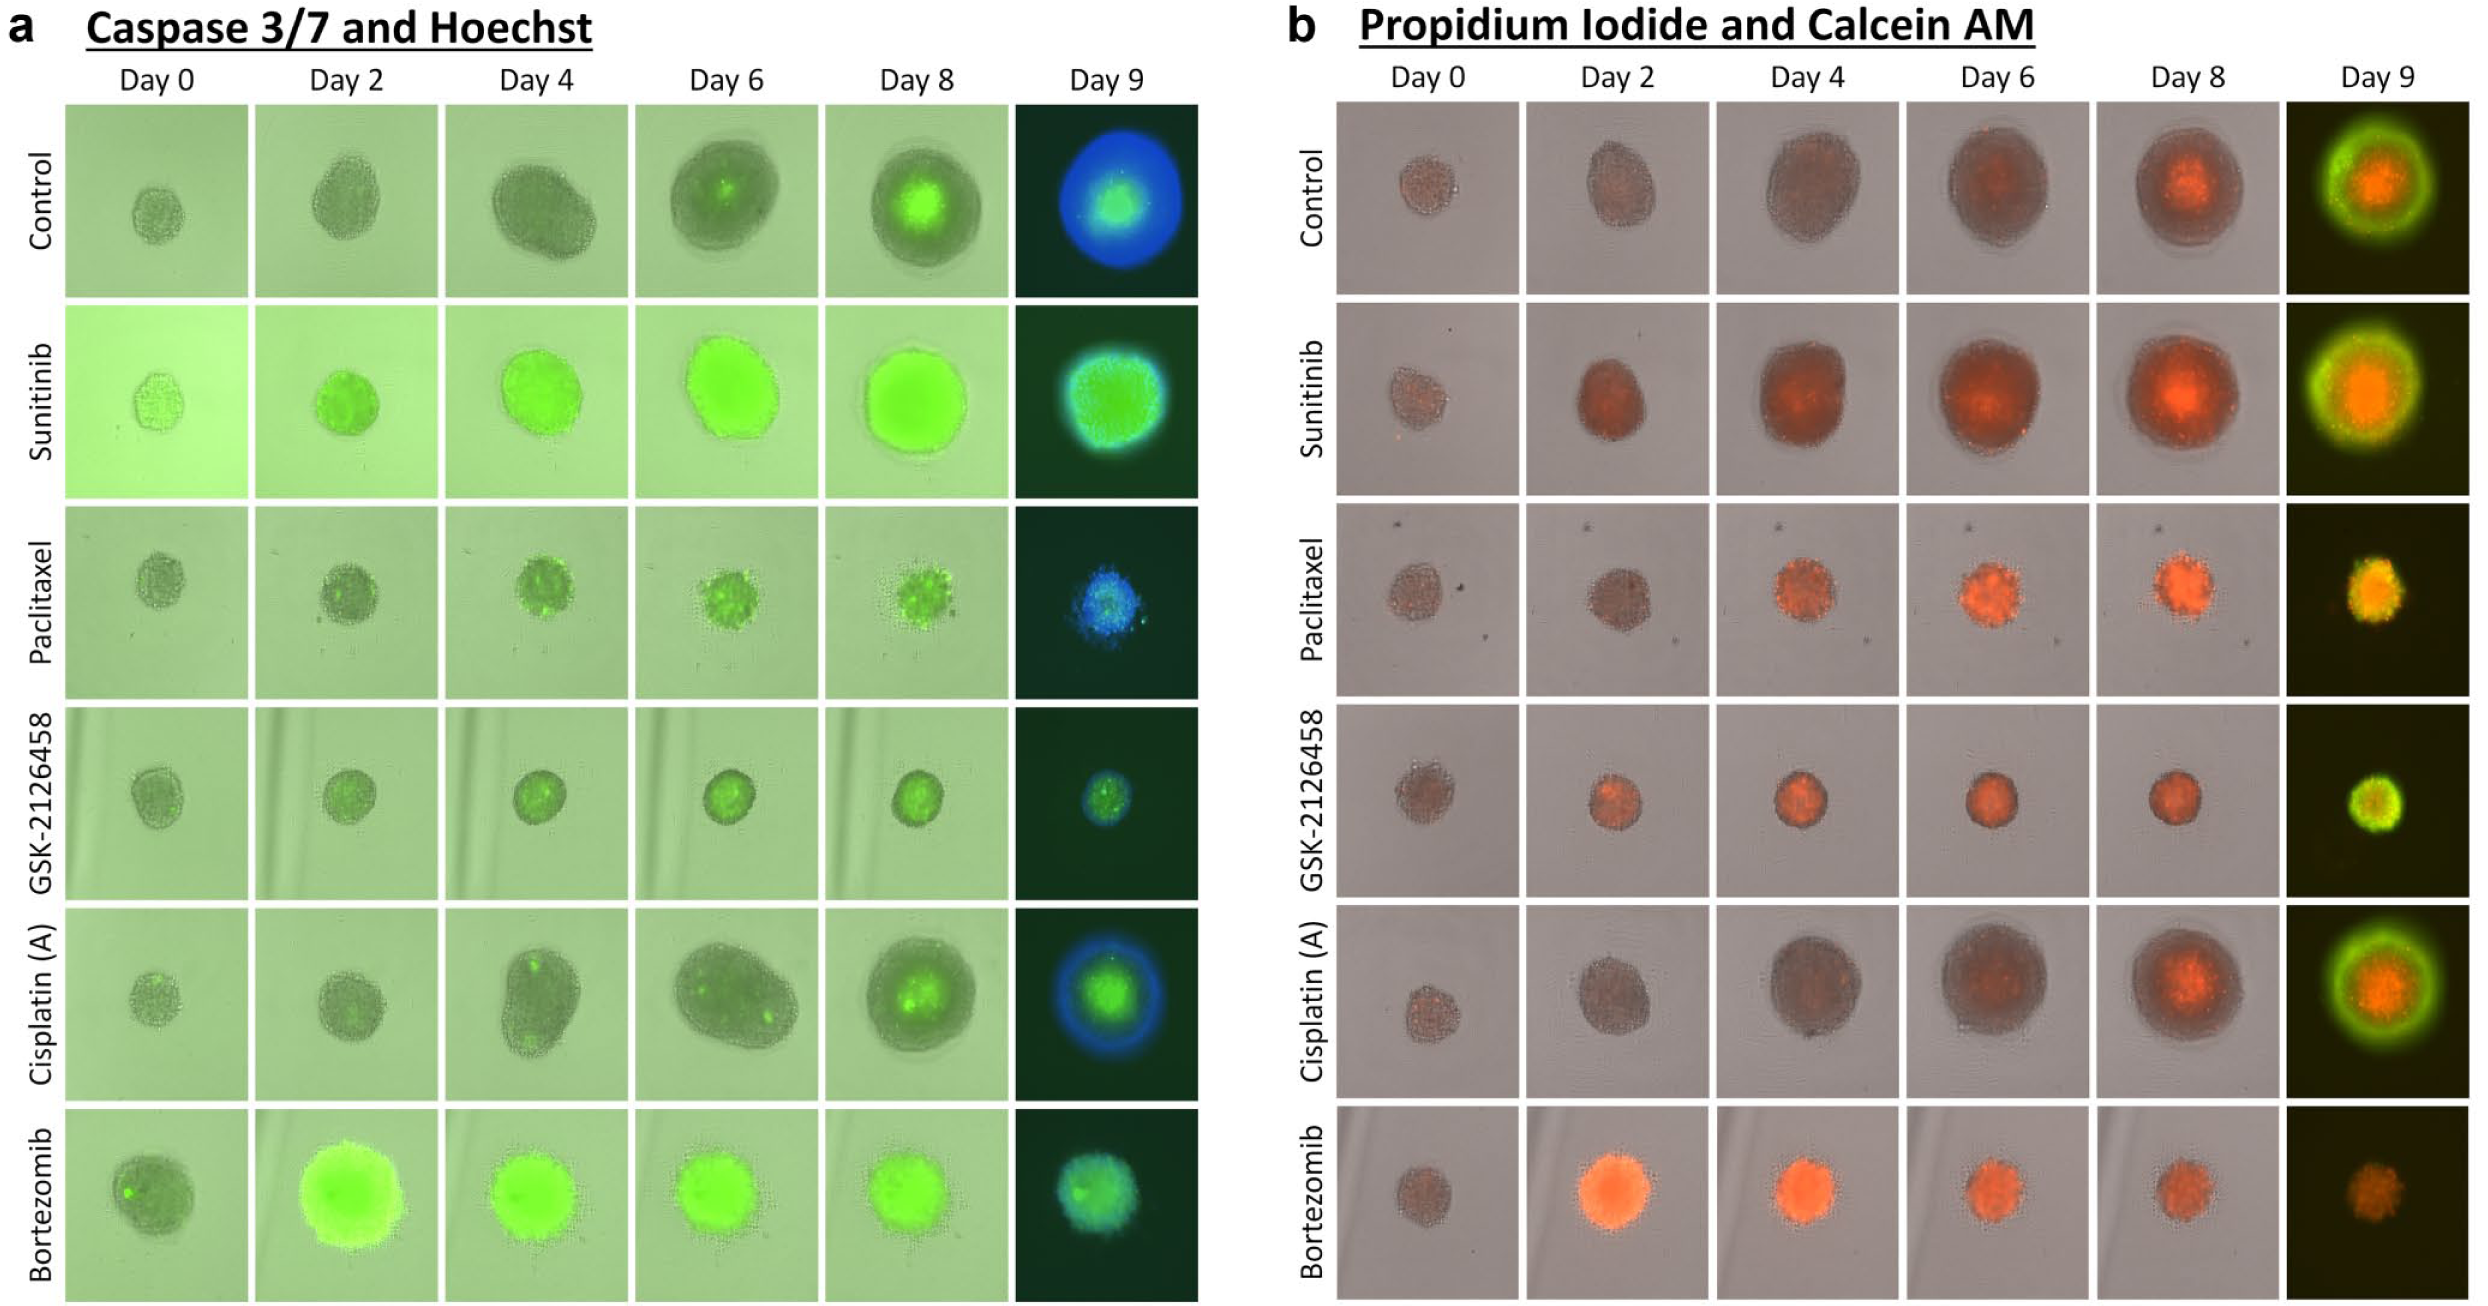
Time course bright-field and fluorescent overlay images for the five categories of kinetic effects indicated by sunitinib malate (apoptotic), paclitaxel (late cytotoxic), GSK-2126458 (cytostatic), cisplatin A (no effects), and bortezomib (early cytotoxic). (
The five categories of drug effects were early cytotoxic, late cytotoxic, apoptotic, cytostatic, and no effects. The time course results of spheroid diameters, caspase 3/7, and PI fluorescent intensities are shown in Figure 4 for drug concentration at 5 µM. Figure 4a shows that romidepsin, panobinostat, bortezomib, carfilzomib, staurosporin, and 17-AAG exhibited early cytotoxic effects, which displayed a significant increase in caspase 3/7 and PI fluorescence (up to ~200 relative units or RU) in comparison to the control (up to ~100 RU). The observed cytotoxic effects prevented spheroid growth as expected. The results also showed that the increase in caspase 3/7 fluorescent intensities occurred slightly earlier than PI, which may indicate that the cytotoxic effects were directly correlated to apoptosis-induced cell death. In addition, the dissipation of caspase 3/7 and PI fluorescent signals after the strong increase may indicate the disintegration of dead cells. Figure 4b shows the effects of sunitinib malate and paclitaxel, which were categorized as apoptotic and late cytotoxic, respectively. For sunitinib malate, the spheroid size grew normally, while the caspase 3/7 fluorescence quickly increased significantly over time (up to ~200 RU). However, as discussed previously, the fluorescence could be due to the autofluorescence of the drug compound inside the spheroid. Therefore, the apoptotic effect of sunitinib malate cannot be confirmed. The PI fluorescence remained at a similar level as the control spheroid. For paclitaxel, the spheroid size was immediately inhibited, but the PI fluorescence did not increase significantly until 4 days (~100 h) posttreatment (up to ~150 RU). Surprisingly, the caspase 3/7 fluorescence did not correlate with the increase of PI signals, which may indicate a necrosis-induced cell death. Figure 4c shows that GSK-2126458, trametinib, and BEZ-235 exhibited cytostatic effects, where the spheroid size was inhibited but remained viable, indicated by the relatively low caspase 3/7 and PI fluorescent intensities similar to the control over time (up to ~100 RU). Finally, Figure 4d shows that cisplatin A, cisplatin B, and sorafenib exhibited no cytotoxic or apoptotic effects on the U87MG MCTS, where the spheroid size and fluorescent signals were similar to the control (up to ~100 RU).
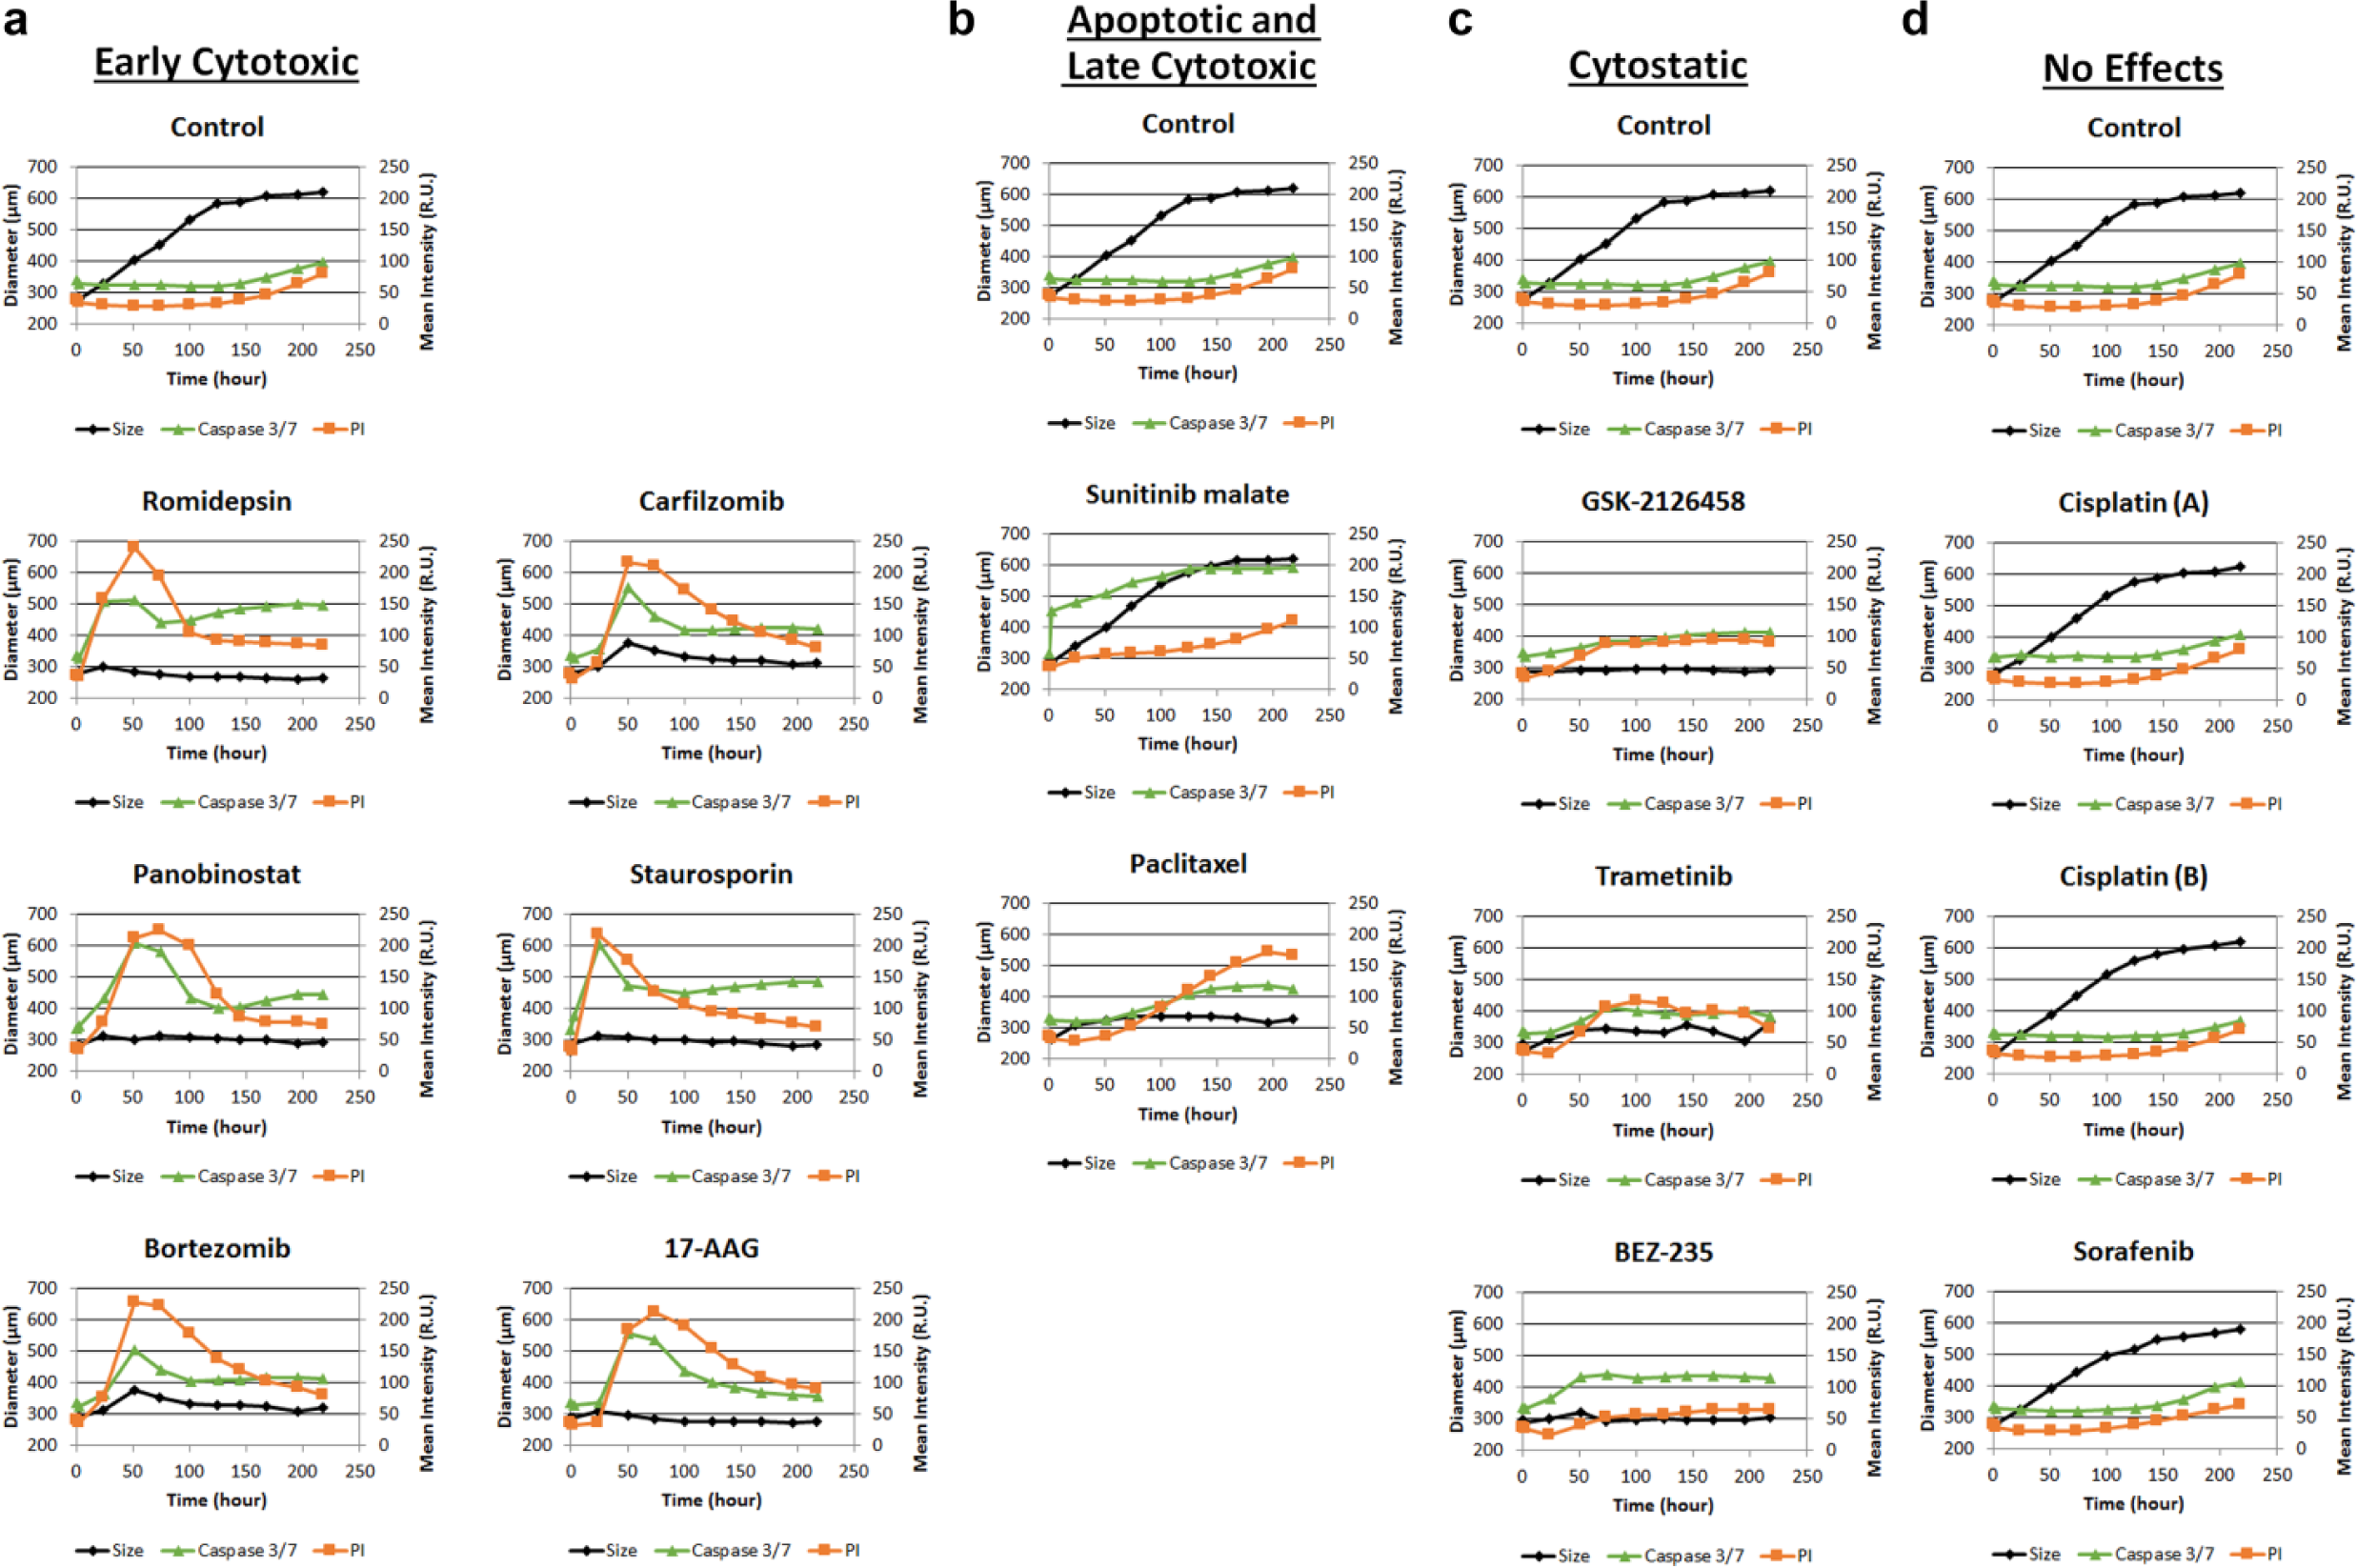
The time course tumor spheroid diameter, caspase 3/7, and propidium iodide (PI) fluorescent intensities quantified for each drug treatment at 5 µM (n = 6). The change in caspase 3/7 and PI signals can be observed for (
More important, the kinetic readout of caspase 3/7 and PI fluorescent intensities allowed the quantification of time-dependent cytotoxicity. In Figure 4a , the early cytotoxic drug compounds displays a different rate of cell death within the spheroid. To use a standard method for comparing the drug compounds, we compared the time when the PI fluorescent intensity reached a maximum value. For romidepsin, panobinostat, bortezomib, carfilzomib, staurosporin, and 17-AAG, the times to reach maximum PI intensity were 51, 74, 51, 51, 24, and 51 h, respectively. The results indicate that romidepsin, bortezomib, carfilzomib, and 17-AAG induced cytotoxicity at approximately the same rate, while panobinostat showed cytotoxicity at a later time point, and carfilzomib showed earlier cell killing. Using the time-dependent results on spheroid cytotoxicity, researchers can selectively choose a drug compound that induces early or late cytotoxicity.
The ability to monitor apoptosis (caspase 3/7) and viability (PI) of drug-treated tumor spheroids in real time allows better characterization of the apoptotic and cytotoxic effects of the drug compounds. In this work, we demonstrated the categorization of 14 different drug compounds and their kinetic apoptotic and cytotoxic effects against U87MG MCTS. By staining the tumor spheroids with caspase 3/7 and PI fluorescent stains and monitoring them in real time, we were able to observe and quantify early and late cytotoxicity effects, as well as apoptotic and cytostatic effects, which would not have been possible with only an endpoint readout. The kinetic apoptosis and viability readouts in combination with bright-field growth inhibition data produce a unique multiplex orthogonal screen that can be used to evaluate hits but also elucidate potential mechanisms of action of these candidate drugs. 5 This multiplex screening approach can be used to further improve the quality and efficiency of the screen, resulting in identifying a more qualified drug candidate for drug discovery research.
Footnotes
Acknowledgements
We thank Dr. Steven Titus at the High Content Imaging and Discovery at National Center for Advancing Translational Sciences (NCATS) for kindly donating 14 cancer drug compounds in this work.
Supplementary material is available online with this article.
Declaration of Conflicting Interests
The authors declared the following potential conflicts of interest with respect to the research, authorship, and/or publication of this article: SK, SC, SB, JQ, and LL-YC declare competing financial interests, and the work performed in this manuscript is for reporting on a novel real-time detection method of apoptosis and viability of 3D tumor spheroids using the technology of Nexcelom Bioscience, LLC. The proposed detection method can be used to better characterize the drug effects on 3D model-based high-throughput screening assays for identifying more highly qualified cancer drug candidates.
Funding
The authors received no financial support for the research, authorship, and/or publication of this article.
References
Supplementary Material
Please find the following supplemental material available below.
For Open Access articles published under a Creative Commons License, all supplemental material carries the same license as the article it is associated with.
For non-Open Access articles published, all supplemental material carries a non-exclusive license, and permission requests for re-use of supplemental material or any part of supplemental material shall be sent directly to the copyright owner as specified in the copyright notice associated with the article.