
Abstract
The nonadherent mammosphere assay has been commonly used to investigate cancer stem cell activities in breast cancers that have the ability to form tumorspheres and maintain tumor growth. The sphere formation step is critical, in that it enables the construction of the mammosphere models for downstream assays. The mammosphere assay has also been used to assess the effects of drug treatment on the tumorspheres formed from primary cancer cells or cell lines. Traditionally, the mammosphere formation has been evaluated by standard microscopy systems that required external software for additional analyses. However, this method can be time-consuming and low-throughput, thus impractical for high-throughput characterization of mammosphere models and screening for potential therapeutic cancer drugs. To overcome these challenges, we developed a plate-based high-throughput method to rapidly analyze mammospheres in whole wells using the Celigo Image Cytometer. The method is employed to characterize mammosphere formation and morphology for adherent and nonadherent propagation of four breast cancer cell lines (MCF7, MDA-MB-436, MDA-MB-231, and SKBR3). Next, the dose-dependent effects of four small molecule drugs (doxorubicin, paclitaxel, 8-quinolinol, and salinomycin) are characterized based on sphere formation and viability stained with calcein AM and propidium iodide. We observed growth and morphometric differences between adherent and nonadherent propagation of the four cell lines. Furthermore, drug treatments induced various effects on mammosphere formation, morphology, and viability. The proposed image cytometry method provides a useful tool suitable for high-throughput characterization and analysis of mammospheres, which can improve assay efficiency when investigating the formation capabilities and drug-induced cytotoxicity effects.
Introduction
The nonadherent mammosphere assay was previously developed based on modification of the neurosphere assay to assess cancer stem cell activities in the mammary glands. 1 -3 Due to the physiological relevance to the in vivo model, the in vitro nonadherent breast cancer culture model allows scientists to investigate the physical formation of the mammospheres, as well as downstream assays to characterize their genomic and proteomic expressions. 4 -6 One of the critical downstream assays is utilizing mammospheres formed by primary tumor cells or cell lines as a three-dimensional (3D) model to study the effects of cancer drug treatments, and screening for potential drug candidates. Typically, the mammospheres are formed with single-cell-suspension breast cancer cells that are cultured as a monolayer (adherent propagation) and passaged with standard media; however, other culturing or passaging conditions (nonadherent propagation) may affect the mammosphere formation efficiency (MFE). Therefore, it would be critical for researchers building breast cancer models for drug screening to understand the effects of cell culture conditions on the mammosphere formation prior to finalizing the model.
Mammospheres are commonly assessed by manual or automated standard light and fluorescence microscopy systems, requiring external software for image analysis and segmentation. 7,8 However, this method can be time-consuming, tedious, and low-throughput, and thus impractical for high-throughput screening for potential therapeutic cancer drugs. To overcome the challenges, we developed a plate-based high-throughput image cytometry method to rapidly analyze mammospheres in whole wells. Previously, the Celigo Image Cytometer has demonstrated endpoint or kinetic measurement of 3D tumor spheroid formation, viability, and apoptosis using bright-field and fluorescence image analysis in ultra-low-attachment U-bottom plates, as well as Z-prime calculation for high-throughput assays. 9 -11 Image cytometry was used to analyze and characterize single tumor spheroids formed in the U-bottom plates, where a cancer drug compound scoring method was developed for a high-throughput drug screening assay. 12
In this work, the Celigo Image Cytometer is employed to characterize mammosphere formation, morphological changes, and drug efficacy in ultra-low-attachment flat-bottom plates that allowed the formation of multiple mammospheres or clusters. We demonstrate the detection capability of the image cytometry method by analyzing the formation of mammospheres with adherent and nonadherent propagation of four breast cancer cell lines (MCF7, MDA-MB-436, MDA-MB-231, and SKBR3). The morphological changes are assessed with the image cytometer to characterize the differences between cell culture propagation methods, as well as different cell lines. Finally, the dose-dependent effects of four cancer drug compounds (doxorubicin, paclitaxel, 8-quinolinol, and salinomycin) 3,13,14 are assessed based on mammosphere formation, morphology, and viability analysis stained with calcein AM and propidium iodide (PI). These drug compounds are selected based on previous publications, 13,15 -27 which showed tumor growth inhibition and cytotoxicity effects against the four breast cancer cell lines. The results showed visual and quantifiable differences in mammosphere growth and morphology between adherent and nonadherent propagation of the four breast cancer cell lines. The cancer drug treatments induced various dose-dependent effects on mammosphere formation, morphological changes, and viability. The proposed image cytometry method provides a useful tool suitable for high-throughput characterization of mammospheres in whole wells, which can improve assay efficiency and statistical analysis compared with the conventional low-throughput microscopy method. Furthermore, the proposed detection method can be adopted for high-throughput screening for potential cancer drug candidates utilizing the presented mammosphere models.
Materials and Methods
Adherent Propagation of Breast Cancer Cell Cultures
MCF7 is a breast adenocarcinoma cell line from the mammary gland (HTB-22, ATCC, Manassas, VA). The cell line is maintained in adherent T-25 flasks (690175, Greiner Bio-One, Monroe, NC) in Eagle’s Minimum Essential Medium (30-2003, ATCC) basal media, supplemented with 10% fetal bovine serum (FBS) and 10 µg/mL bovine insulin (I1882, Sigma-Aldrich, St. Louis, MO) at 37 °C and 5% CO2. The cells are regularly passaged two times per week.
SKBR3 is a breast adenocarcinoma cell line from the mammary gland (HTB-30, ATCC). The cell line is maintained in adherent T-25 flasks in McCoy’s 5a Medium Modified (30-2007, ATCC) basal media supplemented with 10% FBS at 37 °C and 5% CO2. The cells are regularly passaged two times per week.
MDA-MB-231 is a breast adenocarcinoma cell line from the mammary gland (HTB-26, ATCC). The cell line is maintained in adherent T-25 flasks in Leibovitz’s L-15 basal media (30-2008, ATCC) supplemented with 10% FBS at 37 °C and atmospheric air. It is important to note that the L-15 medium formulation is devised for use in a free gas exchange with atmospheric air.
MDA-MB-436 is a breast adenocarcinoma cell line from the mammary gland (HTB-130, ATCC). The cell line is maintained in adherent T-25 flasks in Leibovitz’s L-15 basal media, supplemented with 10% FBS, 10 µg/mL bovine insulin, and 16 µg/mL glutathione at 37 °C and atmospheric air. It is important to note that the atmospheric air environment was media dependent as indicated by ATCC, which may not be required by the two cell lines.
Preparation of Mammosphere Growth Medium
The mammosphere growth medium was prepared with a combination of Mammary Epithelial Cell Growth Medium BulletKit (MEGM, CC-3150, Lonza, Basel, Switzerland) supplemented with 2% B27 (17504, Life Technologies, Carlsbad, CA), 20 ng/mL EGF (315-09, PeproTech, Rocky Hill, NJ), and 20 ng/mL bFGF (100-18B, PeproTech).
Nonadherent Propagation of Mammosphere Cell Cultures
The four adherent breast cancer cell cultures in the T-25 flasks were first washed with phosphate-buffered saline (PBS), dissociated with 0.25% trypsin-EDTA (25200-056, Gibco, Gaithersburg, MD), and incubated for 5–10 min at 37 °C and 5% CO2, or until cells detached from the bottom. Next, the respective cell culture media for the four cell lines were added to the flasks to break up large clumps of cells. The cell suspension was transferred to a 15 mL conical tube and centrifuged at 1200 rpm for 5 min. The supernatant was aspirated and cell pellet was resuspended in the mammosphere growth medium described previously. The cell suspensions were sieved sequentially through a 100 µm and a 40 µm cell strainer (BD Falcon, Billerica, MA) to ensure a single-cell suspension. A small aliquot of the cell suspensions were then stained with 0.2% trypan blue and counted using a hemacytometer to determine cell viability, and subsequently the viable cells were plated at 1000 cells/mL in low-attachment T-25 flasks (690195, Greiner Bio-One). 1
Preparation of Drug Compounds
Image cytometry was used to assess the cancer cytotoxicity effects of four drug compounds; doxorubicin (44583), paclitaxel (T1912), 8-quinolinol (H6778), and salinomycin (S6201) were all purchased from Sigma-Aldrich. Doxorubicin and 8-quinolinol (powder) were reconstituted in 100% DMSO to a stock concentration of 17.2 and 100 mM, respectively. The stock solution was further diluted in 100% DMSO to the initial working concentrations of 2, 1, and 0.2 mM. Finally, the initial working concentrations were diluted 100× in mammosphere growth medium to produce 20, 10, and 2 µM final working concentrations prior to adding to the cells. Paclitaxel (powder) was reconstituted in 100% DMSO to a stock concentration of 10 mM. The stock solution was further diluted in 100% DMSO to the initial working concentrations of 2, 1, and 0.5 µM. Finally, the initial working concentrations were diluted 100× in mammosphere growth medium to produce 20, 10, and 5 nM final working concentrations prior to adding to the cells. Salinomycin (liquid) has a stock concentration of 2.66 mM. The stock solution was further diluted in 100% DMSO to the initial working concentrations of 1, 0.2, and 0.02 mM. Finally, the initial working concentrations were diluted 100× in mammosphere growth medium to produce 10, 2, and 0.2 µM final working concentrations prior to adding to the cells.
Mammosphere Formation Assay
The adherent and nonadherent cell cultures were washed and trypsinized into single-cell suspensions in the mammosphere growth media and subsequently seeded in a flat-bottom, 96-well, ultra-low-attachment plate (3474, Corning Life Sciences, Corning, NY) at 1000 cells/well in triplicate. The cells were allowed to culture at 37 °C and 5% CO2, and the plate was imaged in bright field on days 2, 5, 7, 9, 12, 14, and 17 using the image cytometer. For direct comparison, the culturing conditions for the formation assay were kept consistent for both adherent and nonadherent propagation. The bright-field images were analyzed to count the number of formed mammospheres and their respective morphometric parameters. In addition, the MFE percentages were calculated at day 17 to compare each cell line and propagation method.
Mammosphere Drug Treatment Characterization Assay
The effects of the drug compounds were characterized by treating the adherent and nonadherent cell culture-formed mammospheres with doxorubicin, paclitaxel, 8-quinolinol, or salinomycin at various concentrations. The plate map of the experiment is shown in
Fluorescent Staining for Mammosphere Viability Measurement
To measure viability, we utilized a combination of Hoechst 33342, calcein AM, and PI from Nexcelom Bioscience (CSK-V0006-1, Lawrence, MA) to stain the mammospheres. Following the manufacturer’s protocol, a 5 mL staining solution of Hoechst (8 µL), calcein AM (10 µL), PI (40 µL), and PBS (4942 µL) was produced, equivalent to concentrations of 0.5 µM, 2 µg/mL, and 4 µg/mL, respectively. The drug-treated 96-well plate was collected after the bright-field imaging on day 17 in culture, and 50 µL of the staining solution was added to each well. The plate was incubated for 30 min at 37 °C in the dark, and subsequently imaged and analyzed in the bright-field, blue, green, and red channels using the image cytometer.
Celigo Image Cytometer Instrumentation
The Celigo Image Cytometer has been previously employed to measure mammospheres. 28 -30 It employed one bright-field and four fluorescent imaging channels, blue (excitation [EX] 377/50 nm, emission [EM] 470/22 nm), green (EX 483/32 nm, EM 536/40 nm), red (EX 531/40 nm, EM 629/53 nm), and far red (EX 628/40 nm, EM 688/31 nm), to perform high-throughput cell-based assays. The Celigo operation and analysis software consisted of five major steps, START, SCAN, ANALYZE, GATE, and RESULTS, where the users can enter general information, set up scan/analysis parameters, perform scan/analysis, and then view/export images and results.
For the sphere formation assessment, the software application “Embroid Body” was utilized to autofocus and acquire bright-field images at 2 µm2/pixel with exposure times set to autoexposure. Next, the software was used to directly count the number of mammospheres and measure the morphometric parameters: area and long- and short-axis diameters (
For the viability assessment, the software application “Target 1 + 2 + 3 + Mask” was utilized to acquire green (Target 1 – calcein AM), red (Target 2 – PI), blue (Target 3 – Hoechst), and bright-field (Mask) images at exposure times of 0.4, 4, and 10 ms for fluorescence, respectively, and autoexposure for the bright field. The application “Colony 1 + 2 + 3 + Mask” was used for analysis to determine the fitness of the mammospheres at the endpoint of day 17. The ANALYZE parameters for the bright-field mask channel were set to “Algorithm = Texture,” “Intensity Threshold = 30,” “Saturated Intensity = 0,” “Precision = High,” “Diameter = 8,” “Background Correction = Uncheck,” “Separate Touching Colonies = Check,” “Minimum Thickness = 15,” and “Minimum Colony Size = 100.” After counting the mammospheres, the average integrated green and red fluorescence intensities (calcein and PI) were exported into Microsoft Excel to calculate mammosphere viability with the following equation:
Results and Discussion
Mammosphere Formation and Morphometric Analysis
The breast cancer cell lines were allowed to form mammospheres for 17 days, which showed various morphology depending on adherent or nonadherent initial culturing. The time-dependent bright-field images are shown in
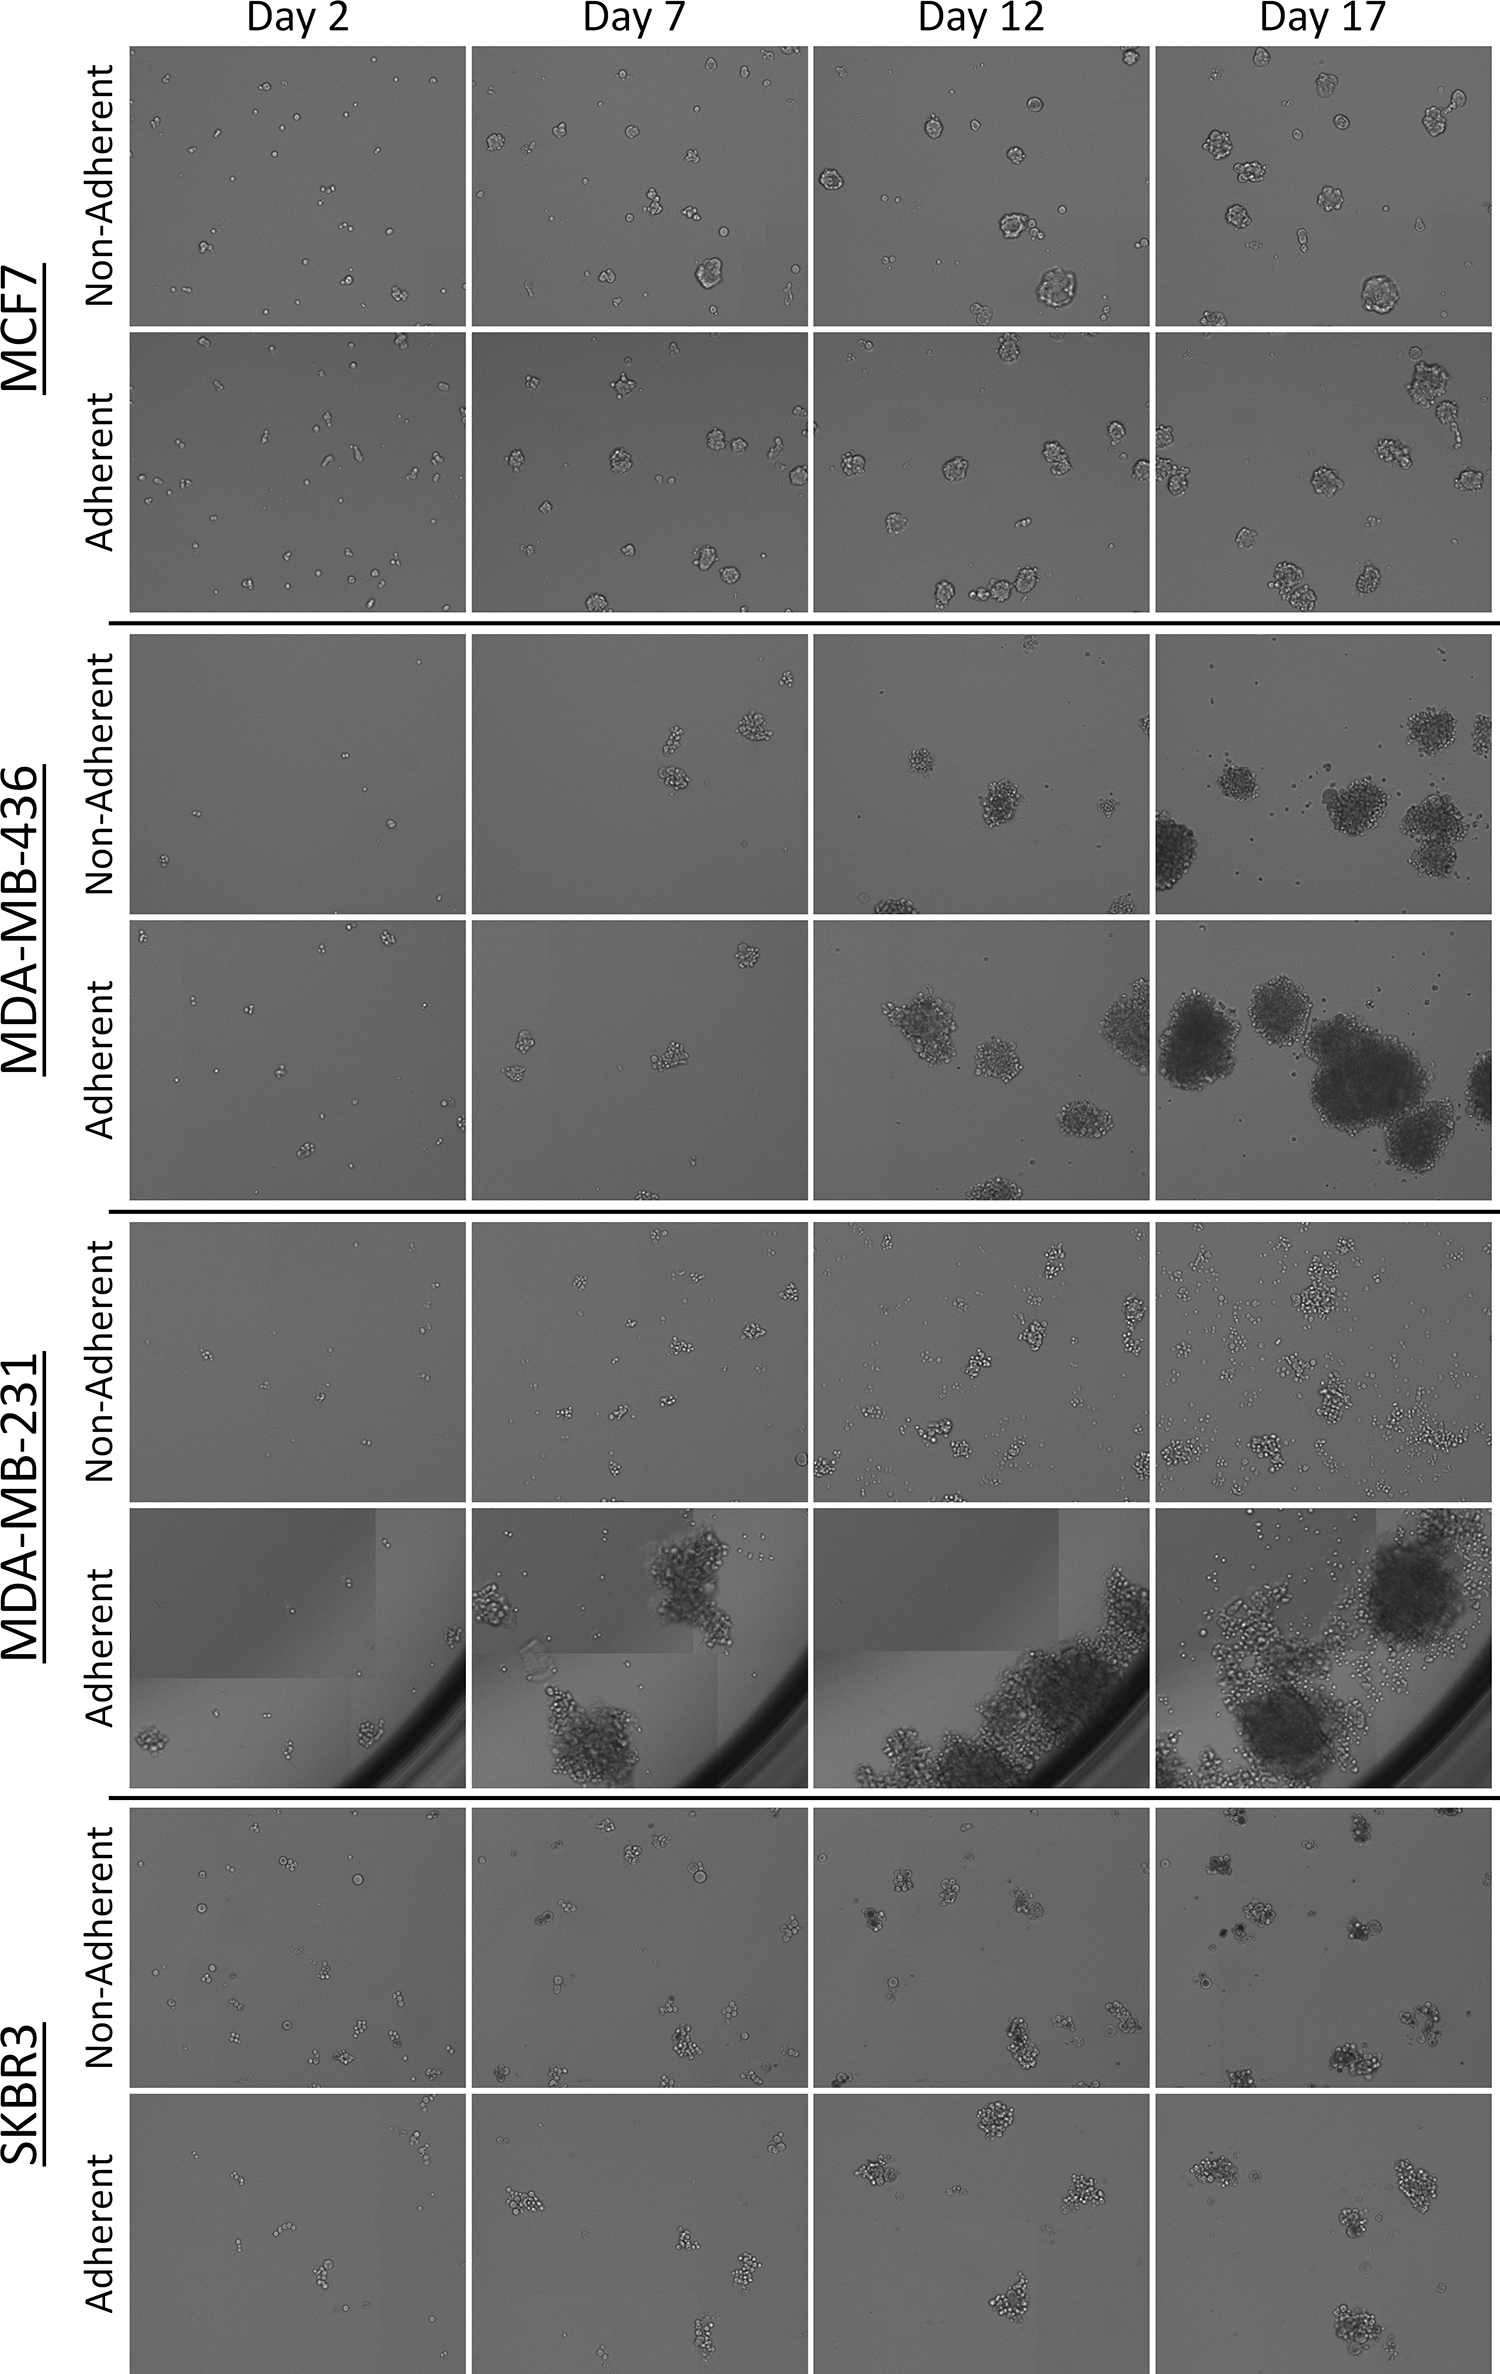
Time-dependent bright-field images of mammosphere formation from days 2 to 17 for each breast cancer cell line and their respective cell culturing method.
The mammospheres from the entire well were counted and analyzed by the image cytometry software, where the results are highly correlated to the captured bright-field images (
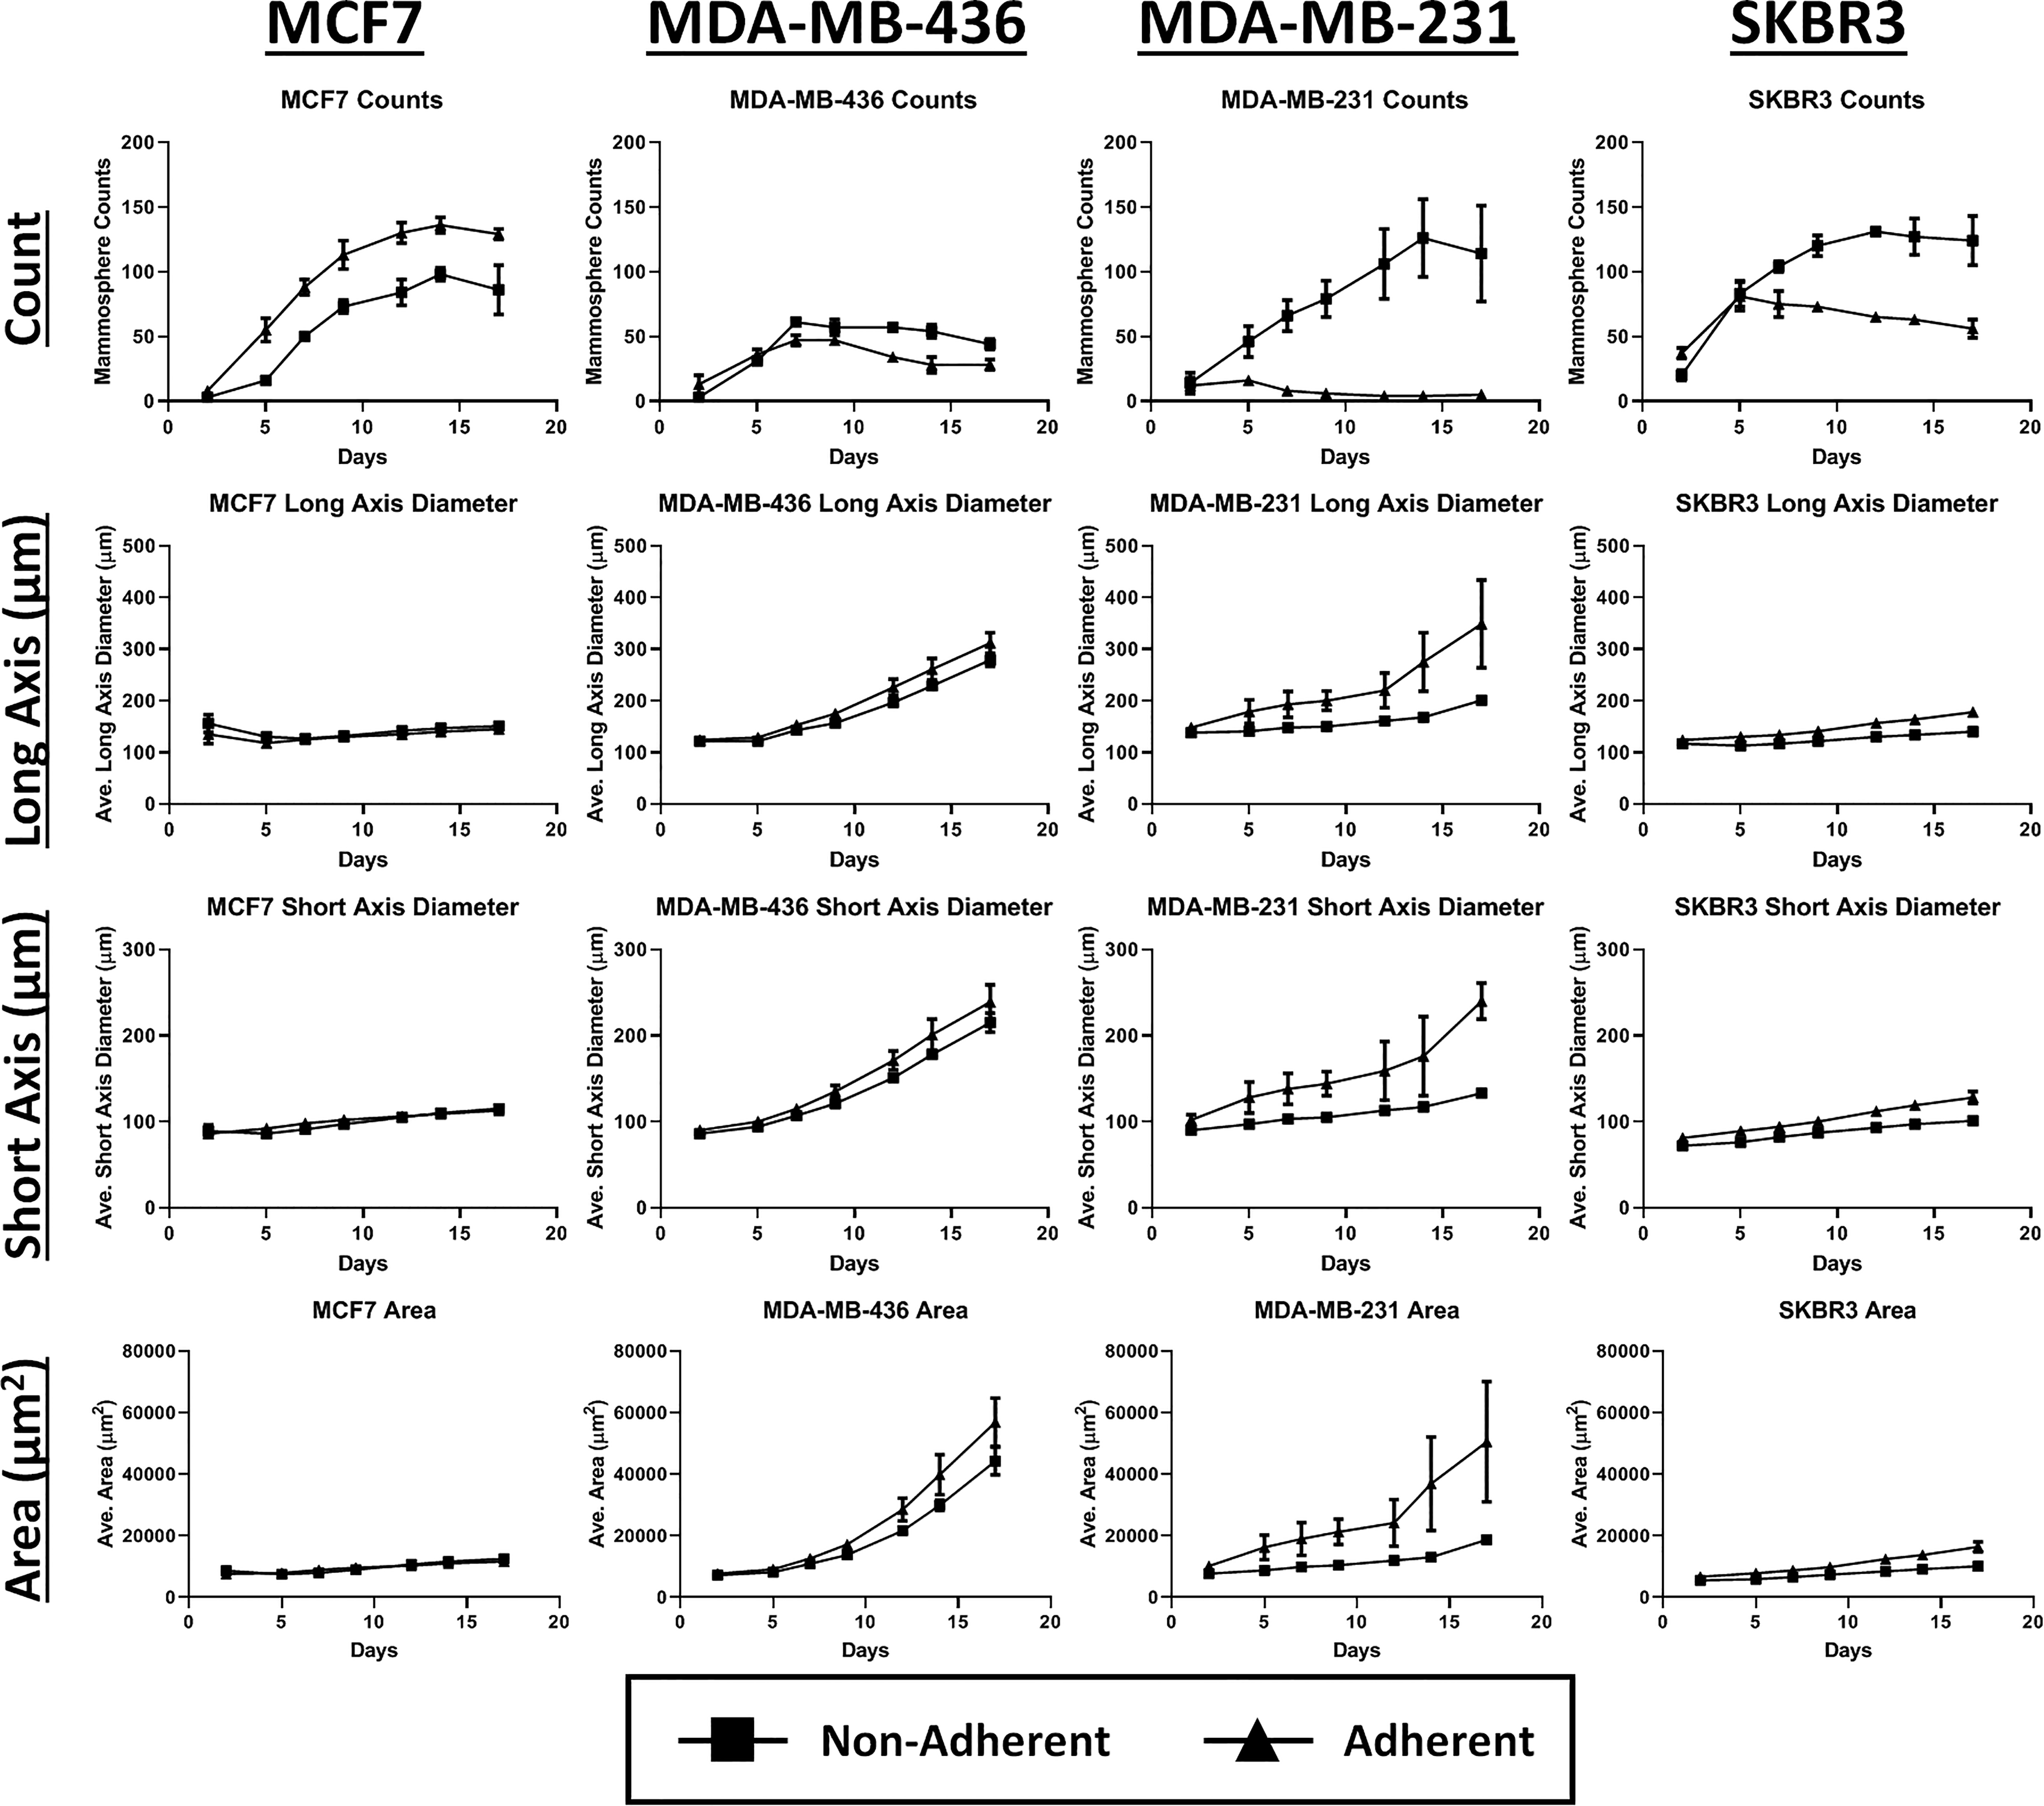
Time-dependent plots showing mammosphere counts, average long- and short-axis diameters, and average area of the mammospheres comparing each breast cancer cell line and their respective cell culturing method.
Depending on the type of initial cell culturing method, the mammosphere formation can be drastically different. In general, we observed that nonadherent cultures showed a greater number of mammospheres formed, but the size and shape were typically smaller. The differences in growth pattern between the two culturing methods could be attributed to the type of media used, which consisted of various growth factors for the nonadherent cultures. The environment may have introduced changes to cell phenotype and fitness that could have enabled better growth and viability for the nonadherent cultures. It is important to note that the formation of these tumorspheroids has different categories based on a previous publication: condensed spheroids, spheroidal shape, aggregates, and loose aggregates. 31 The categories of spheroids and observation of growth patterns enable researchers to select the passaging method for the desired mammosphere models for downstream assays.
Cancer Drug Effects on Mammosphere Formation and Morphology
To demonstrate the ability for high-throughput imaging and analysis, we treated the mammospheres with four different drug compounds: doxorubicin, paclitaxel, 8-quinolinol, and salinomycin at various titrations. Paclitaxel has been shown to promote microtubule assembly and stabilize microtubules against depolymerization.
32
Doxorubicin has been shown to be antiangiogenic and inhibit vascularization.
33
Both paclitaxel and doxorubicin have shown tumor growth inhibition and cytotoxicity for all four tested breast cancer cell types.
21
-27
8-Quinolinol is an aromatic alkaloid that has shown antibacterial, antifungal, and cytotoxic properties.
34
Salinomycin has anticancer properties and has been shown to induce apoptosis.
35
Both 8-quinolinol and salinomycin have demonstrated anticancer properties against the tested breast cancer cell types, but most importantly, they have been shown to target cancer stem cells, which inhibit the formation of mammospheres.
13,15
-20
The endpoint (day 17) bright-field images for each breast cancer cell line, initial culturing method, and drug concentrations are shown in
The endpoint mammosphere count and morphometric measurement results are shown in
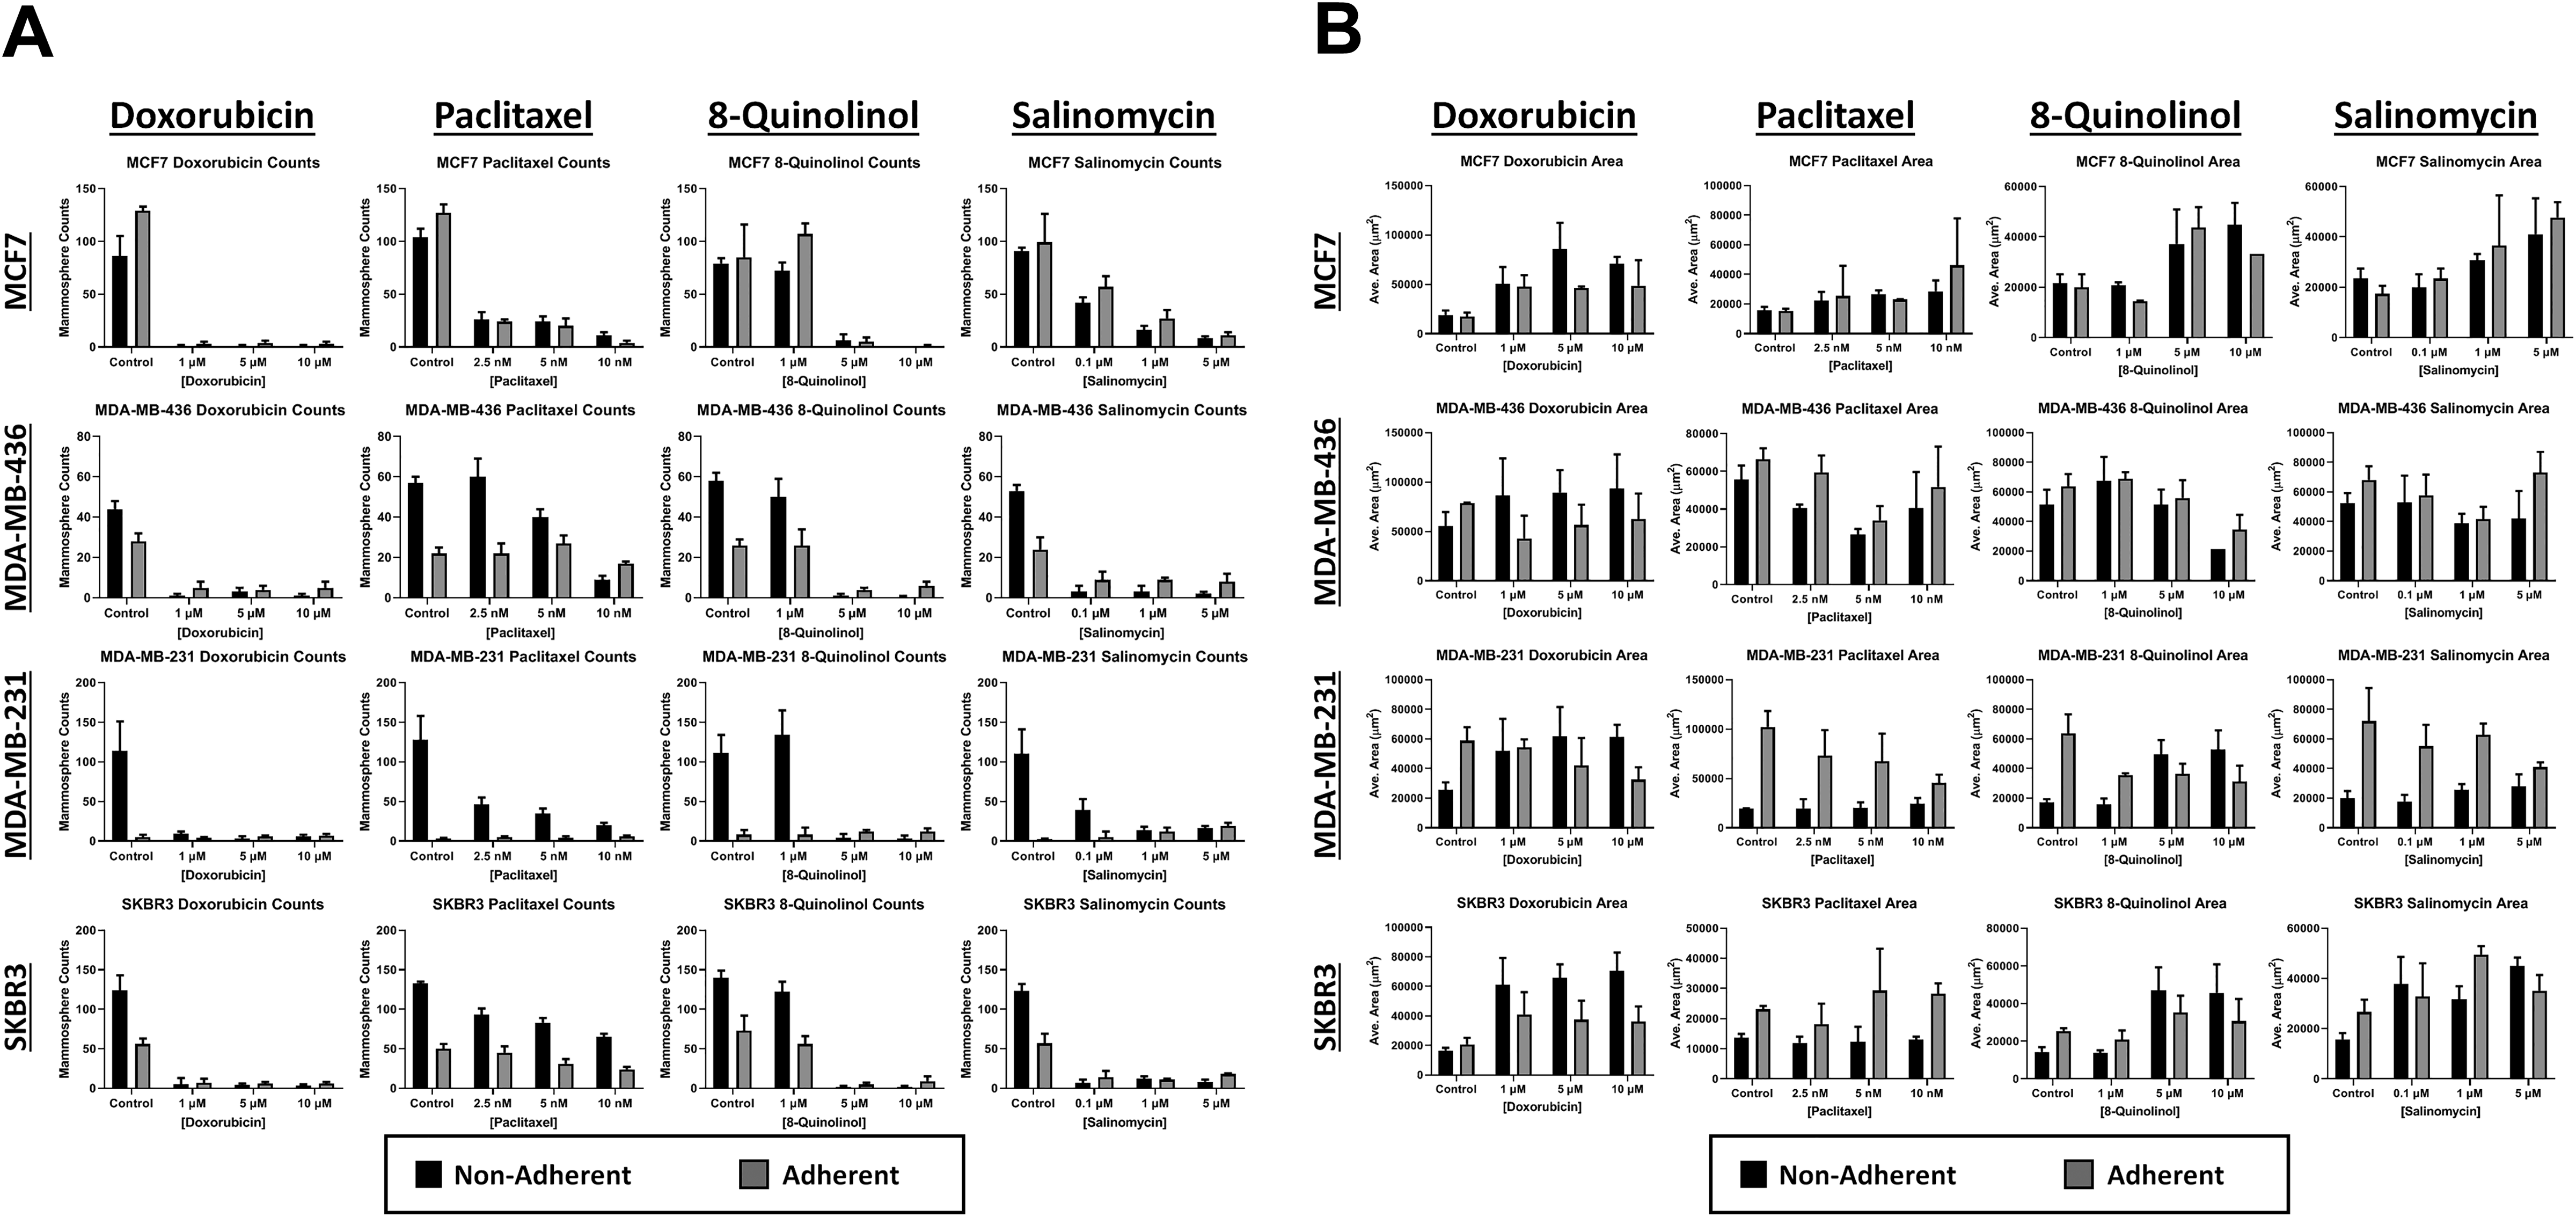
Endpoint dose–response plots on day 17 for (
The ability to characterize various mammosphere models via kinetic measurement of count and morphology allows researchers to determine the optimal model to move to downstream biological assays. One of the critical assays is to identify potential therapeutic drug candidates, thus making throughput an important parameter for any characterization method. In the drug treatment experiment, the image cytometer was able to perform high-throughput drug screening by scanning and analyzing 96 whole wells of mammospheres in bright field within approximately 5–6 min. It is important to note that because of the rapid scanning time, kinetic data can be acquired and utilized to interpret the mammosphere formation results.
Viability Analysis of Drug-Treated Mammospheres
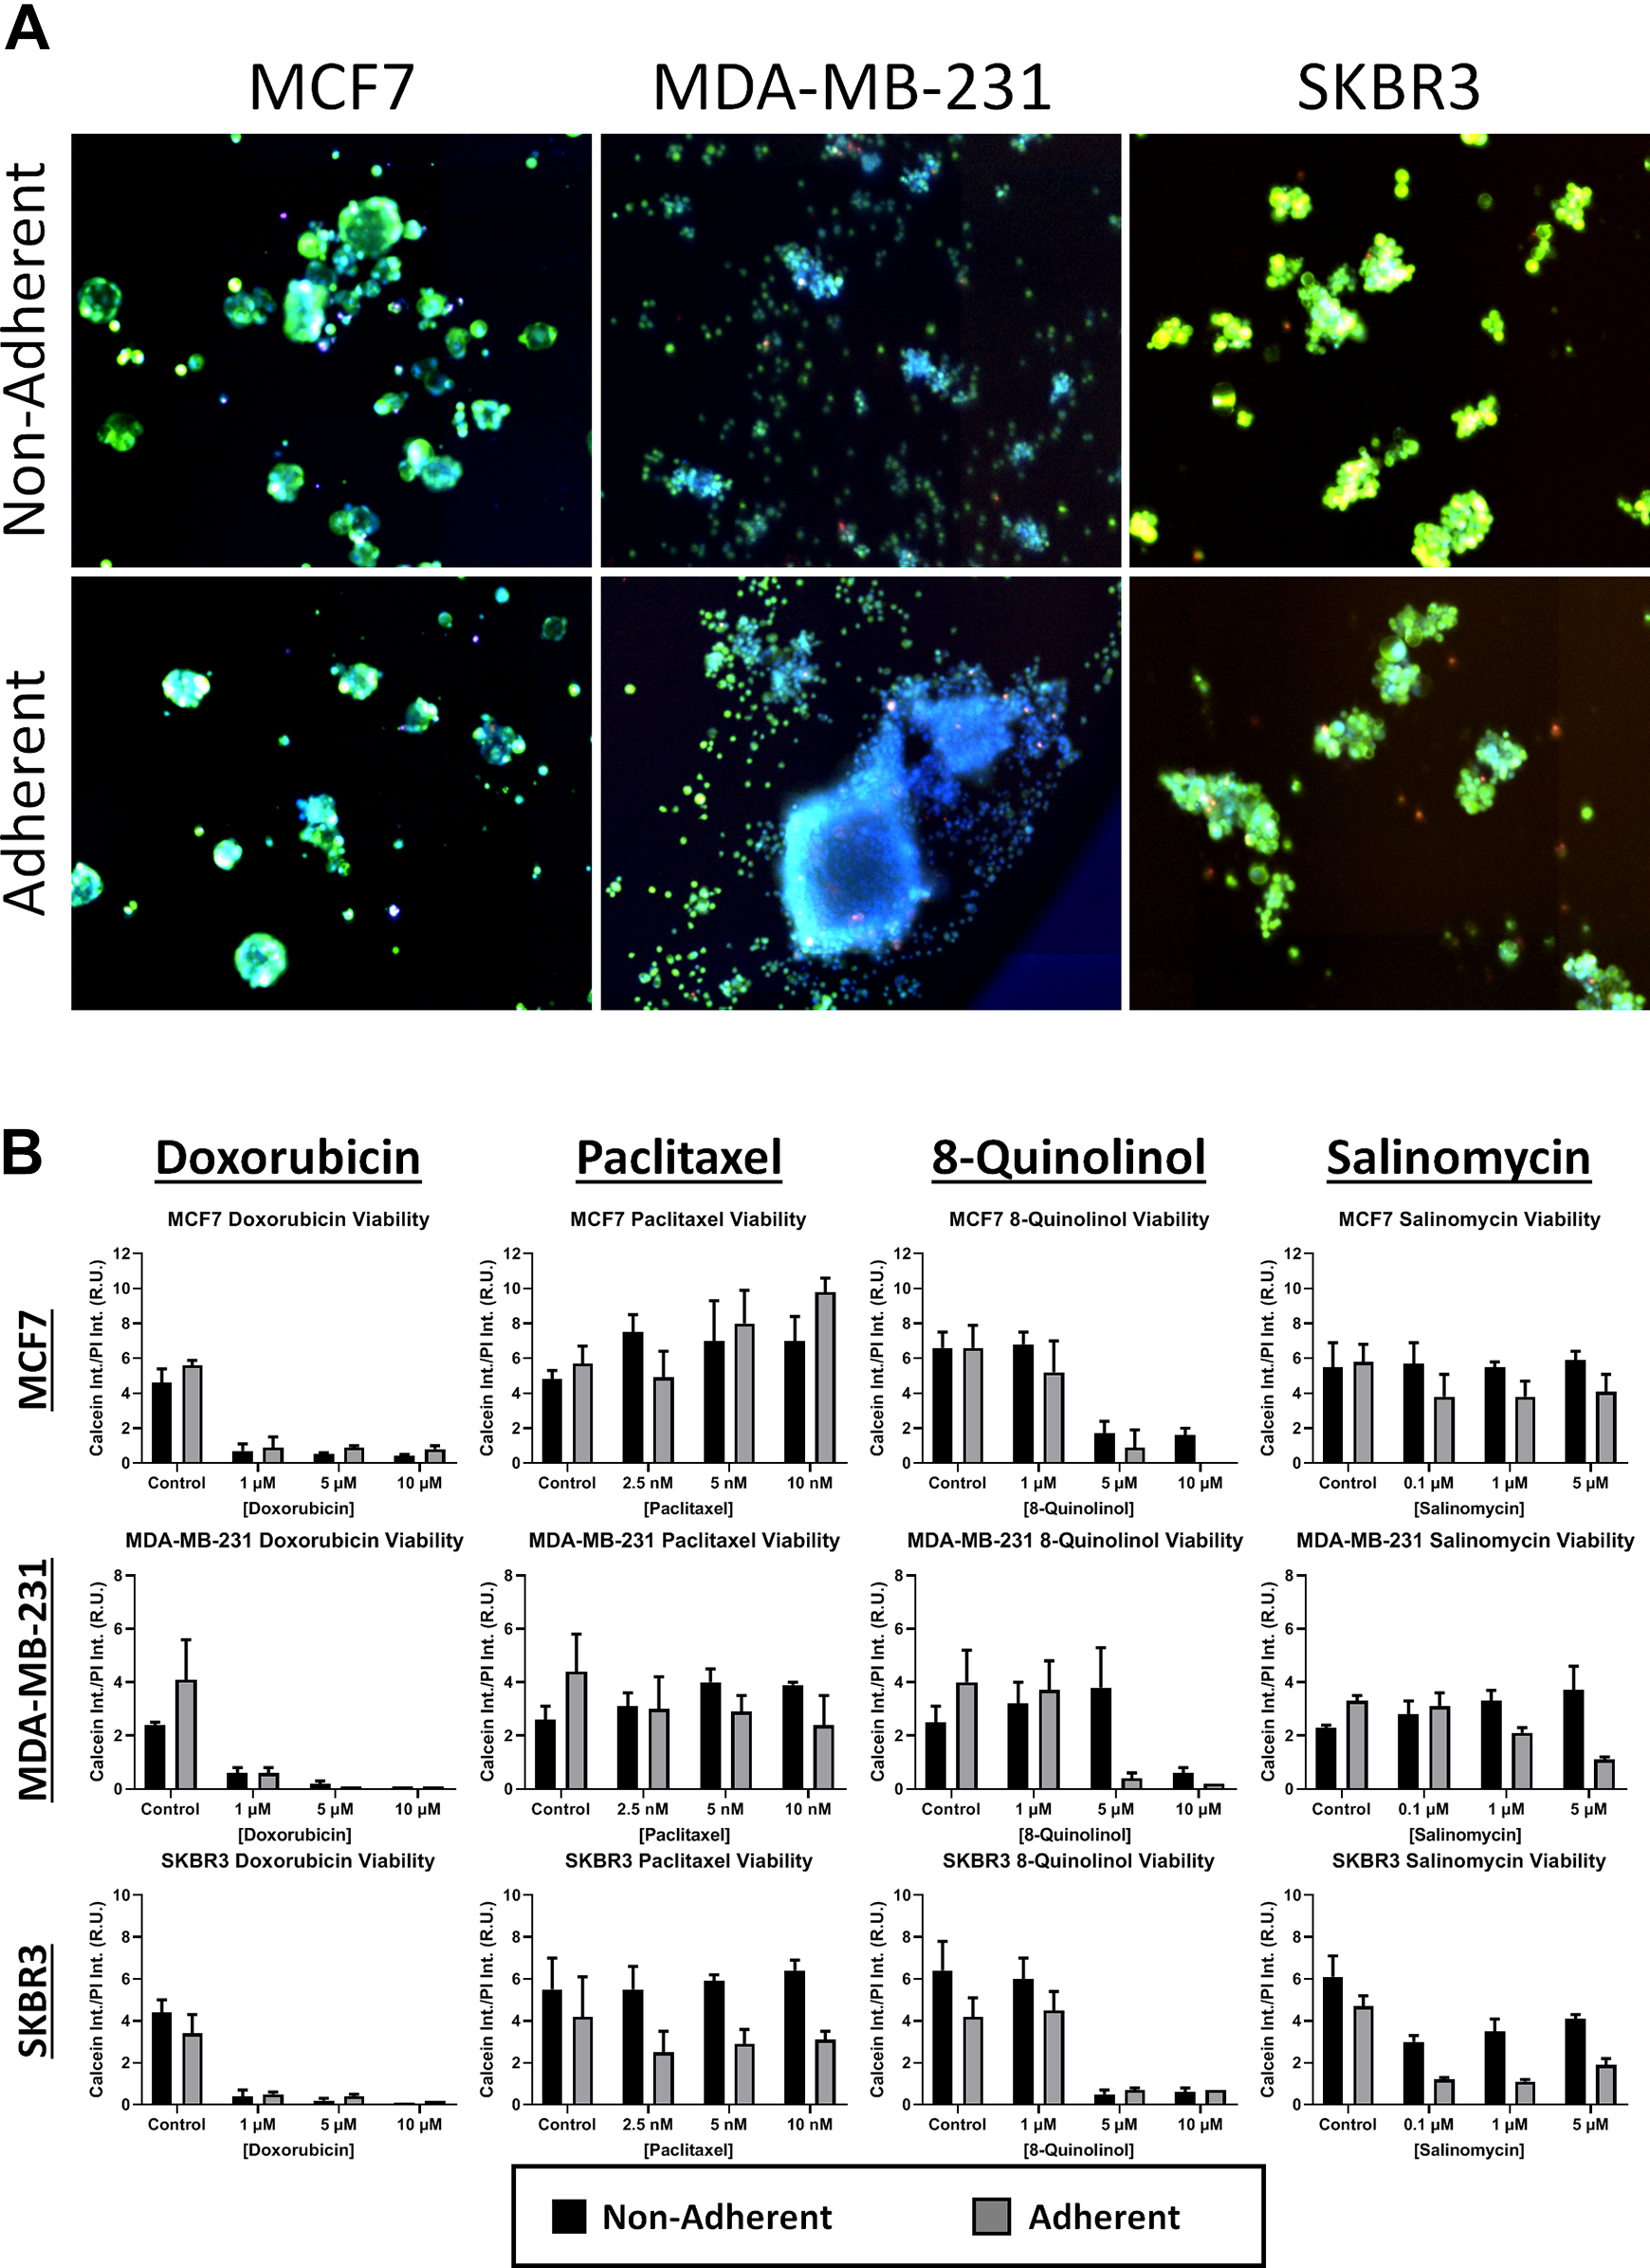
In order to determine or validate the cytotoxic effects of the drug compounds, fluorescent staining using calcein AM, PI, and Hoechst was employed to measure viability. This method was developed in a previous publication
10,12
to determine the fitness of tumor spheroids. Essentially, the ratio between calcein and PI fluorescent intensities can indicate the fitness of the mammospheres. The fluorescent overlay images for calcein (green), PI (red/orange), and Hoechst (blue) are shown in
(
The calculated calcein/PI ratios are shown in
Overall, fluorescent staining of mammospheres with calcein, PI, and Hoechst can provide a simple method to determine their viability. By calculating the ratios of calcein and PI fluorescence, one can perform high-throughput screening of the cytotoxic efficacy of potential drug candidates. Plate-based image cytometry is a helpful tool suitable for high-throughput characterization and analysis of various mammosphere models. The rapid whole-well scanning in bright field and fluorescence allow kinetic and multiplex assays to be performed, which can increase the amount of data output from each experiment, thus improving assay efficiency when investigating formation capabilities and drug treatment effects. Furthermore, fluorescent assays can characterize drug-treated mammospheres by investigating viability, apoptosis, necrosis, and hypoxia. 10,12,36
Supplemental Material
Supplemental Material, Kessel_and_Chan_Supplemental_Figures - A High-Throughput Image Cytometry Method for the Formation, Morphometric, and Viability Analysis of Drug-Treated Mammospheres
Supplemental Material, Kessel_and_Chan_Supplemental_Figures for A High-Throughput Image Cytometry Method for the Formation, Morphometric, and Viability Analysis of Drug-Treated Mammospheres by Sarah L. Kessel and Leo Li-Ying Chan in SLAS Discovery
Supplemental Material
Supplemental Material, Supplementary_Figure_1 - A High-Throughput Image Cytometry Method for the Formation, Morphometric, and Viability Analysis of Drug-Treated Mammospheres
Supplemental Material, Supplementary_Figure_1 for A High-Throughput Image Cytometry Method for the Formation, Morphometric, and Viability Analysis of Drug-Treated Mammospheres by Sarah L. Kessel and Leo Li-Ying Chan in SLAS Discovery
Supplemental Material
Supplemental Material, Supplementary_Figure_10 - A High-Throughput Image Cytometry Method for the Formation, Morphometric, and Viability Analysis of Drug-Treated Mammospheres
Supplemental Material, Supplementary_Figure_10 for A High-Throughput Image Cytometry Method for the Formation, Morphometric, and Viability Analysis of Drug-Treated Mammospheres by Sarah L. Kessel and Leo Li-Ying Chan in SLAS Discovery
Supplemental Material
Supplemental Material, Supplementary_Figure_11 - A High-Throughput Image Cytometry Method for the Formation, Morphometric, and Viability Analysis of Drug-Treated Mammospheres
Supplemental Material, Supplementary_Figure_11 for A High-Throughput Image Cytometry Method for the Formation, Morphometric, and Viability Analysis of Drug-Treated Mammospheres by Sarah L. Kessel and Leo Li-Ying Chan in SLAS Discovery
Supplemental Material
Supplemental Material, Supplementary_Figure_12 - A High-Throughput Image Cytometry Method for the Formation, Morphometric, and Viability Analysis of Drug-Treated Mammospheres
Supplemental Material, Supplementary_Figure_12 for A High-Throughput Image Cytometry Method for the Formation, Morphometric, and Viability Analysis of Drug-Treated Mammospheres by Sarah L. Kessel and Leo Li-Ying Chan in SLAS Discovery
Supplemental Material
Supplemental Material, Supplementary_Figure_13 - A High-Throughput Image Cytometry Method for the Formation, Morphometric, and Viability Analysis of Drug-Treated Mammospheres
Supplemental Material, Supplementary_Figure_13 for A High-Throughput Image Cytometry Method for the Formation, Morphometric, and Viability Analysis of Drug-Treated Mammospheres by Sarah L. Kessel and Leo Li-Ying Chan in SLAS Discovery
Supplemental Material
Supplemental Material, Supplementary_Figure_14 - A High-Throughput Image Cytometry Method for the Formation, Morphometric, and Viability Analysis of Drug-Treated Mammospheres
Supplemental Material, Supplementary_Figure_14 for A High-Throughput Image Cytometry Method for the Formation, Morphometric, and Viability Analysis of Drug-Treated Mammospheres by Sarah L. Kessel and Leo Li-Ying Chan in SLAS Discovery
Supplemental Material
Supplemental Material, Supplementary_Figure_2 - A High-Throughput Image Cytometry Method for the Formation, Morphometric, and Viability Analysis of Drug-Treated Mammospheres
Supplemental Material, Supplementary_Figure_2 for A High-Throughput Image Cytometry Method for the Formation, Morphometric, and Viability Analysis of Drug-Treated Mammospheres by Sarah L. Kessel and Leo Li-Ying Chan in SLAS Discovery
Supplemental Material
Supplemental Material, Supplementary_Figure_3 - A High-Throughput Image Cytometry Method for the Formation, Morphometric, and Viability Analysis of Drug-Treated Mammospheres
Supplemental Material, Supplementary_Figure_3 for A High-Throughput Image Cytometry Method for the Formation, Morphometric, and Viability Analysis of Drug-Treated Mammospheres by Sarah L. Kessel and Leo Li-Ying Chan in SLAS Discovery
Supplemental Material
Supplemental Material, Supplementary_Figure_4 - A High-Throughput Image Cytometry Method for the Formation, Morphometric, and Viability Analysis of Drug-Treated Mammospheres
Supplemental Material, Supplementary_Figure_4 for A High-Throughput Image Cytometry Method for the Formation, Morphometric, and Viability Analysis of Drug-Treated Mammospheres by Sarah L. Kessel and Leo Li-Ying Chan in SLAS Discovery
Supplemental Material
Supplemental Material, Supplementary_Figure_5 - A High-Throughput Image Cytometry Method for the Formation, Morphometric, and Viability Analysis of Drug-Treated Mammospheres
Supplemental Material, Supplementary_Figure_5 for A High-Throughput Image Cytometry Method for the Formation, Morphometric, and Viability Analysis of Drug-Treated Mammospheres by Sarah L. Kessel and Leo Li-Ying Chan in SLAS Discovery
Supplemental Material
Supplemental Material, Supplementary_Figure_6 - A High-Throughput Image Cytometry Method for the Formation, Morphometric, and Viability Analysis of Drug-Treated Mammospheres
Supplemental Material, Supplementary_Figure_6 for A High-Throughput Image Cytometry Method for the Formation, Morphometric, and Viability Analysis of Drug-Treated Mammospheres by Sarah L. Kessel and Leo Li-Ying Chan in SLAS Discovery
Supplemental Material
Supplemental Material, Supplementary_Figure_7 - A High-Throughput Image Cytometry Method for the Formation, Morphometric, and Viability Analysis of Drug-Treated Mammospheres
Supplemental Material, Supplementary_Figure_7 for A High-Throughput Image Cytometry Method for the Formation, Morphometric, and Viability Analysis of Drug-Treated Mammospheres by Sarah L. Kessel and Leo Li-Ying Chan in SLAS Discovery
Supplemental Material
Supplemental Material, Supplementary_Figure_8 - A High-Throughput Image Cytometry Method for the Formation, Morphometric, and Viability Analysis of Drug-Treated Mammospheres
Supplemental Material, Supplementary_Figure_8 for A High-Throughput Image Cytometry Method for the Formation, Morphometric, and Viability Analysis of Drug-Treated Mammospheres by Sarah L. Kessel and Leo Li-Ying Chan in SLAS Discovery
Supplemental Material
Supplemental Material, Supplementary_Figure_9 - A High-Throughput Image Cytometry Method for the Formation, Morphometric, and Viability Analysis of Drug-Treated Mammospheres
Supplemental Material, Supplementary_Figure_9 for A High-Throughput Image Cytometry Method for the Formation, Morphometric, and Viability Analysis of Drug-Treated Mammospheres by Sarah L. Kessel and Leo Li-Ying Chan in SLAS Discovery
Footnotes
Declaration of Conflicting Interests
The authors declared the following potential conflicts of interest with respect to the research, authorship, and/or publication of this article: S.L.K. and L.L.C. declare competing financial interests. The research in this manuscript is for reporting on a high-throughput mammosphere analysis method using an instrument of Nexcelom Bioscience, LLC.
Funding
The authors received no financial support for the research, authorship, and/or publication of this article.
Supplemental material is available online with this article.
References
Supplementary Material
Please find the following supplemental material available below.
For Open Access articles published under a Creative Commons License, all supplemental material carries the same license as the article it is associated with.
For non-Open Access articles published, all supplemental material carries a non-exclusive license, and permission requests for re-use of supplemental material or any part of supplemental material shall be sent directly to the copyright owner as specified in the copyright notice associated with the article.