
Abstract
Oncologists have investigated the effect of protein or chemical-based compounds on cancer cells to identify potential drug candidates. Traditionally, the growth inhibitory and cytotoxic effects of the drugs are first measured in 2D in vitro models, and then further tested in 3D xenograft in vivo models. Although the drug candidates can demonstrate promising inhibitory or cytotoxicity results in a 2D environment, similar effects may not be observed under a 3D environment. In this work, we developed an image-based high-throughput screening method for 3D tumor spheroids using the Celigo image cytometer. First, optimal seeding density for tumor spheroid formation was determined by investigating the cell seeding density of U87MG, a human glioblastoma cell line. Next, the dose–response effects of 17-AAG with respect to spheroid size and viability were measured to determine the IC50 value. Finally, the developed high-throughput method was used to measure the dose response of four drugs (17-AAG, paclitaxel, TMZ, and doxorubicin) with respect to the spheroid size and viability. Each experiment was performed simultaneously in the 2D model for comparison. This detection method allowed for a more efficient process to identify highly qualified drug candidates, which may reduce the overall time required to bring a drug to clinical trial.
Keywords
Introduction
Cancer is a disease caused by uncontrolled proliferation or division of abnormal cells in an organism. For numerous decades, oncology researchers have investigated the effect of drug compounds on cancer cells to identify potential candidates that can inhibit cancer cell proliferation or induce cytotoxicity.1–3 In the traditional drug screening process, cancer cell proliferation is first measured using a two-dimensional (2D) in vitro model by culturing and treating the cells in standard microplates to study the inhibition and cytotoxicity effect of the drug compounds. After identifying and further testing of potential cancer drug candidates in the 2D environment, the investigation is often transferred to studying the drug effect in an animal in vivo model by measuring the change in three-dimensional (3D) tumor sizes in animals.4,5 Although the drug candidates can demonstrate promising inhibitory or cytotoxic results in a 2D environment, similar effects may not be observed under a 3D environment, where it closely mimics situations in a human body. Therefore, up to the current state, cancer drug discovery research has demonstrated poor translation from in vitro to in vivo studies.6,7
Currently, the majority of cancer drug studies are still involved in measuring cell proliferation, growth, viability, and apoptosis in a 2D culture format. However, previous publications have demonstrated that growing cancer cells in the form of 3D tumor spheroids can be more predictive of the in vivo study outcomes compared to the 2D cell culture method.6,7 Therefore, the ability to also investigate the effect of cancer drugs on 3D tumor spheroids may improve the successful translation rate to in vivo animal study. This allows for the reduction of time and the financial burden of animal testing, and the reduction of the number of animals required, which can also improve the ethical aspect.
Typically, tumor spheroids can be formed using various methods, such as ultra-low-attachment (ULA) round-bottom microplates, 6 hanging drop, 8 and semisolid media. 9 Tumor spheroid growth is visually examined under standard microscopy, which can be time-consuming, laborious, and low throughput and lack reproducibility. More recently, automated plate-based image cytometers have also been utilized to study tumor spheroids in microplates, which are high throughput, reduce time, and generate reproducible quantitative results. However, due to instrumentation designs, many of the automated image cytometers may still require a long plate scanning time, as well as nonuniform image quality across a single microplate well. In recent years, a rapid plate-based image cytometry system, Celigo, has been developed for high-throughput cell-based assays.4,6,7 The optics of the Celigo system used a customized F-Theta lens design and large uniform bright-field illumination to rapidly capture and analyze multiple images across the plate with minimal stage movement, generating uniform whole well bright-field and fluorescent images.
In this work, we developed an image-based high-throughput screening method for 3D tumor spheroids in 384-well ULA round-bottom microplates (Sumitomo Bakelite Co., Tokyo, Japan, PrimeSurface, MS-9384U) using the Celigo image cytometer. In order to validate this screening method, five experiments were conducted, demonstrating robustness for both 3D and 2D models. First, optimal seeding density for tumor spheroid formation was determined by investigating the U87MG (human glioblastoma) cell seeding number with respect to the spheroid size. Second, the drug dose–response effect of 17-AAG with respect to spheroid size was measured to determine the IC50 value. Third, the effect of 17-AAG on the viability of tumor spheroid was investigated in a time-course study. Next, the developed high-throughput method was used to obtain dose–response measurements of four drugs (17-AAG,6,10 paclitaxel,11,12 temozolomide [TMZ],13,14 and doxorubicin15,16) with respect to the spheroid size. Finally, the effects of the four drugs on tumor spheroid viability were measured. Each experiment was performed simultaneously in the 2D model with 384-well flat-bottom tissue culture (TC)-treated microplates (Corning 3712). In the 2D adherent cell model, confluence percentage and direct cell count–based viability results were generated and reported in parallel to the 3D model.
The proposed screening methods for 2D and 3D cancer models allowed for a more efficient process to identify highly qualified drug candidates, which could reduce the overall time required for the cancer drug discovery project.
Materials and Methods
U87MG Cell Culture
U87MG cells (human glioblastoma adherent cell line, ATCC HTB-14) were cultured in Eagle’s Minimal Essential Medium (EMEM) (Earle’s Balanced Salt Solution [EBSS]) basal media with 10% fetal bovine serum (FBS), 2 mM glutamine, 1% nonessential amino acids, and 1 mM sodium pyruvate (Gibco, Carlsbad, CA) in TC-treated flasks at 37 °C and 5% CO2. The cultures were passed when confluency reached ~80%–90%. For the 2D assay plates, U87MG cells were seeded in 384-well flat-bottom TC-treated microplates (Corning 3712) at 37 °C and 5% CO2. For the 3D assay plates, the U87MG cells were seeded in EMEM (EBSS) basal media, 2 mM glutamine, 1% nonessential amino acids, 1 mM sodium pyruvate, 1× B27 (Life Technologies, Carlsbad, CA), 20 ng/mL endothelial growth factor (EGF), and 20 ng/mL basic fibroblast growth factor (bFGF) (R&D Systems, Minneapolis, MN), in 384-well ULA round-bottom microplates (Sumitomo Bakelite Co., PrimeSurface, MS-9384U). The 3D assay plates were centrifuged at 671g for 10 min to cluster cells in the bottom of the wells, and then incubated for 4 days at 37 °C and 5% CO2 to allow the spheroid to form. Similarly, the 2D assay plates were also incubated for the same duration.
Drug Compound Preparation
Four drug compounds were tested on U87MG cells, which were 17-AAG, paclitaxel, TMZ, and doxorubicin. The four drug compounds were purchased from Sigma-Aldrich (St. Louis, MO). Each drug was resuspended in 100% DMSO and then diluted to different concentrations in media. The 17-AAG was diluted to 8, 4, 2, 1, 0.5, 0.25, 0.13, 0.063, 0.031, and 0.016 µM. The paclitaxel was diluted to 500, 167, 56, 19, 6, 2.058, 0.686, 0.229, and 0.076 nM. The TMZ was diluted to 200, 80, 32, 12.80, 5.12, 2.05, 0.82, 0.328, and 0.131 µM. The doxorubicin was diluted to 50, 10, 2, 0.4, 0.08, 0.016, 0.003, 0.0006, and 0.0001 µM. The drug titrations were added to the wells in 2D and 3D plates on day 4 (post cell seeding) after spheroids had formed in the round-bottom plates.
Fluorescent Staining Protocol
Three fluorescent stains were used to stain the U87MG cells to determine cell health and viability: calcein AM (1 mM), propidium iodide (PI, 1 mg/mL), and Hoechst 33342 (10 mg/mL) (Life Technologies, Carlsbad, CA). A 2× staining solution in media was prepared by mixing calcein AM, PI, and Hoechst 33342 to working concentrations of 2 µM, 8 µg/mL, and 20 µg/mL, respectively. The U87MG cells and spheroids were stained by removing 40 µL of media and replaced with 40 µL of the 2× staining solution, for final well concentrations of 1 µM, 4 µg/mL, and 10 µg/mL, respectively. The plates were then incubated at 37 °C and 5% CO2 for 30 and 60 min for 2D and 3D assay, respectively, prior to Celigo image cytometric analysis. Since calcein AM, PI, and Hoechst have a low fluorescent background, the plates did not need to be washed prior to image acquisition.
Celigo Image Cytometer Instrumentation and Software
The Celigo image cytometer has been used in various cell-based assays in previous publications, which utilized a transmission and epifluorescence optical setup for one bright-field and three fluorescent imaging channels (blue, green, and red) to perform plate-based image cytometric analysis. Both bright-field and fluorescent imaging channels utilized a high-power light-emitting diode (LED) for illumination and excitation. Each fluorescent imaging channel used a specific fluorescent filter set for the corresponding colors: blue (excitation [EX], 377/50 nm; emission [EM], 470/22 nm), green (EX, 483/32 nm; EM, 536/40 nm), and red (EX, 531/40 nm; EM, 629/53 nm). The combined optics and digital imaging allowed variable imaging resolutions from 1 to 8 µm2/pixel. The proprietary optics setup captured highly uniform images of the entire well on a standard microplate. In addition, the F-Theta lens and galvanometric mirrors allowed for a rapid image capturing process, where 96 whole well images can be captured in less than 4 min. Cells that are seeded in standard microplates (6, 12, 24, 48, 96, 384, and 1536 wells) can be autofocused using Celigo software. Specifically for tumor spheroids, the focal plane was manually registered by the user, mainly due to the large thickness of the spheroids.
Celigo software consists of five major sections: START, SCAN, ANALYZE, GATE, and RESULTS. The START section allowed users to select the type of microplates to use in the experiment, as well as entering the general information about the experiment. The SCAN section allowed users to set up imaging and scanning parameters for the microplate, such as imaging channels and areas to scan on the plate. The ANALYZE section allowed the users to set up image analysis parameters to count the cells of interest in the plate. The GATE section allowed users to graph a histogram and scatter plot of data analyzed from the captured images, and perform a flowlike gating process. Finally, the RESULTS section allowed the users to view counting results, as well as the ability to export data into Excel and images.
U87MG Cell Seeding Density
U87MG cells were seeded at different densities (50, 100, 200, 400, 800, 1600, and 3200 cells) per well in the round- and flat-bottom microplates and allowed to grow for 4 days. The spheroid size and confluence percentage for 3D and 2D cultures, respectively, were assessed using the bright-field application on Celigo on days 4, 10, 14, 17, and 21. Specifically for 3D tumor spheroid image capturing, Celigo was first used to define the image focus on the smallest spheroid, and then the remaining spheroids were imaged at the same focal plane. For the time-course, size and confluence results were analyzed and compared between the 3D and 2D models at n = 20 for each density.
U87MG Spheroid Size and Adherent Cell Confluence Measurement after Drug Treatment
U87MG cells were seeded at 800 cells/well in the round- and flat-bottom microplates and allowed to grow for 4 days. On day 4, the spheroids and adherent cells were treated with 17-AAG at different concentrations (8, 4, 2, 1, 0.5, 0.25, 0.13, 0.063, 0.031, 0.016, and 0 µM) and a 0.01% DMSO control at n = 12 for each concentration. The spheroids and adherent cells were treated from days 4 to 17, and analyzed by image cytometry on days 4, 7, 10, 14, and 17. For the 3D model, the spheroid diameter was measured for the control and treated samples. The spheroid diameter is automatically calculated with the software by finding the major and minor axes of the spheroid and averaging them to determine the diameter. For the 2D model, confluence percentages were measured, where the confluence percentage is automatically calculated by dividing the cell coverage area by the total area of the microplate well. A dose–response curve of 17-AAG on day 17 was measured to determine the IC50 values for both 3D and 2D models.
To determine the quality of the high-throughput assay, the Z′-factor value was calculated by measuring the DMSO control and 8 µM 17-AAG treatment (n = 60). The Z′ factor is a dimensionless parameter that measures the dynamic range and variation of the high-throughput assay.
17
The Z′ factors were calculated for both 2D and 3D U87MG models using the equation
U87MG Spheroid and Cell Viability Measurement
U87MG cells were seeded at 800 cells/well in the round- and flat-bottom microplates and allowed to culture for 4 days. On day 4, the spheroids and cells were treated with 17-AAG at different concentrations (4, 2, 1, 0.5, 0.25, 0.13, 0.063, 0.031, 0.016, and 0 µM) and a 0.01% DMSO control at n = 10 for each concentration. The spheroids and adherent cells were treated from days 4 to 17. On days 4, 7, 10, 14, and 17, they were stained with calcein AM, PI, and Hoechst 33342 following the protocol described previously. The images of the spheroids and cells were captured and analyzed on each assessment day by sacrificing two sample wells for staining. For the 3D model, the spheroid diameter and PI fluorescent intensity were measured and compared on days 4 and 14. Similarly for the 2D model, total cell count and percent dead cells were measured to determine viability.
Measuring Dose–Response Effect of Four Drug Compounds on U87MG Spheroid Size and Adherent Cell Confluence
In order to demonstrate the capability of the Celigo image cytometer for performing drug screening assays on 3D tumor spheroids, dose responses of four drug compounds were measured on the U87MG spheroids. U87MG cells were seeded at 800 cells/well in the round- and flat-bottom microplates and allowed to culture for 3 days. On day 3, the spheroids and cells were treated with 17-AAG (4, 2, 1, 0.5, 0.25, 0.13, 0.063, 0.031, and 0.016 µM), paclitaxel (500, 167, 56, 19, 6, 2.058, 0.686, 0.229, and 0.076 nM), TMZ (200, 80 32, 12.80, 5.12, 2.05, 0.82, 0.328, and 0.131 µM), and doxorubicin (50, 10, 2, 0.4, 0.08, 0.016, 0.003, 0.0006, and 0.0001 µM), and allowed to incubate with the drugs from days 3 to 21. On days 3, 6, 10, 14, 17, and 21, images of the spheroids and cells were captured and analyzed on Celigo. For the 3D model, the spheroid diameter was measured for the control and treated samples. Similarly for the 2D model, confluence percentages were measured. The dose–response curves were generated and compared for the 3D and 2D models on day 14.
Measuring Effect of Four Drug Compounds on U87MG Spheroid and Cell Viability
In addition to measuring the dose–response effect of drugs on spheroid size and adherent cell confluence, viability measurements using calcein AM, PI, and Hoechst 33342 were also performed. On day 32 of the drug treatment described in the previous experiment, the spheroids and cells were stained with calcein AM, PI, and Hoechst prior to image analysis using Celigo. For the 3D model, the spheroid diameters were measured for the control and the drug-treated sample, as well as the calcein AM fluorescent intensities. In contrast, for the 2D model, total cell count and viability percentages were measured.
Results and Discussion
Effect of Seeding Density on U87MG Spheroid Size and Confluence Percentage
The growth of U87MG spheroid sizes and confluence percentages were investigated by measuring growth at different seeding densities from 50 to 3200 cells/well. Examples of bright-field images of the spheroids and cells with respect to the seeding densities are shown in Figure 1a , b . The spheroid sizes showed starting diameters at 144, 177, 228, 298, 376, 465, and 553 µm on day 4 corresponding to 50, 100, 200, 400, 800, 1600, and 3200 cells/well, respectively. The diameters plateaued to approximately 600 µm on day 21. The confluence showed starting percentages at 5%, 10%, 18%, 34%, 55%, 71%, and 82% on day 4 corresponding to 50, 100, 200, 400, 800, 1600, and 3200 cells/well, respectively. The percentages plateaued at approximately 98% on day 21.
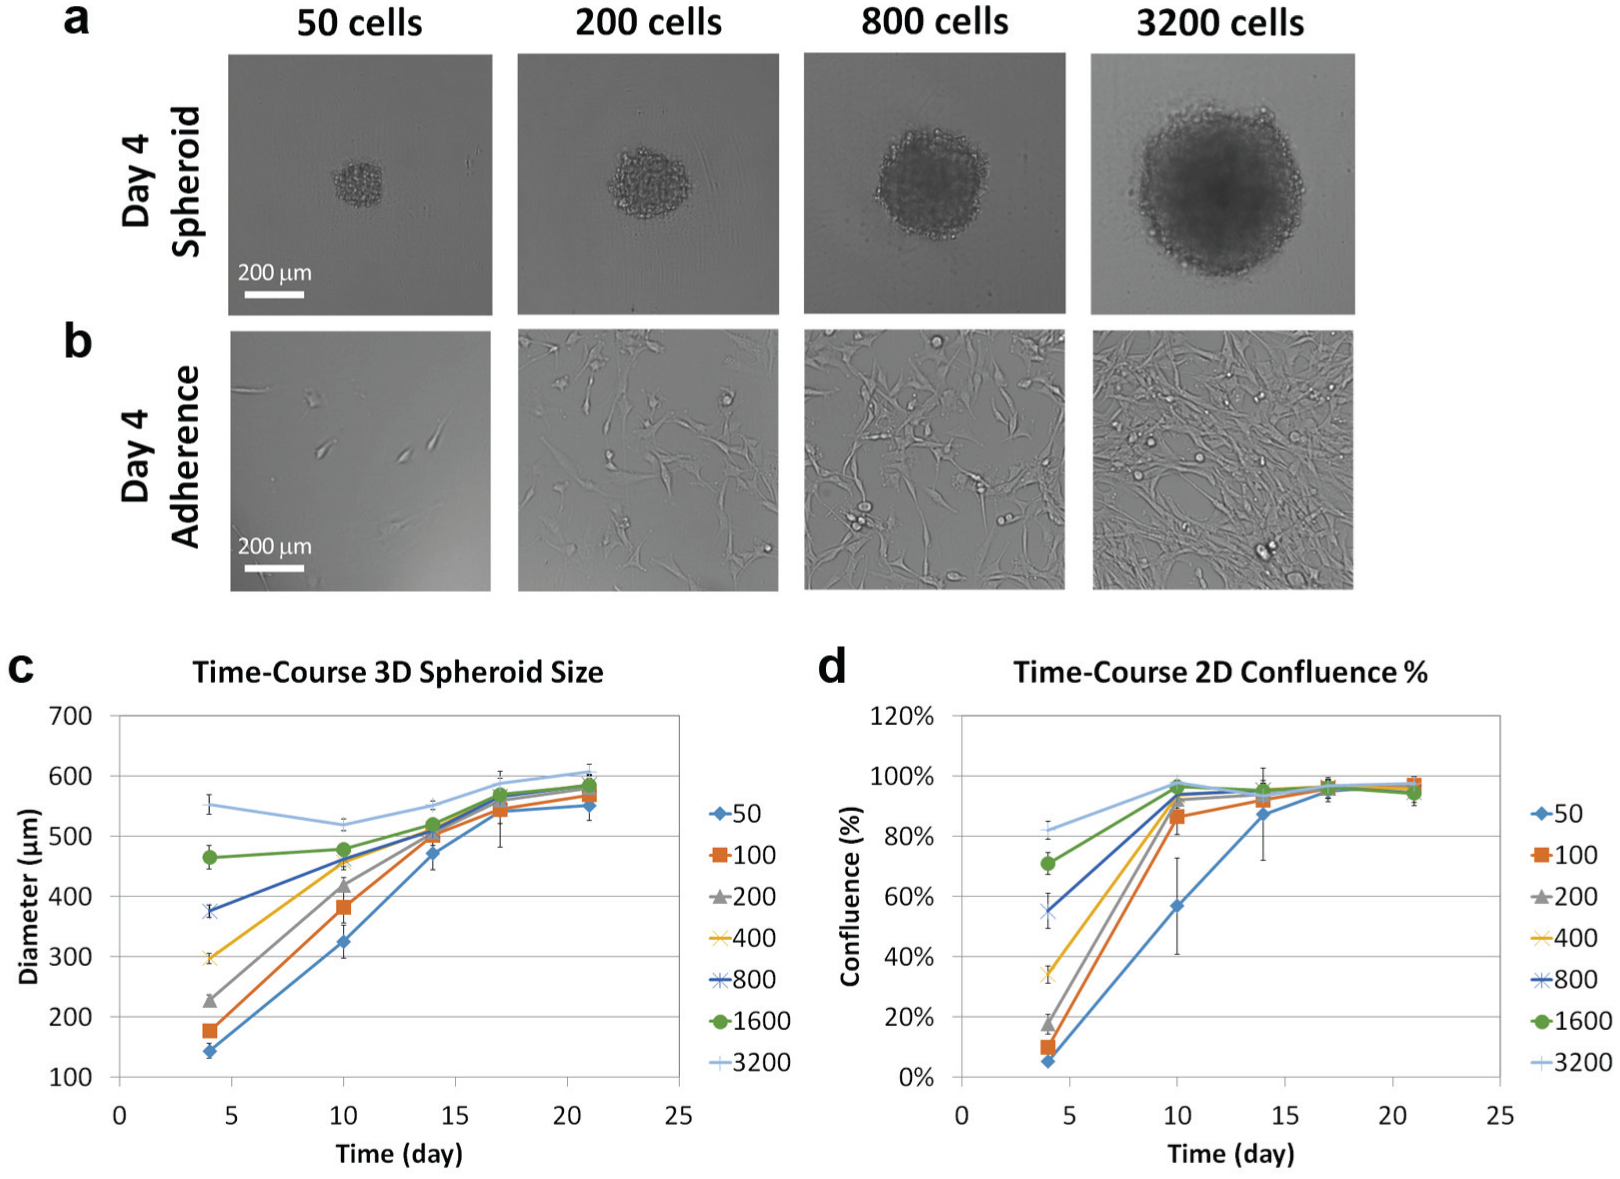
Effect of U87MG seeding density on tumor spheroid size and cell confluence measurement. Examples of Celigo captured bright-field images for (
The growth curves for both spheroid diameters and confluence percentages are shown in Figure 1c , d . Both diameters and confluence percentages showed large separations on day 4, and as growth time increased, the results for each seeding density converged, indicating growth saturation. The R2 values are calculated for each seeding density to determine their linearity, which was 0.94, 0.93, 0.93, 0.94, 0.98, 0.92, and 0.55 for 50, 100, 200, 400, 800, 1600, and 3200 cells/well, respectively. Therefore, a seeding density of 800 cells/well was selected for the remaining experiments because it produced a more linear growth rate for the tumor spheroid diameter. The same seeding density was selected for the 2D assay for consistency.
In this work, one of the main goals was to evaluate the measurement of two models that are currently performed in cancer research that can further support the characterization of anticancer drug compounds in high-throughput screening. The growth of glioblastoma spheroids is cultured in serum-free media with the addition of growth factors that are similar to neural stem cell–like cultures, while the adherent glioma cells are grown in serum-containing media.18–20 To stay consistent with current research models in the field, these media conditions were followed for evaluating 2D and 3D assays on the image cytometer.
Most of the image cytometry method currently used for tumor spheroid analysis required capturing multiple images at different focal planes to form a stack for image analysis. This can be time-consuming and requires imaging experts for data interpretation. In contrast, the optics in Celigo allowed large depth of field; thus, only one focal plane image per well was required for the entire 384-well plate.
17-AAG Effect on U87MG Spheroid Size and Confluence Percentage
The capability of Celigo image cytometry for measuring the effects of drug compound on spheroid diameter and cell confluence was demonstrated by exposing U87MG with 17-AAG. The bright-field label-free detection method has been previously described for 3D spheroid 6 and 2D cell culture 21 formats. The bright-field images for the 3D and 2D assays are shown in Figure 2a , b , where the reduction of spheroid diameter, as well as the confluence, can be clearly observed as 17-AAG concentration increased. In addition, the gradual reductions in spheroid diameters and confluence are shown in the bottom half of the whole plate bright-field image and filled image, respectively, in Figure 2c , d .
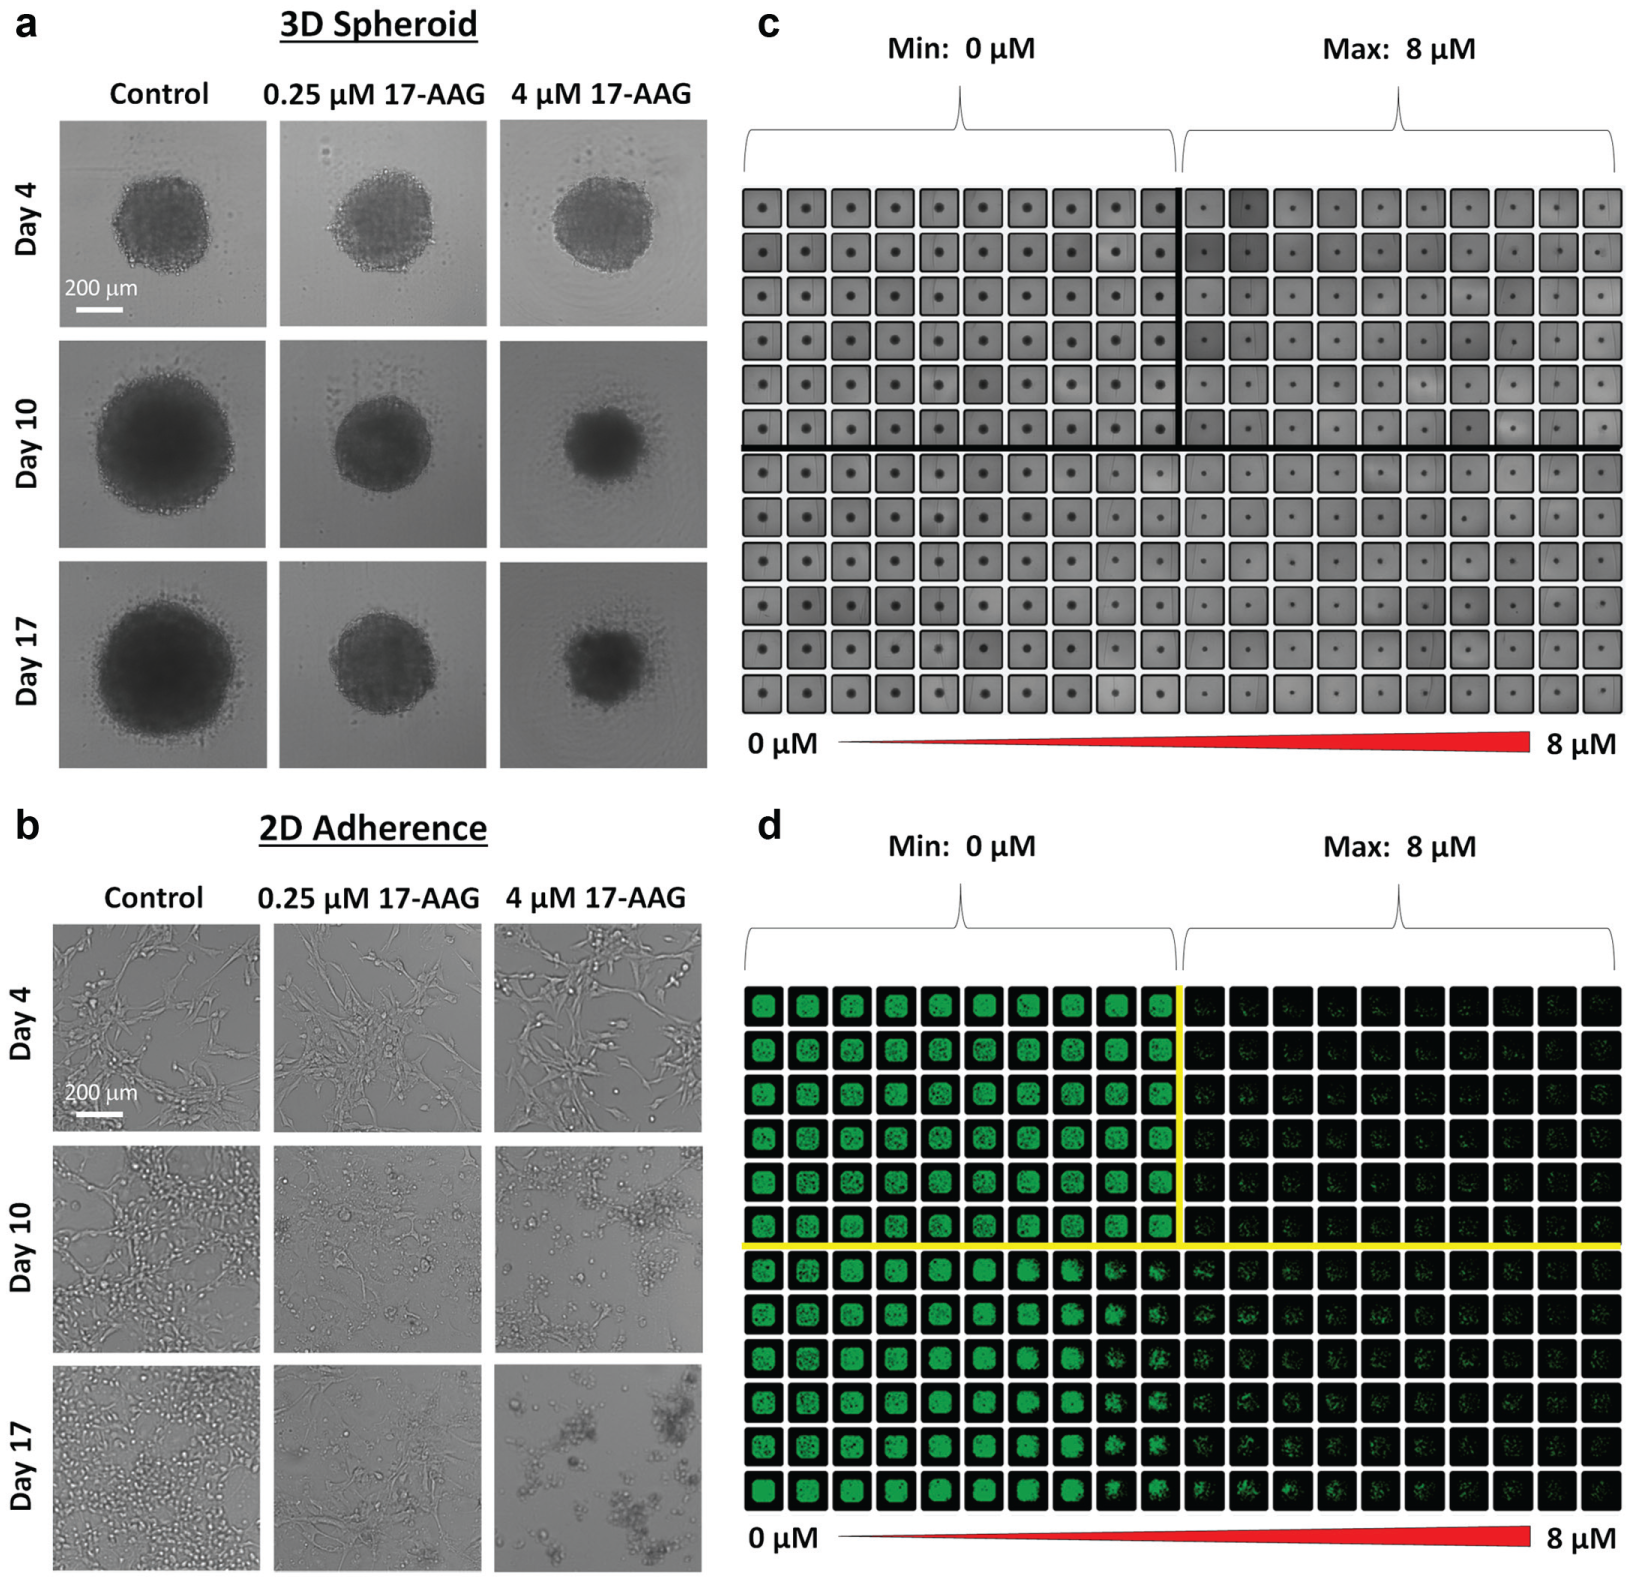
Bright-field images of 3D spheroids and 2D U87MG cells. Dose-dependent images of (
The time-course monitoring of spheroid diameter and confluence percentages are shown in Figure 3a , b . The results showed that the 0.25 µM 17-AAG inhibited cell growth, while the concentrations above induced cytotoxicity by reduction of spheroid size and deteriorated morphological. The concentrations below 0.25 µM did not inhibit growth. The growth results indicated that 0.25 µM 17-AAG was close to the IC50 of the dose response. The 17-AAG dose–response results were graphed in GraphPad Prism and are shown in Figure 3c , d , where the IC50 values for the 3D and 2D models were 0.2456 and 0.1429 µM, respectively. The trends and IC50 values were comparable between the two models. Both cancer models were characterized through dose–response measurement of 17-AAG. For the 3D assay, lower 17-AAG concentrations ranging from 0.016 to 0.13 µM showed minimum effects on the spheroid diameters. The linear range occurred from 0.13 to 0.5 µM ( Fig. 3c ), where a drastic change in diameter from 500 to 250 µm was observed. Interestingly, higher 17-AAG concentrations did not further reduce the spheroid diameter. For the 2D assay, a gradual decrease in cell confluence is observed as the 17-AAG concentration increased. At the higher 17-AAG concentration above 0.5 µM, the resulting trend was similar to that in the 3D assay, where no further reduction in confluence percentages is observed.
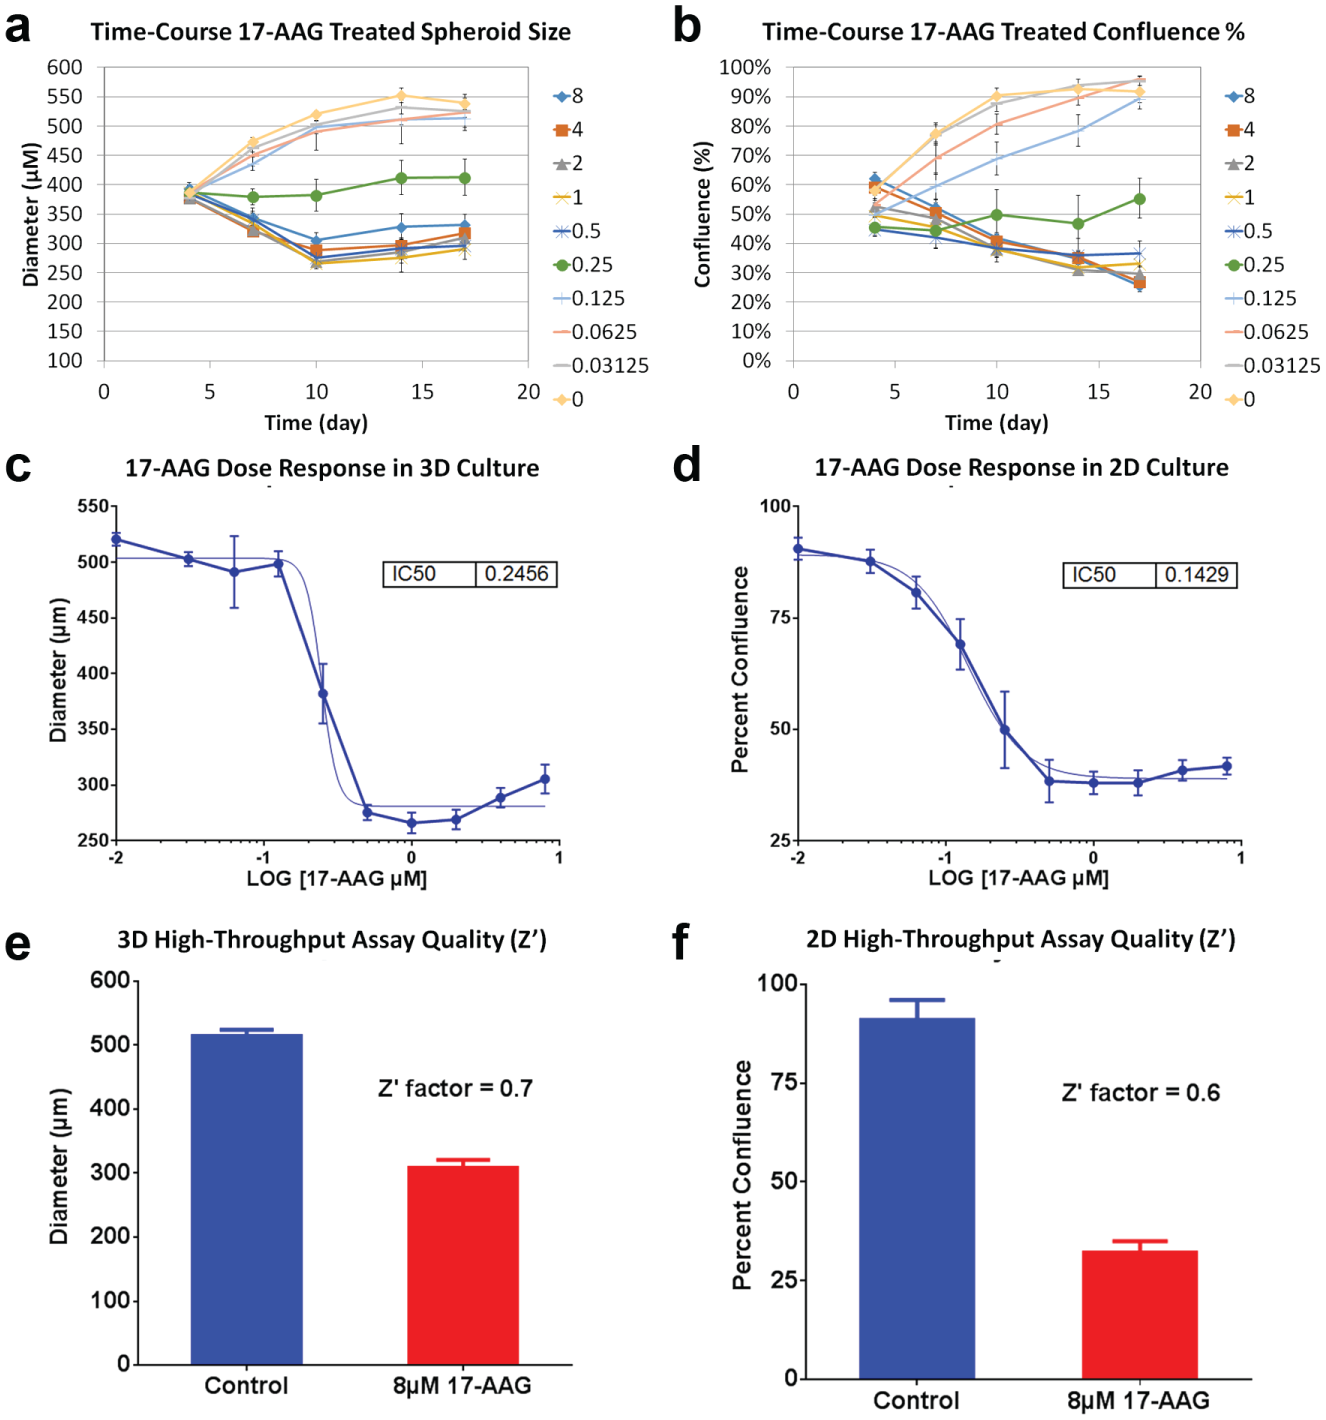
Spheroid diameter and percent confluence results for calculation of 17-AAG dose responses. Time-course monitoring of (
In this experiment, the quality of the screening assay was also measured by calculating the Z′ factor for both 3D and 2D assays. In general, the spheroid diameters and confluence percentages for 60 replicates of 0.01% DMSO controls and 8 µM 17-AAG were measured. The Z′-factor results for the 3D and 2D models were 0.7 and 0.6, respectively ( Fig. 3e , f ). According to the definition, the calculated Z′ factors have a large dynamic range and small variation, which indicated that this was an excellent assay for both 3D and 2D formats. 17 The results also indicated that Celigo image cytometry can be used as a high-throughput screening method for oncology research.
17-AAG Effect on U87MG Spheroid and Cell Viability
The viability of 3D tumor spheroid and 2D U87MG cells was assessed by staining with calcein AM, PI, and Hoechst 33342. The calcein AM is an enzymatic fluorescent dye that can passively enter the cells. As the esterase cleaves the calcein AM molecules, it allows the formation of fluorescent molecules of calcein, making the live cells fluoresce green emission. The PI is a membrane integrity viability dye that can pass through membrane-compromised dead cells and fluoresce red. The Hoechst 33342 is a membrane-permeable fluorescent dye that can passively enter all nucleated cells and stain the nucleus to emit blue fluorescence.
The green and red overlaid fluorescent images of the 4 µM 17-AAG-treated spheroid and cells are shown in Figure 4 . The DMSO control showed increasing spheroid diameters up to day 17. In addition, the spheroid core showed increasing PI fluorescence over time, indicating the necrotic core of the tumor spheroid, which can be due to the inability of nutrients passing into the core. In contrast, the 17-AAG-treated spheroid showed decreasing diameters, as well as a partially disintegrated spheroid body, on day 17. The PI signals were displayed in individual cells dispersed in the fragmented spheroid. For the 2D assay, the DMSO control showed increasing cell confluence over time, where the majority of the cells were calcein AM positive. The 17-AAG-treated cells showed decreasing confluence, and a few PI positives were observed on day 17.
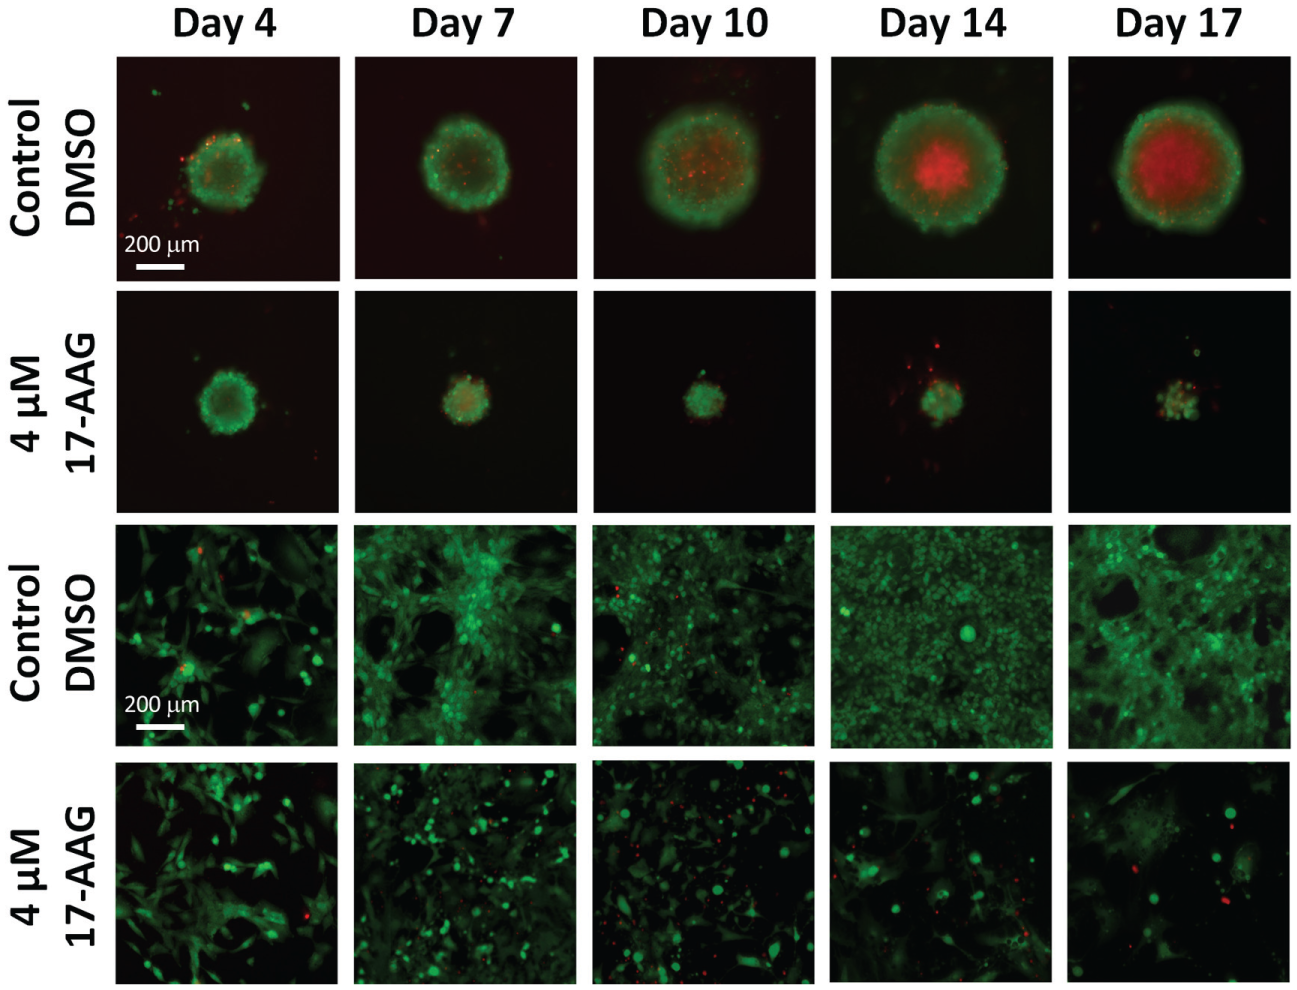
Combined fluorescent images of calcein AM and PI for 3D tumor spheroid and 2D cell confluence. Calcein AM and PI are pseudocolored green and red to indicate the fluorescence emission. Control and 4 µM 17-AAG-treated samples show a gradual increase and decrease in spheroid sizes (first and second rows) over time, as well as an increase and decrease in confluence percentage (third and fourth rows). The control tumor spheroid shows an increasing necrotic center with the PI staining, while the treated spheroid disintegrates to pieces over time. For the 2D cultures, low numbers of PI positive cells are observed in the fluorescent images.
In order to accurately measure the viability for both 3D and 2D assays, the Hoechst 33342 fluorescent dye was used to define the perimeter of tumor spheroid, as well as count total nucleated cells. Properly defining the perimeter of the spheroid allowed accurate measurement of calcein AM and PI fluorescent intensity within the spheroid. Equivalently, a proper total nucleated cell count allowed for accurate viability measurement for the 2D assay. The time-course monitoring of PI fluorescent intensities and dead cell population percentages are shown in Figure 5a , b . The results showed an increase in PI signals as the treatment time increased, similar to the 2D dead cell populations. Since the spheroid size decreased as the 17-AAG concentration increased, it caused the total PI fluorescent signals measured within the necrotic core to decrease. Therefore, the PI fluorescent results did not correlate to the actual viability status of the 17-AAG-treated spheroid.
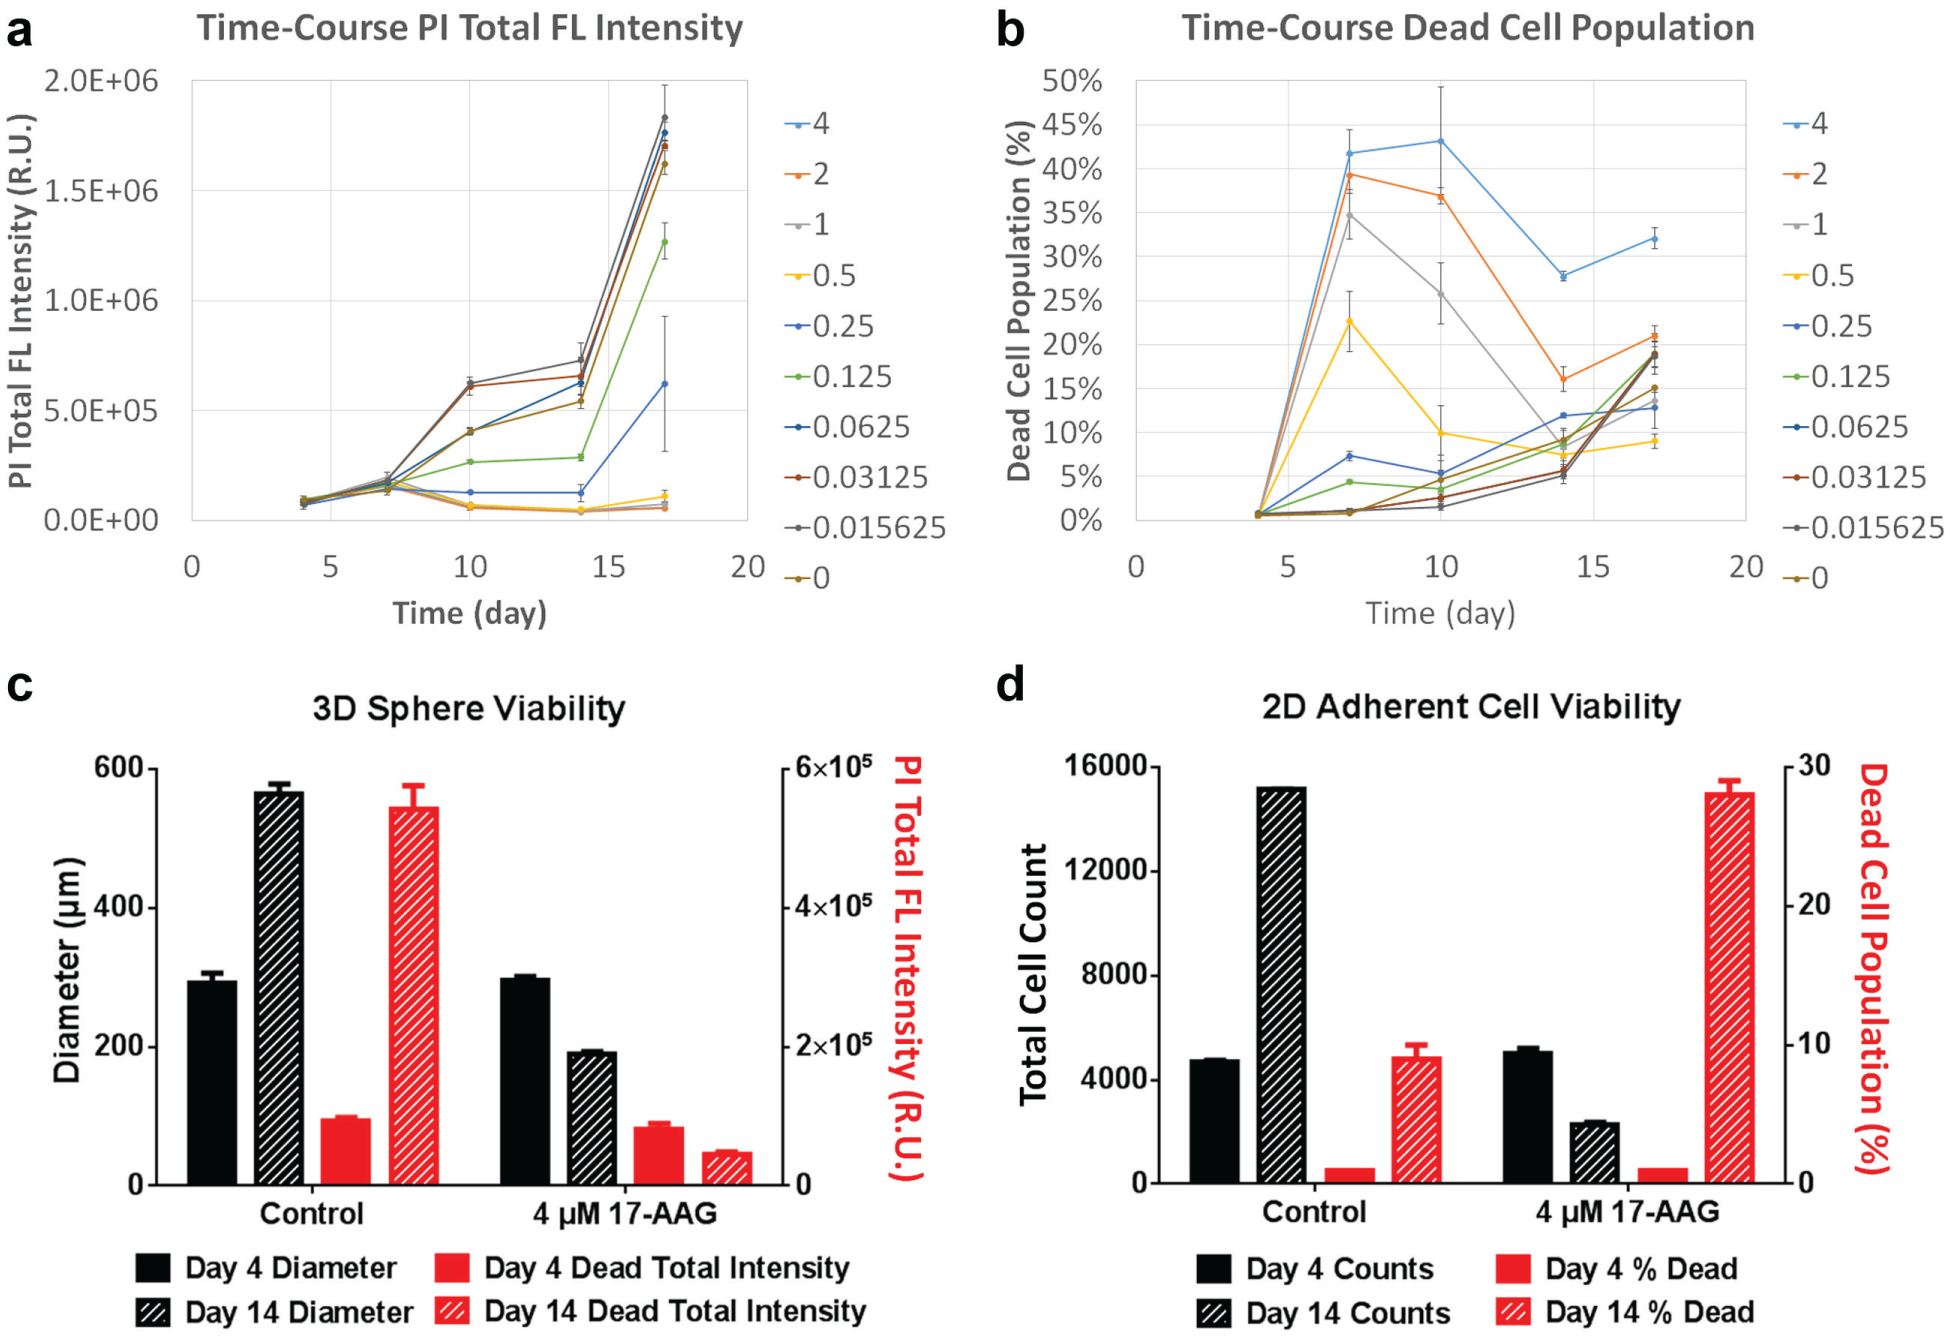
Dose–response viability results for U87MG tumor spheroids and cells. (
The viability results compared between days 4 and 14 are shown in Figure 5c , d . For the 3D assay, both spheroid diameter and PI intensity in the spheroid necrotic core were measured. The results showed an increase in spheroid diameter from ~300 to 590 µm for the control, and from ~300 to 200 µm for the 17-AAG-treated sample. The measured core PI total intensity increased from ~1 × 10⁵ to 5.5 × 10⁵ R.U. for the control, and from ~1 × 10⁵ to 0.5 × 10⁵ R.U. for the 17-AAG-treated sample. The intensity results did not correlate to the viability status of the spheroids; thus, spheroid diameters may be a better parameter to report for spheroid viability. For the 2D assay, both total cell count and percent dead cells for viability were measured. The results showed an increase in total cell count from ~4500 to 15,000 cells for the control, and from ~4500 to 2000 cells for the 17-AAG-treated sample. The percent dead cells increased from ~2% to 10% for the control, and from 2% to 28% for the 17-AAG-treated sample. In this case, both total cell count and percent dead cells can be good indicators for measuring viability of the 2D assays.
Drug Screening: Dose Response with Respect to Spheroid Size and Confluence Percentage
Four different known drug compounds at different concentration series were used to induce cytotoxicity in U87MG spheroids and cells to demonstrate the image cytometry–based high-throughput screening method. In this screening assay, spheroid diameters and cell confluences were measured on day 14 to calculate the IC50 values for each drug compound. The dose–response curves and IC50 values for both 3D and 2D assays were plotted and calculated in GraphPad Prism ( Fig. 6 ). The 3D assay IC50 values were 0.2533 µM, 0.01234 nM, 14.84 µM, and 0.1663 µM, and the 2D assay IC50 values were 0.1706 µM, 0.1231 nM, 12.80 µM, and 0.04920 µM for 17-AAG, paclitaxel, TMZ, and doxorubicin, respectively. The results were highly comparable for 17-AAG, paclitaxel, and TMZ between the 3D and 2D assays. However, the 2D assay value was three times lower for doxorubicin, which indicated that drug susceptibility can be different between the 3D and 2D assays. The experiment was performed on one 384-well plate with multiple compounds and concentrations. Each plate scan/analysis was less than 5 min, thus allowing researchers to have the capability of rapidly screening thousands of drugs compounds on a daily basis.
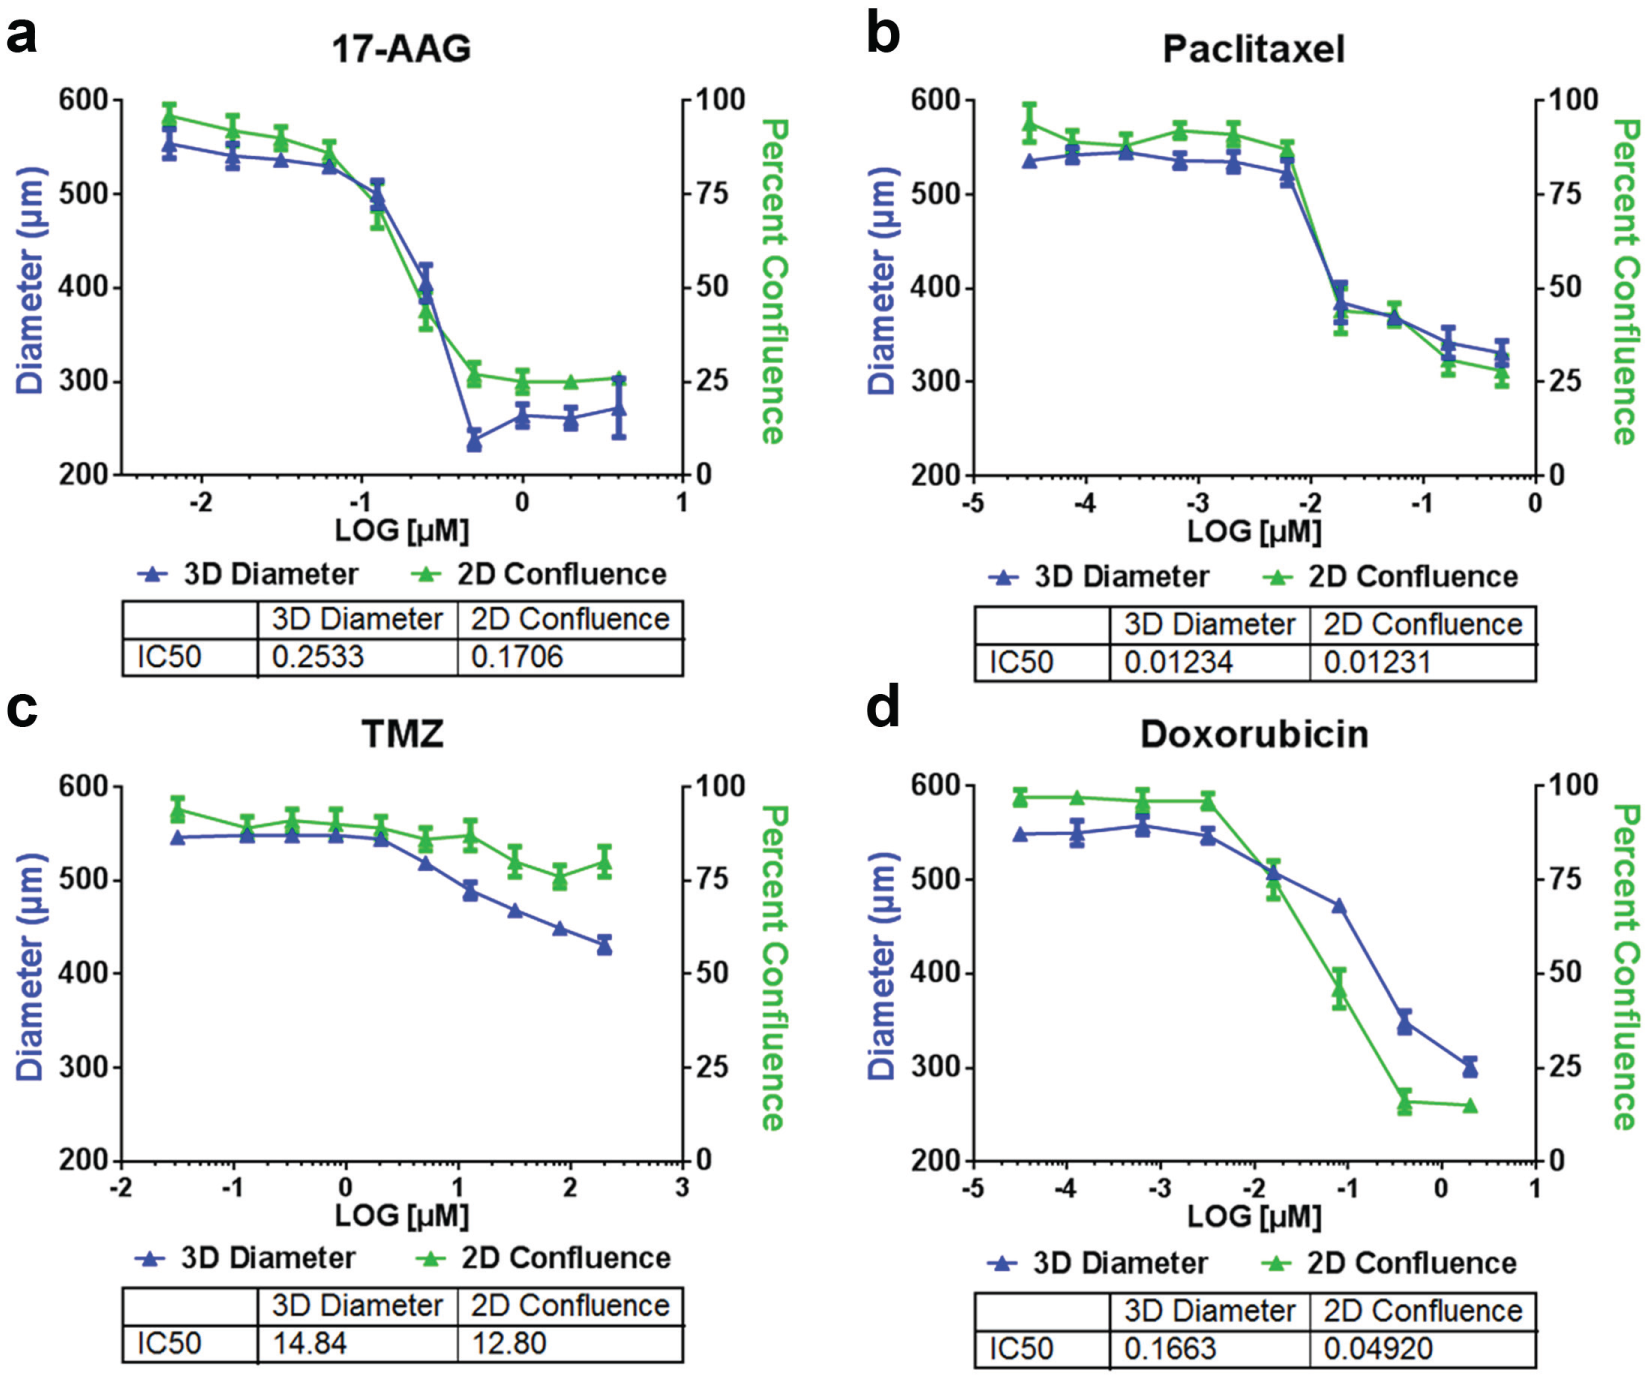
Dose–response curves for (
Both 3D and 2D cancer models can exhibit similar or different dose responses to different drug compounds. The Celigo image cytometer was used to perform label-free detection of spheroid and cell growth as a potential method to determine drug effectiveness in previous publications.6,21 In this work, the confluence percentages and spheroid diameters were not compared to each other, but used to demonstrate high-throughput label-free measurement for the two cancer models.
Drug Screening: Effect of Drug on Spheroid and Cell Viability
In addition to the dose–response analysis, the cytotoxicity effect from different anticancer drugs can also be performed in a high-throughput manner on Celigo, which allows another parameter to evaluate drug potency. After the U87MG spheroids and cells were treated with 0.01% DMSO control, 4 µM 17-AAG, 0.5 µM paclitaxel, 200 µM TMZ, and 2 µM doxorubicin, they were stained again with calcein AM, PI, and Hoechst 33342 for viability measurement. These concentrations were selected because they are highly cytotoxic to U87MG, which allowed clearer images and data analysis. The green and red overlaid fluorescent images on day 21 are shown in Figure 7a . For the 3D assay, the tumor spheroid with DMSO grew normally with a bright red necrotic core from the PI. 17-AAG drug treatment showed a reduction in spheroid diameter and calcein AM green fluorescence and an increase in the proportion of cells stained with PI fluorescence, indicating low viability. Doxorubicin appeared to have a similar phenotype as 17AAG; however, red intensity observed in the doxorubicin treatment could be due to its autofluorescent properties and not PI fluorescence; further investigations are needed to clarify this effect. The 17-AAG treatment again showed disintegration of the spheroid. Paclitaxel showed more size reduction than TMZ, and both showed some PI positive cells dispersed in the spheroid. For the 2D assay, the control showed highly confluent U87MG cells across the well. The 17-AAG and doxorubicin treatments showed a large reduction in cell numbers and mostly are PI positive. Paclitaxel showed a larger cell number reduction than TMZ, and numerous PI positive cells can be observed.
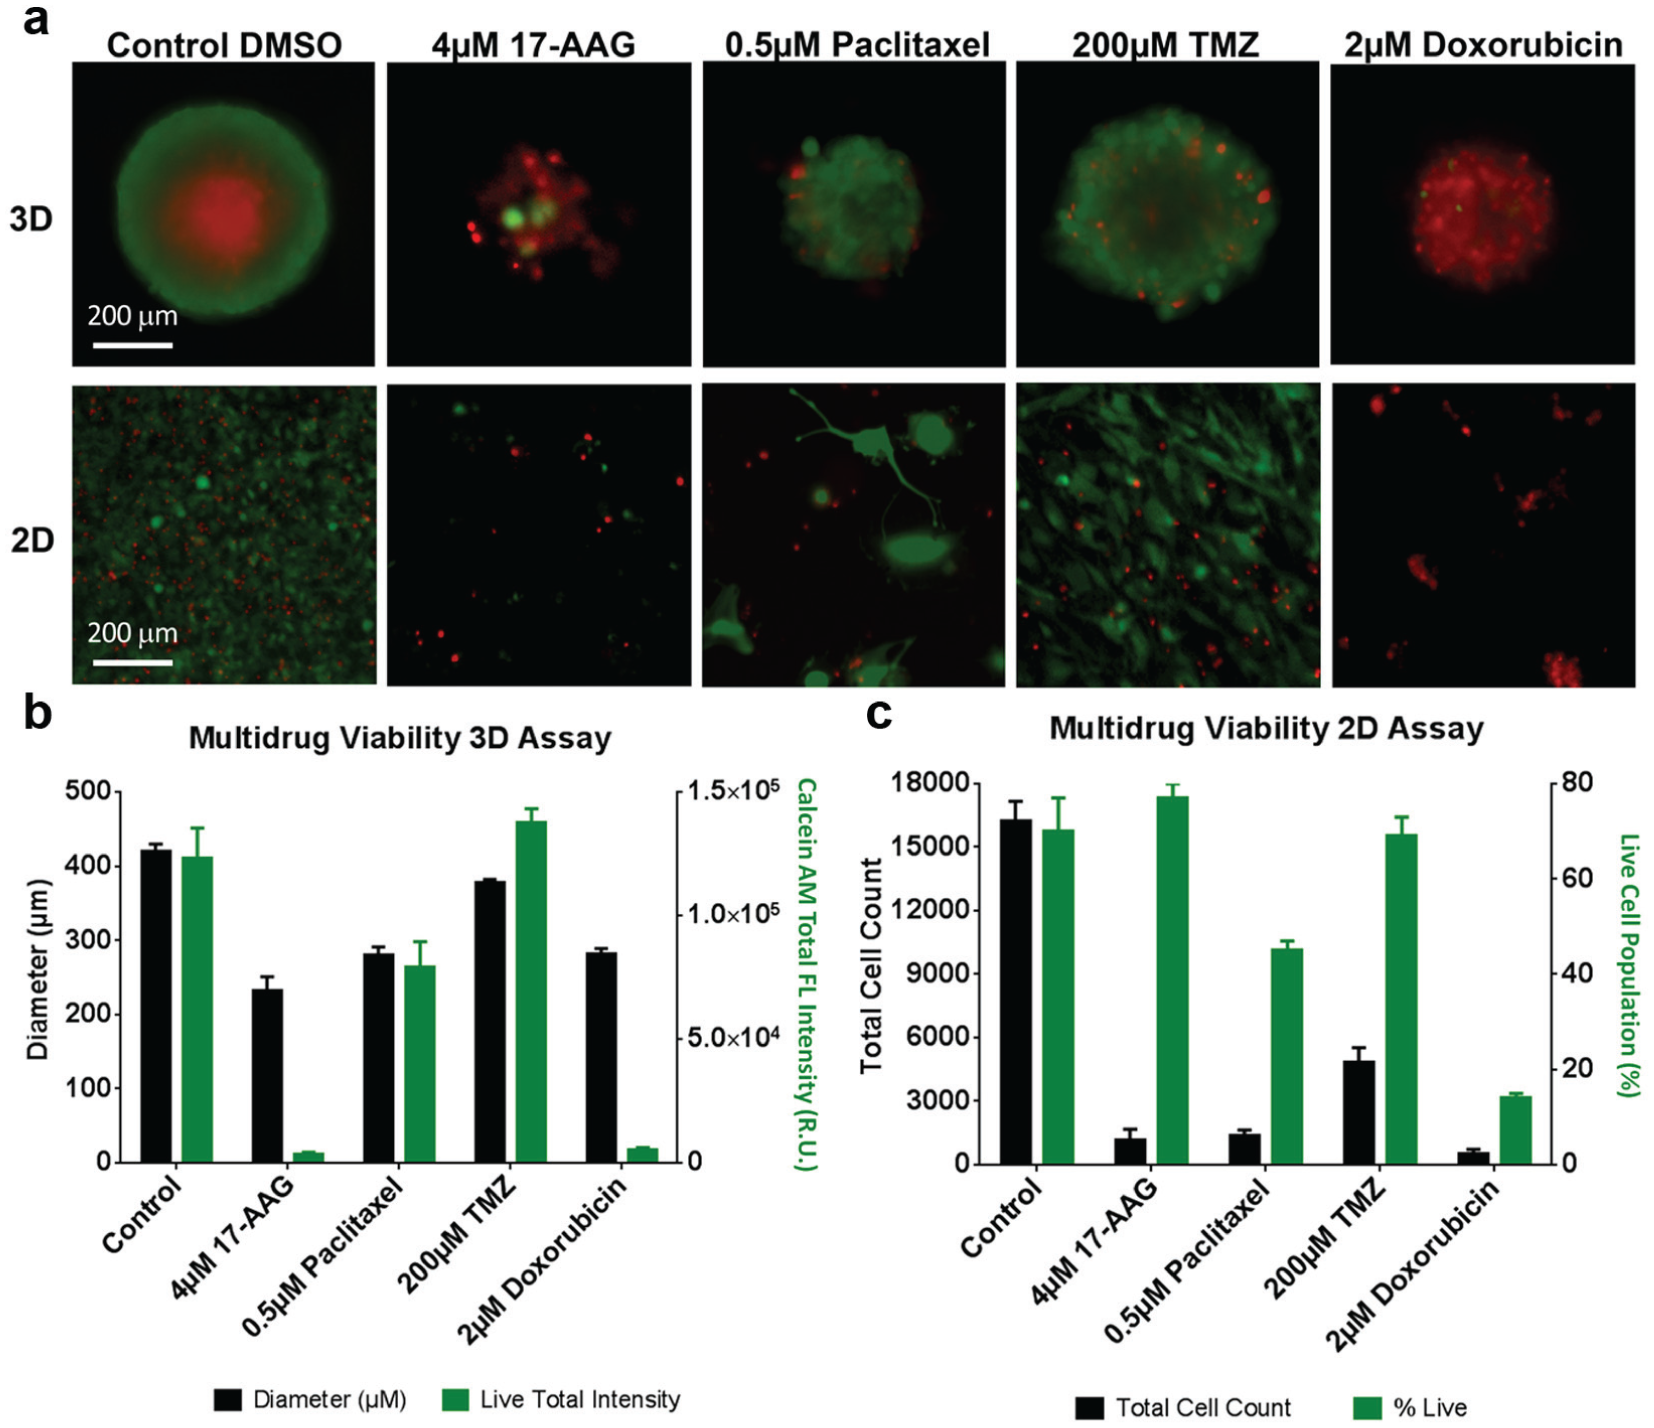
Drug screening viability results using calcein AM, PI, and Hoechst 33342. (
The viability results are shown in Figure 7b , c , where spheroid diameters and total cell count were analyzed to determine the relative viability similar to the previous experiment. For the 3D assay, the diameter results are approximately 410, 230, 280, 380, and 280 µm for the control, 17-AAG, paclitaxel, TMZ, and doxorubicin, respectively, which clearly showed the different levels of cytotoxicity effect on U87MG and correlated to the fluorescent images. In contrast to the previous viability experiment, instead of measuring PI fluorescent intensity in spheroids, we have analyzed the total calcein AM intensity to demonstrate that calcein AM may be a better viability indicator than PI. The calcein AM intensity showed a direct correlation to the spheroid size, where control, paclitaxel, and TMZ retained high fluorescent signals, in contrast to 17-AAG and doxorubicin, which showed only a small level of fluorescence. For the 2D assay, the total cell counts were approximately 16,000, 1000, 1500, 5000, and 500 cells for the control, 17-AAG, paclitaxel, TMZ, and doxorubicin, respectively, which were similar to the 3D assay. The percent live cells using calcein AM also showed high viability for the control sample. The percent live cells for doxorubicin was significantly reduced, while paclitaxel and TMZ showed only a slight reduction. The 17-AAG treatment showed a high percentage of live cells, which did not correlate the actual viability of the sample. It could be due to lysing of dead cells or the loss of dead cells during the staining step, and thus was not taken into calculation for viability.
Conclusion
In conclusion, Celigo image cytometry can be employed as a high-throughput screening method for potential cancer drug candidates. The experiments in this work were performed in multiple standard 384-well plates for 3D and 2D assays to demonstrate the capability of the instrument to efficiently measure size, confluence, cell count, and viability of U87MG tumor spheroids and cells. Specifically for 3D tumor spheroid analysis, the Celigo image cytometry method can significantly reduce the time required for image acquisition because it only requires one image to be captured for each spheroid, instead of stacks of images. The cytotoxicity effects from multiple anticancer drugs and concentrations were quickly measured to determine dose response and calculate IC50 values. The viability of tumor spheroids and cells can also be determined by using calcein AM, PI, and Hoechst 33342. However, it seemed that measuring calcein AM fluorescent intensity in the tumor spheroid is a better viability indicator.
The comparison between the 3D and 2D assays showed mostly comparable results, but the doxorubicin IC50 values do differ, indicating that some drugs may have different cytotoxicity effects on tumor spheroids and cells. Although many references have indicated that 3D models for cancer drug screening may be more predicative for in vivo testing, it is important to investigate the cytotoxicity effect in both models and use the results to establish the best model for each type of cancer. In addition, it will be important to evaluate the proposed method by comparing the results directly to those in animals in the future. By utilizing the Celigo image cytometry method, both models with multiple conditions can be tested so that cancer researchers can obtain a large data set of dose–response and viability results to determine the applicability of tested potential drug compounds. This can allow a faster process to discover highly qualified drug candidates, bringing drugs to clinical trials faster, with a higher success rate. Future work using the proposed method will be to screen a large panel of drug compounds in both 3D and 2D models for potential drug candidates.
Footnotes
Declaration of Conflicting Interests
The authors declared the following potential conflicts of interest with respect to the research, authorship, and/or publication of this article: The authors, S.K., E.S., O.D., S.C., D.K., J.Q., and L.L.C., declare competing financial interests. The work performed in this manuscript is for reporting on product performance of Nexcelom Bioscience, LLC. The performed experiments were to demonstrate novel methods for image-based 3D tumor spheroid analysis.
Funding
The authors received no financial support for the research, authorship, and/or publication of this article.