
Abstract
Three-dimensional (3D) tumor models have been increasingly used to investigate and characterize cancer drug compounds. The ability to perform high-throughput screening of 3D multicellular tumor spheroids (MCTS) can highly improve the efficiency and cost-effectiveness of discovering potential cancer drug candidates. Previously, the Celigo Image Cytometer has demonstrated a novel method for high-throughput screening of 3D multicellular tumor spheroids. In this work, we employed the Celigo Image Cytometer to examine the effects of 14 cancer drug compounds on 3D MCTS of the glioblastoma cell line U87MG in 384-well plates. Using parameters such as MCTS diameter and invasion area, growth and invasion were monitored for 9 and 3 d, respectively. Furthermore, fluorescent staining with calcein AM, propidium iodide, Hoechst 33342, and caspase 3/7 was performed at day 9 posttreatment to measure viability and apoptosis. Using the kinetic and endpoint data generated, we created a novel multiparametric drug-scoring system for 3D MCTS that can be used to identify and classify potential drug candidates earlier in the drug discovery process. Furthermore, the combination of quantitative and qualitative image data can be used to delineate differences between drugs that induce cytotoxic and cytostatic effects. The 3D MCTS-based multiparametric scoring method described here can provide an alternative screening method to better qualify tested drug compounds.
Keywords
Introduction
Two-dimensional (2D) cancer models have been playing an important role in testing the effects of anticancer drug compounds for in vitro assays.1,2 Although 2D drug-screening assays can be easily performed, they may not accurately represent the complex in vivo tumor microenvironments. Therefore, there has been a significant increase of interest in using three-dimensional (3D) tumor spheroid models for high-throughput (HT) cancer drug-screening assays. 3 The 3D tumor spheroid is a highly complex model for HT drug-screening assays. Unlike the 2D models, in which cells can be enumerated and analyzed individually, the 3D model requires a more advanced analysis method to characterize and quantify the effect of drugs on the entire spheroid consisting of clusters of cells. Therefore, multiple orthogonal assays are required to screen the drug compounds to create a multiparametric analysis platform.
Due to the rapidly increasing availability of image cytometry technologies that can be used for analyzing 3D tumor models, numerous studies have been published that investigated the effects of anticancer drugs on tumor spheroids.3–8 However, a characterization method for ranking the effects of tested drug compounds on 3D multicellular tumor spheroids has yet to be demonstrated. Previously, we demonstrated a novel high-throughput screening method for 3D multicellular tumor spheroids (MCTS) using the Celigo Image Cytometer. 2 The method described the use of 384-well ultra-low attachment (ULA) U-bottom microplates for spheroid formation, growth inhibition, and viability assays. In this work, we developed a novel multiparametric scoring method for HT screening of 3D MCTS to characterize and identify potential cancer drug candidates. Four experiments were conducted to investigate the effects of 14 drug compounds on U87MG MCTS for growth inhibition, 2 invasion inhibition, 9 viability, and apoptosis. First, U87MG MCTS were allowed to form for approximately 4 days and subsequently treated with the 14 drug compounds at different concentrations. The spheroid growth inhibition was determined by measuring the diameters of drug-treated MCTS over time. At the end of the growth inhibition assay, the treated MCTS were stained with calcein AM and propidium iodide (PI) to determine MCTS viability by measuring the fluorescent intensities for both fluorescent probes. In addition, the treated MCTS were stained with caspase 3/7 to determine the spheroid apoptosis level by measuring the fluorescent intensity. Finally, the invasion inhibition was determined by measuring the invasion area of drug-treated MCTS into the extracellular matrix over time.
As previously stated, a method to analyze, characterize, and score the effects of anticancer drugs on MCTS has not been published. The results from spheroid growth inhibition, invasion inhibition, viability, and apoptosis assays were used to perform the multiparametric score calculation to identify highly effective drug compounds. Each tested drug compound displayed a different level of anticancer effect on the MCTS. By calculating 3, 6, and 9 times the standard deviation of the control, each drug was characterized and ranked by assigning a score ranging from 0 to 3, where 3 was the highest effect and 0 was no effect. The proposed drug effectiveness scoring method can improve the efficiency and speed of 3D model-based HT screening assays for identifying more highly qualified compounds for cancer drug discovery.
Materials and Methods
U87MG Cell Culture and Spheroid Formation
U87MG cells (human glioblastoma adherent cell line, ATCC HTB-14) were cultured in EMEM (EBSS) basal media with 10% fetal bovine serum, 2 mM glutamine, 1% nonessential amino acids, and 1 mM sodium pyruvate (Gibco) in TC-treated flasks at 37 °C and 5% CO2. The cultures were passaged when confluency reached ~80% to 90%. For MCTS formation, the U87MG cells were seeded at 500 cells/well (80 µL/well) in EMEM (EBSS) basal media, 2 mM glutamine, 1% nonessential amino acids, and 1 mM sodium pyruvate in 384-well ULA round-bottom microplates (ULA-384U, Nexcelom Bioscience, Lawrence, MA). Next, the plates were centrifuged at 300 g for 10 min to cluster cells in the bottom of the wells and then incubated for 4 d at 37 °C and 5% CO2 to allow the MCTS to form.
Drug Compound Preparation
Fourteen drug compounds (
Celigo Image Cytometer Instrumentation and Software
The Celigo Image Cytometer has been used for numerous cell-based assays in previous publications.1,2,26 The Celigo used a transmission and epifluorescence optical setup for one bright-field (BF) and four fluorescent (FL) imaging channels (blue, green, red, and far red) to perform plate-based image cytometric analysis. Both BF and FL imaging channels used a high-power light-emitting diode for illumination and excitation. Each FL imaging channel used a specific fluorescent filter set for the corresponding colors: blue (EX: 377/50 nm, EM: 470/22 nm), green (EX: 483/32 nm, EM: 536/40 nm), red (EX: 531/40 nm, EM: 629/53 nm), and far red (EX: 628/40 nm, EM: 688/31 nm). The combined optics and digital imaging allowed variable imaging resolutions from 1 to 8 µm2/pixel. The proprietary optics setup captured highly uniform images of the entire well on a standard microplate. The F-Theta lens and galvanometric mirrors’ imaging optics can perform a rapid image-capturing process, in which 96 whole-well images can be captured in less than 4 min in bright field. The Celigo can perform autofocusing; however, for tumor spheroids, the focal plane was manually registered by the user, mainly because of the large thickness of the spheroids.
The Celigo software allowed the selection of different applications for analysis of 3D MCTS. The “Tumorsphere 1,” “Tumorsphere Migration,” and “Tumorsphere 1 + 2 + Mask” applications were used to measure spheroid diameter, invasion area, fluorescent intensities of calcein AM, PI, and caspase 3/7, respectively. The results were exported to Excel for further calculation for the ranking of anticancer effects of each tested drug compound.
MCTS Growth Inhibition Assay
The MCTS growth inhibitory effects of each drug compound were investigated by measuring the changes in MCTS diameters over 9 d after the drug induction. U87MG cells were seeded at 500 cells/well (80 µL/well) in two 384-well ULA round-bottom microplates and allowed to form MCTS for 4 d. On day 4, half of the medium (40 µL) was removed from each well, and 40 µL of the 2× drug compound titrations (final 10, 5, 2.5, 1, 0.5, 0.1, and 0.05 µM) and a 0.02% DMSO control (final 0.01%) were added in triplicate wells (
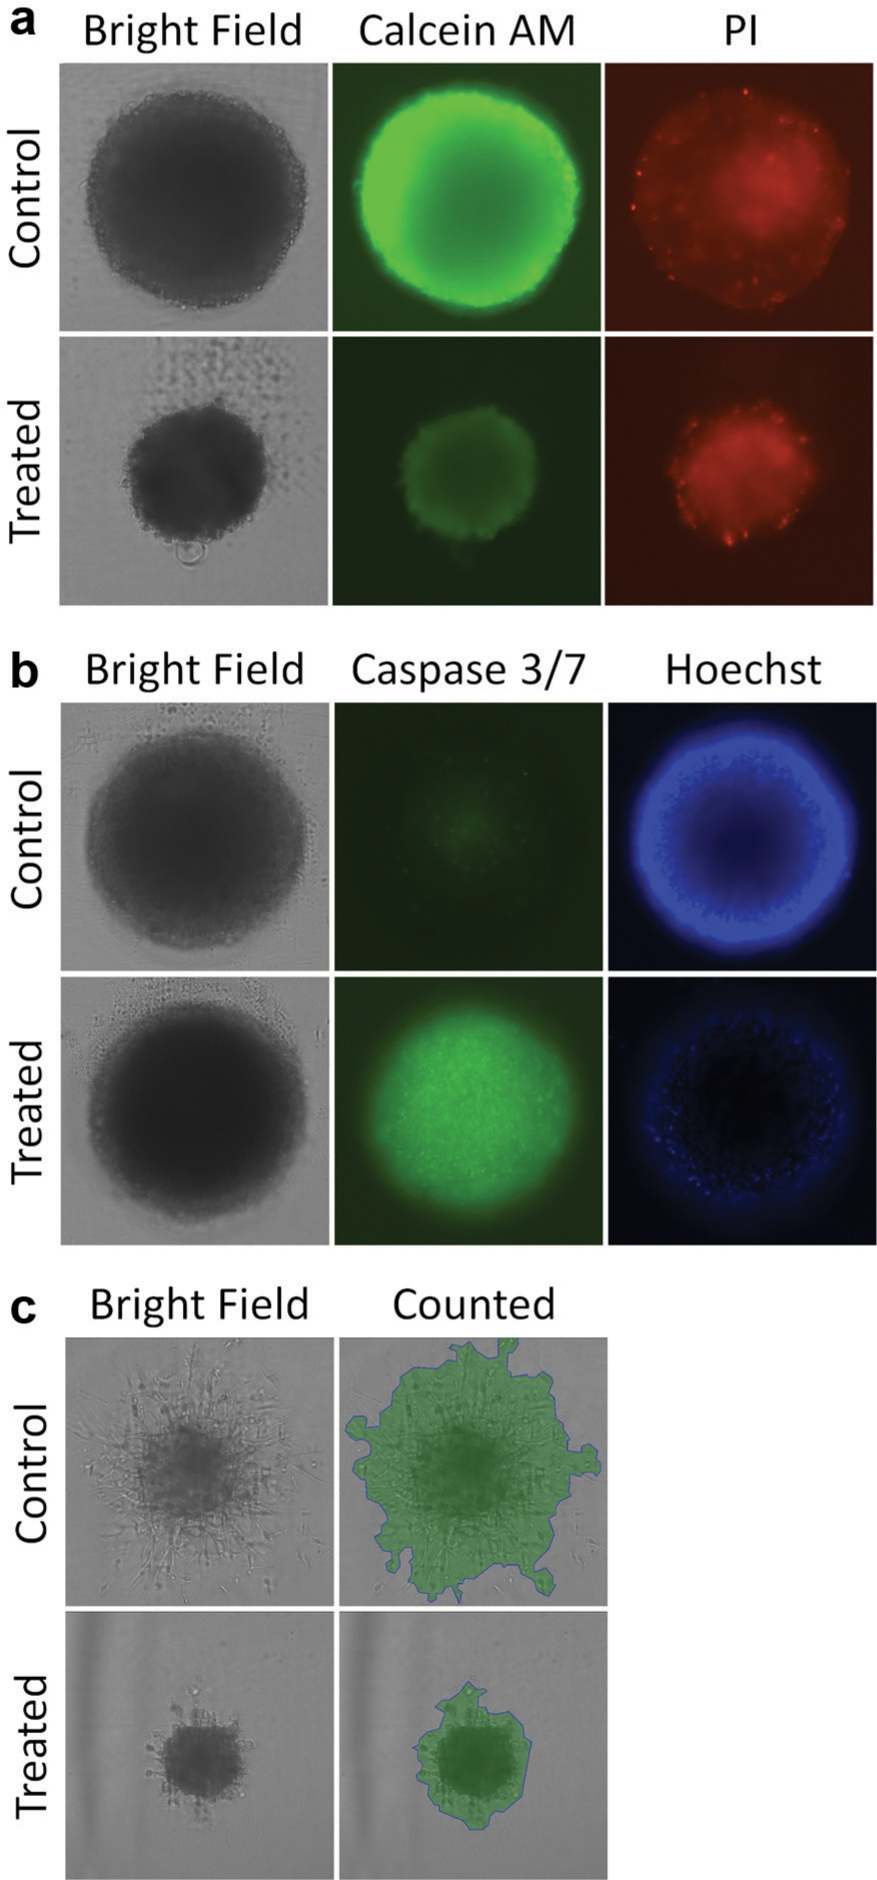
Examples of bright-field and fluorescent images acquired for growth inhibition, viability, apoptosis, and invasion assays. (
Fluorescent Staining and Image Analysis Protocol for MCTS Viability
One of the prepared 384-well ULA microplates for growth inhibition was obtained after the last growth inhibition assay scan on day 9. The plate served as the endpoint measurement for MCTS viability. Two fluorescent stains, calcein AM and PI from Nexcelom Bioscience, were used to stain the U87MG MCTS to determine viability. A stock staining solution was prepared by mixing 10 µL of 1 mM calcein AM and 40 µL of 1 mg/mL PI in 20 mL of phosphate-buffered saline (PBS). The U87MG MCTS were stained by gently removing 40 µL of media and replaced with 40 µL of the stock staining solution. The plate was then incubated at 37 °C and 5% CO2 for 60 min prior to performing the Celigo image cytometric analysis.
Immediately after the incubation, the plate was scanned using the “Tumorsphere 1 (Green) + 2 (Red) + Mask (BF)” application in the software. The exposure times for the green, red, and BF channels were 5000, 60,000, and 9000 µs, respectively (
Fig. 1a
). For the analysis, the MCTS were first identified in the bright-field images, and then the fluorescent intensities of calcein AM and PI were measured and exported directly into Excel. Next, the exported average calcein AM and PI fluorescent intensities were used to calculate
Fluorescent Staining and Image Analysis Protocol for MCTS Apoptosis
The second prepared 384-well ULA microplate for growth inhibition was also obtained on day 9 after the drug treatment. The plate served as the endpoint measurement for MCTS apoptosis. Two fluorescent stains, caspase 3/7 and Hoechst 33342 (Hoechst) from Nexcelom Bioscience, were used to stain the U87MG MCTS to determine the level of caspase 3/7 activation. The caspase 3/7 substrates are bound to high-affinity DNA fluorescent dyes. When the substrates are cleaved by caspase 3/7 during apoptosis, the fluorescent dyes migrate to the nucleus to bind to the DNA and then emit green fluorescence. A stock staining solution was prepared by mixing 80 µL of 1 mM caspase 3/7 and 8 µL of 10 mg/mL Hoechst in 20 mL of PBS. The U87MG MCTS were stained by gently removing 40 µL of media and replaced with 40 µL of the stock staining solution. The plate was then incubated at 37 °C and 5% CO2 for 60 min prior to being scanned and analyzed using the Celigo analysis software.
Immediately after the incubation, the plate was retrieved and scanned using the “Tumorsphere 1 (Green) + 2 (Blue) + Mask (BF)” application in the software. The exposure times for the green, blue, and BF channels were 30,000, 30,000, and 9000 µs, respectively ( Fig. 1b ). For the analysis, the MCTS were first identified in the bright-field images, and then the fluorescent intensities of caspase 3/7 were measured and exported directly into Excel. Next, the exported average caspase 3/7 intensities were used to determine the apoptosis effect of the drug compounds on the U87MG MCTS. The average caspase 3/7 intensities for all drugs were plotted for comparison to the control.
MCTS Invasion Assay
The effect of the drug compounds on the level of MCTS invasion was investigated by measuring the changes in MCTS invasion area in a basement membrane-like matrix (BMM; e.g., Matrigel) gel over 3 d after the drug induction.
9
The U87MG cells were seeded at 500 cells/well in a 384-well ULA round-bottom microplate and allowed to form spheroids for 4 d. On day 4, the stock drug compound solutions were diluted directly in soluble BMM (on ice) to produce the 2× working concentrations. Next, half of the medium (40 µL) was removed from each well, and 40 µL of the drug compound/BMM titrations (final 5, 2.5, 1.25, 0.625, and 0.3125 µM) and a 0.02% DMSO control (final 0.01%) were gently added in triplicate wells (
Drug Compound Effect Scoring Method for MCTS
A novel multiparametric scoring method was developed and used to determine and rank the anticancer effect effects of each drug compound screened in this work. First, the averages and standard deviations of the control samples in growth, invasion, viability, and apoptosis assays were calculated. Next, the standard deviations of the control samples were multiplied by 3, 6, and 9 to provide thresholds for ranking the effects of each drug. If the measured results of MCTS diameter, invasion area,
Results and Discussion
3D Multicellular Tumor Spheroid Growth Inhibition Results
Fourteen drug compounds were screened to determine their growth inhibitory effects on the U87MG MCTS.
Figure 2a
contained example bright-field images acquired over the duration of the assay for the control and compound 8 treatment. The increase in MCTS size for the control and growth inhibition of compound 8 can be clearly observed over the 9-day assay. The MCTS diameters for each drug treatment were compared with the control MCTS diameter of 603 ± 7 µm, and each drug treatment at 5 µM was plotted with respect to time and shown in
Figure 2b
. The results demonstrated that compounds 1, 6, 9, and 10 had no inhibitory effects on growth and produced MCTS of approximately 600 µm in size. In contrast, compounds 3, 4, 5, 12, 13, and 14 had immediate growth inhibitory effects on the MCTS, thus limiting the size to approximately 350 µm. Interestingly, compounds 2, 7, and 8 displayed a delayed inhibitory effect, in which the MCTS grew until 69 h posttreatment, and were followed by a reduction in MCTS diameter. Similarly, MCTS treated with compound 11 also displayed a delayed inhibitory effect, in which the MCTS appeared to grow until 114 h posttreatment, and then the diameters reduced. Time-course and endpoint plots for all the drug concentrations are displayed in
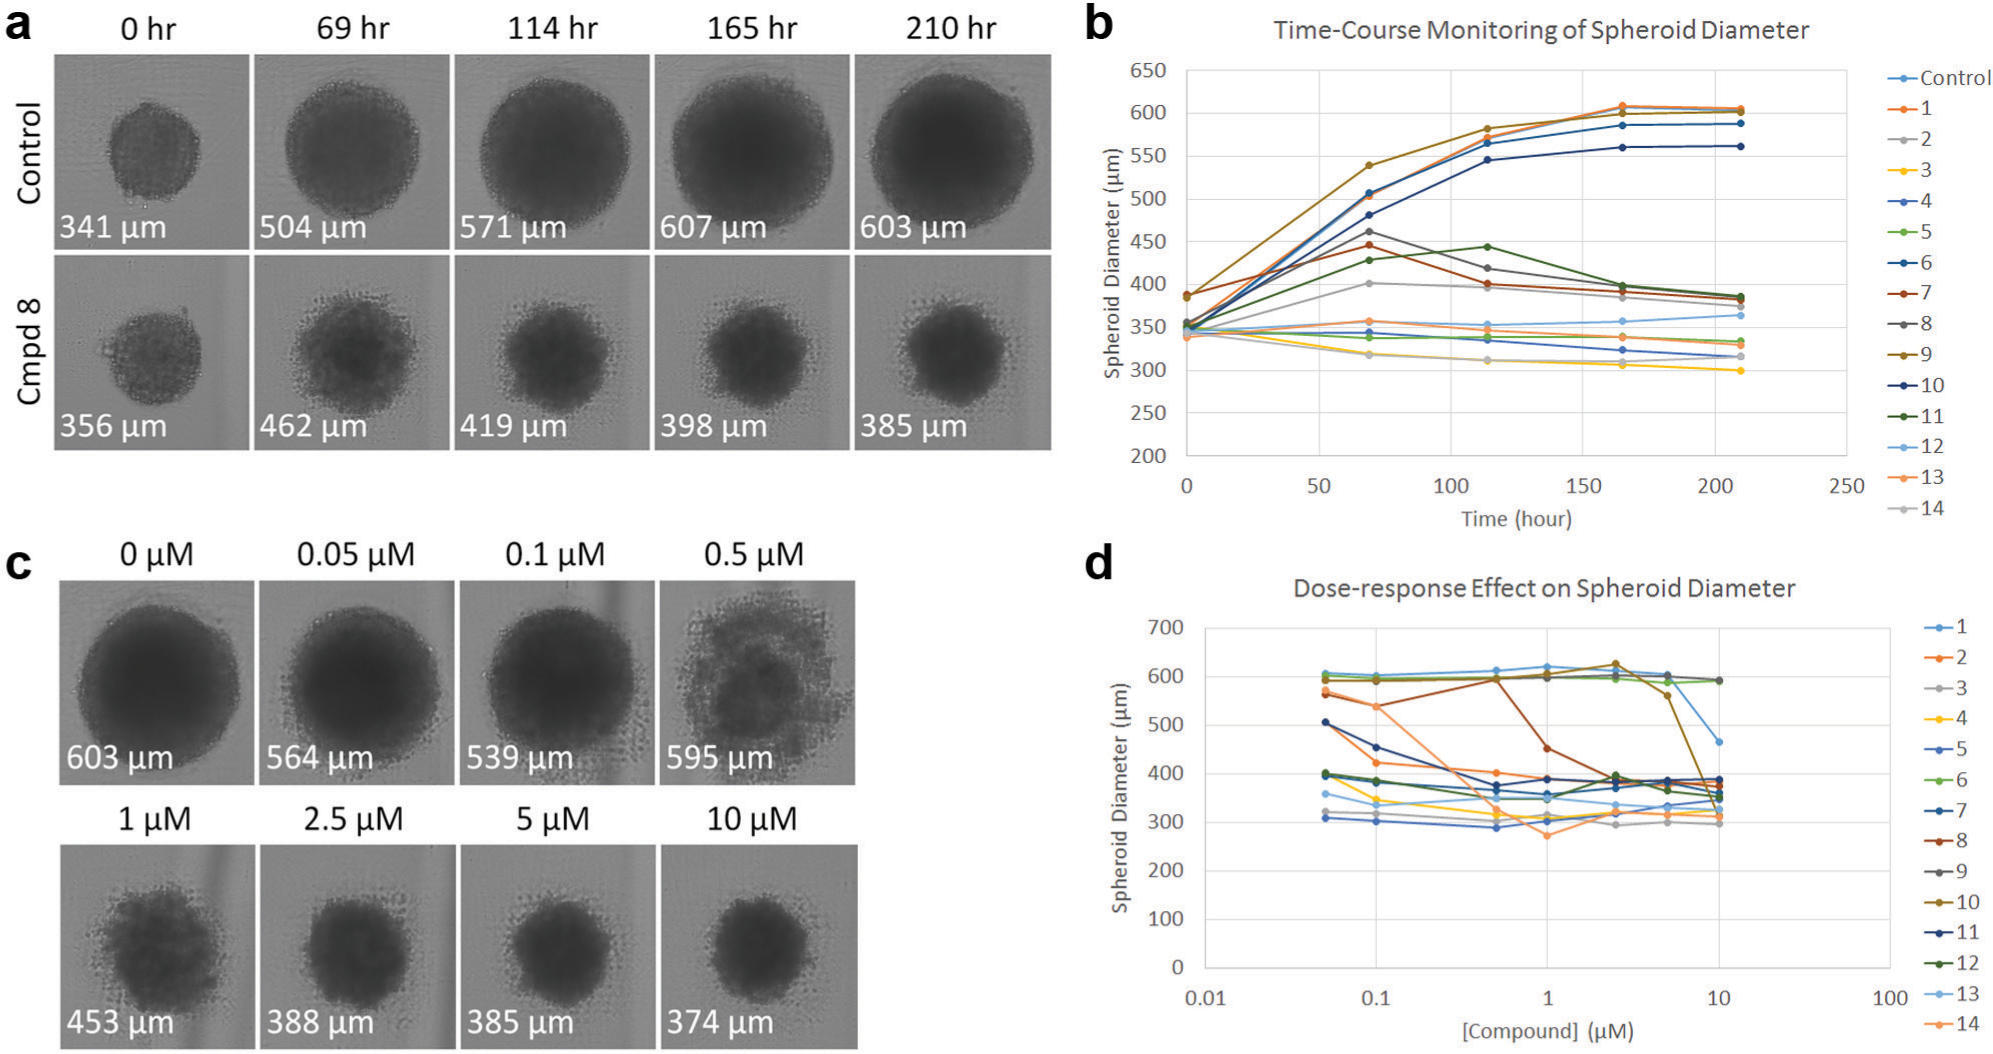
Time-course bright-field images of U87MG multicellular tumor spheroid (MCTS) growth inhibition for the control and compound 8 treatment. (
Endpoint graphs of U87MG multicellular tumor spheroid (MCTS) treated with the 14 compounds at 5 µM for (
Bright-field images of the dose-dependent growth inhibition of compound 8 are displayed in
Figure 2c
. Interestingly, the morphology of the MCTS changed from a tight and dark feature to having a loose aggregate morphology at 0.5 µM. Routine MCTS morphologies were proposed by Vinci et al. in a modified model of the Ivascu classification of MCTS.1,27 The MCTS appeared to have a layer of lighter-intensity cells surrounding the darker MCTS core, which could be due to the treatment inducing shedding of the outer layer of cells from the spheroid. Further investigation into the time-course bright-field images of compound 8 at different concentrations showed that the shedding or the formation of the layer of cells surrounding the spheroid began to occur at day 3 only for 0.5 µM (
The ability to capture and analyze changes in MCTS diameters over time is highly important for characterizing the effects of potential anticancer drugs. Kinetic measurements can provide insights into the rate of drug inhibitory effects. In addition, the high-throughput method can screen numerous test conditions simultaneously and easily generate dose-response results at different time points.
3D MCTS Invasion Results
The 14 drug compounds were screened to determine their invasion inhibitory effects on the U87MG MCTS. In
Figure 4a
, bright-field images of control and MCTS treated with compound 8 in BMM gel are displayed with and without a pseudo green fill color. The pseudo green fill color in the Celigo software improves the visualization of the invasion area by filling the measured area with a transparent green color. The control MCTS invasion area was 757,984 ± 57,701 µm2, and each drug treatment at 5 µM was plotted with respect to time shown in
Figure 4b
. The results demonstrated that compounds 1, 6, 9, 10, and 12 have limited invasion inhibitory properties and produced an MCTS invasion area of approximately 600,000 µm2. In contrast, compounds 2, 3, 4, 5, 7, 8, 11, 13, and 14 showed immediate invasion inhibitory properties and limited the MCTS invasion area to approximately 180,000 µm2. Time-course and endpoint plots for all the drug concentrations are reported in
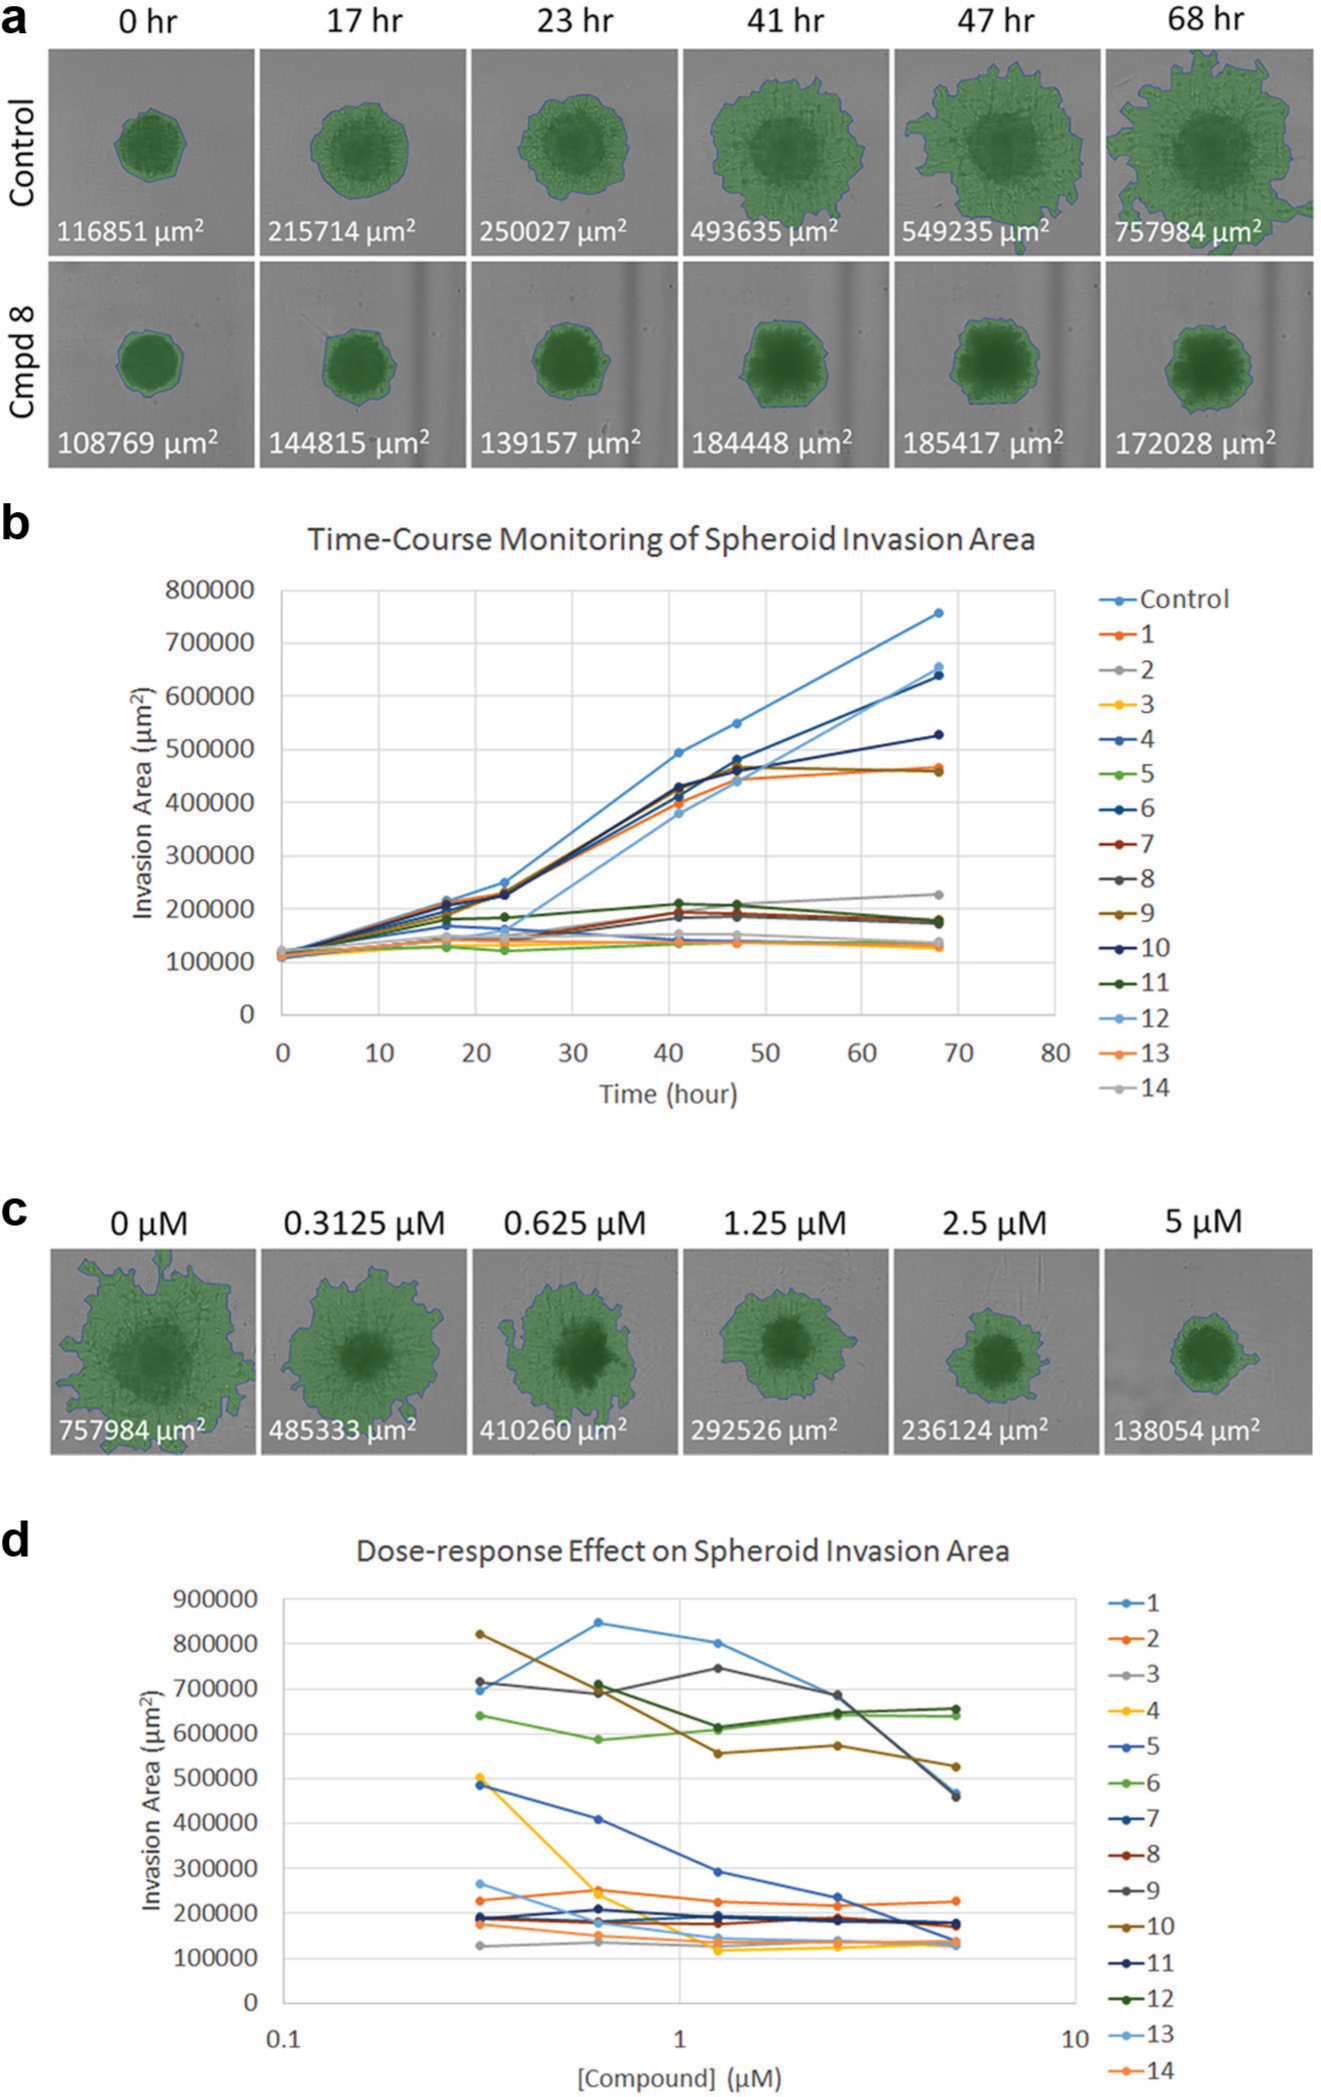
Time-course bright-field images of U87MG multicellular tumor spheroid (MCTS) invasion assay for the control and compound 8 treatment. (
Bright-field images of compound 5 dose-dependent inhibition of MCTS invasion area are displayed in Figure 4c . The previously described pseudo green fill visualization tool showed the dose-dependent invasion area inhibition induced by compound 5. The invasion dose-response plot is displayed in Figure 4d . The results demonstrated that compounds 2, 3, 7, 8, 11, 13, and 14 produced a consistent reduction in invasion area for all the tested concentrations (5, 2.5, 1.25, 0.625, and 0.3125 µM), whereas compounds 6 and 12 displayed no invasion inhibitory properties. Compounds 1, 4, 5, 9, and 10 displayed varying degrees of invasive inhibition, where compounds 1, 9, and 10 required a much higher concentration compared with compounds 4 and 5 to induce invasion area inhibition.
Although growth retardation and reduction of MCTS size would be an obvious and clear goal within this screen, a further important activity of any potential drug candidate is its ability to prevent tumor cell invasion into healthy tissue. In this experiment, it was clearly demonstrated that a number of the drug compounds have dose- and time-dependent invasion inhibitory properties. Understanding the ability of drug compounds to not only inhibit cell growth but also tumor cell invasion into healthy tissue can allow a more appropriate selection of potential anticancer drug candidates.
MCTS Viability and Apoptosis
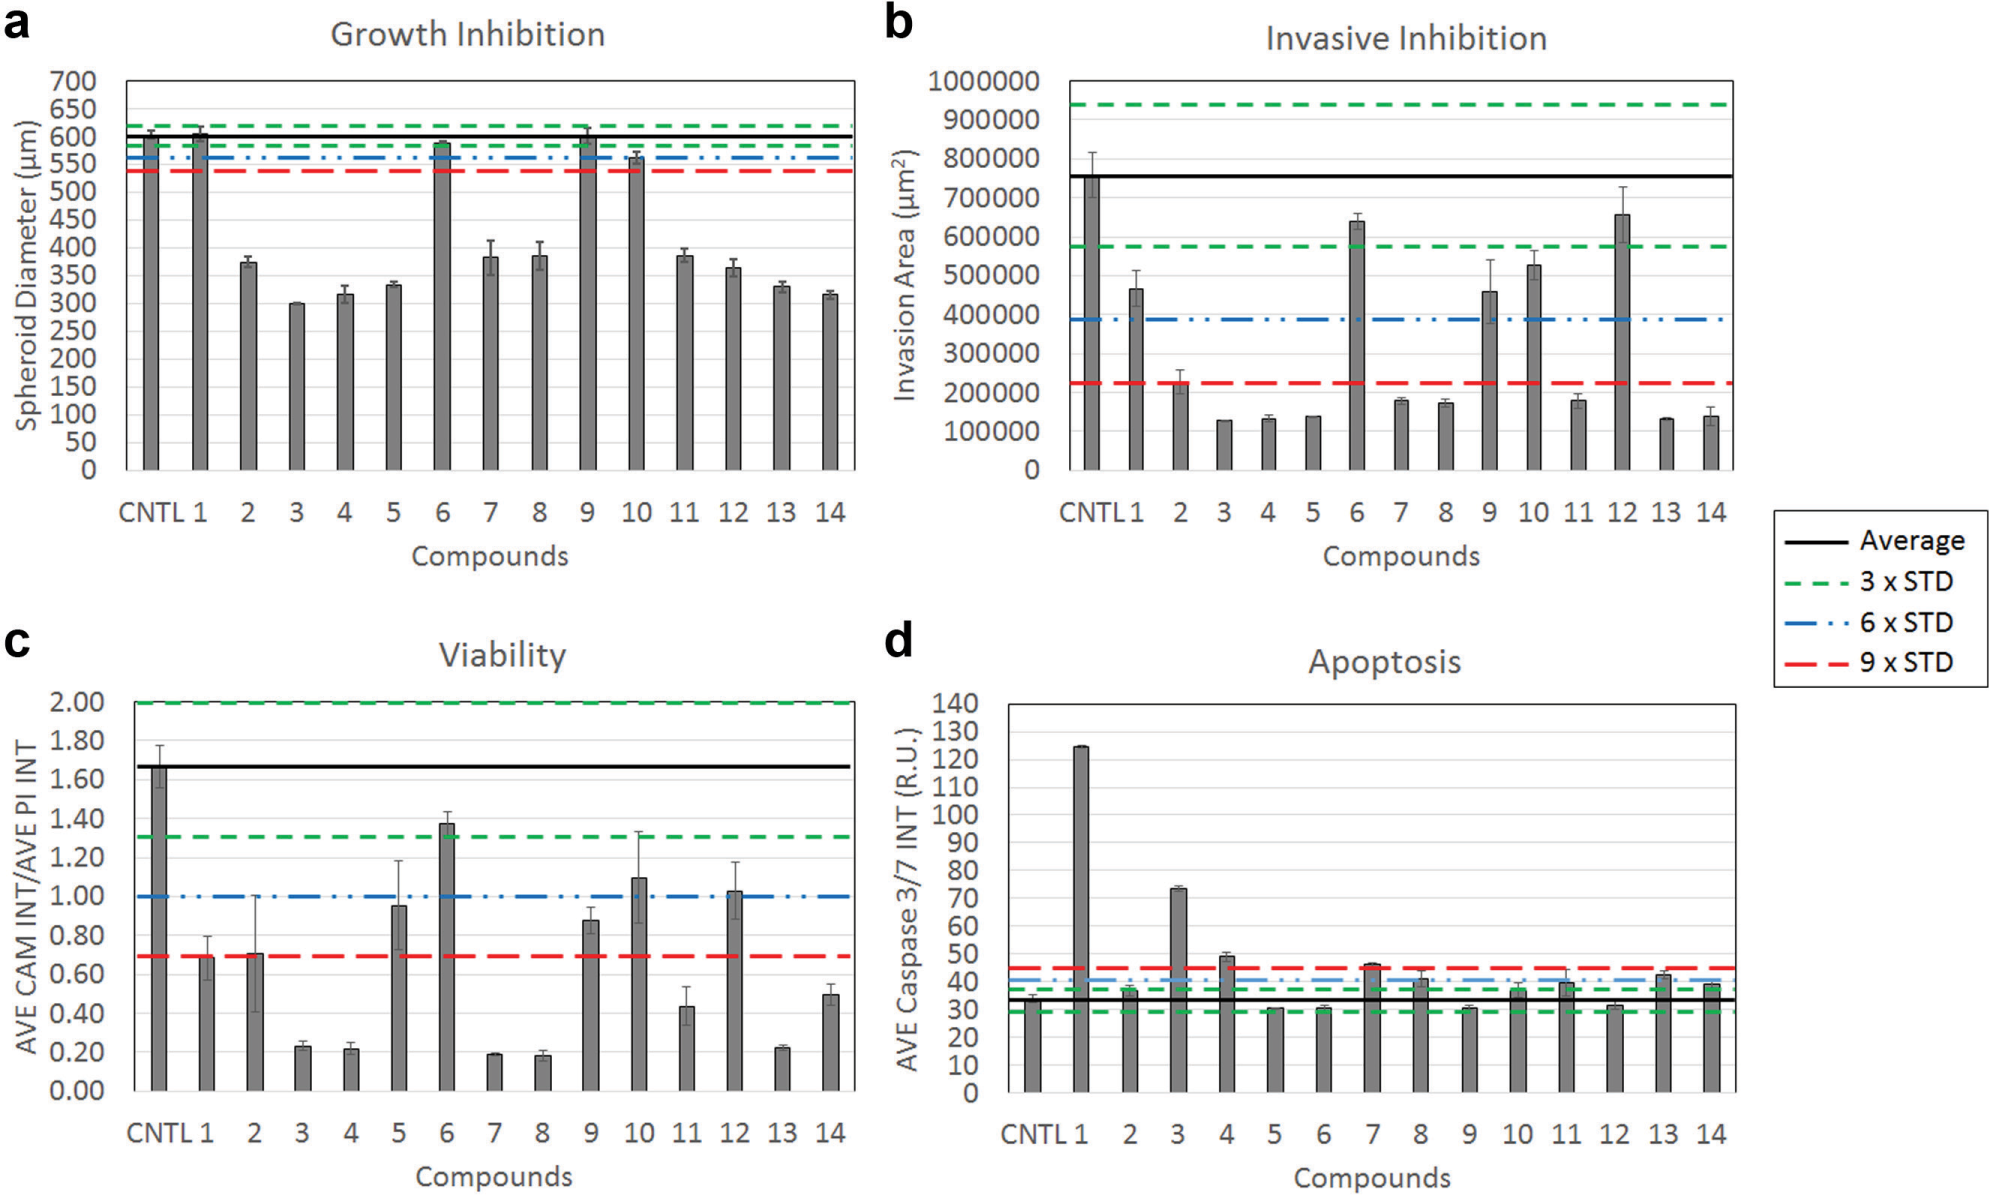
The drug-treated MCTS from the first duplicate plate were stained with calcein AM and PI on day 9 (~210 h posttreatment). The calculated
The drug-treated MCTS from the second duplicate plate were also stained with caspase 3/7 on day 9 (~210 h posttreatment). The measured average caspase 3/7 fluorescent intensity results ( Fig. 3d ) demonstrated drugs 1 and 3 induced a high level of apoptosis in U87MG MCTS, whereas drugs 2, 4, 5, 6, 7, 8, 9, 10, 11, 12, 13, and 14 did not induce or induced a low level of apoptosis within the MCTS. The control average caspase 3/7 fluorescent intensity was approximately 34.0 ± 1.3 RU.
Drug Compound Multiparametric Ranking Score Results
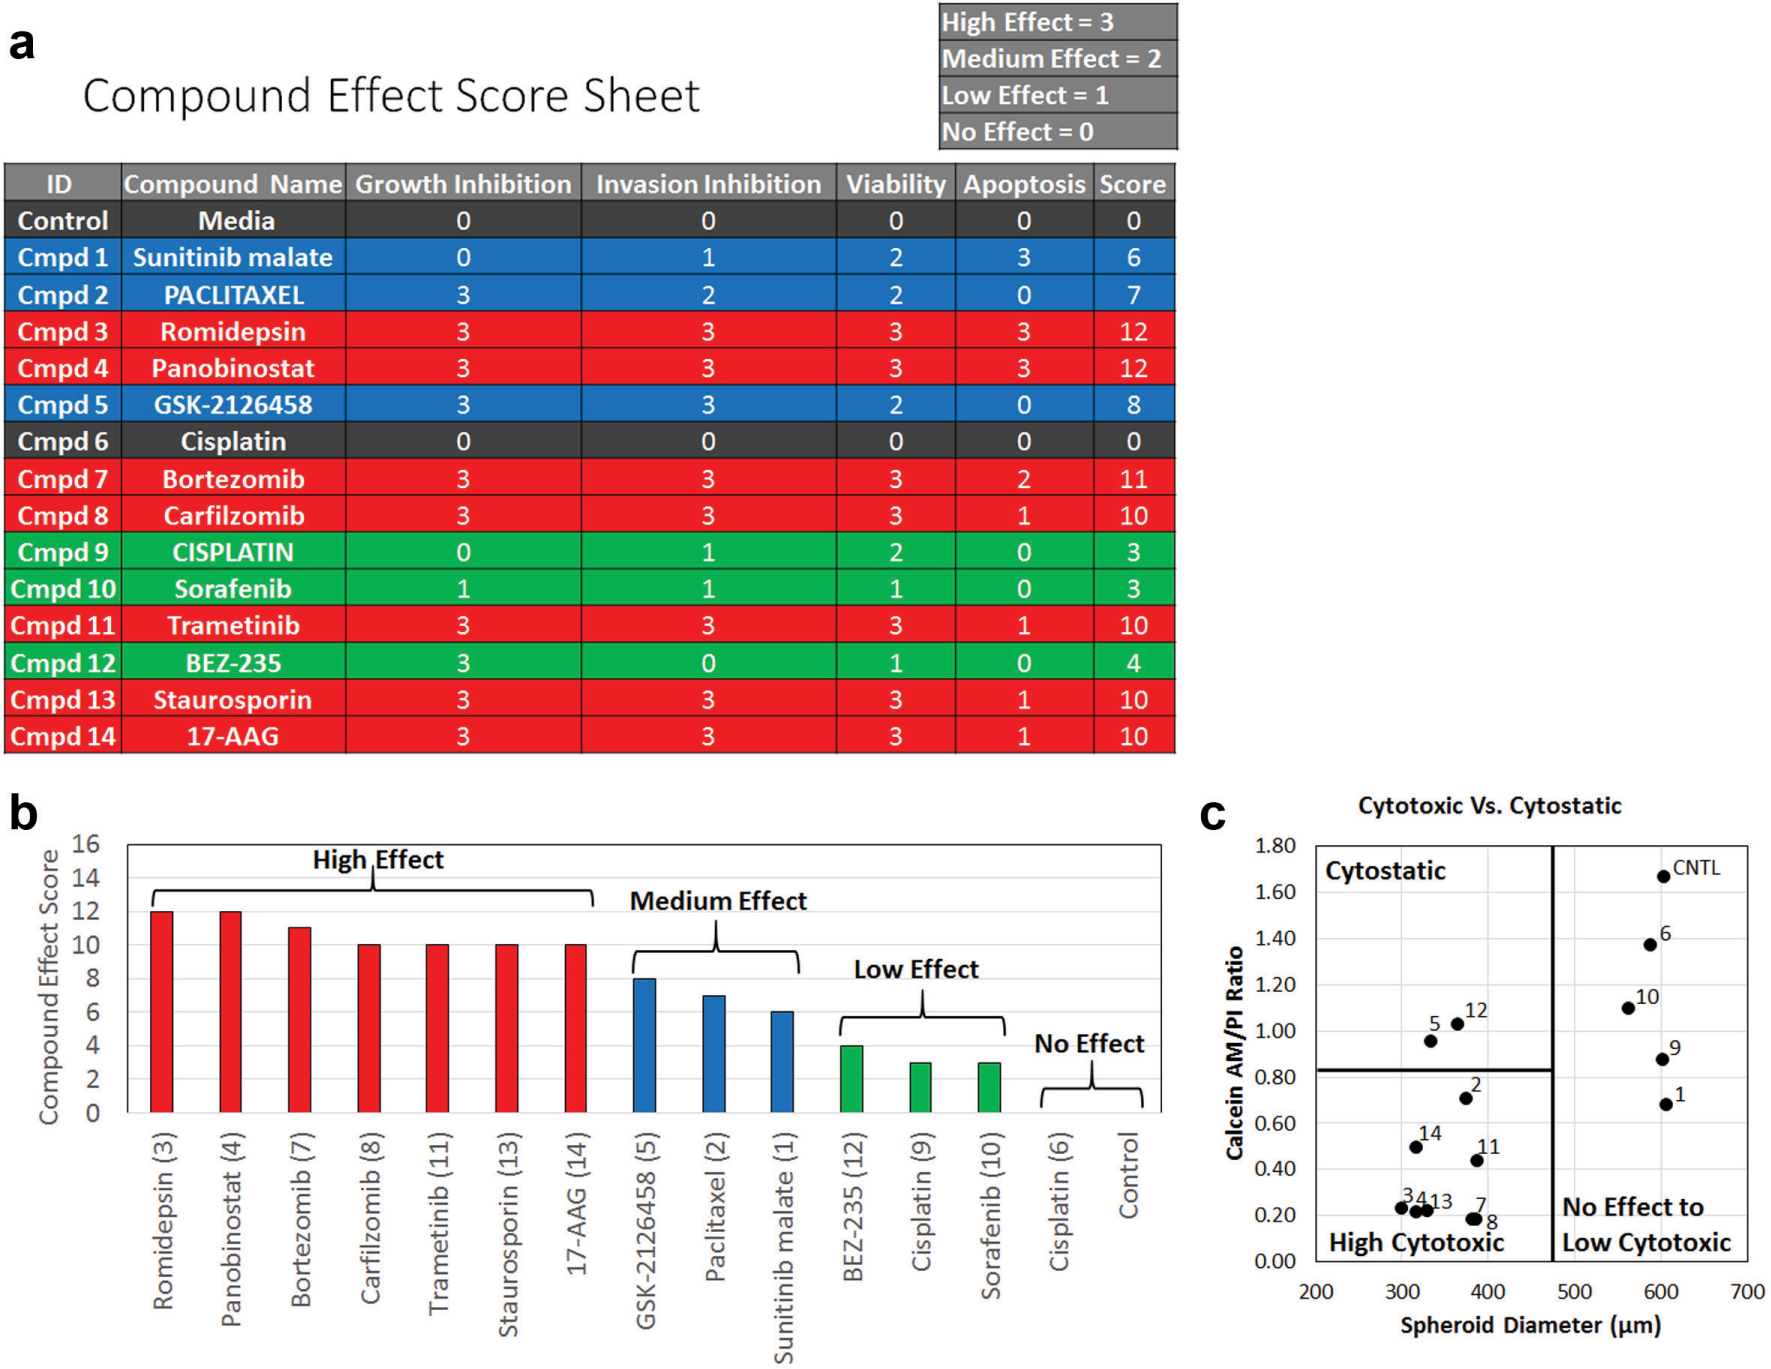
The effects of the screened drug compounds were ranked by the sum of assigned values depending on the calculated standard deviations. Using the calculated 3, 6, and 9× standard deviation ( Fig. 3 ), each drug compound was scored, ranked, and grouped by the level of its effects on the U87MG MCTS ( Fig. 5a ). Scores greater than or equal to 10 indicated a high effect (drugs 3, 4, 7, 8, 11, 13, and 14), scores ranging from 6 to 8 indicated a medium effect (drugs 5, 2, and 1), scores ranging from 1 to 5 indicated a low effect (drugs 12, 9, and 10), and, finally, a score of 0 indicated no effect (drug 6 and control). A table of drug-ranking results is demonstrated in Figure 5b , in which drugs 3 (romidepsin) and 4 (panobinostat) showed the highest cumulative ranking score in the U87MG MCTS model, whereas interestingly, drug 6 (cisplatin form B) produced a low ranking score and was deemed to have no effect. In addition, the calcein AM/PI ratios were plotted with respect to the spheroid diameters ( Fig. 5c ), which showed drug compounds that were highly cytotoxic (lower left), cytostatic (upper left), and had low to no cytotoxic effect (right). This graph allowed a simple overview of what effects the drug compounds have induced.
(
The bright-field and fluorescent images of each ranked compound group are displayed in Figure 6 . For the highest ranked compound group ( Fig. 6a ), the inhibition of growth and invasion area is demonstrated in the bright-field images. In the viability assay, the MCTS were mostly PI positive and displayed little or no calcein AM fluorescence. In the apoptosis assay, very few MCTS displayed caspase 3/7 fluorescence. For the medium-ranked compound group ( Fig. 6b ), both the MCTS growth and invasion were not fully inhibited. In addition, higher calcein AM and lower PI fluorescent intensities were measured. With the exception of compound 1, little or no caspase 3/7 fluorescence was detected in this group. For the lower-ranked compound group ( Fig. 6c ), both the MCTS growth and invasion were not inhibited. In addition, the MCTS were mostly calcein AM positive and displayed what appeared to be a small necrotic core, as indicated with PI staining. Finally, only a small amount of caspase 3/7 fluorescence was measured in the MCTS in this group. Only compound 6 (cisplatin form A) displayed no effect on the spheroids ( Fig. 6d ), and the results were highly comparable with the control in growth and invasion inhibition, viability, and apoptosis assays. It is important to note that previous literatures have shown that sunitinib malate was anti-invasive to human glioblastoma. 11 In addition, paclitaxel and 17-AAG drug compounds can induce apoptosis, cytotoxicity, and growth inhibition in glioblastoma.2,12,13 These previously described results were comparable with the screening results in this work.
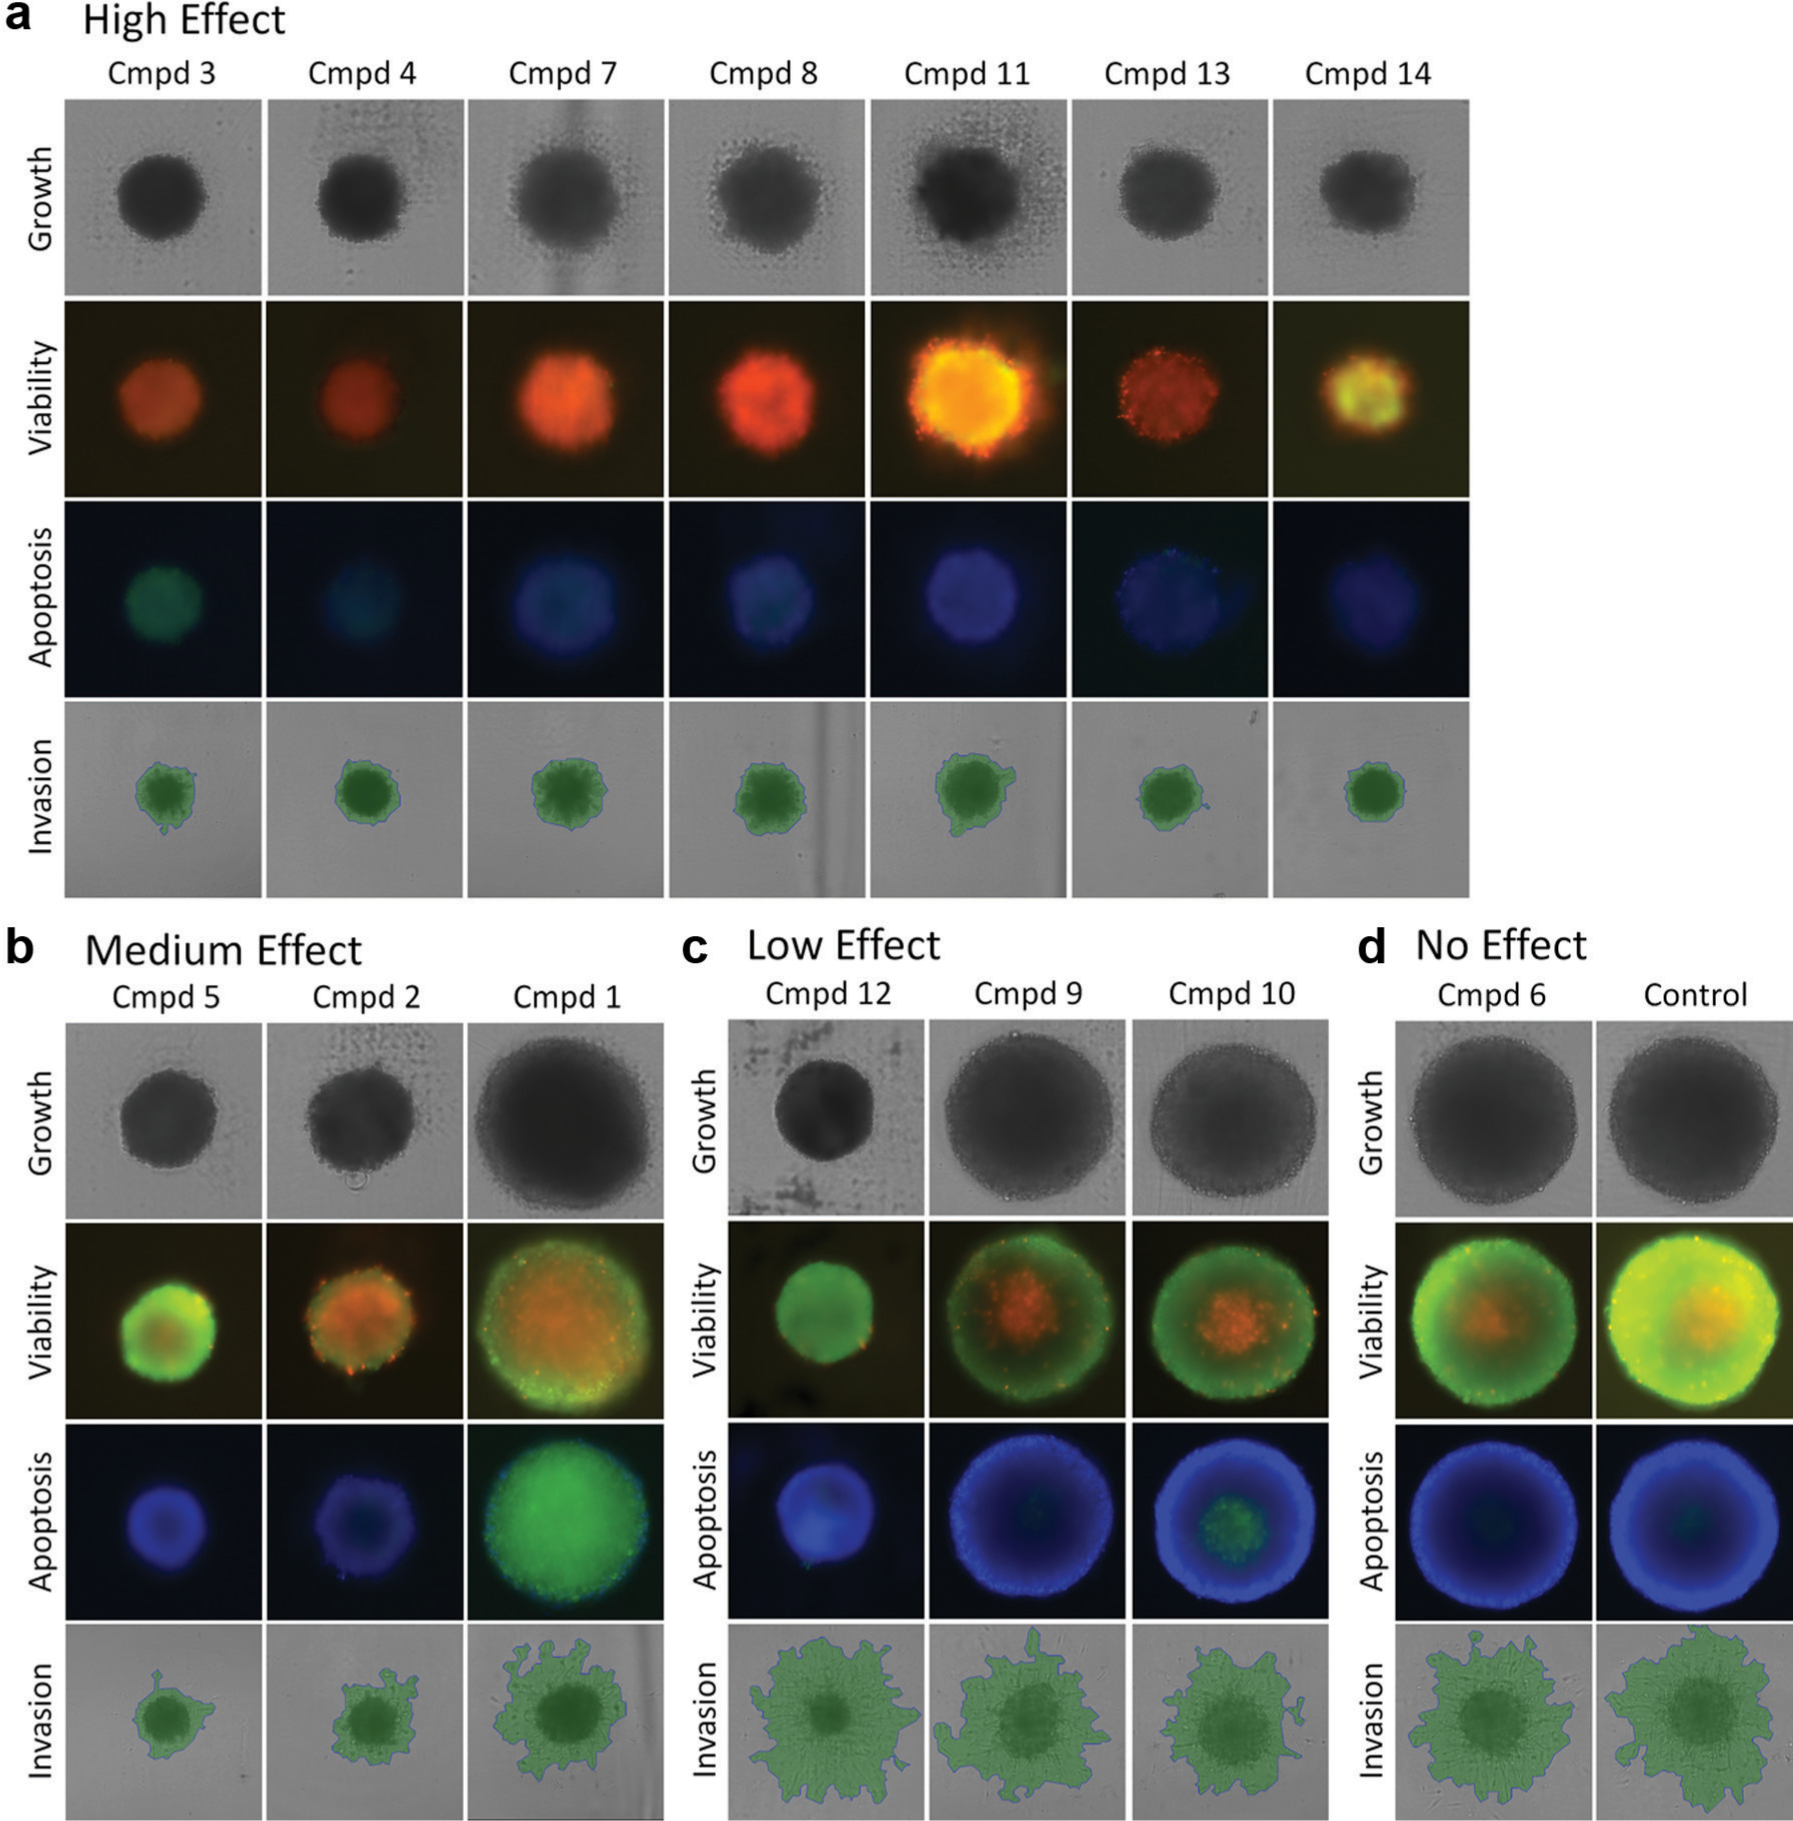
Bright-field and fluorescent images of multicellular tumor spheroids grouped by high, medium, low, and no effect. (
The multiparametric readouts described in this report can be used not only to triage the potential drug candidates but also to delineate particular drug functions and pathways involved in their activities. In
Figure 6
(or
These data provide valuable information that can be used to decide what drugs should continue through the drug discovery pathway. In addition, the information may provide evidence that can be used to derive potential clinical treatments of cancers associated with this particular MCTS model. For example, compounds 3 and 4 may appear as the ideal drug candidates initially; however, with the increasing use of combination therapies and immuno-oncology approaches, one may consider compounds 5 and even 12 as potential candidates to continue further down the drug discovery pathway.
Footnotes
Acknowledgements
The authors would like to thank Dr. Steven Titus at the High Content Imaging and Discovery at the National Center for Advancing Translational Sciences for kindly donating 14 cancer drug compounds for this work.
Supplementary material is available online with this article.
Declaration of Conflicting Interests
The authors declared the following potential conflicts of interest with respect to the research, authorship, and/or publication of this article: All of the authors declare competing financial interests, and the work performed in this article is for reporting on a novel high-throughput screening and scoring method for 3D MCTS on the image cytometry technology of Nexcelom Bioscience, LLC. The proposed drug effectiveness scoring method can improve the efficiency and speed of 3D model-based HT screening assays for identifying more highly qualified cancer drug candidates.
Funding
The authors received no financial support for the research, authorship, and/or publication of this article.
References
Supplementary Material
Please find the following supplemental material available below.
For Open Access articles published under a Creative Commons License, all supplemental material carries the same license as the article it is associated with.
For non-Open Access articles published, all supplemental material carries a non-exclusive license, and permission requests for re-use of supplemental material or any part of supplemental material shall be sent directly to the copyright owner as specified in the copyright notice associated with the article.