
Abstract
Analysis of drug–target residence times during drug development can result in improved efficacy, increased therapeutic window, and reduced side effects. Residence time can be estimated as the reciprocal of the dissociation rate (koff) of an inhibitor from its target. The traditional methods for measuring koff require synthesis of labeled ligands or low-throughput label-free methods. To provide an alternative that is better suited to an automated high-throughput screening (HTS) environment, we adapted a classic “jump dilution” catalytic assay method for determination of koff values for kinase inhibitor drugs. We used the Transcreener ADP2 Kinase assay as a universal, homogenous method to monitor the recovery of kinase activity as the drugs dissociated from preformed inhibitor–kinase complexes. We measured residence times for several drugs that bind the epidermal growth factor receptor (EGFR), ABL1, and Aurora kinases and found that the rank ordering of inhibitor koff values correlated with literature values determined using ligand binding assays. Moreover, very similar results were obtained using the Transcreener assay with fluorescence polarization (FP), fluorescence intensity (FI), and time-resolved Förster resonance energy transfer (TR-FRET) detection modes. This HTS-compatible, generic assay method should facilitate the use of residence time as a parameter for compound prioritization and optimization early in kinase drug discovery programs.
Introduction
Historically, high-throughput small-molecule discovery programs have been focused on identifying compounds with high affinity and specificity for the target protein. Despite extensive optimization of these parameters, more than 90% of small-molecule drugs fail in the clinic due to unfavorable pharmacodynamic properties. 1 This has driven efforts to identify additional in vitro parameters that affect drug pharmacodynamics and efficacy in vivo. However, there is a fundamental difference between drug–target interactions in a closed (in vitro) system compared with in an open (in vivo) system. In in vitro systems, the target, its substrates, and the drug are present at fixed concentrations, whereas in vivo, the concentrations of the drug, the target, and its substrates can vary considerably spatiotemporally. Thus, measurements of equilibrium binding, such as Kd or Ki/IC50, reflect the concentration of the drug–target complex and thus potency in vitro, but they will not accurately predict in vivo pharmacodynamics.2,3
Drug–target residence time is the length of time that a drug remains bound to its target; it is defined mathematically as the reciprocal of the dissociation rate (1/koff). 4 Retrospective studies have indicated that drugs with longer residence times have increased efficacy and fewer side effects because they occupy a higher fraction of their target over a longer period of time, even after clearance from systemic circulation.5,6 Residence time has become a key parameter for hit prioritization and lead optimization in many small-molecule drug discovery programs.
Residence times can vary from less than a minute to several days, with covalently bound inhibitors representing the extreme, and it can affect efficacy in different ways. For example, difference in residence times is the primary mechanism underlying the isozyme selectivity of cyclooxygenase inhibitors and the steroid 5α-reductase inhibitor, finasteride. In the case of darunav, the most recently approved HIV proteinase inhibitor, a residence time of more than a week—well beyond its serum half-life of 15 h—is believed to underlie its greater barrier to the development of resistance compared with earlier drugs with residence times of 1–2 h. 5
More durable target engagement may be especially beneficial for anticancer drugs. For example, second-generation receptor tyrosine kinase inhibitors that bind covalently are showing promising results in the treatment of non-small-cell lung cancer driven by activating epidermal growth factor receptor (EGFR) mutations and HER-2-positive breast cancer. 7 Ibrutinib, a covalent inhibitor of Bruton’s tyrosine kinase (BTK), has proven highly effective in treating B-cell malignancies, including mantle cell lymphoma and chronic lymphocytic leukemia. 7 Note that covalent inhibitors can bind reversibly, and cysteine reactive, reversible inhibitors have been rationally designed for BTK and fibroblast growth factor receptor (FGFR) with a continuum of residence times from a few hours to several days. 8
However, in cases where there is a fine balance between target inhibition and toxicity, shorter residence times may be more desirable. For example, some ion channel blockers are designed to rapidly dissociate after blocking the open state of the channel to avoid toxicity. 6 And long residence time was thought to contribute to the undesired side effects of the antipsychotic drug haloperidol, a dopamine D2 receptor antagonist. 3
The most common approach for determining drug–target residence times is the measurement of koff using ligand binding or displacement assays. These can be classified broadly as either labeled ligand or label-free methods. 9 Ligand dissociation rates can be measured directly or calculated from measurements of the Kd and association rate (kon) (Kd = koff/kon).
Of the labeled ligand methods, radioligand binding assays are very robust; however, they require production of a radiolabeled analog of the drug, which can be quite costly, and the associated regulatory and disposal requirements make these assays undesirable for many labs. Fluorescent ligands can be used similarly, if they are available. 9 In either case, the most common approach is to incubate the target protein with saturating amounts of unlabeled drug to ensure drug–target complex formation, and then rapidly remove the free drug using filtration or size exclusion chromatography and monitor the rate of displacement by a labeled ligand, either following isolation of the complex or in solution using fluorescence polarization (FP). The rate of binding for the labeled ligand is equal to koff for the drug, assuming that dissociation of the drug is the rate-limiting event. Methods for adapting fluorescent ligand displacement assays for high-throughput screening (HTS) with a time-resolved Förster resonance energy transfer (TR-FRET) readout were recently described for members of key target classes, including kinases, G protein–coupled receptors (GPCRs), and bromodomain interactions. 10
Although some of these ligand binding methods are high throughput, they require the development of different reagents for different drugs and/or kinases. For example, synthesis of a radiolabeled analog, conjugation with a fluorophore, or development of an alternative fluorescent ligand is required for each drug. Moreover, the TR-FRET-based assays require labeling of the kinase with a lanthanide chelate, which could alter its binding properties.
Label-free binding assays, such as surface plasmon resonance (SPR), biolayer interferometry, and resonant acoustic profiling, are being used increasingly to measure drug residence times. For SPR, the most commonly used method, the target is immobilized on a coated gold chip. 11 Although this method is very sensitive, immobilization of the target protein on the sensor surface constrains its conformational flexibility and may alter and/or mask some binding sites. Usually, only a fraction of the proteins retain their enzymatic activity, which can result in a biased determination of binding stoichiometries. In addition, SPR is relatively low throughput.
For enzyme drug targets, catalytic assays provide an alternative experimental approach for measuring drug–target residence times, as the activity of an enzyme is inversely proportional to its fractional occupancy with an inhibitor. In the most common method, known as “jump dilution,” the target enzyme is first incubated with the drug at saturating concentrations to allow the formation of the target–drug complex. 4 The complex is then diluted sufficiently to drive dissociation of the complex, and a catalytic assay is used to continuously monitor the recovery of enzyme activity as the inhibitor dissociates over time. Fitting the progress curve to an integrated rate equation allows determination of the koff, and the residence time is calculated as its inverse. 4
This activity-based approach does not require the use of labeled ligands or immobilized target proteins and can be used with native substrates at their physiological concentrations. Thus, it can be used without prior knowledge of inhibitor mechanism or whether inhibitors bind at the catalytic site or at allosteric sites and whether they are competitive with substrates. Moreover, it measures the dynamic interactions between an enzyme, its substrates, and its inhibitors during catalysis, and thus may reflect effects on inhibitor binding that would not be observed in simple ligand binding assays.
Enzyme activity assays are widely used for HTS, dose response, and so forth, and the reagents and instrumentation for performing them are readily available for key target families like kinases, proteases, and phosphodiesterases. Therefore, an activity-based approach such as the jump dilution method provides a way to incorporate residence time measurements early in discovery. For example, phosphopeptide detection assays with homogenous readouts such as FI and TR-FRET have been applied for measuring kinase inhibitor residence times for EGFR and Aurora A.12,13 To facilitate this approach, we developed a simple protocol for using the Transcreener ADP2 Kinase assay to determine drug–target residence times in jump dilution mode using EGFR, ABL1, and Aurora kinases as examples. Transcreener is an HTS-compatible competitive immunoassay format that enables homogenous detection of ADP and other nucleotides with FP, fluorescence intensity (FI), or TR-FRET readouts.14,15 The assay format is well suited for the jump dilution method because the detection reagents can be added directly to kinase reactions to monitor recovery of activity. Moreover, detection of ADP, the invariant product of kinase reactions, allows use of Transcreener with any kinase family member regardless of its acceptor substrate; thus, the method should be applicable to most kinases. The Transcreener-based jump dilution method provides a streamlined approach for prioritizing hits based on residence time using existing HTS infrastructure.
Materials and Methods
Enzymes, Substrates, and Reagents
Full-length, recombinant human ABL1 protein with an N-terminal His tag (accession number NP_005148.2) was obtained from ThermoFisher Scientific (Waltham, MA). Human EGFR recombinant protein (residues 69–1210; accession number NP_005219.2) with an N-terminal GST tag was obtained from Carna Biosciences (Kobe, Japan). Aurora B-INCENP kinase (Uniprot IDs Q6DE08 and O13024) was obtained from Proteros (Planegg, Germany). Aurora C, PV3856 (Gene ID 10488) was obtained from ThermoFisher Scientific. Abltide (KKGEAIYAAPFA), myelin basic protein (MBP), and EGFR tyrosine kinase substrate (ADEYLIPQQ) were obtained from Anaspec (Freemont, CA). The Transcreener ADP2 FP, TR-FRET, and FI kinase assays were obtained from BellBrook Labs (Madison, WI). Imatinib, dasatinib, ponatinib, nilotinib, lapatinib, gefitinib, erlotinib, and afatinib were obtained from Selleckchem (Houston, TX).
Instrumentation and Analysis
FP and FI assays were performed in black Corning 384-well, round-bottom, low-volume polystyrene nonbinding surface microplates (Corning, NY, catalog number 4514). TR-FRET assays were performed in white Corning 384-well, round-bottom, low-volume polystyrene nonbinding surface microplates (Corning, catalog number 4513). Mixing after additions was performed by orbital shaking for 1 min. FP measurements were performed on a PHERAstar Plus (BMG Labtech, Ortenberg, Germany) reader using 590 nm excitation and 670 emission settings. The free tracer reference was set to 20 mP, and the buffer (with or without antibody) was used as the buffer blank for both the sample and free tracer reference wells. FI measurements were performed on a Tecan M1000 (Tecan, Durham, NC) reader using 580 nm excitation and 620 nm emission (10 nm bandwidth) settings. TR-FRET measurements were performed on an Envision (PerkinElmer, Waltham, MA) reader using 320 nm excitation and 615 or 670 nm emission settings. Data were analyzed and graphed using GraphPad Prism (GraphPad Software, San Diego, CA). ΔmP values are the difference between the mP values with or without enzymes, unless otherwise indicated. TR-FRET ratios were calculated by dividing the raw value from 670 nm emission over raw values from 620 nm emission.
Kinase Assays
Kinase reactions were run in 50 mM Tris-HCl (pH 7.5), 5 mM MgCl2, and 0.01% Brij-35; 7.5 µL of serially titrated enzyme reactions was initiated by addition of 2.5 µL of 10 µM peptide acceptor substrate and ATP. ABL1 reactions contained 10 µM Abltide and 5 µM ATP. EGFR reactions contained 10 µM EGFR tyrosine kinase substrate and 10 µM ATP. Aurora kinase reactions contained 10 µM MBP and 1 µM ATP. ADP detection mixture (10 µL), consisting of ADP2 antibody and tracer (see below for specific assay configurations), was added immediately to enzyme reactions. The concentrations of the detection reagents (antibody and tracer) were calibrated for each kinase to generate 80% of the maximal signal at 10% conversion of ATP to ADP. For FP assays, ADP-Alexa Fluor 633 tracer was present at a final concentration of 2 nM and antibodies were used at their optimal concentrations, as determined by the linear equation [Ab] = 1.08 [ATP] + 1. For FI assays, the ADP-Alexa Fluor 594 tracer was present at a final concentration of 4 nM and antibodies were present at [Ab] = 0.93 [ATP] + 0.7. For TR-FRET assays, Tb–antibody conjugate was present at 4 nM and the Alexa Fluor 647 tracer was used at [T] = 1.9 ATP + 7.8. Reactions were run at room temperature and plates were read periodically for 4 h to follow kinase reaction progress. EC80 values were determined from enzyme titrations and used for subsequent initial velocity reactions. EC80 values were calculated using the EC50 and hillslope values, calculated from fitting the equilibrium binding data to a variable slope sigmoidal dose–response curve using the equation EC80 = (80/(100 – 80))1/hillslope)*EC50.
Standard curves mimicking enzymatic conversion of ATP to ADP were used to convert raw signals to ADP formation; mock reactions contained all reaction components except kinase enzymes. For example, for a 10 µM ATP standard curve representing 0%, 1.0%, 2.5%, 5.0%, 7.5%, 10.0%, 12.5%, 15.0%, 25%, 50%, 75%, and 100% conversion of the substrate, the 0% reaction contains 10 µM ATP, the 10% reaction contains 1 µM ADP + 9 µM ATP, the 100% reaction contains 10 µM ADP, and so forth.
For dose–response curves, inhibitors were tested at twofold dilutions starting at 1000 nM. Inhibitors were preincubated with kinases for 30 min at room temperature, and reactions were initiated by addition of a mix containing ATP and acceptor peptide, followed by Transcreener ADP2 Kinase assay detection reagents.
Jump Dilution Experiments
Enzyme-Inhibitor (E•I) complexes were allowed to form by preincubating kinases at 100 × EC80 with inhibitors at 10 × IC50 for 60 min at room temperature, in 10 μL volumes. For controls, kinases were incubated with DMSO. Following preincubation, 0.2 µL of E•I was diluted into 19.8 µL (100 × dilution) of kinase assays containing ATP, acceptor substrate, and ADP2 Kinase assay detection reagents in 384-well plates. Note that the inhibitors were present at 1/10 their IC50 values following dilution; therefore, once they dissociate, rebinding should be minimal ( ≤9%). Plates were mixed by orbital shaking and read every 2 min for 4 h. A standard curve was run under similar conditions.
Data Analysis for Residence Time Determinations
Dissociation rates were determined from the rate of activity recovery following dilution of E•I complexes into kinase activity assays. After converting the raw data to ADP formation, reaction progress curves were fit to an integrated rate equation: [P] = vst + (vi – vs) (1 – e–kobs t)/kobs, using GraphPad Prism (with K defined as 1/value of X at Ymax), where vi and vs are the initial (inhibited) and steady-state (uninhibited) kinase velocities following dilution, kobs is the apparent first-order rate constant for the transition from vi to vs, and t is time.2,4 Under the experimental conditions, in which there is minimal reformation of E•I, kobs is a reasonable estimate of koff; accordingly, residence times (1/koff) were derived directly from the integrated rate curves. 4 vi and vs were determined independently for each kinase and inhibitor using saturating inhibitor (100 × IC50) and DMSO, respectively.
Results and Discussion
Enzyme Titration and IC50 Determinations
We developed a standard protocol for jump dilution analysis with the Transcreener ADP2 Kinase assay using ABL1 kinase as a model. ABL1, in its constitutively activated form as a fusion with the BCR protein, is the target of the first approved kinase inhibitor drug, imatinib (Gleevec), for treatment of chronic myelogenous leukemia. It has been intensively studied, and several second-generation inhibitors developed to overcome acquired resistance to imantinib are readily available. 16
We used the Transcreener ADP2 assay in FP mode for the initial methods development, as we find that this format is generally the most robust and sensitive. All the Transcreener assays rely on competitive displacement of a fluorescent tracer from a highly selective ADP antibody; for the FP assay, displacement of the tracer is detected by a decrease in polarization due to increased rotational mobility. The assay is homogenous and in mix and read format, and importantly for this application, it can be used in a kinetic mode, that is, with the detection reagents present during the kinase enzymatic reaction.
To establish parameters for jump dilution experiments, we first determined the optimal ABL1 enzyme concentration for initial velocity reactions and performed dose–response measurements with imatinib and the more potent ABL1 inhibitors ponatinib, dasatinib, and nilotinib (
Fig. 1
). The ATP concentration was set at 5 μM as this is near the Km for ABL1. Titration of ABL1 showed a typical sigmoidal response in the Transcreener ADP2 Kinase assay from approximately 1 to 10 nM ABL1 (data not shown), with a shift of 175 mP at an EC80 of 2.8 nM
(
IC50 Values and Residence Times for Protein Kinase Inhibitor Drugs.
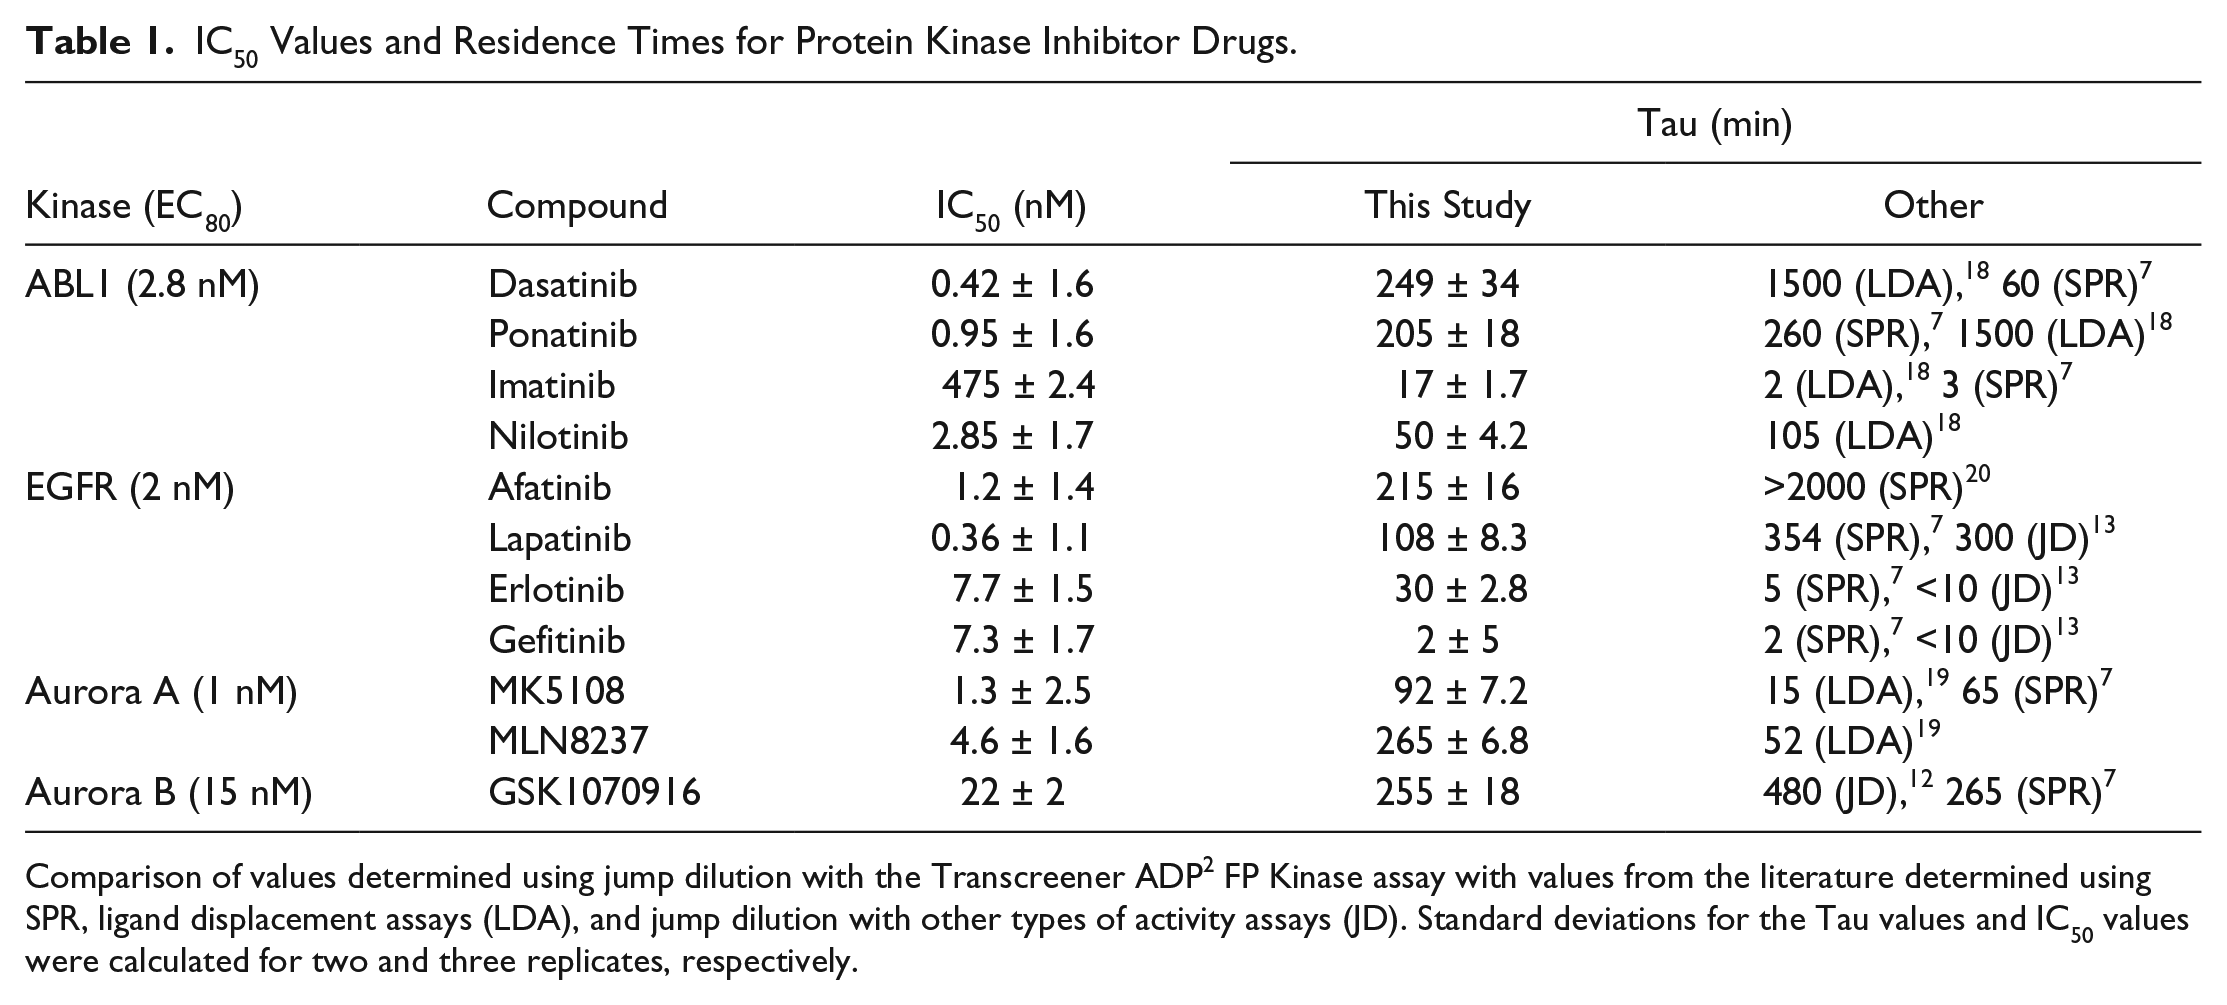
Comparison of values determined using jump dilution with the Transcreener ADP2 FP Kinase assay with values from the literature determined using SPR, ligand displacement assays (LDA), and jump dilution with other types of activity assays (JD). Standard deviations for the Tau values and IC50 values were calculated for two and three replicates, respectively.
Determination of vi and vs
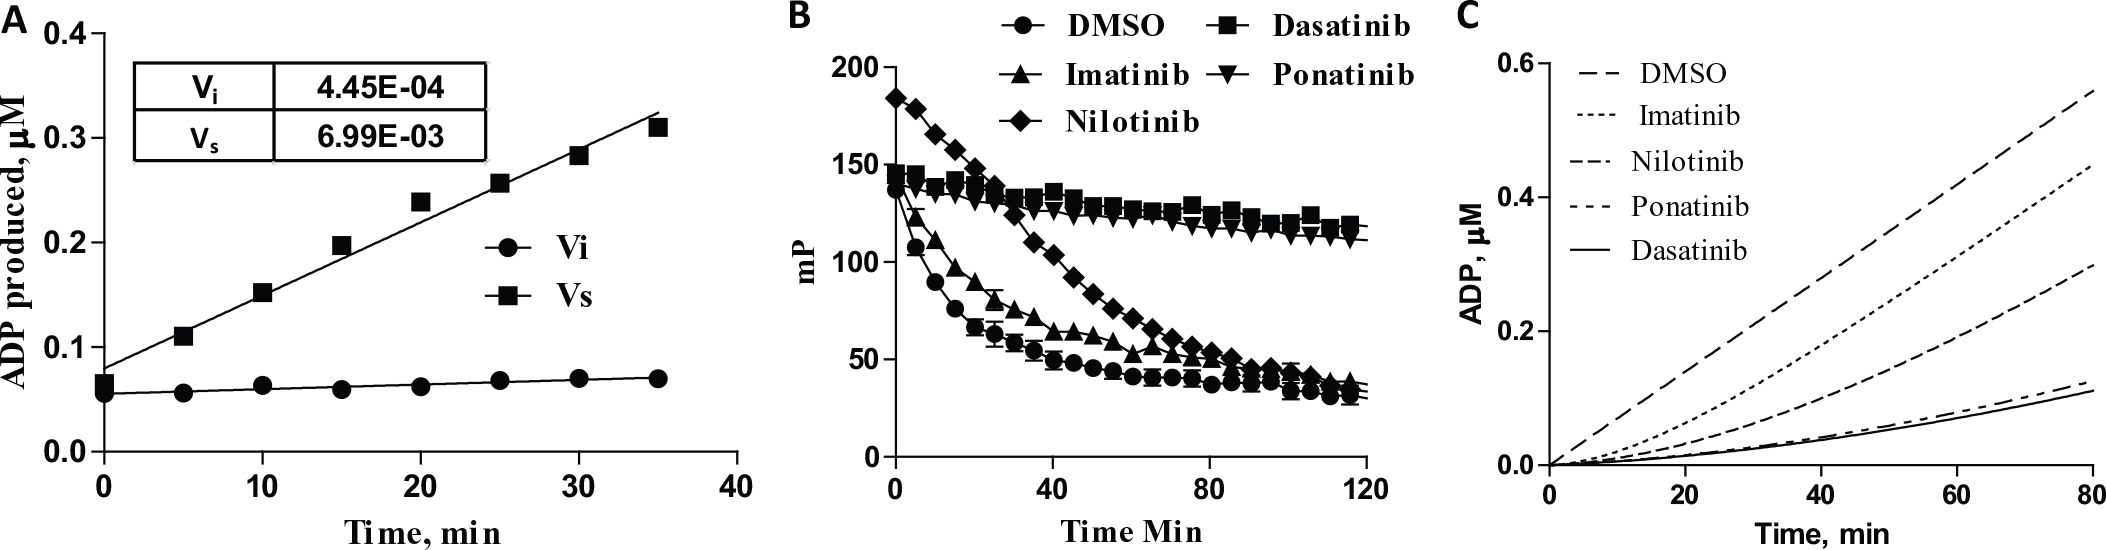
Estimation of koff with the jump dilution method is based on the rate of recovery of enzyme velocity from the fully inhibited state (vi) to the steady state after dissociation of inhibitor (vs). To obtain accurate values for vs and vi, we measured ABL1 activity in the presence of saturating dasatinib (400 nM) and in a DMSO control reaction. We assumed that the enzyme velocity in the absence of inhibitor is essentially equal to vs because the inhibitor is present at only 1/10 of its IC50 after the jump dilution. We also assumed that vi will be the same for all the inhibitors tested because they are all ATP competitive compounds. Velocities of 0.000445 and 0.00699 µmoles ADP min–1 were measured for vs and vi, respectively, reflecting greater than 90% inhibition of the ABL1 kinase activity in the presence of saturating inhibitor ( Fig. 1A ). These values were used to derive the integrated rate equation for ABL1: [P] = 0.006985t + (0.00654) (1 – e–kobs t)/kobs.
Jump dilution experiments were started by preincubating 280 nM ABL1 (100 × EC80) with 45 nM dasatinib, 4.5 μM imatinib, 25 nM nilotinib, or 10 nM ponatinib for 60 min to allow the E•I complex to form. ATP, Abltide, and Transcreener ADP2 FP kinase assay detection reagents were then added in sufficient volume to achieve a 100-fold dilution, and polarization was read at 2 min intervals ( Fig. 1B ). The decrease in polarization reflects formation of ADP by ABL1. The relative dissociation rates of the four ABL1 inhibitors are evident from the progress curves. The imatinib reaction reached vs within about 40 min, and the nilotinib reaction was close to vs at 80 min, but neither dasatinib nor ponatinib dissociates sufficiently to allow ABL1 to approach vs within the time course of the experiment.
To obtain accurate koff values, a standard curve was used to convert polarization values to the amount of ADP formed, and the values were fit to the ABL1 integrated rate equation to produce reaction progress curves reflecting the transition from vi to vs ( Fig. 1C ). koff values were calculated from the progress curves using the graphing software, and residence times were determined as the reciprocal of koff ( Table 1 ). Dasatinib exhibited the longest residence time of 249 min, followed by ponatinib at 205 min, nilotinib at 50 min, and imatinib at 17 min.
Our results showed both similarities and differences from residence times for ABL1 inhibitors reported in the literature, which were all measured using either SPR or ligand displacement assays ( Table 1 ).7,18 Although the same trend was observed, with imatinib being the most rapidly reversible inhibitor and the other compounds showing much slower dissociation, the values were considerably different. For instance, we observed similar residence times of 249 and 205 min for dasatinib and ponatinib, respectively; in comparison, a value of only 60 min was measured for dasatinib using SPR and a 1500 min residence time was measured for ponatinib using a ligand displacement assay.8,18
These differences and others observed are most likely due to the inherent differences in the methods and/or differences in the ABL1 protein constructs used. In SPR, dissociation of inhibitors from immobilized protein is monitored over time. In ligand displacement assays, binding of a probe ligand is monitored as the inhibitor dissociates. In contrast, the jump dilution method requires that (1) both ATP and the acceptor substrate bind and (2) catalysis occur after the inhibitor dissociates. Given these differences in extrinsic conditions, it is likely that the conformational profile of ABL1 is quite different, depending on which method is used, with potential effects on inhibitor binding and dissociation. For instance, immobilization of ABL1 in SPR would undoubtedly restrict its conformational mobility, whereas binding of the acceptor peptide would change its conformational repertoire in a very different way. Either of these could affect inhibitor binding and dissociation.
To test the broader applicability of the Transcreener ADP2 Kinase assay for measuring kinase drug–target residence times, we performed jump dilution experiments with three additional kinases. We selected EGFR
(
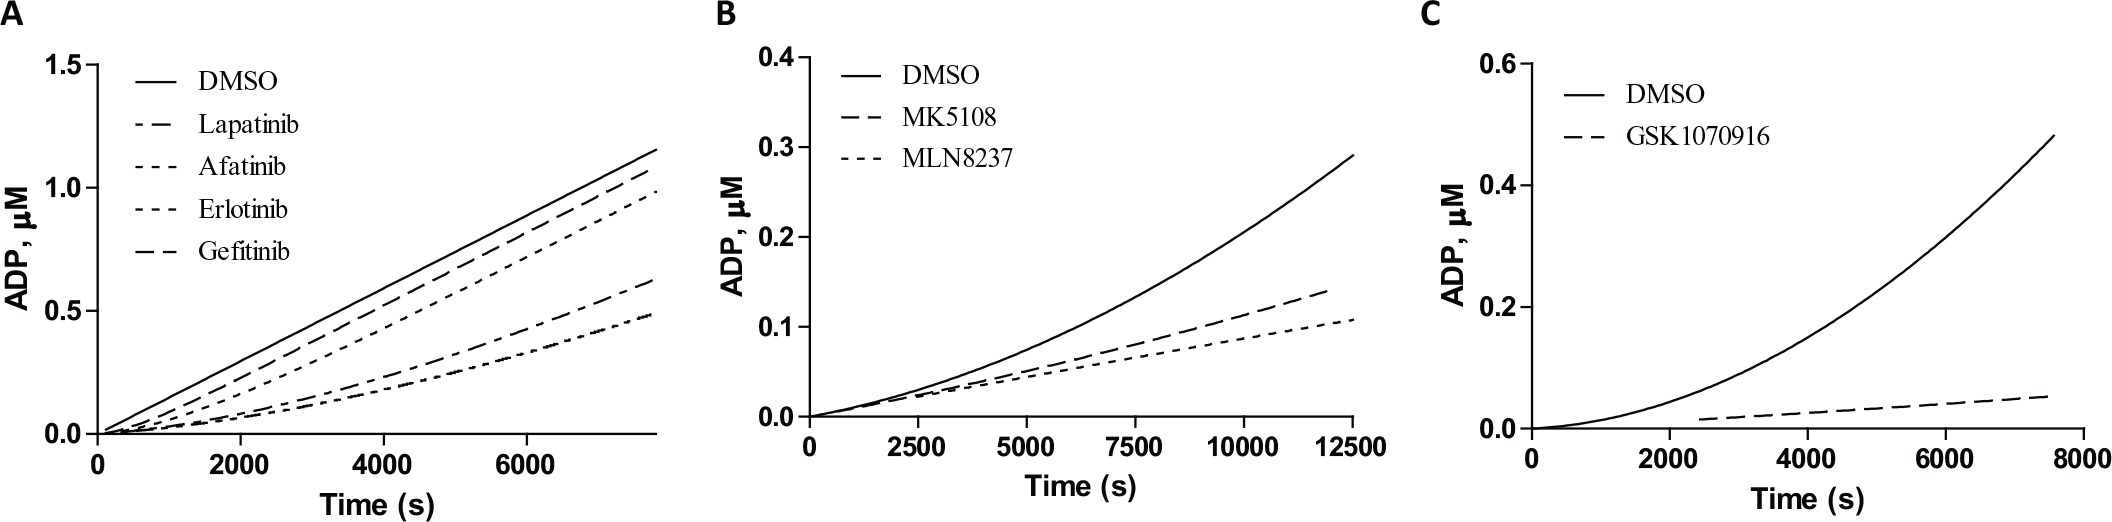
Dose–response curves were run for afatinib, lapatinib, erlotinib, and gefitinib with EGFR at 2, 3.4, and 5 nM using the FP-, FI-, and TR-FRET-based assays. The IC50 values obtained from the three formats showed good correlation with each other ( Table 2 ), with R2 values of 0.96 and 0.99 between the FP and TR-FRET and the FP and FI assays, respectively.11,13 The average IC50 values of 1.4, 0.2, 10, and 10.6 nM for afatinib, lapatinib, erlotinib, and gefitinib, respectively, were used to establish conditions for the jump dilution experiments. vs and vi (in the presence of saturating lapatinib) were determined as described above for ABL1 and used to derive the integrated rate equation for EGFR: [P] = 0.0001690t + (0.00016) (1 – e–kobs t)/kobs.
Equivalency of Transcreener ADP2 Kinase Assay Formats.
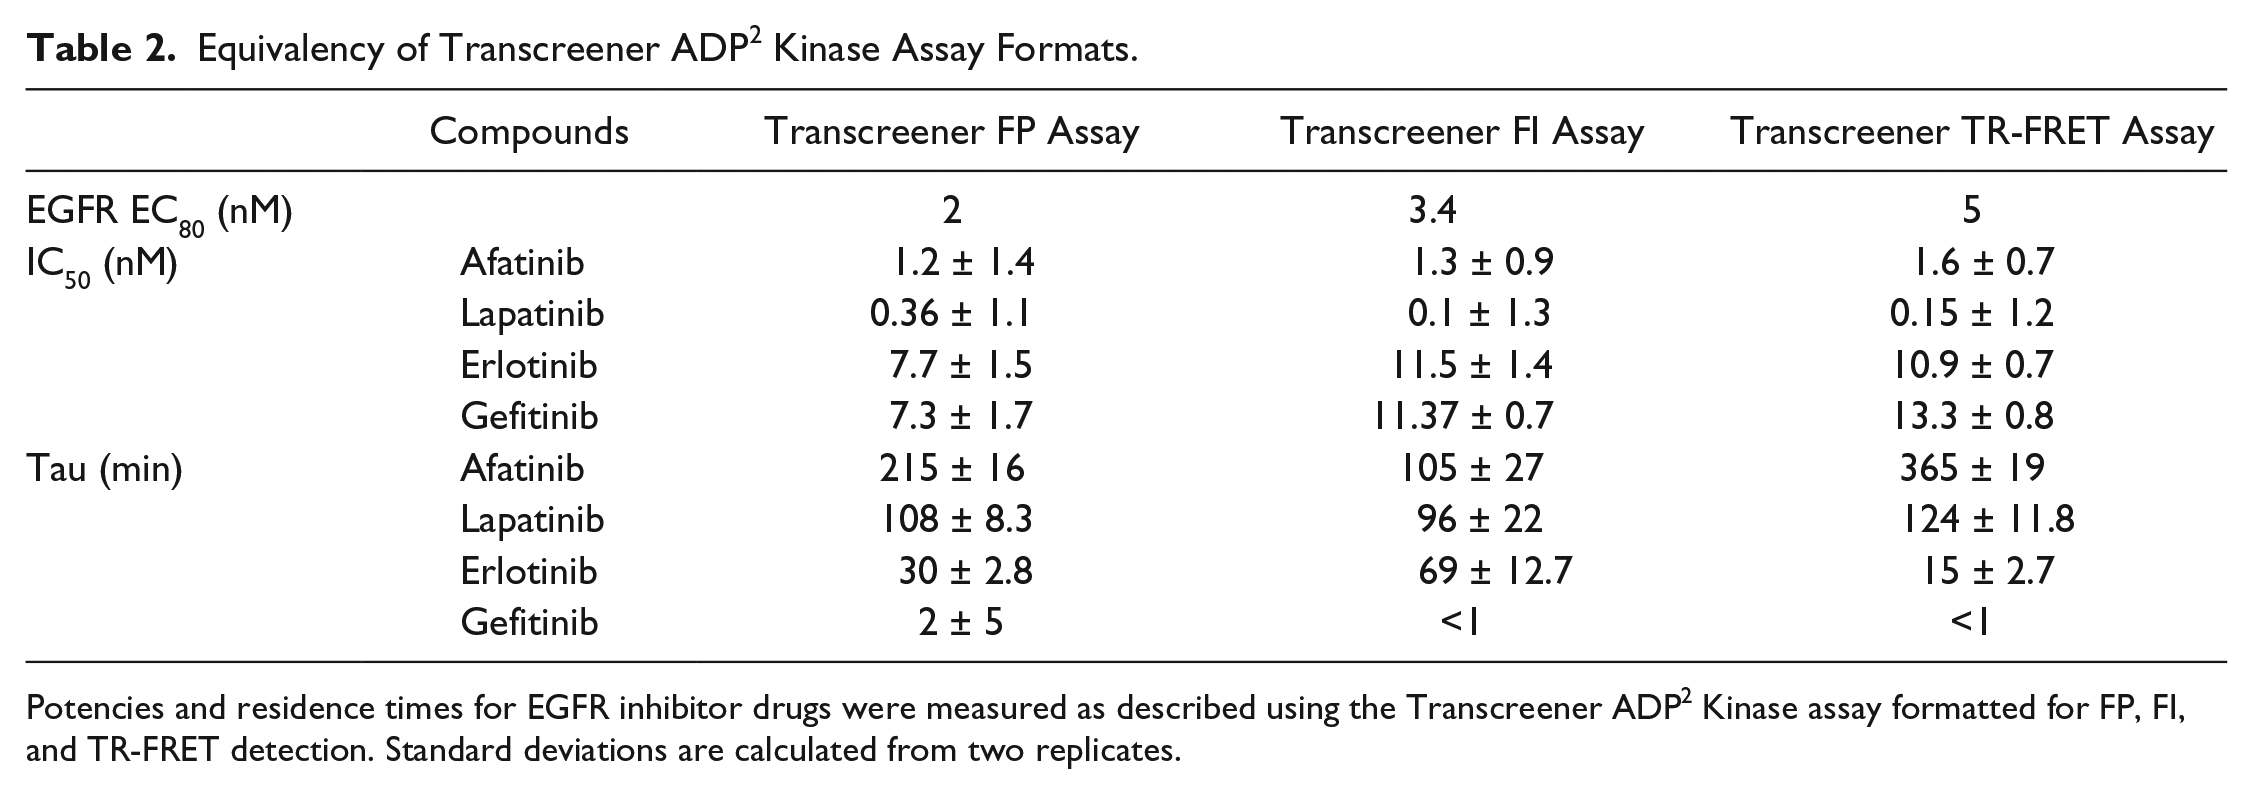
Potencies and residence times for EGFR inhibitor drugs were measured as described using the Transcreener ADP2 Kinase assay formatted for FP, FI, and TR-FRET detection. Standard deviations are calculated from two replicates.
Gefitinib showed the shortest residence time, with a value of 2 min in the FP assay and less than a minute in the FI and TR-FRET formats ( Table 2 ). Afatinib and lapatinib had the longest residence times, with values ranging from 105 to 365 min, depending on the detection format, for afatinib, and 96 to 124 min for lapatinib. These results are consistent with the binding mode of the inhibitors. Afatinib binds EGFR covalently (but is able to dissociate). Binding of lapatinib is associated with a conformational transition in EGFR; therefore, its dissociation is quite slow.7,13 Erlotinib had residence times of 15–69 min in the various assay formats ( Table 2 ). The slight differences between the three formats are possibly due to the data being fit to the same integrated rate equation determined, which was determined using the FI assay.
Residence times for the Aurora A kinase inhibitors MK5108 and MLN8237 and the Aurora B kinase inhibitor GSK1070916 were measured using similar jump dilution methods with the Transcreener ADP2 Kinase assay
In comparing our data from the Transcreener-based jump dilution method with literature values for EGFR and Aurora kinase inhibitor residence times, the outcome is similar to that observed with ABL1. Although the trends are similar, the absolute values vary considerably, for example, by 10-fold for erlotinib/EGFR and by nearly 5-fold for MLN8237/Aurora A. There is no method-dependent pattern that emerges; that is, in some cases SPR and ligand binding assays yield residence time values that are both considerably higher and lower than the values we measured. The one published residence time that was measured using jump dilution, GSK1070916/Aurora B, is less than twofold different than the value we measured. 12
A requirement of the jump dilution method is that the curvature in the reaction time course following dilution must be observable with the enzyme assay method used. For the Transcreener ADP2 assay, the kinetics of the antibody–tracer binding reaction imposes a limitation on measuring very short residence times. We have shown that tracer displacement is at least 80% complete within 4 min of ADP addition (full equilibrium requires approximately 30 min); thus, the accuracy of residence time measurements will decrease as they approach values of less than 10 min, for example, geftinib ( Table 1 ). 14 This limitation could possibly explain the longer residence time we measured for erlotinib/EGFR (30 min) compared with the value of less than 10 min measured using a direct (i.e., noncompetitive) phopshopeptide immunoassay. 13 Conversely, if residence time is very long, it may not be possible to continue the postdilution activity assays long enough to observe sufficient curvature. The reagent and signal stability for the Transcreener ADP assay (FP mode) are both greater than 24 h; thus, the assay imposes no limitations on the period of the activity measurements. 14 Loss of enzyme activity due to denaturation is more likely to limit the ability to observe very slow changes in velocity.
In addition to the different conditions used for various binding assays and the kinetic limitations of the Transcreener method, another possible explanation for the difference between residence times measured in this study and previously reported values is the kinase enzyme constructs used. Whereas we used full-length proteins, truncated enzymes and/or enzyme–activator complexes were used in some of the referenced studies.7,12,18–20
We have adapted the Transcreener ADP2 Kinase assay for measurement of kinase drug residence times using the jump dilution method. This approach would be straightforward to use in an automated HTS environment, and thus could be applied to large numbers of compounds following a primary screen or with a focused library. Moreover, the differences observed for residence times measured using the jump dilution method versus SPR and ligand binding assays raise interesting questions about which method yields the most predictive data. In this regard, we would note that to be effective, a drug must remain engaged to its target enzyme and inhibit catalysis in the presence of substrates. Therefore, the jump dilution method may yield more physiologically relevant estimates of residence times than the simpler equilibrium binding assay, as it measures recovery of enzyme catalytic activity.
Footnotes
Declaration of Conflicting Interests
The authors declared the following potential conflicts of interest with respect to the research, authorship, and/or publication of this article: BellBrook Labs manufactures and markets the Transcreener ADP assay kits used in the research reported here. The authors declare no other potential conflicts of interest with respect to the research, authorship, and/or publication of this application note.
Funding
The authors received no financial support for the research, authorship, and/or publication of this article.