
Abstract
The molecular chaperone heat shock protein 90 (Hsp90) is required for the correct folding and stability of a number of client proteins that are important for the growth and maintenance of cancer cells. Heat shock protein 72 (Hsp72), a co-chaperone of Hsp90, is also emerging as an attractive cancer drug target. Both proteins bind and hydrolyze adenosine triphosphate (ATP), and ATPase activity is essential for their function. Inhibition of Hsp90 ATPase activity leads to the degradation of client proteins, resulting in cell growth inhibition and apoptosis. Several small-molecule inhibitors of the ATPase activity of Hsp90 have been described and are currently being evaluated clinically for the treatment of cancer. A number of methods for the measurement of ATPase activity have been previously used, but not all of these are ideally suited to screening cascades in drug discovery projects. The authors have evaluated the use of commercial reagents (Transcreener™ ADP) for the measurement of ATPase activity of both yeast and human Hsp90 (ATP Km ~500 µM) and human Hsp72 (ATP Km ~1 µM). The low ATPase activity of human Hsp90 and its stimulation by the co-chaperone Aha1 was measured with ease using reduced incubation times, generating robust data (Z′ = 0.75). The potency of several small-molecule inhibitors of both Hsp90 and Hsp72 was determined using the Transcreener™ reagents and compared well to that determined using other assay formats.
Introduction
H
Both Hsp90 and Hsp72 are attractive targets for cancer treatment. 11,12 The blockade of Hsp90 activity leads to the degradation of the client proteins involved in cell proliferation and causes arrest of cell growth and apoptosis. 13 The natural product geldanamycin binds to the N-terminal ATP binding domain of Hsp90 and inhibits ATPase activity. 14 The poor solubility and hepatotoxicity of geldanamycin in clinical trials has prevented its further development as a drug. However, its derivatives, specifically, 17-allylamino-17-demethoxy-geldanamycin (17-AAG) and 17-(dimethylamino-ethylamino)-17-demethoxygeldanamycin (17-DMAG), have completed phase I clinical trials and entered phase II studies. 15
The clinical limitations of these derivatives have prompted the search for Hsp90 inhibitors with more drug-like properties. 15-17 To detect hit compounds that may be suitable as lead candidates in the development of novel Hsp90 inhibitors, several biochemical assays have been devised that are applicable to drug discovery and high-throughput screening (HTS) of large compound libraries. 18
One approach is to use the Hsp90-dependent refolding of firefly luciferase in rabbit reticulocyte lysates as a screening assay. Although this is a functional assay, any lead compounds will have to be checked for direct effects on the luciferase activity or the other chaperones contained in the lysates. 19
For binding assays, fluorescently labeled geldanamycin analogs have been used in a fluorescence polarization (FP) assay format. 20 Another FP binding assay uses a small-molecule inhibitor of Hsp90 derivatized with fluorescein to create a labeled probe. 21 In an assay based on time-resolved fluorescence resonance energy transfer, biotinylated geldanamycin was synthesized and bound in a complex to histidine-tagged Hsp90 with streptavidin-conjugated allophycocyanin and anti-histidine-labeled protein antibody containing an europium chelate as the fluorophores. 22
An alternative approach has been to measure the Hsp90 ATPase activity as a screening method. An enzyme-coupled ATPase assay with a fluorescent endpoint based on the oxidation of Amplex Red to resorufin has been used to carry out a primary screen of compound libraries. 23 Our initial studies employed a colorimetric assay for inorganic phosphate based on the reaction of the cationic dye, malachite green, with a phosphomolybdate complex. 24 This method was used to screen a ~56,000-compound collection that resulted in the discovery of a diaryl pyrazole resorcinol-based series of Hsp90 inhibitors. CCT049009 and CCT050589 25 and the clinical candidate NVP-AUY922 26 are Hsp90 ATPase inhibitors derived from the original HTS hits.
Both the Amplex Red and malachite green ATPase assay formats used yeast Hsp90 protein because its ATPase activity, with a kcat of 0.47 min−1, is 5 times higher than that of the human protein (kcat of 0.089 min−1), despite the 63% sequence homology between the yeast and human proteins. 24,27 A fluorescently labeled version of the phosphate binding protein from Escherichia coli was used to monitor the ATPase activity of the human protein, 27 but this assay is not as suitable for screening because a secondary enzyme is required to reduce the background level of inorganic phosphate. Therefore, the development of a sensitive screening assay with the ability to detect the ATPase activity of human Hsp90 would be of benefit for drug discovery.
The Transcreener™ ADP assay kit from Bellbrook Laboratories (Madison, WI) is an FP assay that detects adenosine diphosphate (ADP) using an ADP-antibody/tracer system. It is a 1-step homogeneous assay format suitable for screening purposes. 28 The assay can measure protein activity as ADP is the product of the catalytic phosphate group transfer from ATP 29 and has also been used to study the lipid kinase, phosphoinositide-3-kinase. 30 In this present study, we report the ability of the Transcreener™ ADP assay kit to detect the ATPase activity of yeast and human Hsp90 proteins. In addition, because Hsp72 is also emerging as a drug target, 8,11,31 we also show the ability of the same technology to measure the ATPase activity and inhibition of this chaperone.
Materials and Methods
Materials
Transcreener™ ADP (cat. no. 3004-1K) and ADP2 (cat. no. 3010-1K) FP assay kits were obtained from Bellbrook Laboratories. All FP assays were carried out in black, 384-well, low-volume, polystyrene nonbinding microplates (cat. no. 3676) from Corning Life Sciences (New York, NY). The easyLite™-Kinase luminescent ATP detection kit (cat. no. 6016749) and white OPTIPLATE 384-well microplates were purchased from PerkinElmer Life and Analytical Sciences (Seer Green, Bucks, UK). ATP (cat. no. A-7699) and all basic buffer components were obtained from Sigma-Aldrich Chemical Co. (Dorset, UK). 17-AAG (cat. no. A-8476) was obtained from Sigma-Aldrich Chemical Co. CCT049009 and CCT050589 were synthesized as previously described, 25 and the adenosine derivative CCT242078 (compound 12) was synthesized as described. 32 The chemical structures of the small-molecule inhibitors used are shown in Figure 1 .
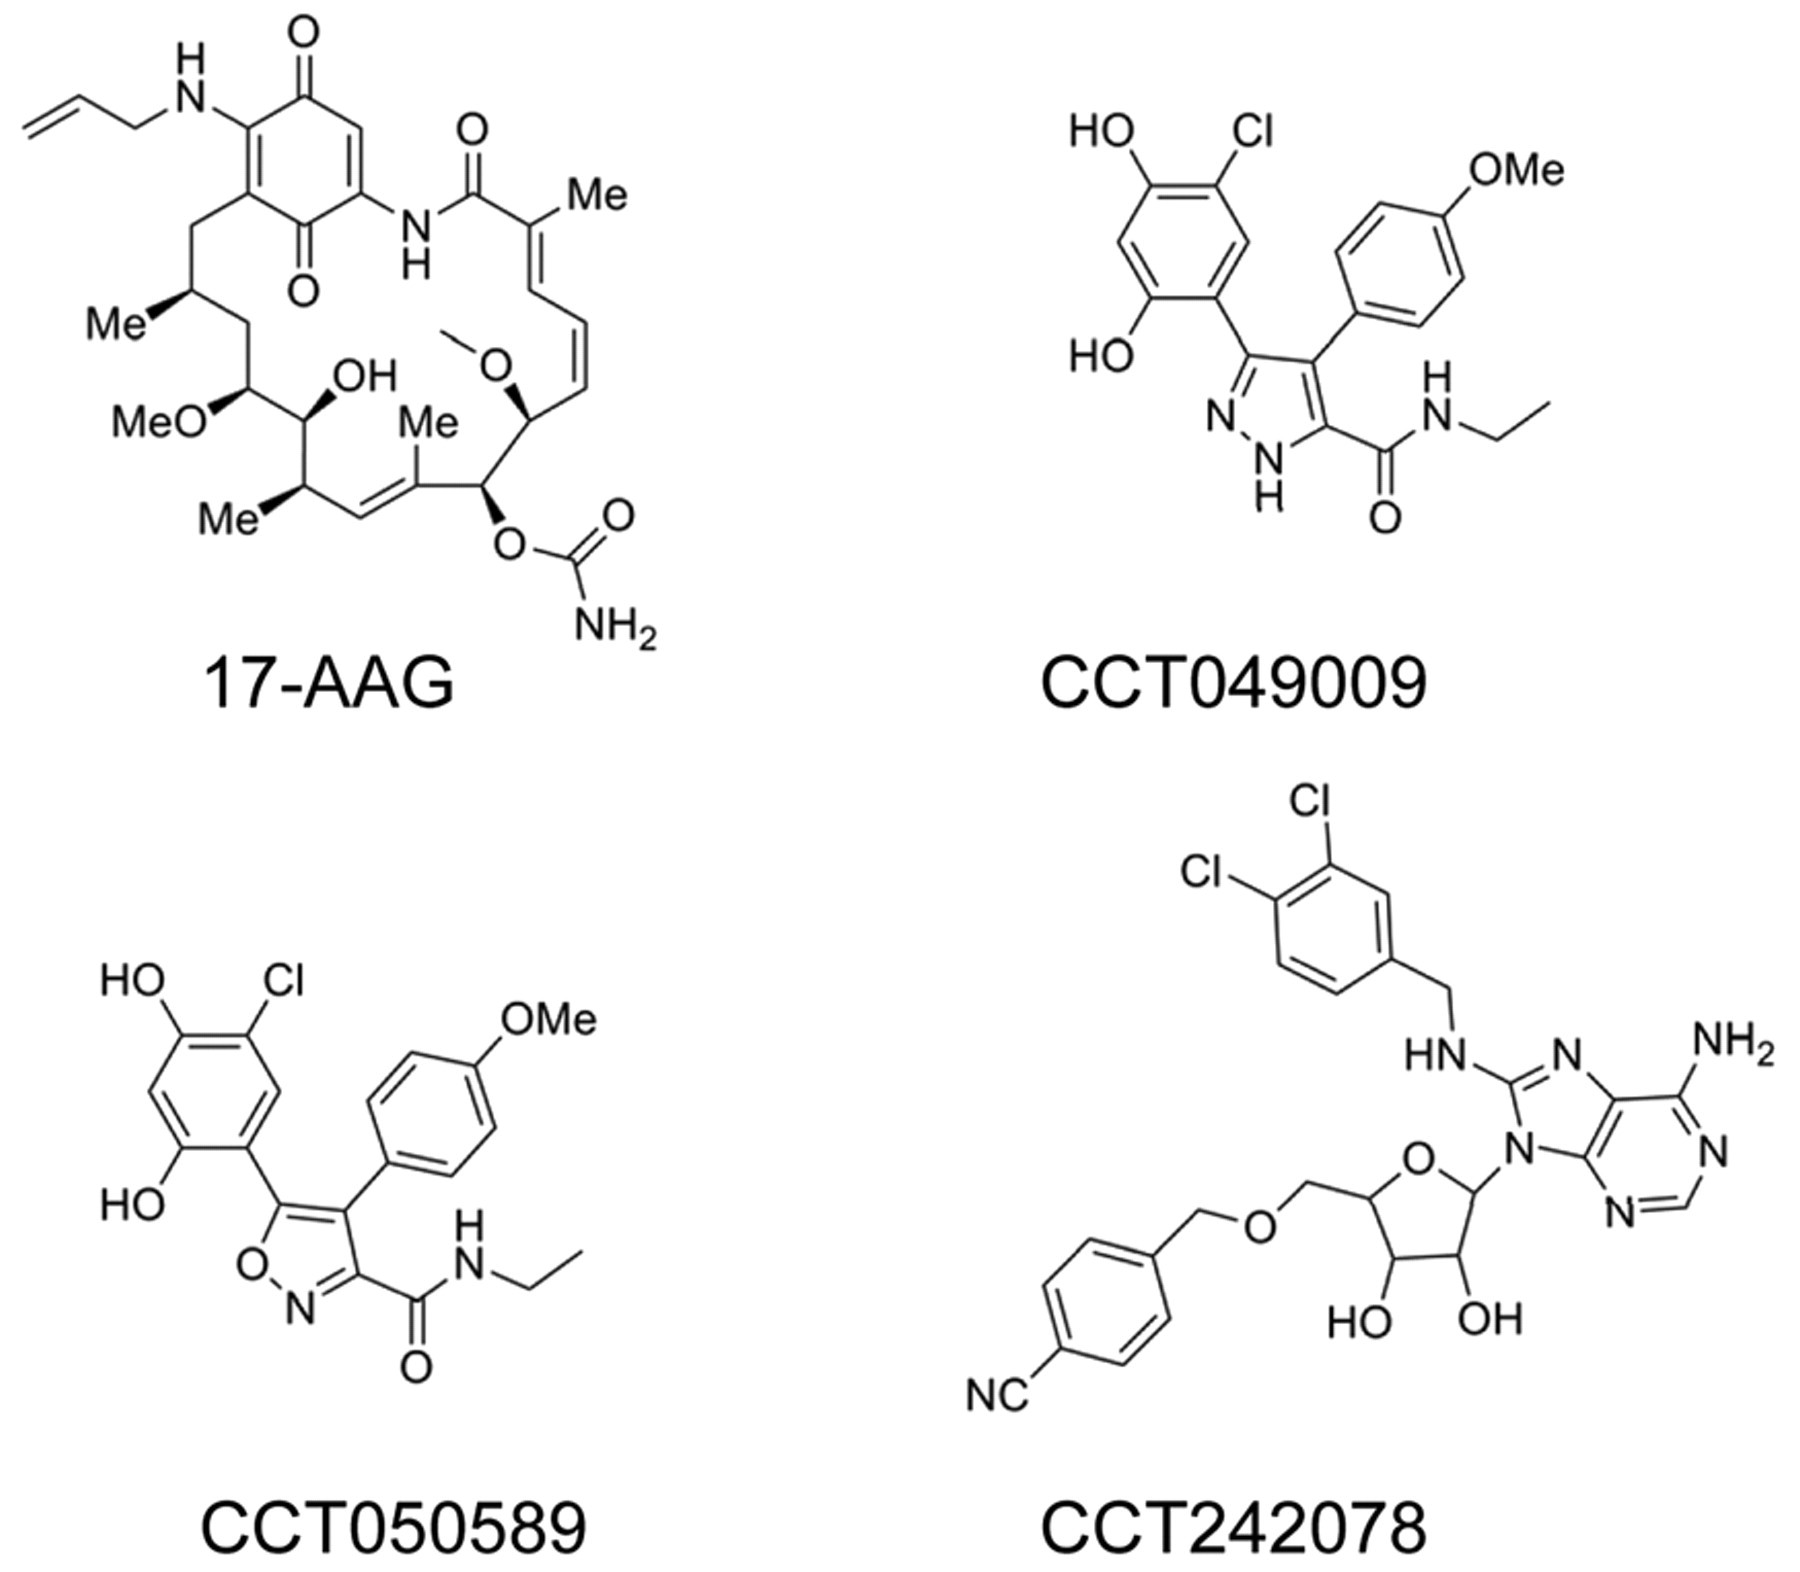
Chemical structures of Hsp90 and Hsp72 inhibitors used.
Protein expression and purification
Hsp90 proteins (yeast and human) and the yeast co-chaperone Aha1 were expressed as His6-tagged fusion proteins and purified as described previously using Talon metal affinity chromatography, Q-Sepharose ion exchange, and Superdex 75, 200, or Sephacryl 400HR gel filtration chromatography. 5,6
An expression construct bearing human Hsp72 (gene name is HSP70 1A) with an N-terminal His6-tag was transformed into the Rosetta 2 strain of E. coli. E. coli cultures were grown in LB media to an OD600 of 0.8 and then induced with 1 mM isopropyl β-D-thiogalactoside (IPTG) for 3 h. Cell pellets were resuspended in 25 mM Tris (pH 7.4), 25 mM NaCl, 3 mM MgCl2 containing protease inhibitors, and benzonase and lysed by sonication. Following centrifugation, the supernatant was applied to a Talon metal affinity column and the His-tagged protein recovered by elution with imidazole. Talon eluate was dialyzed against 25 mM Tris (pH 7.5), 50 mM NaCl, 3 mM MgCl2, and 5% glycerol and further purified over a Resource Q column. The Resource Q eluate was concentrated and then dialyzed against 100 mM Tris (pH 7.4), 150 mM NaCl, 6 mM MgCl2, and 10% glycerol. All protein samples were divided into aliquots and stored at −80°C.
Hsp90 ATPase assay procedure
Using the Transcreener™ ADP kit, the conditions for the yeast and human Hsp90 ATPase reaction were 50 mM HEPES (pH 7.4), 20 mM KCl, 2 mM EGTA, 4 mM MgCl2, and 0.01% Brij-35 in a 10-µL total assay volume in low-volume, black, 384-well plates. The final assay concentration of ATP was 100 µM for Hsp90. Due to the relatively low level of ATPase activity compared with other enzymes, the plate was incubated at 37°C and run over 1-, 2-, and 3-h time points. The reaction was stopped and the ADP detected by adding 10 µL of 50 mM HEPES (pH 7.4), 400 mM NaCl, 20 mM EDTA, 0.01% Brij-35, 75 µg/mL anti-ADP monoclonal antibody, and 4nM ADP far red tracer. The plate was sealed, centrifuged at 600 g for 1 min, and left at room temperature for 1 h. FP (mP) readings were performed on a Fusion or Envision plate reader (PerkinElmer Life Sciences). A blank mP signal composed of protein, antibody, labeled ADP, but no ATP substrate gave similar mP values to those seen in the no-protein controls. For example, in one typical experiment, the no-ATP substrate samples gave values of 174.8 ± 3.5 mP, whereas the no-protein control was 167.9 ± 2.6 mP. Thus, the protein does not interfere with the mode of detection and enables the generation of acceptable Z′ values. The upper limit of the assay window was defined by a no-protein control, and the mP in the presence of heat shock protein was subtracted from this control to generate a change in polarization (ΔmP), which was plotted on the activity graphs. Therefore, the data take into account the spontaneous hydrolysis of ATP. Each value is the mean of triplicate determinations with standard deviations (SD) shown. The malachite green assays were performed as described previously 24 but with 400 µM ATP, 400 nM Hsp90, and incubation at 37°C overnight to obtain significant ATPase activity with the human protein. IC50 values were calculated using GraphPad Prism software with the nonlinear regression curve fit to the log (inhibitor concentration) against the raw mP values on the linear portion of the standard curve.
Hsp72 ATPase assay procedure
The work described in our studies was carried out over several months, and the Transcreener™ ADP2 kit was not initially available. The ADP2 kit is identical to the ADP kit, but a more sensitive antibody is used, which makes the ADP2 kit superior in detecting lower ADP concentrations and hence more suitable for the Hsp72 studies. The Hsp72 ATPase activity was detected by the ADP2 kit exactly as described for the Hsp90 protein, except that the final concentration of ATP in the assay was 1 µM, and the anti-ADP monoclonal antibody was used at 1.5 µg/mL. The easyLite™-Kinase system is based on the production of light from the reaction of ATP with firefly luciferase and D-luciferin. The emitted light is proportional to the ATP concentration up to 10 µM (data not shown). For the Hsp72 ATPase activity, the assay buffer was 100 mM Tris (pH 7.4), 20 mM KCl, 6 mM MgCl2, and 10% glycerol with various concentrations of protein and a final concentration of ATP of 1 µM in a 20-µL assay volume. After incubating the OPTIPLATE 384 at 37°C for 1, 2, and 3 h, the reaction was stopped by the addition of 20 µL of the easyLite™-Kinase reagent. Assay plates were centrifuged at 600 g for 1 min to ensure mixing, left for 15 min at room temperature, and the luminescence signal read on a Topcount NTX plate reader (PerkinElmer Life Sciences). When compounds were tested in this format, control samples were run in the absence of Hsp72 to determine the effect of the compounds on firefly luciferase, and the luminescence was subtracted from that measured in the presence of Hsp72.
Results
The ADP/ATP standard curve was performed as outlined in the Transcreener™ kit technical manual (www.bellbrooklabs.com) and mimics an ATPase reaction in that as ADP is produced, by the hydrolysis of ATP, the FP signal (mP) is reduced (data not shown). The published values of 100 to 850 µM is the range in the literature for the Km of ATP for Hsp90. 6,24,27 Therefore, for all subsequent assays on Hsp90, the ATP concentration used was set at the bottom limit of 100 µM, and the anti-ADP monoclonal antibody was used at 75 µg/mL, as suggested in the technical manual.
The Transcreener™ kit detected ATP hydrolysis with both yeast ( Fig. 2a ) and human ( Fig. 2b ) Hsp90 proteins as demonstrated by the lower mP values observed as ADP is formed. In both cases, the ATPase activity was dependent on the time of incubation and protein concentration. For the yeast protein, which is known to be ~5-fold more active than the human isoform, a concentration of 0.3 µM was selected for further experiments as at this concentration, enzyme activity was approximately linear. Although linear kinetics is usually associated with low substrate conversion, in many screening campaigns, a higher level of substrate conversion is frequently used to increase the signal window. 33 Typical experimental values using 0.3 µM yeast protein and 3 h of incubation were 123.7 ± 1.9 mP for total enzyme activity wells and 167.9 ± 2.6 mP for no-enzyme blanks, producing a Z′ of 0.69. The activity of yeast Hsp90 was inhibited by the ansamycin ATPase inhibitor 17-AAG and the pyrazole/isoxazole resorcinol-based compounds, CCT049009 and CCT050589, 25 giving IC50 values of 5.3 ± 0.25 µM, 0.31 ± 0.05 µM, and 0.19 ± 0.03 µM, respectively. These IC50 values were similar to those obtained previously with the colorimetric malachite green assay (17-AAG = 8.7 µM; CCT049009 = 0.17 µM, and CCT050589 = 0.14 µM).
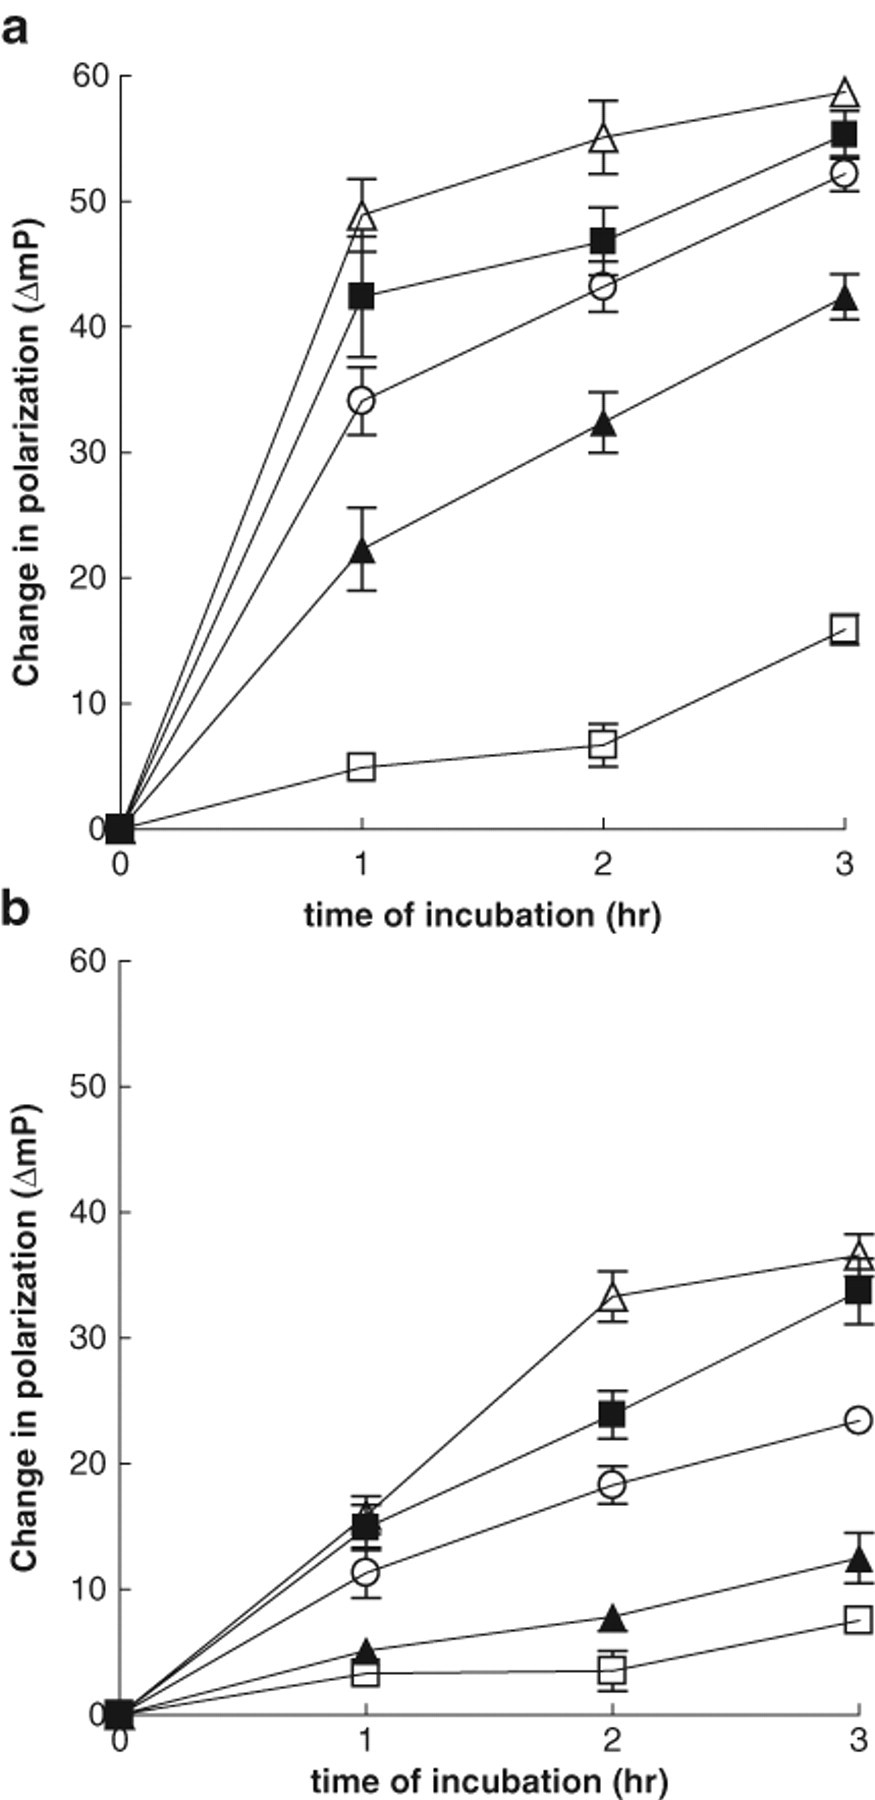
Progress curves for the hydrolysis of 100 µM adenosine triphosphate (ATP) by
(
The ATPase activity of human Hsp90 alone was relatively modest ( Fig. 2b ). A concentration of 0.6 µM human Hsp90 and 100 µM ATP was selected for subsequent experiments. As expected, 6 human Hsp90 ATPase was activated by the co-chaperone Aha1 ( Fig. 3a ) in a concentration-dependent manner and inhibited by 17-AAG and the resorcinol-based compounds ( Fig. 3b , Table 1 ). For the IC50 experiments, the FP signal for the total enzyme activity plus Aha1 was 124.1 ± 2.8 mP, and the blanks, in the absence of protein, gave a value of 162.3 ± 0.4 mP. The Z′ value for this assay was 0.75. The Transcreener™ assay requires 0.6 µM Hsp90 and 6 µM Aha1 protein to detect maximum activation of the ATPase activity. These concentrations are 3 times less than those required in the malachite green (2 µM Hsp90, 30 µM Aha1) and the coupled enzyme assays (2 µM Hsp90, 15 µM Aha1) 6 and suggests that the Transcreener™ FP assay is a more sensitive method for studying Hsp90 ATPase activity than the previously established methods.
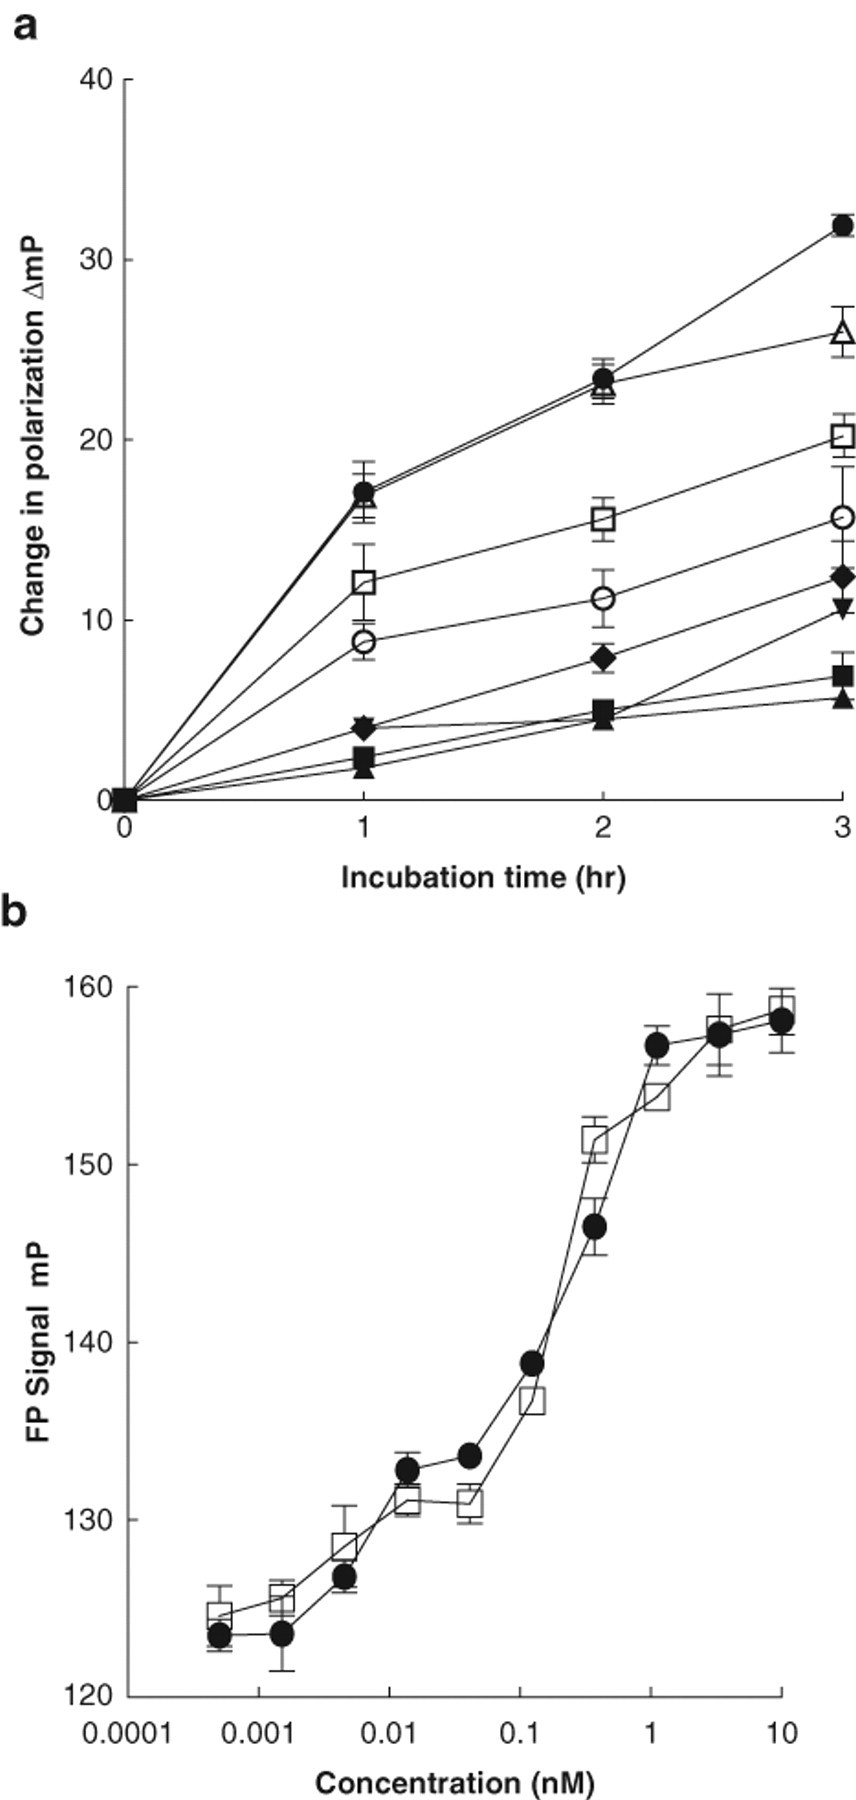
(
IC50 (µM ± SD) Values for Inhibitors of Aha1-Stimulated Human Hsp90 ATPase Activity Measured in the Transcreener™ Assay or the Malachite Green Assay under the Conditions Shown in the Table
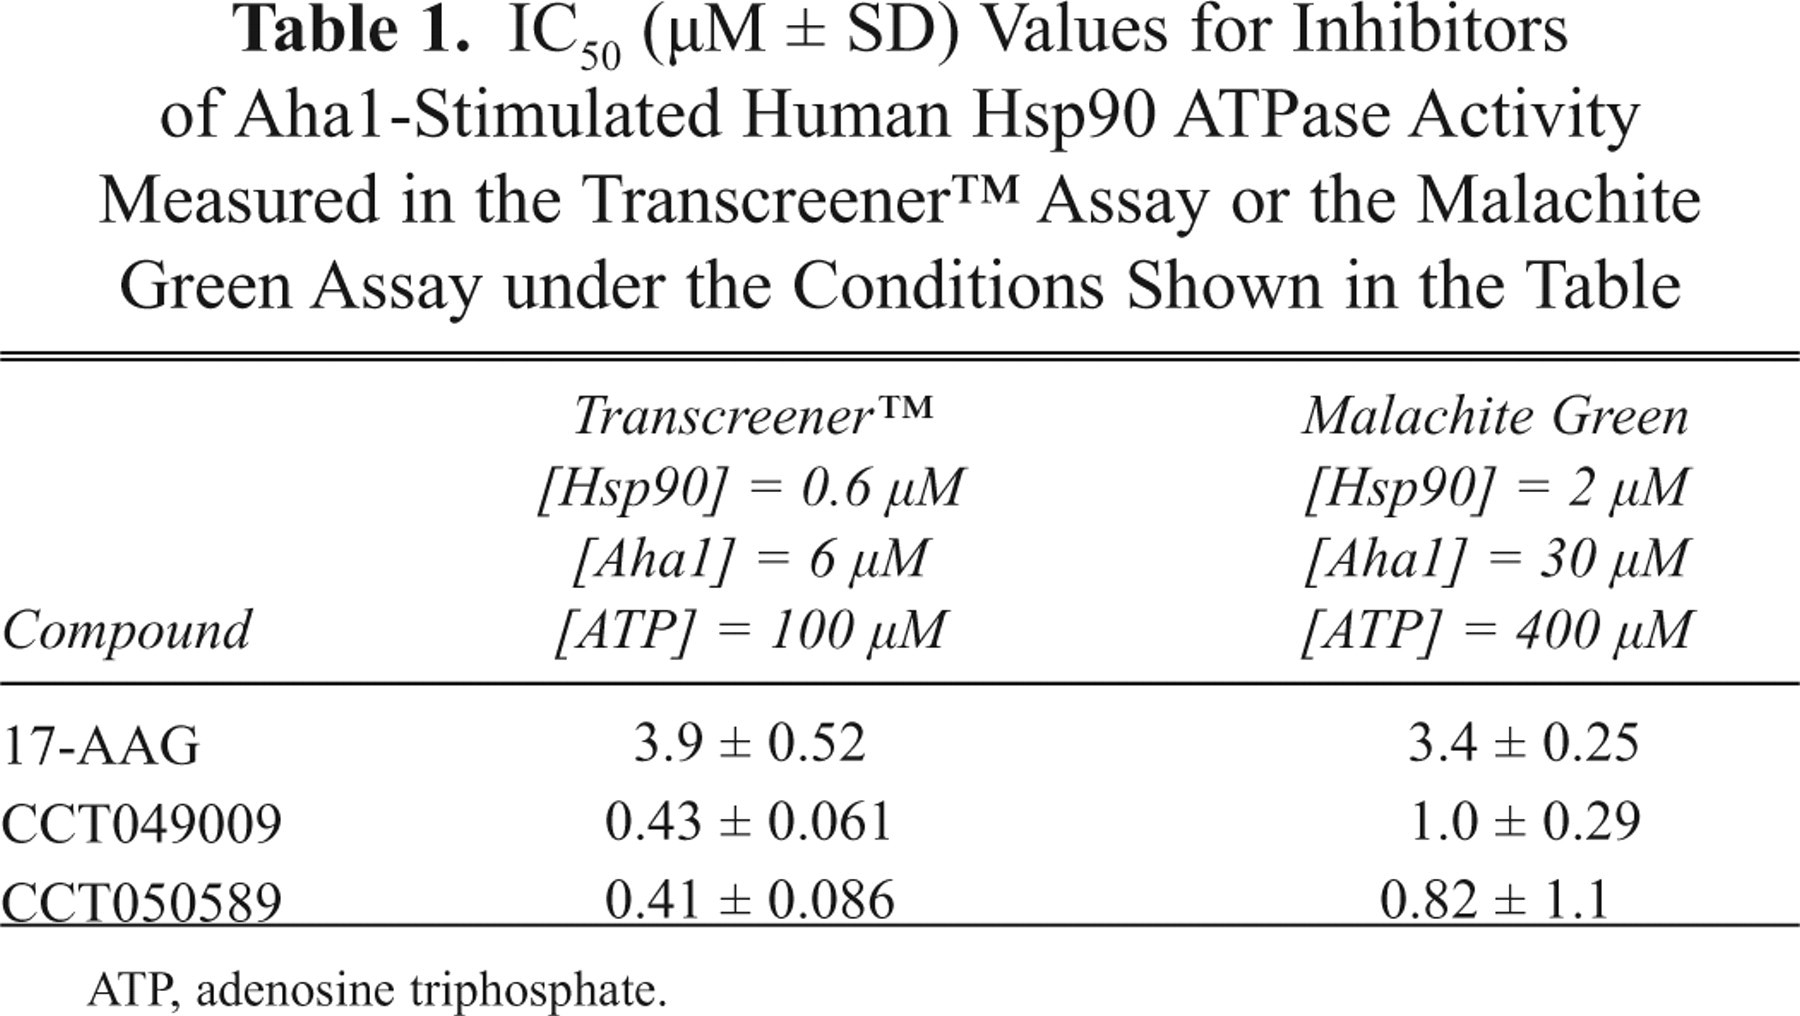
ATP, adenosine triphosphate.
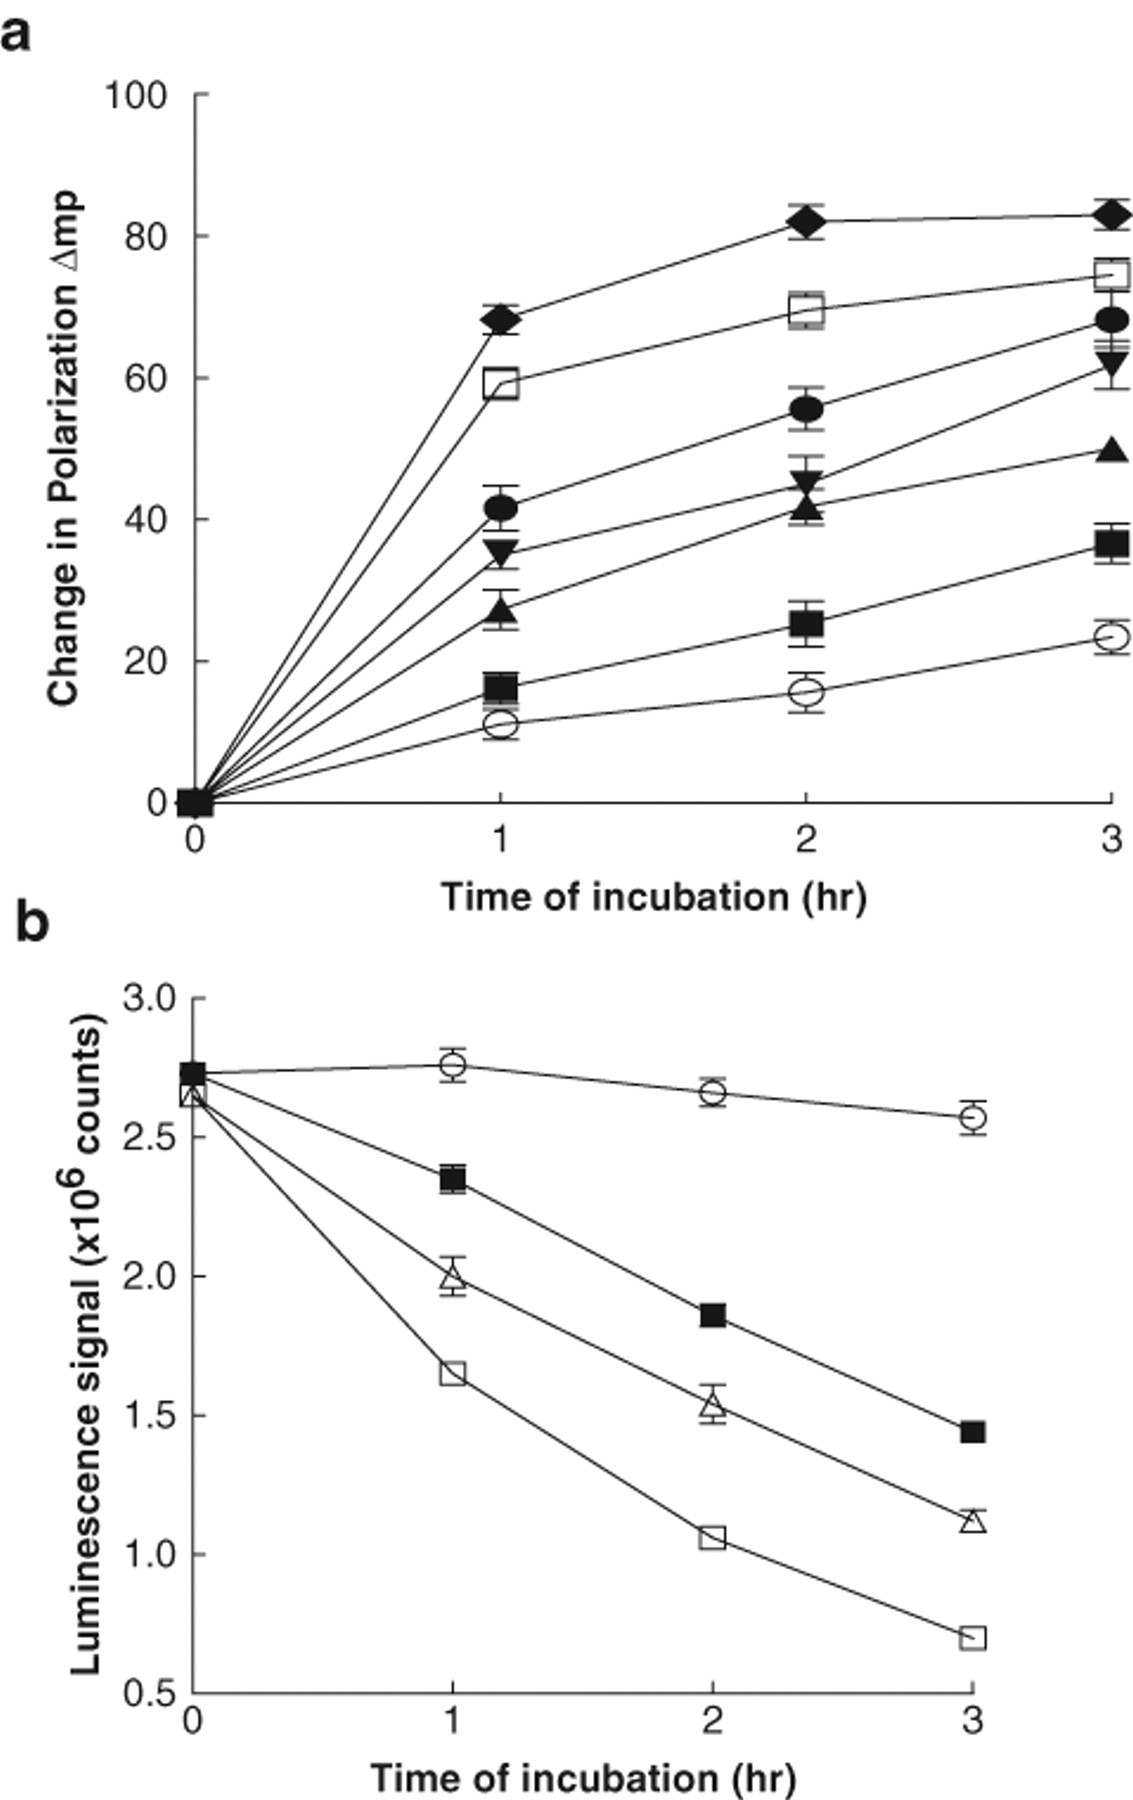
For the Hsp72 protein, the Km for ATP is far lower than that for Hsp90 with reported values of around 1 µM using radiolabeled ATP. 9,10 Our preliminary experiments using malachite green were unsuccessful because the lower limit of sensitivity of the assay is around 5 µM inorganic phosphate, and with high concentrations of ATP, ADP is produced, and this will inhibit the ATPase activity of Hsp72 (data not shown). Therefore, using an ATP concentration of 1 µM and the anti-ADP monoclonal antibody at 1.5 µg/mL, we tested the ability of the Transcreener™ kit to detect the ATPase activity of human Hsp72. In a similar fashion to Hsp90, the activity of Hsp72 ATPase varies with both time and protein concentration ( Fig. 4a ). An alternative assay format for Hsp72, but not Hsp90 ATPase, is the easyLite™-Kinase luminescent detection system as this format is suitable for ATP concentrations of 10 µM or less. Using a 1-µM concentration, an increase in Hsp72 protein leads to a decrease in the luminescence signal ( Fig. 4b ). ATP was depleted by approximately 40% in the presence of 200 nM Hsp72 after a 3-h incubation at 37°C. Under these conditions, the luminescence signal in the presence of Hsp72 (total activity) was 1.35 ± 0.065 cps × 106, and for the Hsp72 blanks, these values were 2.30 ± 0.019 × 10⁶ cps, producing a Z′ of 0.73 ( Fig. 4b ).
(
CCT242078 is an adenosine derivative that has recently been shown to bind to the ATP domain of the Hsp72 protein, 32 and its ability to inhibit the ATPase activity of the protein was investigated. Using the Transcreener™ assay conditions described above, CCT242078 gave an IC50 of 3.4 ± 0.5 µM. In the ATP depletion assay, no effect was observed on the basal luciferase-based luminescence up to 100 µM CCT242078, but the Hsp72-derived loss of luminescence was inhibited with an IC50 of 3.7 ± 1.6 µM ( Fig. 5 ).
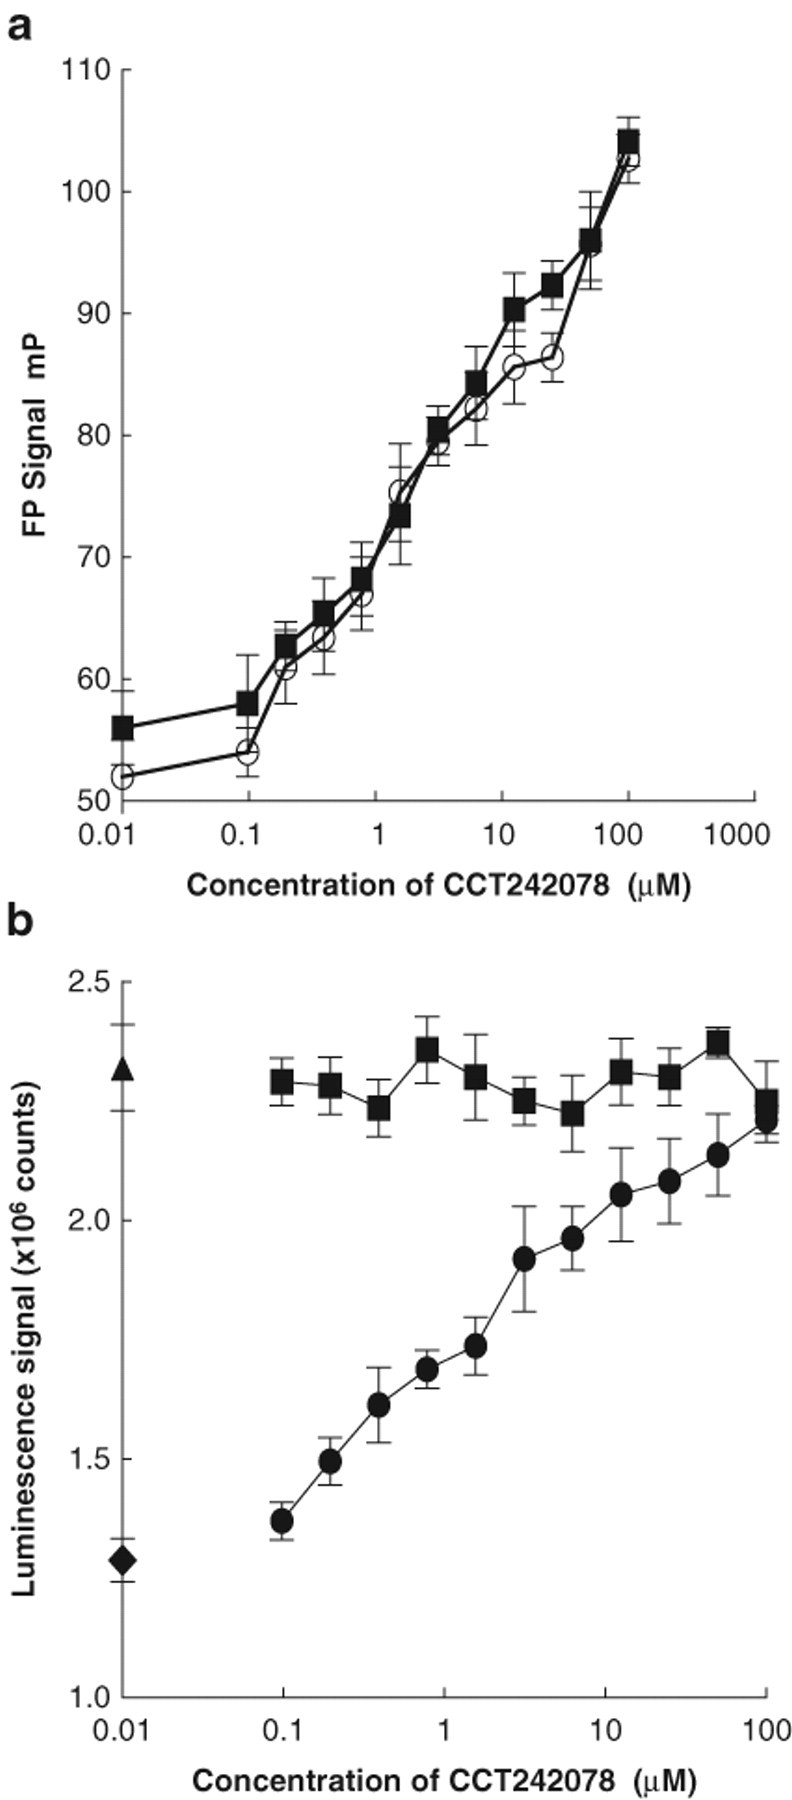
Inhibition of human Hsp72 ATPase activity by CCT242078 with (
Discussion
Previously, the Transcreener™ ADP assay kit has been demonstrated to be a sensitive, reproducible, and robust method for assaying and screening for inhibitors of protein kinases 28,29 and lipid kinases. 30 In this study, we have shown that the same assay technology, using the standard reagents and buffers, can be used to determine the ATPase activity of heat shock proteins. With an ATP concentration of 100 µM, the activity of both yeast and human Hsp90 ATPase was detectable at low µM protein levels under the conditions described in Materials and Methods. These enzyme concentrations are significantly lower than the levels required by the established assay methods. For example, the activation of Hsp90 ATPase by Aha1 requires 3-fold less protein than is needed for the coupled enzyme assay or the malachite green method. Hsp90 inhibitors, namely, 17-AAG and the pyrazole/isoxazole resorcinol compounds, CCT049009 and CCT050589, 25 exhibited comparable IC50 values against the yeast protein in the Transcreener™ assay as in the established malachite green assay using similar concentrations of protein and ATP. In this study, all the IC50 values in the Transcreener™ assays were determined using the raw mP data. However, as described in the technical manual, a standard curve can be generated for the conversion of ATP to ADP and the raw mP data converted to the amount of ADP formed. Due to the lack of sensitivity of the malachite green assay, overnight incubation at 37°C was required to detect either the yeast activity at low protein concentrations or the stimulation of the human protein ATPase by the co-chaperone, Aha1. However, with the Transcreener™ FP assay, the ATPase activity in both cases can be detected with ease, generating robust experimental data with good Z′ values using much shorter incubation times (3 h compared to overnight incubation).
Unlike Hsp90, with its Km for ATP in the high µM range, Hsp72 protein has a low Km for ATP (~1 µM). 9,10 A concentration of 1 µM was therefore used with the Transcreener™ kit, and ATP hydrolysis was observed down to 5 nM protein. Interestingly, the easyLite™-Kinase luminescence ATP detection method can also be used to study Hsp72 ATPase, although higher protein concentrations than used for the Transcreener™ assay are required, and with any screening of inhibitors, it is necessary to test the effects of compounds on the basal luminescence to identify those that affect the activity of the luciferase enzyme. In both cases, the activity of Hsp72 was inhibited by CCT242078 with an IC50 of ~3 µM. This compares with the previously reported IC50 of 0.5 µM in the FP assay. 32
The total polarization shifts observed in our assays are lower than typically desirable for an HTS campaign. Therefore, despite the acceptable Z′ factors obtained, additional assay optimization may be required in an HTS context. An advantage of the Transcreener™ kit is the broad range of ATP concentrations (0.1-1000 µM) that can be accommodated by this method. This enables any assay to be carried out at its appropriate Km value for the ATPase activity, a commonly used approach in screening for enzyme inhibitors as we have shown with Hsp72 and Hsp90. This, coupled with the short incubation times compared to those required for the malachite green method, would facilitate any HTS campaign. The malachite green assay could be used as a counterscreen or to confirm any hits generated from the Transcreener™ assay.
In conclusion, the Transcreener™ ADP FP assay kit provides a sensitive assay format for detecting the ATPase activity in heat shock proteins and is currently being employed in the discovery of inhibitors of Hsp90 and Hsp72 ATPase activity.
Footnotes
Acknowledgements
We thank Tony Klink and Karen Kleman-Leyer, BellBrook Labs (Madison, WI) and their colleagues for helpful advice and useful discussions.
This work was supported by Cancer Research UK grant numbers C309/A2187 and C309/A2874. Paul Workman is a Cancer Research UK Life Fellow. We acknowledge NHS funding to the NIHR Biomedical Research Centre.