
Abstract
The volumetric analysis of three-dimensional (3-D)-cultured colonies in alginate spots has been proposed to increase drug efficacy. In a previously developed pillar/well chip platform, colonies within spots are usually stained and dried for analysis of cell viability using two-dimensional (2-D) fluorescent images. Since the number of viable cells in colonies is directly related to colony volume, we proposed the 3-D analysis of colonies for high-accuracy cell viability calculation. The spots were immersed in buffer, and the 3-D volume of each colony was calculated from the 2-D stacking fluorescent images of the spot with different focal positions. In the experiments with human gastric carcinoma cells and anticancer drugs, we compared cell viability values calculated using the 2-D area and 3-D volume of colonies in the wet and dried alginate spots, respectively. The IC50 value calculated using the 3-D volume of the colonies (9.5 μM) was less than that calculated in the 2-D area analysis (121.5 μM). We observed that the colony showed a more sensitive drug response regarding volume calculated from the 3-D image reconstructed using several confocal images than regarding colony area calculated in the 2-D analysis.
Keywords
Introduction
Two-dimensional (2-D) cell-based high-throughput screening (HTS) is well developed, and commonly used in many research studies. It replaces laborious and time-consuming manual methods used for analyzing numerous potential candidates during drug discovery. 1 HTS requires less time for large-scale and highly parallel tests, and fewer reagents as well. More importantly, it is a robust technique that does not require manual intervention.1–3 However, many cells of normal and malignant origin lose some of their phenotypic properties when cultured in vitro in 2-D monolayers.4–7 The formation of tissue-like structures is highly inhibited in 2-D monolayer cultures, because of the close adherence of cells to most artificial surfaces and confinement within 2-D spaces, severely limiting intercellular contact and interactions. Certain researchers have already reported that compared with 2-D monolayer cell cultures, three-dimensional (3-D)-cultured cells exhibit different morphology, 8 protein/gene expression,9,10 and drug responses.11,12 Therefore, in recent years, enormous efforts have been made for developing 3-D cell cultures13,14 that can maintain human cells with specific biochemical and morphological features similar to those of the corresponding tissues in vivo, including human cells cultured in 3-D hydrogels, such as alginate, Matrigel, collagen, and polymer scaffolds.9–15 Recently, the development of 3-D cell cultures in hanging droplets was similarly demonstrated by aggregating cells within hanging droplets using gravity, eventually resulting in the formation of spheroids. 16
Previously, we developed a 3-D cell-based HTS platform using pillar/well chips.17–19 The pillar/well chip platform deposits an alginate/cell spot on the top surface of the pillar, and encapsulates cells within the alginate spot. Then, the pillar containing the alginate spot is dipped in media or drugs contained in the well through the assembly of the pillar and well chips. This effortless media exchange could miniaturize cell/extracellular matrix spots, and increase assay throughput.
To evaluate drug response, the alginate spots on the pillar are stained, and then they are dried. The cell viability values are calculated from the area of colonies on 2-D fluorescence images of the dried alginate spot, as shown in Figure 1A . However, the number of viable cells in the colonies are directly related to the volume of the colonies, not their area. Therefore, we proposed a method for the 3-D volumetric analysis of colonies for higher accuracy. The spots were immersed in a buffer (MBD-STA50, Medical & Bio Device, Suwon-si, South Korea), and the 3-D volume of each colony was calculated from the 2-D stacking fluorescence images of the spots with different focal positions. During the 3-D measurement, the pillar/well plates were sealed to minimize medium evaporation. Subsequently, 50 images with a 15.1 µm interval on the z axis were used to reconstruct 3-D images of colonies for calculating their volumes, as shown in Figure 1B . Using the 3-D and 2-D images of the colonies, we compared the cell viability values calculated using the area and volume of the colonies in the dried and wet alginate spots, respectively. Furthermore, dose–response curves and IC50 values were analyzed.
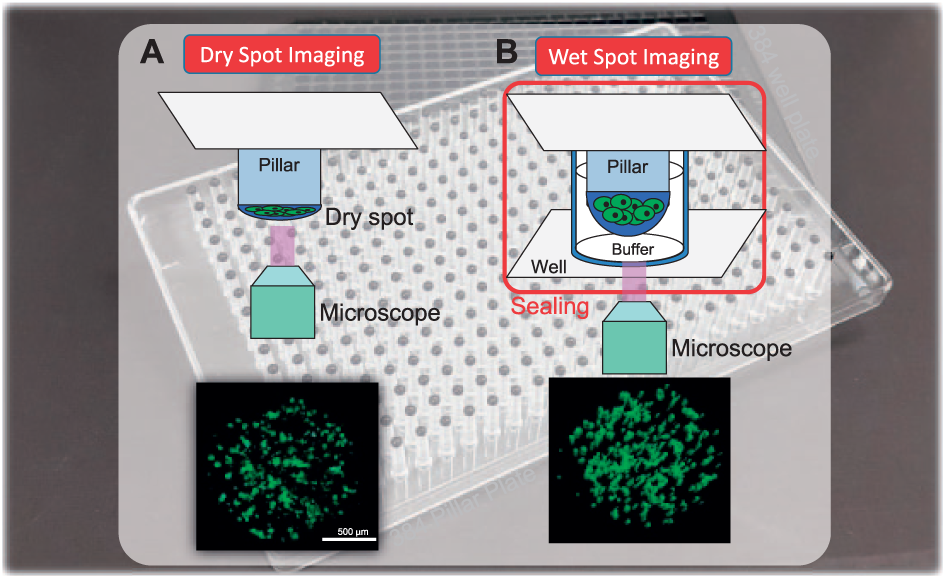
3-D cell-based 384-pillar/well plate for HTS. (
Materials and Methods
Cell Culture
The human gastric carcinoma cell line, KATO III, was purchased from the Korean Cell Line Bank (Seoul, South Korea). KATO III cells were cultured in RPMI 1640 medium (Gibco) supplemented with 10% fetal bovine serum (FBS). The cells were maintained at 37 °C in a humidified 5% CO2 atmosphere, and passaged every 4 days.
Plate Layout and Experimental Procedure
The 384-pillar/well plate has six regions, and each region (7 × 7 well array) contains a combination of two drugs, as shown in Figure 2A . Totally, 49 different cell viability values were obtained in each block with the dual-drug combination. Figure 2B shows the experimental procedure. An alginate spot of 1 μL, containing approximately 1000 cells and 0.5% alginate (w/w), was automatically deposited onto the pillar chip by ASFA Spotter ST (Medical & Bio Device). The ASFA Spotter ST uses a solenoid valve (Lee Company, Westbrook, CT) for depositing 1 μL droplets of the cell–alginate mixture. After depositing the cells, the 384-pillar plate containing the human cells in alginate was stamped against the 384-well plate for culturing colonies within the spot, and drug efficacy was analyzed. The cells were recovered for 1 day of incubation at 37 °C. Then, the 384-pillar plate containing the cells was shifted onto a fresh 384-well plate containing various drugs, as shown in Figure 2B . The combined plates were incubated with drugs for 4 days. Cell viability in the presence of the drugs was evaluated using calcein AM, which stains live cells (4 mM stock, Invitrogen, Waltham, MA) and causes viable cells to emit green fluorescence. The stain solution was prepared by adding 1.0 µL of calcein AM (4 mM stock, Invitrogen) to 8 mL of staining buffer (MBD-STA50, Medical & Bio Device). After staining, the alginate spots containing the colonies were dipping into wells containing 50 μL of staining buffer. The combined 384-pillar/well plates were sealed using tape to prevent evaporation. Under wet conditions, 40 images with a 15.1 μm interval on the z axis in all 384 alginate spots were captured using a confocal microscope (Advanced Nikon-A1), and 3-D colonies were reconstructed to calculate colony volumes. Subsequently, the alginate spots on the 384-pillar plate were dried. Images of the dried alginate spots were obtained using an automated optical fluorescence scanner (ASFA Scanner ST, Medical & Bio Device).
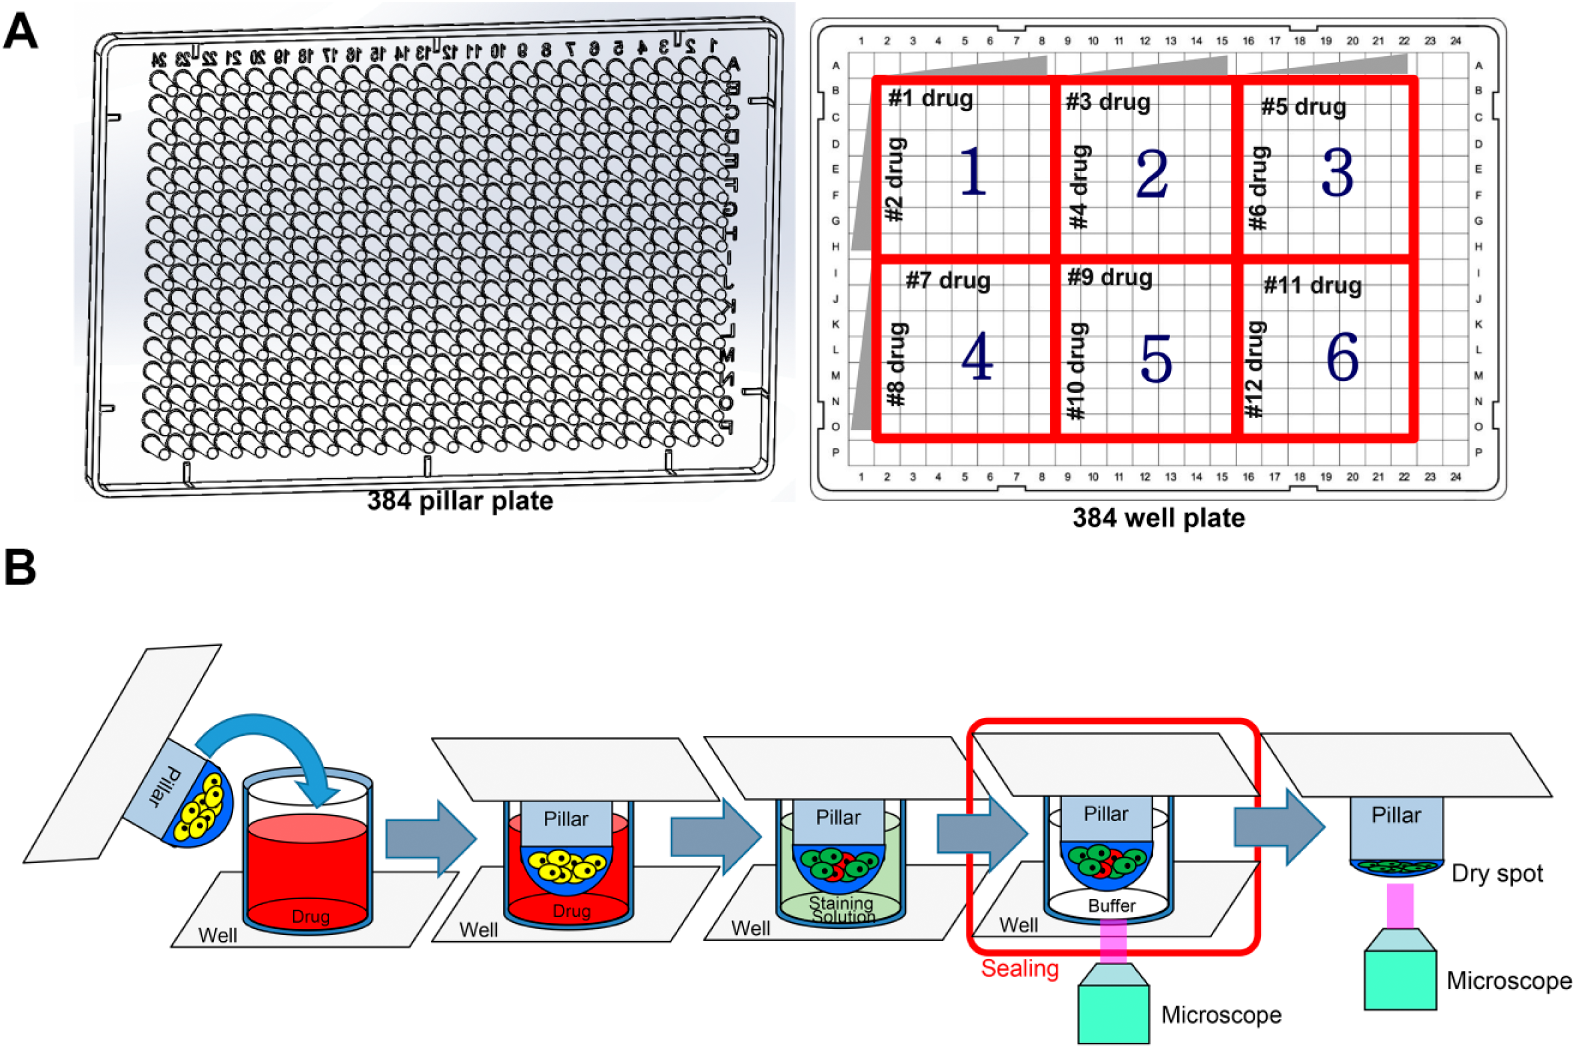
Schematic view of plate layout and experimental procedures for the drug efficacy test. (
Dose–Response Curve and IC50 Calculation
Cell viability values were normalized to those calculated from their corresponding control wells (no drug treatment). Sigmoidal dose–response curves (variable slope) and IC50 values (i.e., concentration of compound at which cell growth is inhibited by 50%) were obtained using the following equation:

where IC50 is the midpoint of the curve, nH is the hill slope, X is the logarithm of the compound concentration, and Y is the response (cell viability). The ASFA Scanner ST (Medical & Bio Device) software sets Bottom as zero and Top as 100% when data are fit to the curve.
Results and Discussion
As proof of concept, KATO III cells were cultured in 3-D for 1 day, and treated with drugs for 4 days. After staining for identifying live cells, the alginate spots containing 3-D colonies were dipped in the staining buffer, and the plates were sealed. 3-D images of colonies in each pillar were obtained. Then, the alginate spots were dried, and 2-D images of colonies in the dried alginate spots in each pillar were measured similarly. Using the 3-D and 2-D images of the colonies in the same 384-pillar plate, we compared cell viability values calculated from the area and volume of the colonies in the dried and wet alginate spots, respectively, and analyzed the effects on dose–response curves and IC50.
Cell viability values were calculated from the 3-D and 2-D images of the dried and wet alginate spots, respectively, as shown in Figure 3 . Figure 4A shows the comparison of cell viability between the 2-D and 3-D images. Generally, the viability values of the dried spots were higher than those of the wet spots. The viability values of the wet spots were calculated using colony volume. We consider that the 3-D volume ratio between the drug-treated and control spots was larger than the 2-D area ratio. For example, if the radius of the sphere was two times bigger, the area of the sphere was four times bigger, whereas the volume of the sphere was eight times bigger. Therefore, the viability values calculated using colony volume in the wet spots were more sensitive than those calculated using colony area in the dried spots. Figure 4B,C shows the viability distribution in the dried and wet spots, respectively. The viability values of the wet spots were 30% on average, while the viability values of the dried spots were distributed in 30%–70%.
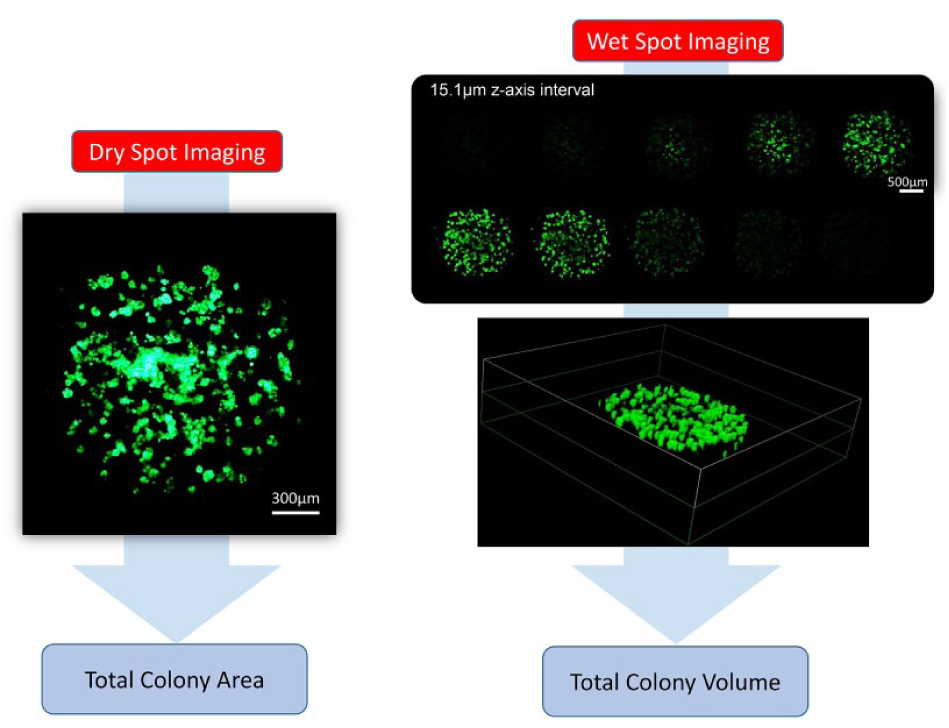
The cell viability calculations based on the total colony are from the dried and wet spots. In the case of wet spot, z-axis-stacked images are reconstructed for 3-D imaging to calculate colony volume.
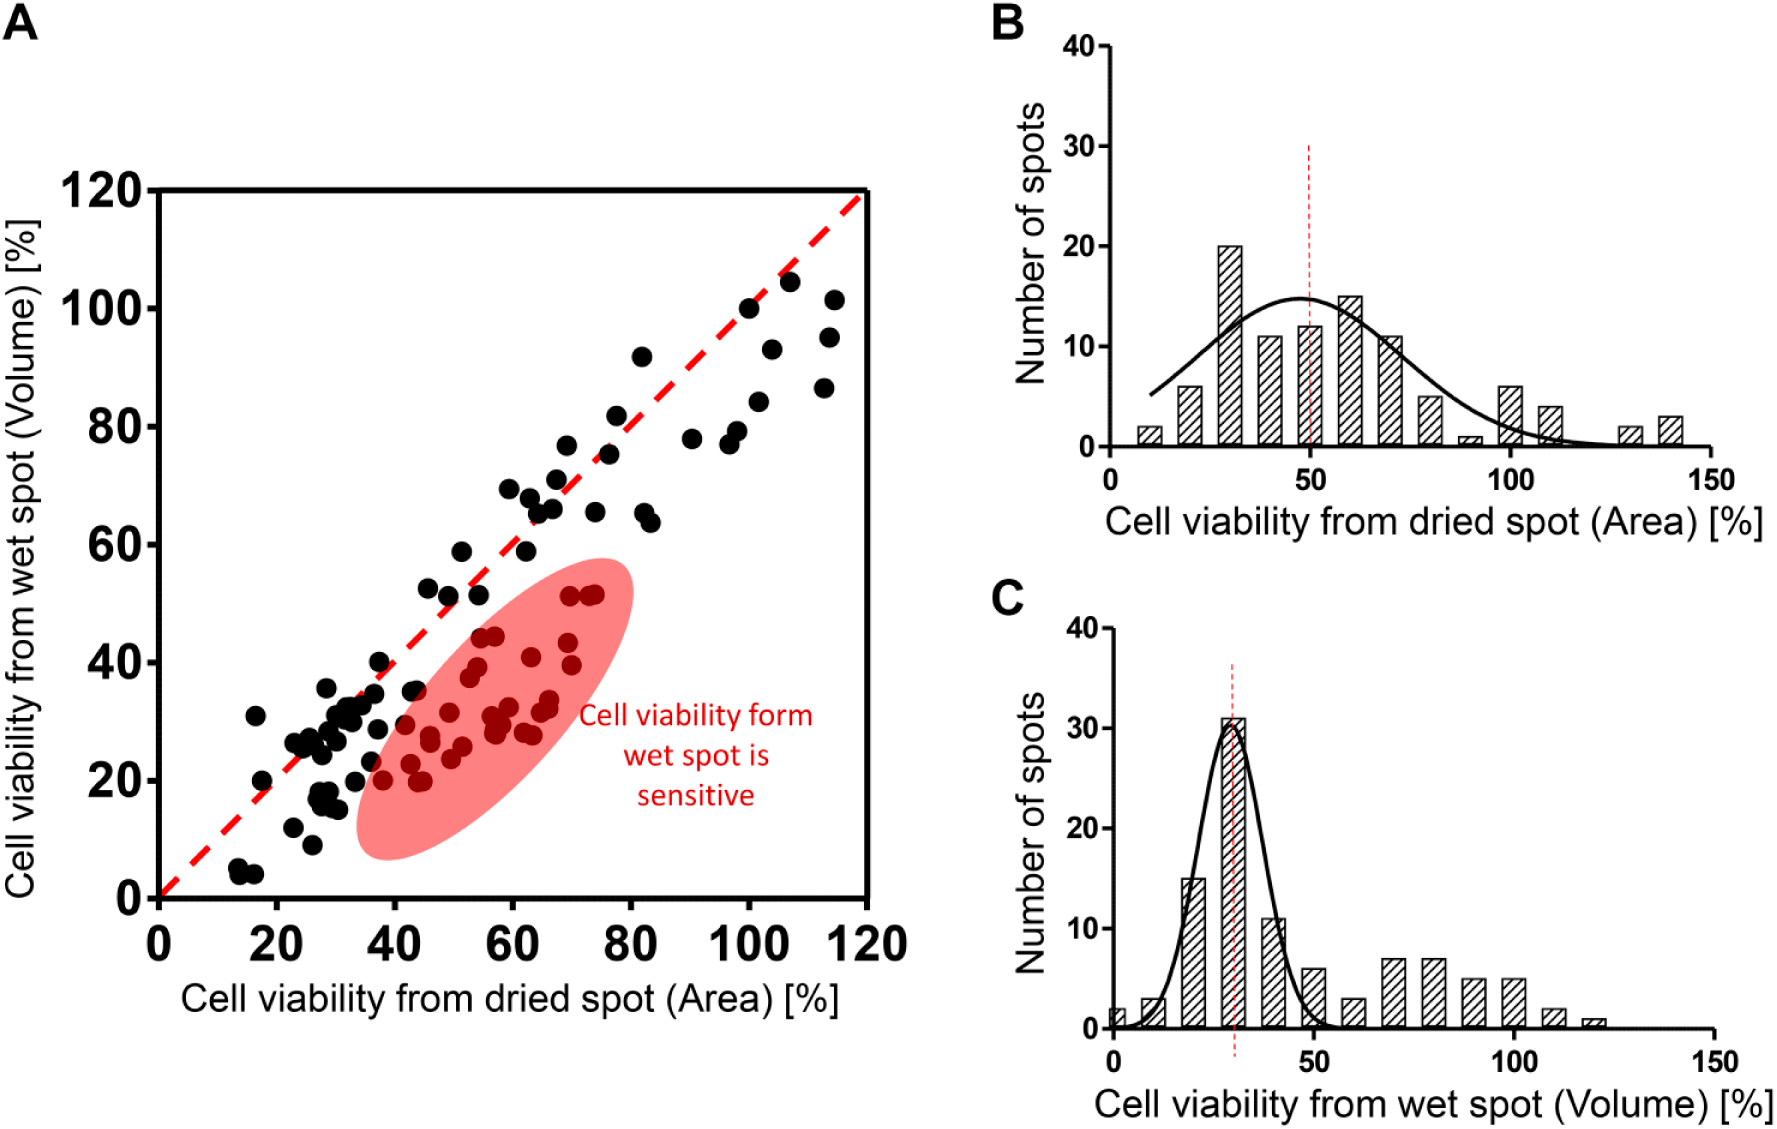
Comparison of the cell viability from dried and wet spots. (
Figure 5 shows two representative dose–response curves. The dose–response curves show cell viability values according to drug concentration. The cell viability values were calculated using colony area and volume in the 2-D and 3-D analyses, respectively. For AZD2281, the dose–response curves obtained from the 2-D and 3-D analyses were shown to be similar. The IC50 values in 2-D and 3-D cultures were 8.2 and 11.7 μM, respectively. However, for AZD6624, the difference in viability between the dried and wet spots was larger than that for AZD2281. The slope of the dose–response curve was steeper for the wet spot than for the dried spot. For the wet spot, the IC50 was 9.5 μM, which was less than that for the dried spot (121.5 μM). This indicated that the wet spot was more sensitive to the drug than the dried spot.
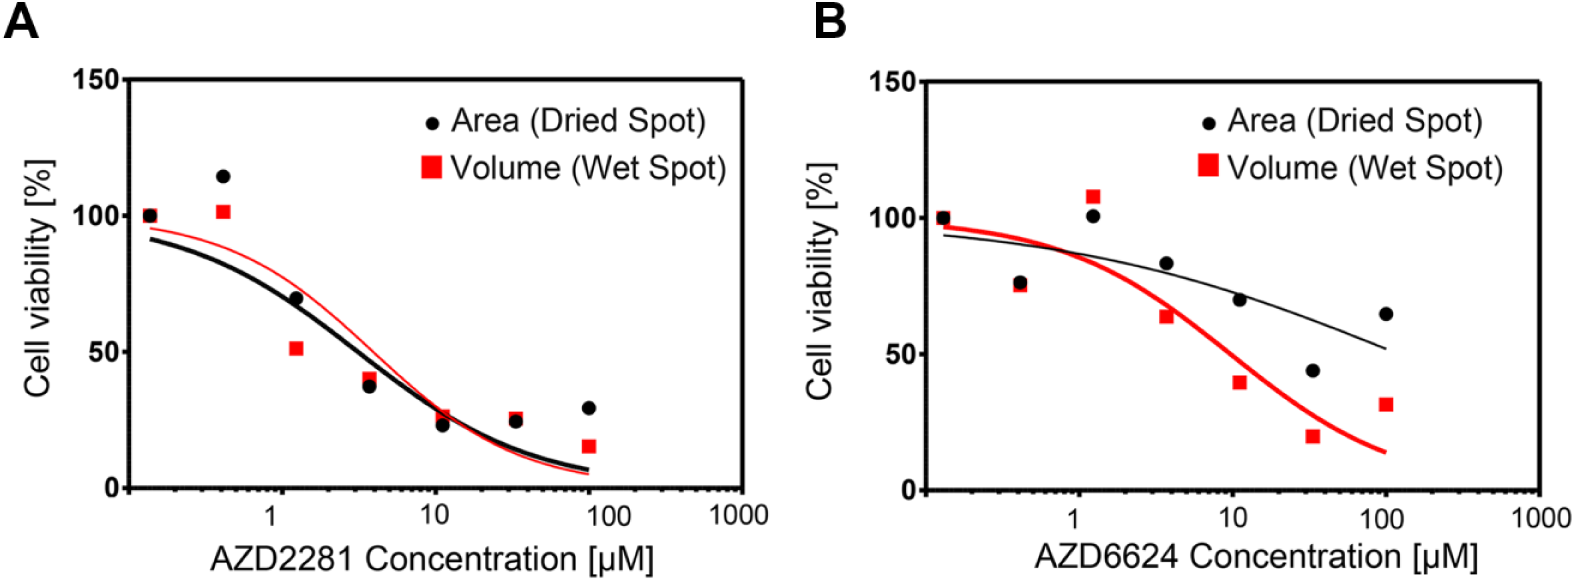
Dose–response curves of (
In this study, we experimentally compared the cell viability values calculated using the area (2-D) and volume (3-D) of the colonies in the same alginate spot. We observed that the colony volume calculated from the 3-D image reconstructed using several confocal images showed a more sensitive drug response than the colony area calculated in the 2-D analysis. We observed that the colony showed a more sensitive drug response regarding volume calculated from the 3-D image reconstructed using several confocal images than that regarding colony area calculated in the 2-D analysis. However, there was a strong need for reducing the time required for obtaining multiple images and calculating volume in the 3-D volumetric analysis. The time for imaging and volume calculation exceeded 3 min per well. In the 384-pillar/well plate, 19.2 h was required, while 20 min was sufficient for imaging and analysis of the dried spot.
Footnotes
Declaration of Conflicting Interests
The authors declared no potential conflicts of interest with respect to the research, authorship, and/or publication of this article.
Funding
The authors disclosed receipt of the following financial support for the research, authorship, and/or publication of this article: This research was supported by the Bio & Medical Technology Development Program of the National Research Foundation (NRF) funded by the Korean government, MSIT(NRF-2015M3A9A7029725) and by the NRF grant (2014R1A2A1A11053135). This research was also supported by the X-mind Corps program of the NRF funded by MSIT(2017029990).