
Abstract
Autotaxin (ATX) is a promising drug target for the treatment of several diseases, such as cancer and fibrosis. ATX hydrolyzes lysophosphatidyl choline (LPC) into bioactive lysophosphatidic acid (LPA). The potency of ATX inhibitors can be readily determined by using fluorescence-based LPC derivatives. While such assays are ultra-high throughput, they are prone to false positives compared to assays based on natural LPC. Here we report the development of ultrafast mass spectrometry–based ATX assays enabling the measurement of data points within 13 s, which is 10 times faster than classic liquid chromatography–mass spectrometry. To this end, we set up a novel in vitro and whole-blood assay. We demonstrate that the potencies determined with these assays are in good agreement with the in vivo efficacy and that the whole-blood assay has the best predictive power. This high-throughput label-free approach paired with the translatable data quality is highly attractive for appropriate guidance of medicinal chemists for constructing strong structure-activity relationships.
Introduction
Autotaxin (ATX, ENPP2) is an ectonucleotide pyrophosphatase/phosphodiesterase that was discovered as a cell survival factor that also stimulates tumor cell motility. 1 It catalyzes the hydrolysis of lysophosphatidyl cholines (LPCs) into lysophosphatidic acids (LPAs) and choline ( Fig. 1A ).2,3 Since the fatty acid moieties of LPC substrates have different chain lengths and saturation patterns, ATX activity produces a spectrum of bioactive LPAs. In turn, LPAs stimulate G-protein–coupled receptors (LPAR1–6) that affect important cellular responses (e.g., cell proliferation, differentiation, survival) and physiological processes (e.g., brain development, blood vessel formation, vascular permeability, and muscle contraction). 4 In addition, ATX is thought to play an important pathophysiological role in the development of diseases such as cancer, fibrosis (liver, kidney and lung), arthritis, multiple sclerosis, and obesity. 5 Consequently, ATX is considered an attractive target for drug discovery programs. Initial chemical matter was based on phospholipid derivatives. 6 The determination of the ATX structure and the development of fluorescence-based high-throughput screening (HTS) assays have increased the diversity of chemical starting points for ATX inhibitors.7–9
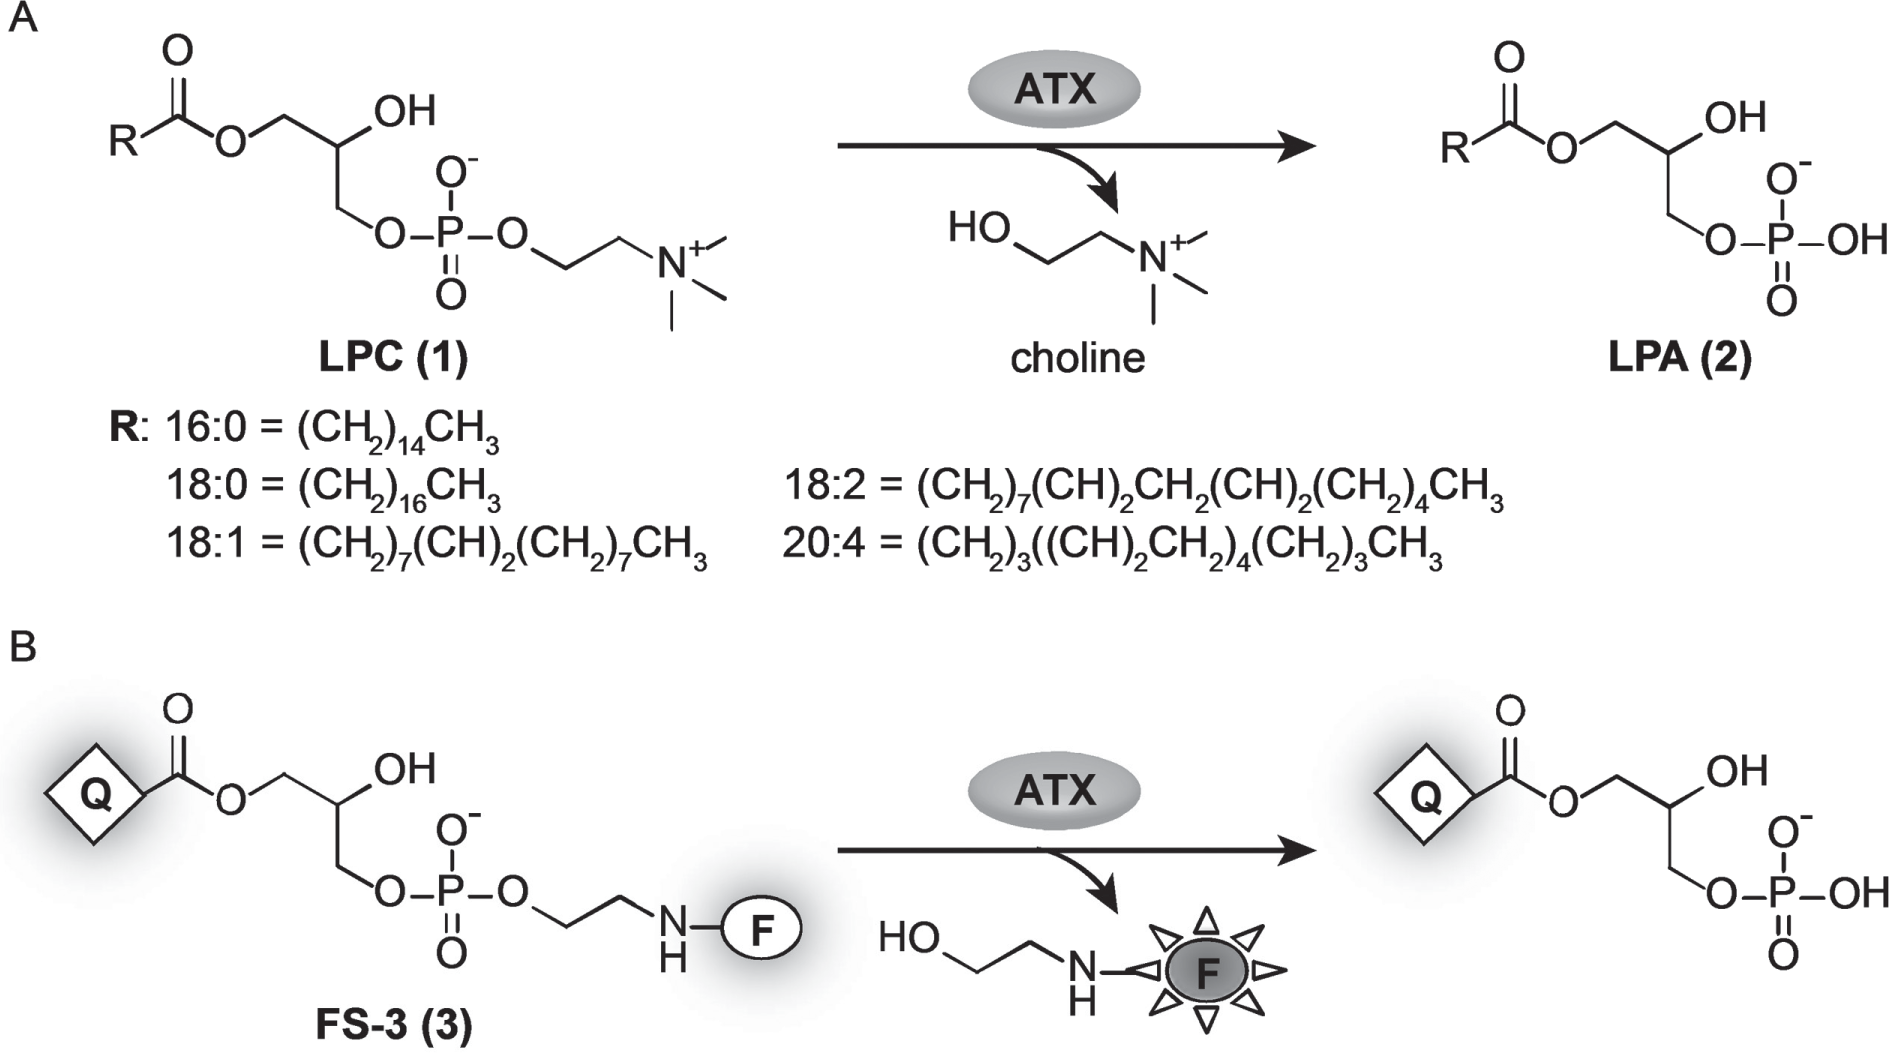
Lysophospholipase reactions catalyzed by autotaxin (ATX). (
Translating HTS “hits” into drug candidates requires screening cascades of predictive assays with the appropriate throughput for testing new compounds. To this end, several variants of high-throughput assays have been developed, with the FS3-based assay being the most widely used.3,10–15 This artificial substrate surrogate is cleaved by ATX, releasing a fluorescence signal, which can be easily monitored and used to quantify ATX activity ( Fig. 1B ). Despite being widely used, the artificial FS3 substrate has some significant limitations, which can result in misleading data and poor correlation with more physiologically relevant assays. As recently demonstrated, the enzyme kinetic for FS3 is different from the kinetics of LPCs, and the hydrolysis of FS3 by ATX presumably results in major conformational changes of the enzyme. 12
Pivotally, several series of highly potent ATX inhibitors discovered via a FS3-based HTS assay were shown to be considerably less potent in a mass spectrometry (MS)–based setup using the natural LPC substrate. 11 In the course of screening for ATX inhibitors, we have observed similar discrepancies. Therefore, the capability to determine the IC50 potency of ATX inhibitors in a high-throughput orthogonal assay using natural substrates is highly desirable. Saga et al. 16 recently addressed this issue by reporting the development of a plasma assay using the endogenous ATX activity and LPC substrates. The change in LPA levels by ATX inhibition was monitored by MS, allowing the determination of inhibitor potencies with physiological substrates. However, this procedure requires a 2.5-min liquid chromatography (LC) method to quantify LPAs by MS. 17 While this represents a step forward, throughput is not sufficient to adequately support a drug discovery lead optimization program.
Here, we report the development of a FS3-free in vitro assay using a natural LPC substrate of ATX for the determination of IC50 values. For monitoring the LPA production, we used a RapidFire-based mass spectrometry platform. This fully automated rapid and integrated analysis system (RIAS) provides a fast sample injection, analyte enrichment on a solid-phase cartridge, and MS analysis in the range of a few seconds per sample. 18 Furthermore, we succeeded to set up a label-free plasma and whole-blood assay applying this ultrafast MS technology. The comparison of the assay results revealed that this new assay highly improved the prediction of the in vivo potency of newly discovered ATX inhibitors. The high throughput of these assays is a prerequisite for a successful lead optimization campaign.
Materials and Methods
LPA and LPC species were purchased from Avanti Lipids (Alabaster, AL, USA) or Sigma-Aldrich (Munich, Germany). Solvents and buffer components were supplied from Merck (Darmstadt, Germany ) and Sigma-Aldrich, respectively, and reaction tubes and plates were from Eppendorf (Hamburg, Germany). Heparinized plasma was collected from anesthetized Wistar Han rats by cardiac puncture, from dog and monkey from vena cephalica antebrachii, and from minipig from vena jugularis.
The authors state that they have obtained appropriate institutional review board approval and have followed the principles outlined in the Declaration of Helsinki for all human or animal experimental investigations. In addition, for investigations involving human subjects, informed consent has been obtained from the participants involved.
FS3 Assay
In total, 5 nM recombinant human autotaxin (Cayman Chemicals, Ann Arbor, MI, USA) was prepared in 50 mM Tris buffer (pH 8.0) supplemented with 3 mM KCl, 1 mM CaCl2, 1 mM MgCl2 0.14 mM NaCl, and 0.1% bovine serum albumin. First, 2.5 µL/well of test compound (10 µM to 0.1 nM final concentration) was transferred into a 384-deep-well plate followed by the addition of 20 µL/well enzyme solution. The enzymatic reaction was started by addition of 2.5 µL 10 µM FS3 (Echelon Biosciences, Salt Lake City, UT, USA) solution. After a 1-h incubation at room temperature, the fluorescence signal was monitored by an EnVision reader (PerkinElmer, Waltham, MA, USA
In Vitro Assay
Rat ATX of in-house origin or human ATX (Cayman Chemicals) at a 5-nM concentration was used. The buffer components, used volumes, and concentrations of ATX and the inhibitors were analogous to the FS3 assay. Subsequently, the biochemical reaction was started by addition of 2.5 µL 10 µM 18:1 LPC substrate. After a 2-h incubation at room temperature, 20 µL water containing 500 nM 20:4 LPA as internal standard and 100 µL 1-butanol was added for extracting LPA. The plates were sealed immediately after extraction and centrifuged at 4000 rpm, 4 °C, for 2 min. The resultant upper butanol phase was directly used for injection at the RapidFire system. The formation of 18:1 LPA was monitored by a Triple Quad 6500 (ABSciex, Toronto, Canada).
Whole-Blood Assay
Rat or human heparinized whole blood was freshly collected prior to use. A serial dilution of ATX inhibitors (0.12 nM to 100 µM) was prepared in phosphate-buffered saline and a 5-µL aliquot was transferred into a 96-deep-well plate containing 45 µL heparinized whole blood. The mixture was incubated for 1 h at 37 °C in an incubation oven (Eppendorf). The reaction was stopped by addition of 100 µL 40 mM disodium hydrogen phosphate buffer containing 30 mM citric acid (pH 4) and 1 µM 17:0 LPA (internal standard). The LPAs were extracted by addition of 500 µL 1-butanol, followed by 10-min centrifugation at 4000 rpm, 4 °C, in an Eppendorf 5810R centrifuge. Finally, a 200-µL aliquot of the organic supernatant was transferred by a pipetting robot (Microlab STAR, Hamilton, Switzerland) into the 96-deep-well measurement plate, which was subjected to the RapidFire measurement.
LPA Extraction from Plasma Samples
LPAs from plasma samples were extracted by establishing a modified procedure as recently reported by Scherer et al. 17 Briefly, 35 µL plasma was mixed with 200 µL 40 mM disodium hydrogen phosphate buffer containing 30 mM citric acid (pH 4) and 1 µM nonendogenous 17:0 LPA (internal standard). Then, 500 µL 1-butanol was added and the 96-deep-well plate was sealed with easy peel foil (Thermo Scientific, Darmstadt, Germany) and shaken vigorously for 10 min on a monoshake (Thermo Electron, Karlsruhe, Germany). Subsequently, the plate was centrifuged in an Eppendorf 5810R centrifuge equipped with a swinging bucket rotor (A-4-62) and with a 96-well plate carrier at 4000 rpm, 4 °C, for 10 min. Afterward, 500 µL of the upper phase was transferred to a 96-deep-well plate with a pipetting robot (Microlab STAR). For RapidFire-based measurements butanolic supernatant was directly subjected to the measurement. For LC-MS–based analysis the butanol was evaporated by an ultravap (Porvair, King’s Lynn, UK) with a 60 °C heated nitrogen flow of 15 psi for 45 min. The residual was dissolved in 100 µL ethanol prior to LC-MS analysis.
IC50 potencies from in vivo studies were determined by plotting the LPA concentration as a function of the compound exposure on a logarithmic abscissa (for data, refer to
LC Analysis
For validation of the results determined with the RapidFire system, a recently reported high-performance liquid chromatography (HPLC) method was applied. 17 An Agilent 1290 LC system (Agilent, Santa Clara, CA) was equipped with a CTC autosampler and an Atlantis 50 × 2.1-mm, 3-µm HILIC LC column (Waters, Elstree, UK). Mobile phase A contained 0.2% formic acid and 50 mM ammonium formate in water, whereas mobile phase B consisted of 0.2% formic acid in acetonitrile. The LC gradient started from 95% solvent B and decreased within 1.5 min to 75% and within 0.2 min to 50% solvent B, with a further increase in the flow rate from 500 to 700 µL · min−1. At 1.8 min, solvent B was set back to 95% and stayed constant for 0.7 min.
RapidFire Analysis
An API 6500 mass spectrometer (ABSciex) was equipped with a binary pump (Agilent 1290), a RapidFire sample injector (Agilent), and a plate hotel (in-house solution). This hardware setup is controlled by an in-house developed LabView-based master software. For a detailed hardware description, see Luippold et al. 18 The measurement started by aspiration of the sample by a vacuum at −35 kPa. Filling of the 10-µL loop was monitored by a sip sensor, resulting in an aspiration time of approximately <1 s. Afterward, the sample was flushed onto a 5-µm Waters Atlantis HILIC cartridge (Waters, Elstree, UK) with 90% acetonitrile containing 10 mM ammonium acetate (eluent A) at a flow rate of 3 mL· min−1. The LPAs were retained on the stationary phase, and matrix components and contaminants were removed by washing the cartridge for 6 s. By applying a step elution for 3 s with 40% acetonitrile containing 10 mM ammonium acetate (eluent B) in back flush mode at a flow rate of 1.5 mL · min−1, the analytes were submitted to the mass spectrometer. Subsequently, the cartridge was reequilibrated with eluent A for 1 s at a flow rate of 1.25 mL · min−1. The chromatograms were recorded by Analyst 1.6.2 (ABSciex) and DiscoveryQuant 2.3 (ABSciex).
After equilibration of the RapidFire-MS system, the analyte carryover was determined by three injections of 1 µM LPA spiked in assay solution (a), followed by three blank sample injections (b) (assay solution without LPA). Subsequently, the ratio between (b) and (a) was calculated to determine the carryover. Instrument conditions were accepted at a ratio of <0.05.
MS Parameters
An API 6500 (ABSciex) mass spectrometer was used for all analyses (RapidFire, conventional LC). The MS was operated in negative mode with a source temperature of 300 °C, cad gas = 50, gas 1 = 60, and gas 2 = 60. Transitions and MS parameters (DP: declustering potential and CE: collision energy) for the LPAs were determined: 18:2 LPA, 433.2/152.8, DP = −150, CE = −28; 20:4 LPA, 457.2/152.8, DP = −100, CE = −29; and 17:0 LPA, 423.5/152.8, DP = −100, CE = −36.
IC50 Value Determination
The MS traces recorded by the RapidFire system were evaluated by GMSU 8.4.14. The resultant peak areas were imported into AssayExplorer 3.2 (Symyx, San Diego, CA, USA). For determination of IC50 values, a sigmoidal Hill equation was applied.
Results and Discussion
Label-Free Determination of IC50 values from In Vitro Samples
High-throughput in vitro assays, predictive for in vivo target engagement, are important in screening cascades of a drug discovery program for the data-driven selection of compounds that are worth progressing. As reported, the FS3-based assay was an effective ATX “hit-finding” screen but was prone to false positives and had limited predictive value compared to more physiologically relevant assays.11,12 Since false-positive ATX inhibitor potencies could be misleading in the selection of chemical series, it was essential to develop a label-free assay.
For the frontline biochemical assay, we set up a classical enzymatic reaction by using 18:1 LPC as a substrate and detected the ATX-dependent production of pathophysiologically relevant 18:1 LPA via mass spectrometry ( Fig. 1A ). Previously described HILIC-based LC methods require 2.5 min per sample, 17 which represents a significant bottleneck for assay throughput and an inefficient use of precious mass spectrometry time.
RapidFire-Based Analysis
To provide a remedy for the throughput limitation of the published MS-based assay, one can apply multiplexed LC-MS systems or RapidFire platforms to reduce the analytical timeframe per sample to seconds. We decided on an automated RapidFire system, which delivers a fast sample injection using an online solid-phase extraction (SPE) cartridge instead of a conventional HPLC column. For a detailed hardware description, refer to Luippold et al. 18 Briefly, in this platform, the sample is aspirated by vacuum onto a sample loop and is flushed for a quick SPE onto a small cartridge to enrich the analytes. A flush of solvent A (90% acetonitrile, 10 mM ammonium acetate) for a few seconds removes signal-decreasing contaminants. A subsequent back flush with the elution solvent B (40% acetonitrile, 10 mM ammonium acetate) delivers the analytes into the MS (for principle, see Fig. 2A ). Finally, the SPE cartridge is equilibrated for another few seconds with solvent A. We used an HILIC material as a stationary phase for the SPE to retain the LPAs. The fast switch of the RapidFire valves allows the repetitive sample injection in the range of seconds, which in this case drastically speeds up the analysis time by more than 10-fold.
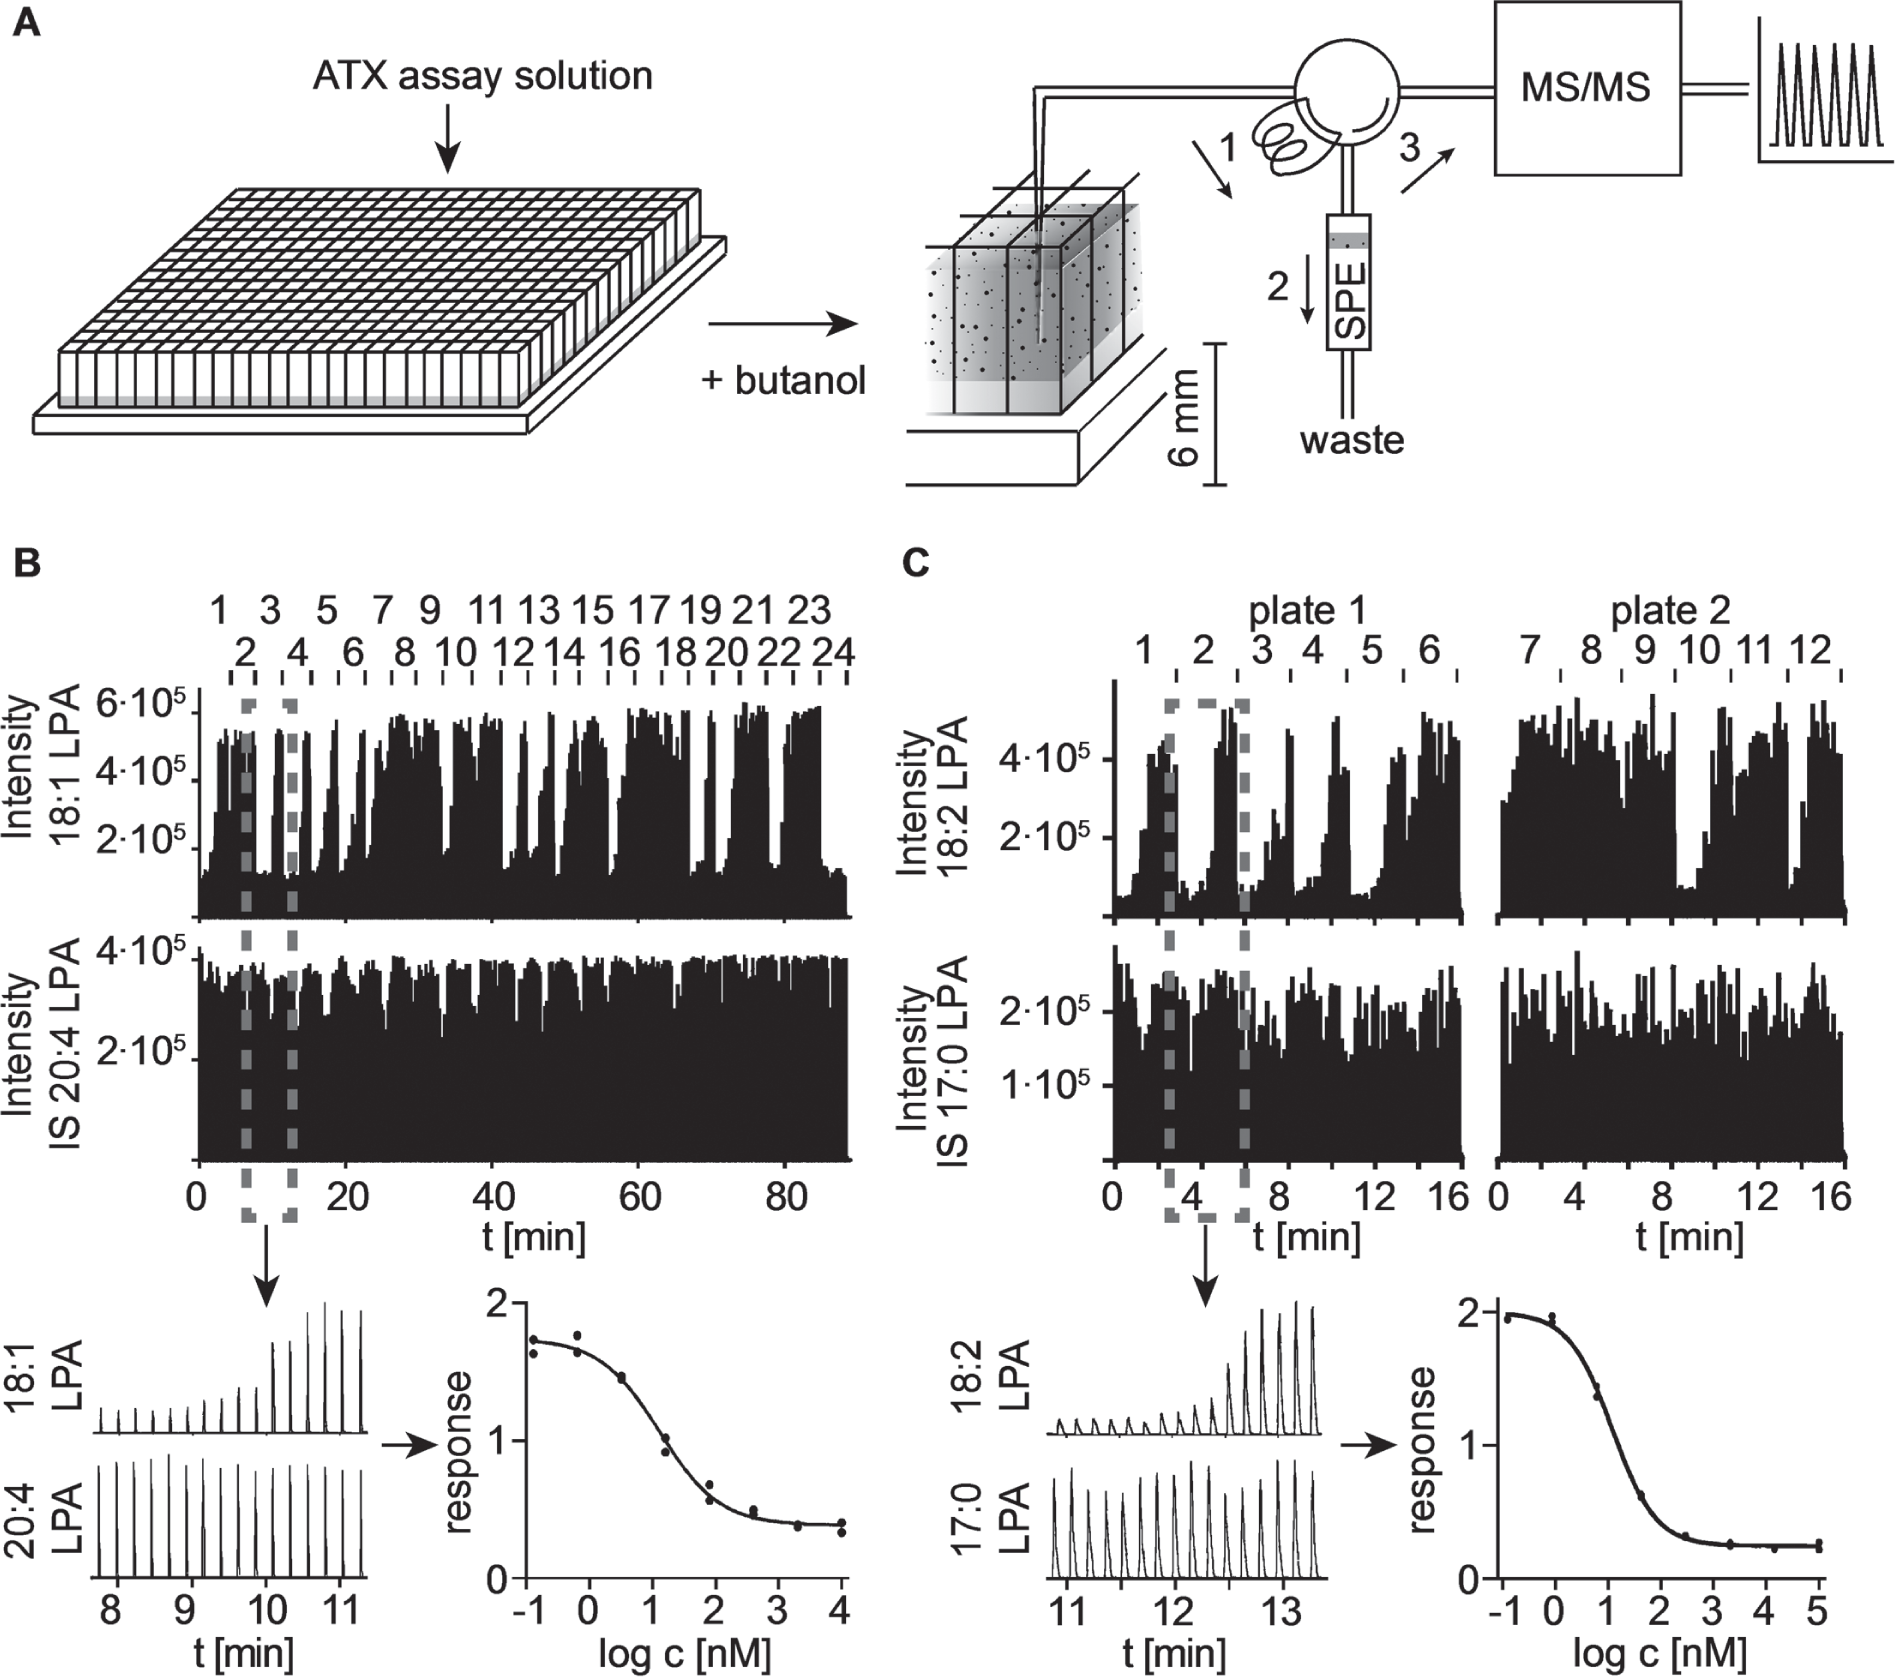
Assay workflow and representative RapidFire results for determination of IC50 values of autotaxin (ATX) inhibitors. (
One inherent and important difference between the FS3 fluorescent-based assays and the mass spectrometry methods is the time required to prepare samples for analysis. The optimization and ease of sample preparation were crucial for building a label-free assay to support the ATX inhibitor discovery. This was challenging, as the LPC/LPA ratio is unstable due to analyte decomposition during sample workup. Initially, the biochemical assay was stopped by the addition of acetonitrile for protein precipitation followed by centrifugation. This approach allowed the direct sample injection of the mostly organic supernatant onto an HILIC cartridge. However, after multiple injections, a poor signal shape was observed with an unacceptable analyte carryover (>30%), resulting in an increase in the back pressure of the SPE cartridge, probably due to the enrichment of salts from the assay solution. Previous protocols that were developed for extracting LPAs from plasma samples disclosed difficulties with analyte recovery and assay stability.19–21 A milestone was the recently established twofold butanolic extraction by previous mild acidification of the samples.17,22 For the purpose of LPA detection in our assay, we simplified this protocol by applying a one-step extraction. To 25 µL of the assay solution, 20 µL of 20:4 LPA was added as internal standard (ISTD). The enzymatic reaction was stopped by addition of 100 µL 1-butanol, allowing the transfer of the LPAs into the organic phase. Subsequent centrifugation separated the water and organic phase. This streamlined sample preparation process can be performed in 3 to 5 min per 384-well plate.
Afterward, the upper butanolic phase was directly loaded onto the HILIC cartridge ( Fig. 2A ). We adjusted the needle penetration height into the 384-well plates by setting the needle height of the sample sipper to 6 mm from bottom to avoid aspiration of proteins and salts from the lower aqueous phase. However, high butanol content reduced the electrospray ionization efficiency when back flushed from the column into the MS, which resulted in a low MS analyte response. Therefore, we increased the solvent flow during the loading process onto the cartridge to 3 mL · min−1 and prolonged the time for washing the cartridge from 3 to 6 s before eluting into the MS. With this adjustment, we achieved high analyte response and acceptable carryover (<5%). Consequently, the time span for analyzing one sample was 13 s, allowing the determination of a single IC50 value in less than 3.5 min (eight different concentrations of the ATX inhibitor in duplicate/IC50). With an automated plate handler, we were able to screen 350 compounds per day on a single RapidFire platform. The conventional LC-MS approach was limited by the long gradient assaying just 30 compounds per day per LC-MS instrument.
The results for a representative run of a 384-well plate executed in 90 min are shown in Figure 2B . Each individual signal is the response of a single injection. In the upper panel, the signals for 18:1 LPA are shown, whereas the lower panel represents the signals for the ISTD 20:4 LPA. The Z′ of this assay was in the range of 0.7 to 0.85 (based on 16 positive and negative control samples), and the variation of the ISTD was below 30%, demonstrating good reproducibility. Samples containing high concentrations of ATX inhibitor sometimes showed an increased quenching of approximately 25% of the analyte signal, which was adequately compensated by the ISTD. The recorded data and the resulting IC50 curve for a representative ATX inhibitor are shown below the raw data ( Fig. 2B , C ).
Furthermore, we confirmed the reproducibility of the method based on the determined IC50 values by repeating the biochemical assay of the same ATX inhibitor set and the RapidFire readout. We observed for the duplicates an overall correlation of R2 = 0.75 ( Fig. 3A ). From the 1282 tested compounds, the deviation of the determined IC50 values was below factor 2 for 76% (n = 973), below factor 3 for 92% (n = 1178), and below factor 5 for 99% (n = 1266). These results demonstrate the high robustness and reproducibility of this assay.
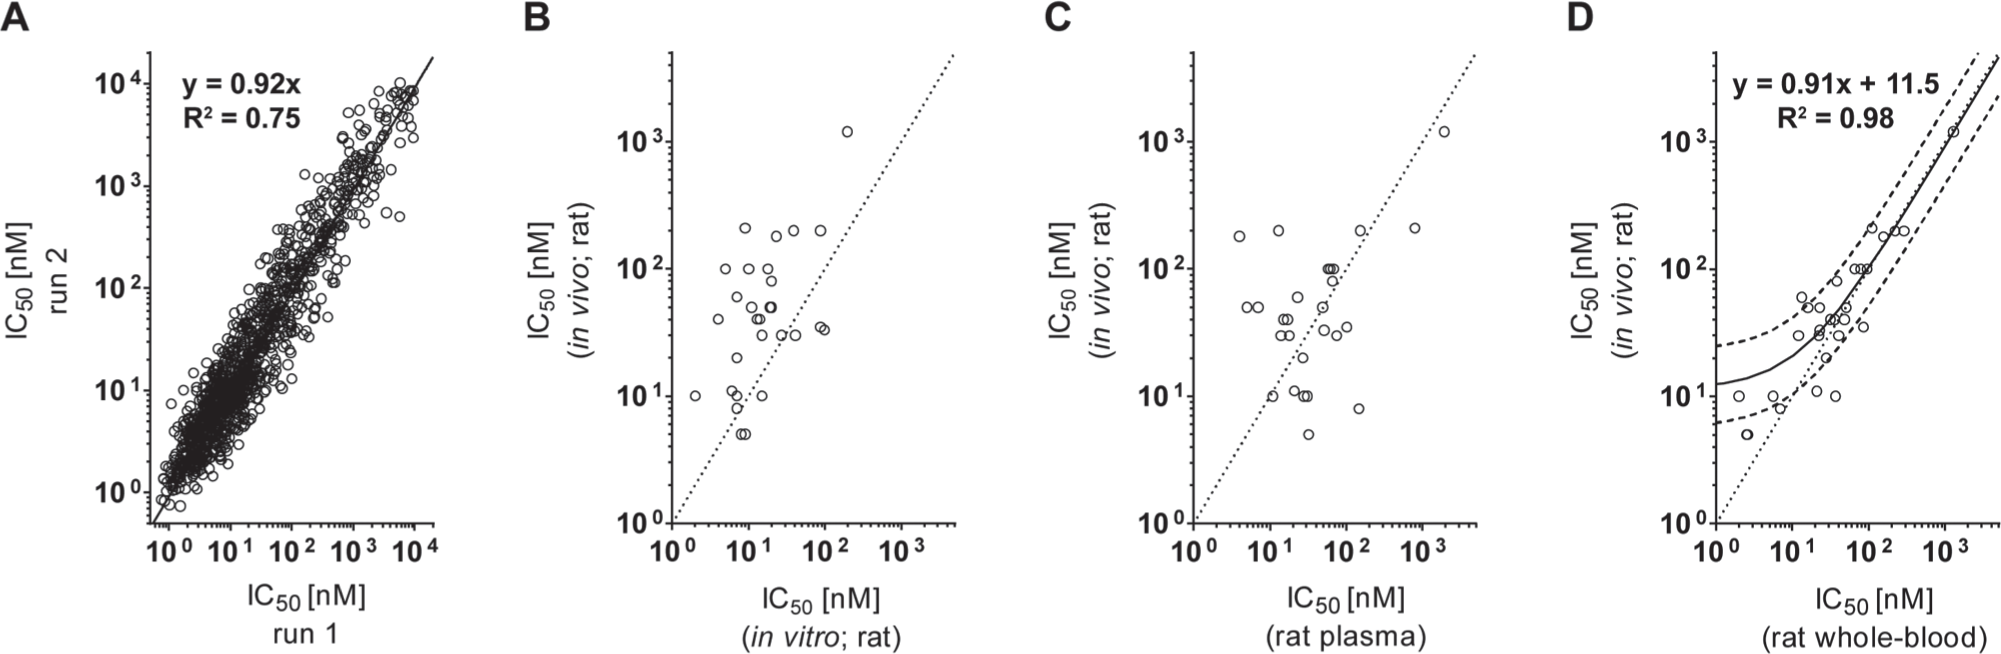
Reproducibility and assay translatability of the autotaxin (ATX) assays. (
Plasma Assay for Compound Profiling
The measured potency of ATX inhibitors in vitro can be highly influenced by assay conditions. For example, buffer salt composition and concentration affect ATX activity and can differentially affect the relative production of specific LPA species. 23
Recently, Saga et al.
16
described a plasma assay that facilitates assay conditions closely related to the in vivo environment. We set up this assay and applied the newly developed RapidFire-based readout to enable the same assay throughput as for the in vitro assay. The reliability of the IC50 values determined using the RapidFire method was compared to the data generated by the conventional LC-MS approach. We established the same LC-MS setup as reported before (see Materials and Methods section).
17
The correlation of both data sets was R2 = 0.99 for 13 tested compounds, in combination with an average deviation of the determined IC50 values of 11.8% (deviation for all IC50 values less than factor 2). The results of the two methods were highly concordant (
An additional benefit of the MS-based assays is the measurement of multiple analytes. ATX hydrolyzes LPCs with various acyl chain length and saturation, which adopt distinct binding configurations within the hydrophobic pocket of ATX.7,24 We were able to track the production of several LPA species (16:0, 18:1, 18:2, and 20:4) in plasma simultaneously. This approach enables one to screen for potential LPA-specific ATX inhibitors.
Translatability of Label-Free ATX Assays
Twenty-nine highly potent ATX inhibitors were assessed in rats for their in vivo potency. After inhibitor administration, plasma was collected at various time points and the change in LPA levels was monitored (
ATX possesses two somatomedin B–like domains (SMB1 and SMB2), which mediate protein-protein interactions, allowing ATX via its SMB2 domain to bind β3 integrin, an integral cell surface protein of platelets. 8 As platelets are absent in the plasma assay, we were interested in inspecting the performance of a whole-blood assay with respect to predicting their in vivo potency.
To this end, we performed an ATX assay in freshly collected heparinized whole blood of rats. The assay was performed in a 96-well format and was successfully transferred to the RapidFire-based analysis to trace LPA (
Fig. 2C
, plate 2). Reviewing the determined whole-blood IC50 values revealed that 25 of the 29 ATX inhibitors deviated less than factor 3 and 4 less than factor 5 from the in vivo potency (
The assay conditions in whole blood are clearly the most adequate for correlating the in vitro with the in vivo data. Although working with freshly collected whole blood is delicate, this assay is very attractive at later stages of inhibitor screening prior to in vivo experiments. To emphasize the value of these ultrafast screening assays, we retrospectively compared the IC50 values of 68 ATX inhibitors determined by the whole-blood assay to that of the old FS3-based in vitro assay (
Whole-Blood Assay Applicability for Preclinical Screenings
Our rat data show that the whole-blood potencies translate into in vivo efficacy. An important consideration in drug development is the species selection for toxicological studies to demonstrate pharmacological activity in the respective species. Therefore, we were interested in applying the whole-blood assay to other preclinical species as well as humans. We assessed the potencies of six ATX inhibitors in rat, dog, minipig, monkey, and human whole blood. For all species tested, we could obtain IC50 potency values (
The ATX-LPA axis has been implicated in a variety of human disease states, including fibrosis and cancer. The establishment of assays that are able to predict the in vivo efficacy is an important prerequisite for early estimation of the human dose. We therefore developed a suite of label-free ATX activity assays using a RapidFire-MS platform, which had sufficient capacity and throughput to support a lead optimization project.
Herein, we describe for the first time a new whole-blood assay, which uses the endogenous enzyme level of ATX together with its substrate LPC. This whole-blood assay showed the best in vitro/in vivo correlation and predictive power. In addition, this whole-blood assay can be applied to other preclinical species and humans, which is important for toxicological species selection as well as human dose estimation.
Apart from ATX, other LPA-producing enzymes are known—namely, phospholipase 2, glycerophosphate acyltransferase, and monoacylglycerol kinase. 26 These enzymes can effortlessly replace ATX in the biochemical assay. Consequently, all assays that are based on LPA as an end point can benefit from this ultrafast readout.
This work demonstrates how ultrafast mass spectrometry can be used as a readout for label-free assays. Furthermore, the applicability of this method can be extended to several other drug targets, including kinases, proteases, and other enzymes.
Footnotes
Acknowledgements
We thank Andreas Barthold for the RapidFire measurements, Susanne Baur and Bernd Guilliard for performing the in vitro and whole-blood assay, and Christina Boch for proofreading the manuscript.
Supplementary material is available online with this article.
Declaration of Conflicting Interests
The authors declared no potential conflicts of interest with respect to the research, authorship, and/or publication of this article.
Funding
The authors received no financial support for the research, authorship, and/or publication of this article.
References
Supplementary Material
Please find the following supplemental material available below.
For Open Access articles published under a Creative Commons License, all supplemental material carries the same license as the article it is associated with.
For non-Open Access articles published, all supplemental material carries a non-exclusive license, and permission requests for re-use of supplemental material or any part of supplemental material shall be sent directly to the copyright owner as specified in the copyright notice associated with the article.