
Abstract
The sirtuin enzymes, a class of NAD+-dependent histone deacetylases, are a focal point of epigenetic research because of their roles in regulating gene expression and cellular differentiation by deacetylating histones and a host of transcription factors, including p53. Here, the authors present two label-free screening methodologies to study sirtuin activity using high-throughput mass spectrometry. The first method involves the detection of native peptides and provides a platform for more detailed mechanistic studies by enabling the concurrent and direct measurement of multiple modification states. The second method obviates the need for substrate-specific assay development by measuring the O-acetyl-ADP-ribose co-product formed by sirtuin-dependent deacetylation. Both methodologies were applied to investigating the deacetylation of multiple-peptide substrates by multiple-sirtuin enzymes. Kinetic data, including binding constants, inhibition, and, in some cases, activation, are demonstrated to correlate well, both between the methodologies and with previous literature precedent. In addition, the ability to monitor sirtuin activity via O-acetyl-ADP-ribose production permits experimentation on whole-protein substrates. The deacetylation of whole-histone proteins by SIRT3, and inhibition thereof, is presented and demonstrates the feasibility of screening sirtuins using more biologically relevant molecules.
Introduction
H
There are seven known mammalian sirtuin enzymes (SIRT1 to SIRT7) that differ with respect to their subcellular localization, observed activities, and substrate specificity. 3 The sirtuin enzymes that typically reside in the nucleus are SIRT1, SIRT6, and SIRT7. The SIRT3, SIRT4, and SIRT5 enzymes are largely described as mitochondrial enzymes, and SIRT2 is predominantly found in the cytoplasm. In terms of activity, SIRT5 and SIRT7 have exhibited, at best, a relatively weak ability to deacetylate lysine residues. Studies on SIRT4 and SIRT6 have largely focused on their ability to transfer the ADP-ribosyl group of NAD+ onto lysine residues of proteins. The remaining sirtuins, SIRT1, SIRT2, and SIRT3, have been studied for lysine deacetylase activity most extensively.
Despite their general characterization as histone deacetylases, SIRTs 1 to 3 deacetylate lysine residues from a wide variety of additional proteins, including Ku70, FOXO transcription factors, p73, and p53. 4 The wide range of cellular activities of sirtuins has suggested that these enzymes could constitute therapeutic targets to combat inflammatory, cardiovascular, proliferative, neurodegenerative, and metabolic diseases.5,6 SIRT1-dependent deacetylation of p53 has received particular attention because p53 was the first nonhistone sirtuin target discovered, multiple lysine residues on p53 can be deacetylated by sirtuins, and the result of such activity can inhibit transactivation activity and suppress apoptosis. 7 As a result of such broad therapeutic potential, a number of in vitro biological assays have been developed to identify compounds that modulate deacetylase activity.
A number of assay formats for measuring deacetylase activity involve the use of radioactivity. One common methodology uses substrate peptides that have been acetylated using radiolabeled acetate. After incubation with a deacetylase, the peptide is isolated and the remaining substrate is quantified on the basis of its radioactive signal. 8 A variant of this approach is a scintillation proximity assay, in which peptides derivatized with radiolabeled acetyl groups are attached to a bead containing scintillant that emits light upon exposure to radiation. In this assay format, removal of acetyl groups by a deacetylase causes a decrease in light emission. 9 A third approach using radioactivity measures the enzyme-catalyzed release of radiolabeled nicotinamide, from the NAD+ cofactor, by using a resin that selectively separates NAD+ from the reaction mixture. 10 Despite the availability of numerous radioactive-based deacetylase assays, however, the associated costs and need for special handling precautions can limit their utility.
Other nonradioactive methodologies for measuring deacetylase activity also exist. One such assay uses high-performance liquid chromatography and exploits the difference in retention time between the acetylated substrate and deacetylated product. 11 Another assay based on the homogeneous time-resolved fluorescence technology uses a cryptate-labeled acetyl-p53 peptide (fluorescence resonance energy transfer [FRET] donor) and a d2-labeled anti-acetyl-p53 antibody (FRET acceptor). 12 In this format, deacetylase activity causes a decrease in FRET signal. A commonly used fluorometric assay format involves a two-step protease-coupled assay protocol that uses a substrate peptide containing a fluorescent tag proximal to the acetylated lysine residue. 13 After the deacetylation reaction is complete, the products are incubated with a developer solution that liberates the fluorescent tag from deacetylated peptides specifically. The subsequent fluorescent signal, therefore, is used to relate the amount of deacetylase activity. Unfortunately, the use of fluorometric substrates such as these has previously been the cause of arduous data artifacts.
In 2003, Howitz and coworkers 14 produced a study in which the activity of SIRT1, as determined using the fluorometric assay described above, was stimulated in the presence of resveratrol, a small-molecule component of red wine. At this time, resveratrol was widely reported to harbor major health benefits through mechanisms yet to be understood. Therefore, multiple groups conducted mechanistic studies on sirtuins to understand this activation effect and potentially extend it for therapeutic application. In subsequent studies, however, the activation of SIRT1 by resveratrol was observed only when the substrate peptide was labeled with the fluorescent tag as in the original studies.15,16 Furthermore, the fluorescent tag on the peptide was determined to impede tight binding with the SIRT1 enzyme, as compared to the unlabeled peptide counterpart, and the presence of resveratrol simply suppressed this destabilization. This inability of resveratrol to stimulate SIRT1 activity on unlabeled substrates in vitro and in vivo has since been confirmed independently17,18 and helped make label-free methods that can circumvent these artifacts particularly attractive.
The research presented here describes two label-free methods for measuring sirtuin activity on native substrates using the RapidFire mass spectrometry (MS) platform, which is a microfluidic liquid handler that performs ultra-fast, online sample preparation using a solid-phase extraction cartridge to purify and desalt the analytes of interest from biological reactions before sending them to a mass spectrometer for detection. In the first method, the ability to measure sirtuin activity ( Fig. 1 ) directly by monitoring the substrate and product peptides is demonstrated. Using this detection method to study SIRT1, SIRT2, and SIRT3 reactions, linear conversion ranges were established, binding constants for the peptide and NAD+ co-substrates were determined, and activity inhibition by nicotinamide was validated. In further experiments, the method of monitoring the peptide species was extended to include a p53 peptide substrate that contained three acetylated lysine residues. For these experiments, the four possible acetylation states (3ac, 2ac, 1ac, and 0ac) were monitored discretely and concurrently, illustrating a clear advantage of the high-throughput solid-phase extraction tandem mass spectrometry (HT-SPE/MS) system in its application to measuring reactions with multiple conversion events. Last, to test the ability of the peptide-based method to replicate the substrate-dependent activation of SIRT1 by resveratrol described above, reactions containing either unlabeled or fluorescently labeled peptides were analyzed by HT-SPE/MS. As reported previously, SIRT1 activity was enhanced by resveratrol only in reactions containing the labeled substrate and further validates the method described here to accurately represent inhibition and activation of sirtuin activity.
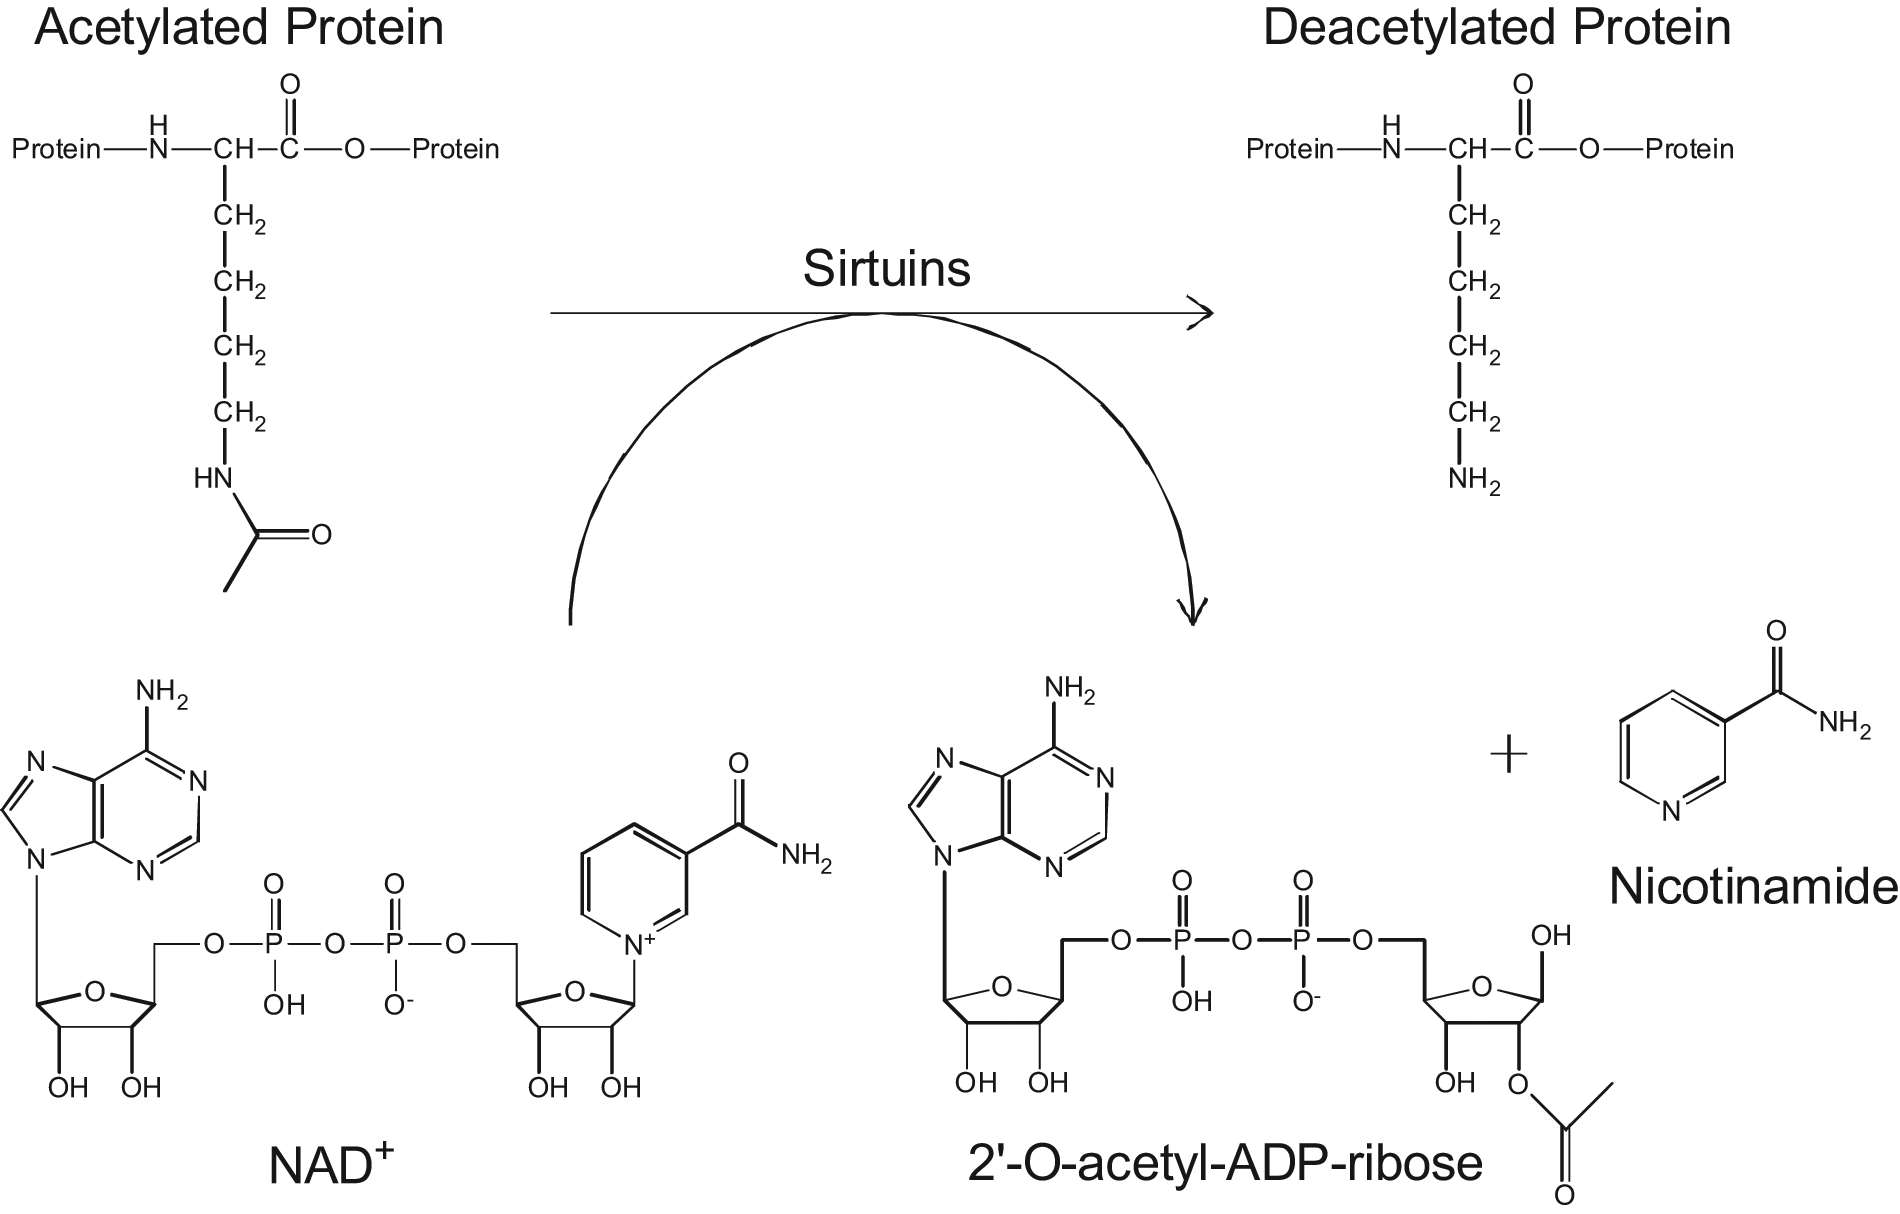
Reaction scheme of protein deacetylation by sirtuins. The acetyl group on lysine residues can be removed by sirtuin enzymes in a reaction that is dependent on NAD+. Reaction products include the deacetylated protein, O-acetyl-ADP-ribose, and nicotinamide molecules, providing a multitude of species to quantify for studying the reaction directly.
The second method we describe uses HT-SPE/MS to measure the O-acetyl-ADP-ribose (OAADPr) co-product formed by sirtuin-dependent deacetylation ( Fig. 1 ). Direct detection of this co-product is used, as in the case for the first method, to characterize the reactions between multiple sirtuin enzymes on multiple peptide substrates. Direct comparison of the kinetic data acquired using the two methods displays good correlation, both between the methods and with previous literature precedent, and establishes OAADPr detection as a versatile method for studying sirtuin deacetylation. Furthermore, because this assay format circumvents the need for substrate-specific methods, experimentation on whole-protein substrates was permitted. Measuring the deacetylation of whole-histone proteins by SIRT3, and inhibition thereof, is presented here and further validates the utility of the HT-SPE/MS platform to screen sirtuins using biologically relevant molecules.
Materials and Methods
Reagents
Enzymes were obtained from either Blue Sky Biotech, Inc. (Worcester, MA) or Enzo Life Sciences (Plymouth Meeting, PA). Unless noted otherwise, the SIRT1 (5 units/µL), SIRT2 (25 units/µL), and SIRT3 (7 units/µL) enzymes from Enzo Life Sciences were used. Calf thymus histones, β-nicotinamide adenine dinucleotide (NAD+), suramin sodium, ADP ribose (ADPr), resveratrol, and nicotinamide were from Sigma Aldrich (St. Louis, MO). The acetyl-p53 peptide (TP53 Q9NP68, p53 Mutant Form [372–389] Lys382, KKGQSTSRHK-KAc-LMFKTEG) was from Anaspec (Fremont, CA), whereas the acetyl-histone 4 (Lys 16) peptide (SGRGKGGKGLGKGG-A-KAc-RHRC) was from Millipore (Billerica, MA). The TAMRA-labeled peptide and its unlabeled counterpart (Ac-EE-K(biotin)-GQSTSSHSK(Ac)-Nle-STEG-K(5-TAMRA)-EE-NH2 and Ac-EE-K(biotin)-GQSTSSHSKAc-Nle-STEGKEE-NH2) as well as a triply-acetylated p53 peptide (KKGQSTSRH-KAcKAc-LMF-KAc-TEG) were synthesized by Biopeptide (San Diego, CA). OAADPr was synthesized enzymatically in-house. All other general biochemical reagents were obtained from Sigma-Aldrich or Fisher Scientific (Pittsburgh, PA).
MS optimization
Analytes of interest (peptides and ADPr) were each diluted to a concentration of 1-2 µM into 1:1 ethanol:doubly-distilled water (ddH2O) containing 0.1% formic acid and infused at ~30 µL/min into a triple-quadrupole mass spectrometer operating in positive electrospray ionization mode. Each analyte’s preferred charge state in Q1 was found (parent ion), along with a specific Q3 fragment (daughter ion) that was chosen to maximize signal in multiple-reaction monitoring (MRM) mode. All other MS parameters were individually optimized for each molecule.
MS conditions for OAADPr were determined from analysis of a SIRT1 (enzyme from Blue Sky Biotech, Inc.) reaction mixture after desalting on the RapidFire SPE system. Initial parameters were chosen based on results from the similar ADPr molecule and optimized for OAADPr over a series of injections.
SIRT reactions
SIRT1 reactions with acetyl-p53 peptide were carried out at room temperature in a 25-µL volume in a standard 96-well assay plate. Reaction buffer consisted of 50 mM Tris (pH 7.5), 137 mM NaCl, 2.7 mM KCl, 1 mM MgCl2, and 0.05% bovine serum albumin (BSA). NAD+ was present at 1 mM (enzyme titration time course and substrate titration); 1 mM, 333 µM, 111 µM, or 37 µM (NAD+ titration); or 100 µM (nicotinamide IC50). Enzyme was added at a 1/300, 1/1500, or 1/7500 dilution for the enzyme titration experiment and a 1/1500 dilution for all other experiments. IC50 plates were prespotted with nicotinamide (2 µL of a 25× stock in ddH2O). Reactions were initiated by the addition of a 1/10th volume of 10× peptide substrate (1, 3, 10, or 30 µM final concentration for the substrate titration; 10 µM for all other reactions) and quenched with a 3× volume of 1% formic acid already containing 10 nM ADPr as an internal standard.
The SIRT1 reactions with triply-acetylated p53 peptide were in 50 mM Tris (pH 7.5), 137 mM NaCl, 2.7 mM KCl, 1 mM MgCl2, 0.05% BSA, and 250 µM NAD+ with a 1/100 dilution of enzyme. Reactions were initiated (10 µM final substrate concentration) and quenched as above.
SIRT1 reactions with the TAMRA-labeled and unlabeled 20-mer peptides were in 50 µL of buffer identical to the triply-acetylated p53 reactions but with 120 µM NAD+ and supplemented with 5 mM dithiothreitol (DTT). Enzyme was added to the TAMRA reactions at 1/500 and to the unlabeled peptide reactions at 1/250. Plates were prespotted with DMSO (1 µL), resveratrol (1 µL of a 50× stock, final concentration 0–100 µM), or suramin sodium (2 µL of a 25× stock, final concentration 0.1 nM to 1 mM). Reactions were initiated by the addition of a 1/10th volume of 10× peptide (2.5 µM final) and quenched at 60 min with a 5× volume of 1% formic acid already containing 10 nM ADPr as an internal standard.
SIRT2 reactions with acetyl-p53 peptide were carried out identically to the SIRT1-triply-acetylated p53 experiments but with NAD+ concentrations of 250 µM (substrate titration); 10, 30, 100, or 300 µM (NAD+ titration); or 100 µM (nicotinamide IC50). Enzyme was added at 1/1000 (substrate and NAD+ titrations) or 1/500 (IC50). IC50 plates were prespotted with nicotinamide (2 µL of a 25× stock in ddH2O). Reactions were initiated by the addition of a 1/10th volume of 10× peptide substrate (1, 3, 10, or 30 µM final concentration for the substrate titration; 30 µM for the NAD+ titration; and 7 µM for the IC50) and quenched with a 5× volume of 1% formic acid already containing 10 nM ADPr as an internal standard.
SIRT3 reactions with acetyl-H4 peptide were carried out identically to the SIRT1-acetyl-p53 experiments but with NAD+ concentrations of 250 µM (substrate titration and nicotinamide IC50) or 10, 30, 100, or 300 µM (NAD+ titration). Enzyme was added at 1/1500. IC50 plates were prespotted with nicotinamide (2 µL of a 25× stock in ddH2O). Reactions were initiated by the addition of a 1/10th volume of 10× peptide substrate (6.25, 12.5, 25, or 50 µM final concentration for the substrate titration; 10 µM for the NAD+ titration; and 4.5 µM for the IC50) and quenched with a 3× volume of 1% formic acid already containing 10 nM ADPr.
SIRT3 reactions on calf thymus histones were carried out in a final volume of 100 µL of 50 mM Tris (pH 7.5), 137 mM NaCl, 2.7 mM KCl, 1 mM MgCl2, 1 mM DTT, and 250 µM NAD+ with a 1/500 dilution of enzyme. Plate wells were prespotted with 2 µL 25× nicotinamide. Reactions were initiated by the addition of 50 µL 4 mg/mL histones (to 50 µL of 2× buffer above) and quenched with 10 µL 10% formic acid already containing 10 nM ADPr.
SPE and mass spectrometric detection
Quenched samples were analyzed on an Agilent RapidFire 200 High-Throughput Mass Spectrometry System (Agilent, Wakefield, MA) using an AB Sciex API 4000 mass spectrometer fitted with an electrospray ionization source and running in MRM mode. The RapidFire system aspirated aliquots of each sample sequentially. Of each aliquot, 10 µL was applied to an SPE cartridge, the packing material of which was chosen to best retain the analyte(s) of interest. After a wash step to remove the reaction components that are incompatible with mass spectrometry, the sample was reverse eluted and sent to the mass spectrometer, which was already monitoring the mass transitions of interest. Reactions were analyzed twice, once using a method to detect the substrate and product peptides and once under a method designed to detect the OAADPr co-product. Details for each detection method are provided below.
p53 peptide
Using the RapidFire system, samples were aspirated for 250 ms, loaded onto cartridge A (C4 packing material), washed with ddH20 supplemented with 0.01% trifluoroacetic acid and 0.09% formic acid for 3 s, and eluted in 80% acetonitrile supplemented with 0.01% trifluoroacetic acid and 0.09% formic acid in 3 s. A reequilibration step of 500 ms brings the total cycle time to 6.75 s. The mass spectrometer was operated in positive mode, and m/z transitions of 534.4/128.6 and 523.9/128.6 were monitored for substrate and product, respectively.
Triply-acetylated p53 peptide
Using the RapidFire system, samples were aspirated for 250 ms, loaded onto cartridge A (C4 packing material), washed with ddH20 supplemented with 0.01% trifluoroacetic acid and 0.09% formic acid for 3 s, and eluted in 80% acetonitrile supplemented with 0.01% trifluoroacetic acid and 0.09% formic acid in 5 s. A reequilibration step of 500 ms brings the total cycle time to 8.75 s. The mass spectrometer was operated in positive mode, and m/z transitions of 555.5/638.6 (3ac), 545/624.6 (2ac), 534.5/610.6 (1ac), and 524/596.6 (0ac) were monitored.
H4 peptide
Using the RapidFire system, samples were aspirated for 250 ms, loaded onto cartridge A (C4 packing material), washed with ddH20 supplemented with 0.01% trifluoroacetic acid and 0.09% formic acid for 3 s, and eluted in 80% acetonitrile supplemented with 0.01% trifluoroacetic acid and 0.09% formic acid in 3 s. A reequilibration step of 500 ms brings the total cycle time to 6.75 s. The mass spectrometer was operated in positive mode, and m/z transitions of 402.9/463.3 and 394.6/442.4 were monitored for substrate and product, respectively.
20-mer peptides with and without TAMRA label
Using the RapidFire system, samples were aspirated for 250 ms, loaded onto cartridge A (C4 packing material), washed with ddH20 supplemented with 0.01% trifluoroacetic acid and 0.09% formic acid for 3 s, and eluted in 80% acetonitrile supplemented with 0.01% trifluoroacetic acid and 0.09% formic acid in 3.5 s. A reequilibration step of 500 ms brings the total cycle time to 7.25 s. The mass spectrometer was operated in positive mode, and m/z transitions of 967.4/310.2 (TAMRA-labeled substrate), 953.3/310.2 (TAMRA-labeled product), 830/310.1 (unlabeled substrate), and 816/310.1 (unlabeled product) were monitored.
OAADPr
Using the RapidFire system, samples were aspirated for 250 ms, loaded onto cartridge D (graphitic carbon packing material), washed with ddH20 for 3 s, and eluted in 2:1:1 H2O/acetone/acetonitrile containing 5 mM ammonium acetate in 3.5 s. A reequilibration step of 500 ms brings the total cycle time to 7.25 s. The mass spectrometer was operated in positive mode, and m/z transitions of 602.2/135.2 (OAADPr, reaction product) and 560.2/135.2 (ADPr, internal standard) were monitored.
Data processing and analysis
Agilent’s proprietary RapidFire Integrator software was used to integrate mass spectrometric data. Km values were calculated in GraphPad Prism 5 (GraphPad, San Diego, CA) using the Michaelis-Menten algorithm, Velocity = (Vmax · [S])/(Km + [S]), where Vmax is the maximum rate, [S] is the substrate concentration, and Km is the substrate Michaelis-Menten binding constant. IC50 values were calculated in GraphPad Prism 5 using the one-site competition algorithm, Y = Bottom + (Top – Bottom)/(1 + 10^(X – LogIC50)), where LogIC50 is the concentration of the competitor required to inhibit half of the maximum reaction, Top is the plateau of reaction in the absence of inhibitor, and Bottom is the plateau of reaction at maximum inhibitor concentration. Reactions were run in at least triplicate, and error bars represent one standard deviation.
Results
Analysis of sirtuin reactions by HT-SPE/MS allows the fast and direct detection of unlabeled substrate and product peptides with a lower limit of detection of approximately 10 nM (data not shown). While compound dependent, the accuracy of the system is usually ±10% and the precision is ≤10%, but frequently about 5%, for peptides in the concentration ranges tested in these experiments (data not shown). Monitoring the peptides directly enabled enzymatic characterization while avoiding labels and secondary reactions, which can provide opportunities for artifactual data.
Mass spectrometric detection of SIRT1 deacetylation of acetyl-p53 peptide
SIRT1 assay development with the p53 peptide began with an enzyme titration time course to determine the linear range of enzyme kinetics. Figure 2A shows conversion of acetyl-p53 to p53 over time at three different enzyme concentrations. Formation of product with time is linear at all enzyme concentrations tested, and plotting the initial velocity of the reaction (the slope of the linear regression) against enzyme dilution reveals a linear relationship (R2 = 0.999). Once an optimal enzyme concentration was determined, the development proceeded with an investigation of the kinetic parameters of the reaction, specifically the binding constants for the peptide substrate ( Fig. 2B , 25 µM) and the NAD+ cofactor ( Fig. 2C , 34 µM). Knowledge of these parameters allowed a reaction to be set up under screening conditions to detect inhibition of the SIRT1 reaction in the presence of nicotinamide at various concentrations. The results of the inhibition experiment ( Fig. 2D ) allowed an IC50 of 62 µM to be calculated.
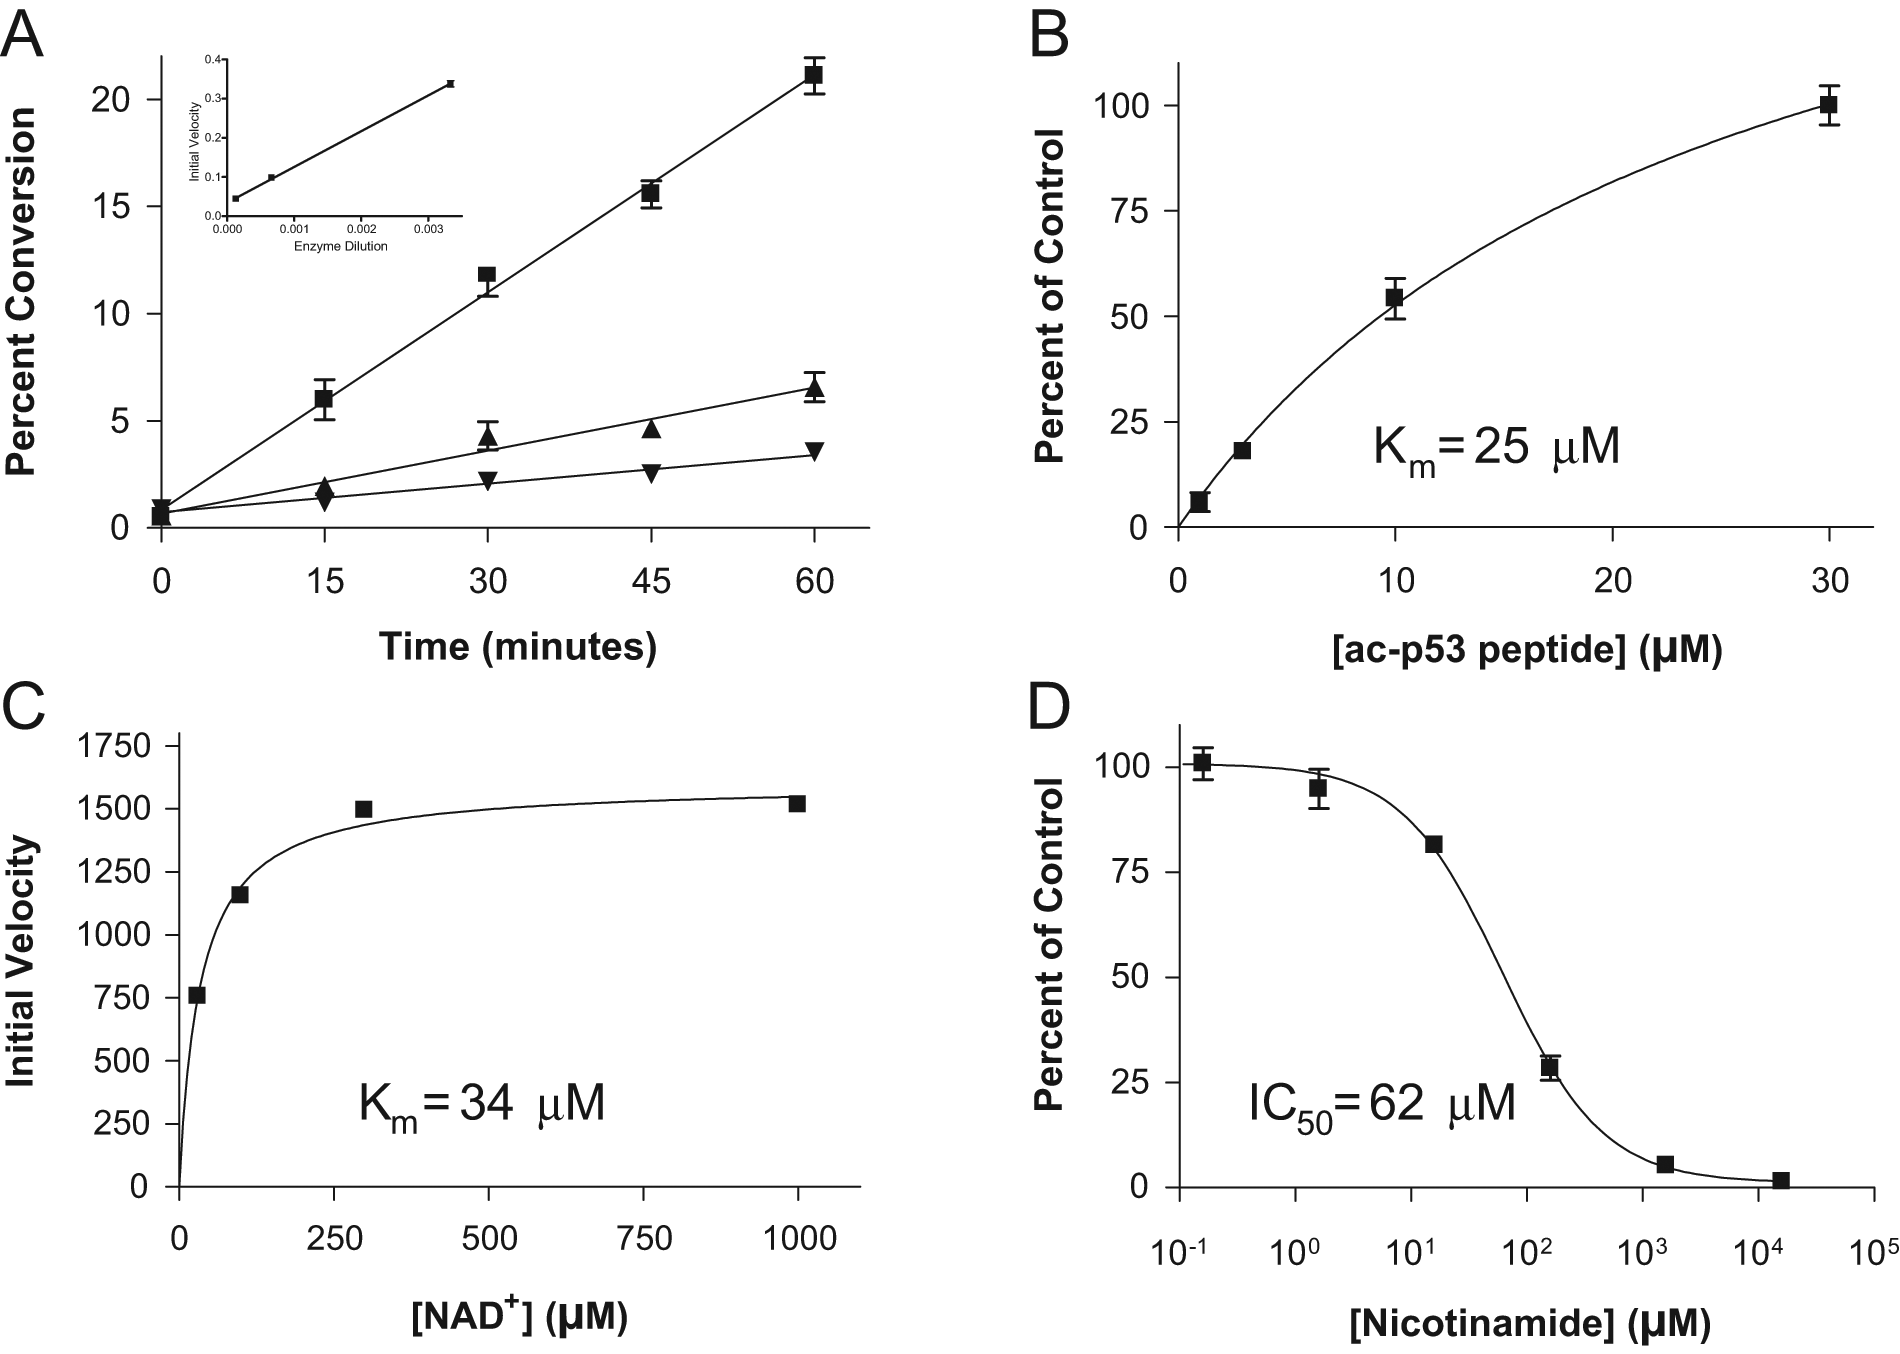
Monitoring the deacetylation of the acetyl-p53 peptide by SIRT1 by measuring the substrate and product peptides by RapidFire-MS. SIRT1 titration time course data (
Mass spectrometry enables the concurrent acquisition of data for multiple acetylation states
To illustrate the utility of using mass spectrometry to study sirtuins further, a SIRT1 assay was set up with a triply-acetylated p53 peptide containing one acetyl group on each of three lysine residues. A time course experiment was monitored for each of the four possible acetylation states of the peptide (the substrate, designated 3ac, and three products, designated 2ac, 1ac, and 0ac). Figure 3 shows the conversion over time of 3ac (green diamonds) first to 2ac (purple circles), both of which then get transformed to 1ac (red triangles) and finally 0ac (blue squares). Allowing such a complete picture of a complex reaction to be drawn demonstrates the extra layer of information available when screening sirtuin reactions using MS.
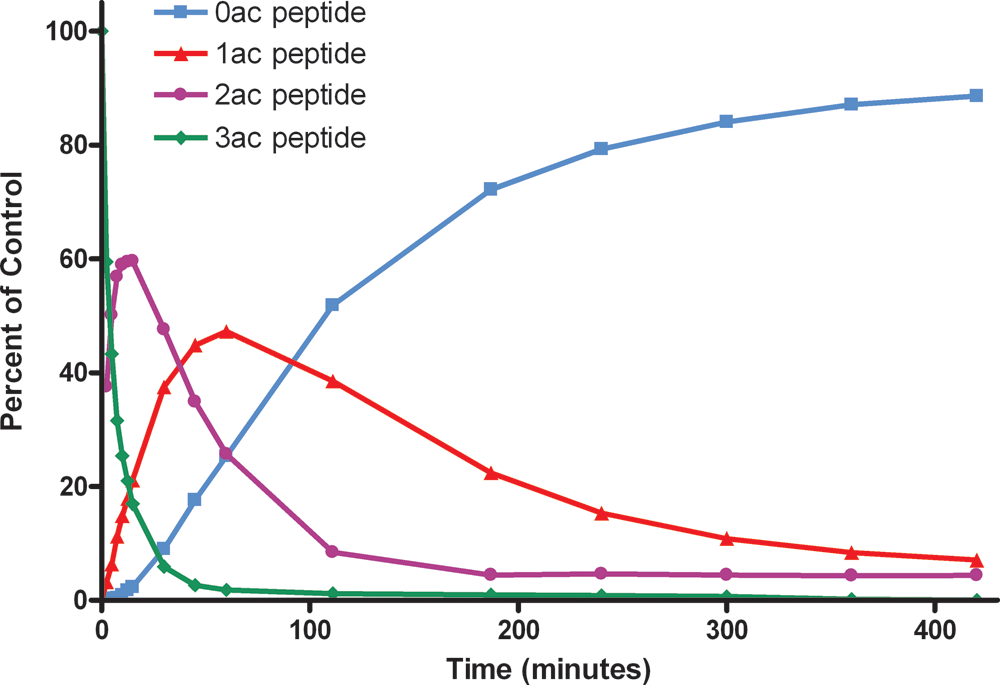
Successive deacetylation of a p53 peptide containing three acetylated (ac) lysine residues by SIRT1. Conversion over time of 3ac peptides (green diamonds) to 2ac (purple circles), 1ac (red triangles), and 0ac (blue squares) species is observed.
OAADPr is a valid surrogate for product peptide
In the process of deacetylating its substrate, the sirtuin histone deacetylases produce a co-product by transferring the removed acetyl group to the NAD+ cofactor, creating OAADPr and nicotinamide (
Fig. 1
). Although monitoring the peptide substrates and products directly is a robust method to study sirtuin activity, it requires a new mass spectrometric development for each new substrate of interest. This co-reaction, however, is common to several sirtuin isoforms and is independent of the substrate being deacetylated. Monitoring the formation of OAADPr, then, eliminates the need for new method development and is applicable to a vast array of sirtuin reactions of interest. First, however, it must be established that the method produces data that are consistent with the information gathered from monitoring the conversion of substrate peptide to product peptide. Accordingly, the SIRT1 experiments conducted with the acetyl-p53 peptide were reanalyzed under the method optimized to detect OAADPr.
Figure 4A
depicts the formation of OAADPr in the time course reactions shown in
Figure 2A
. Again, linear formation of product with time is observed at all three enzyme concentrations, and the plot of initial velocity against enzyme dilution again demonstrated excellent linearity (R2 = 0.9995). The peptide and NAD+ cofactor titration experiments were also reanalyzed for OAADPr, and the results (
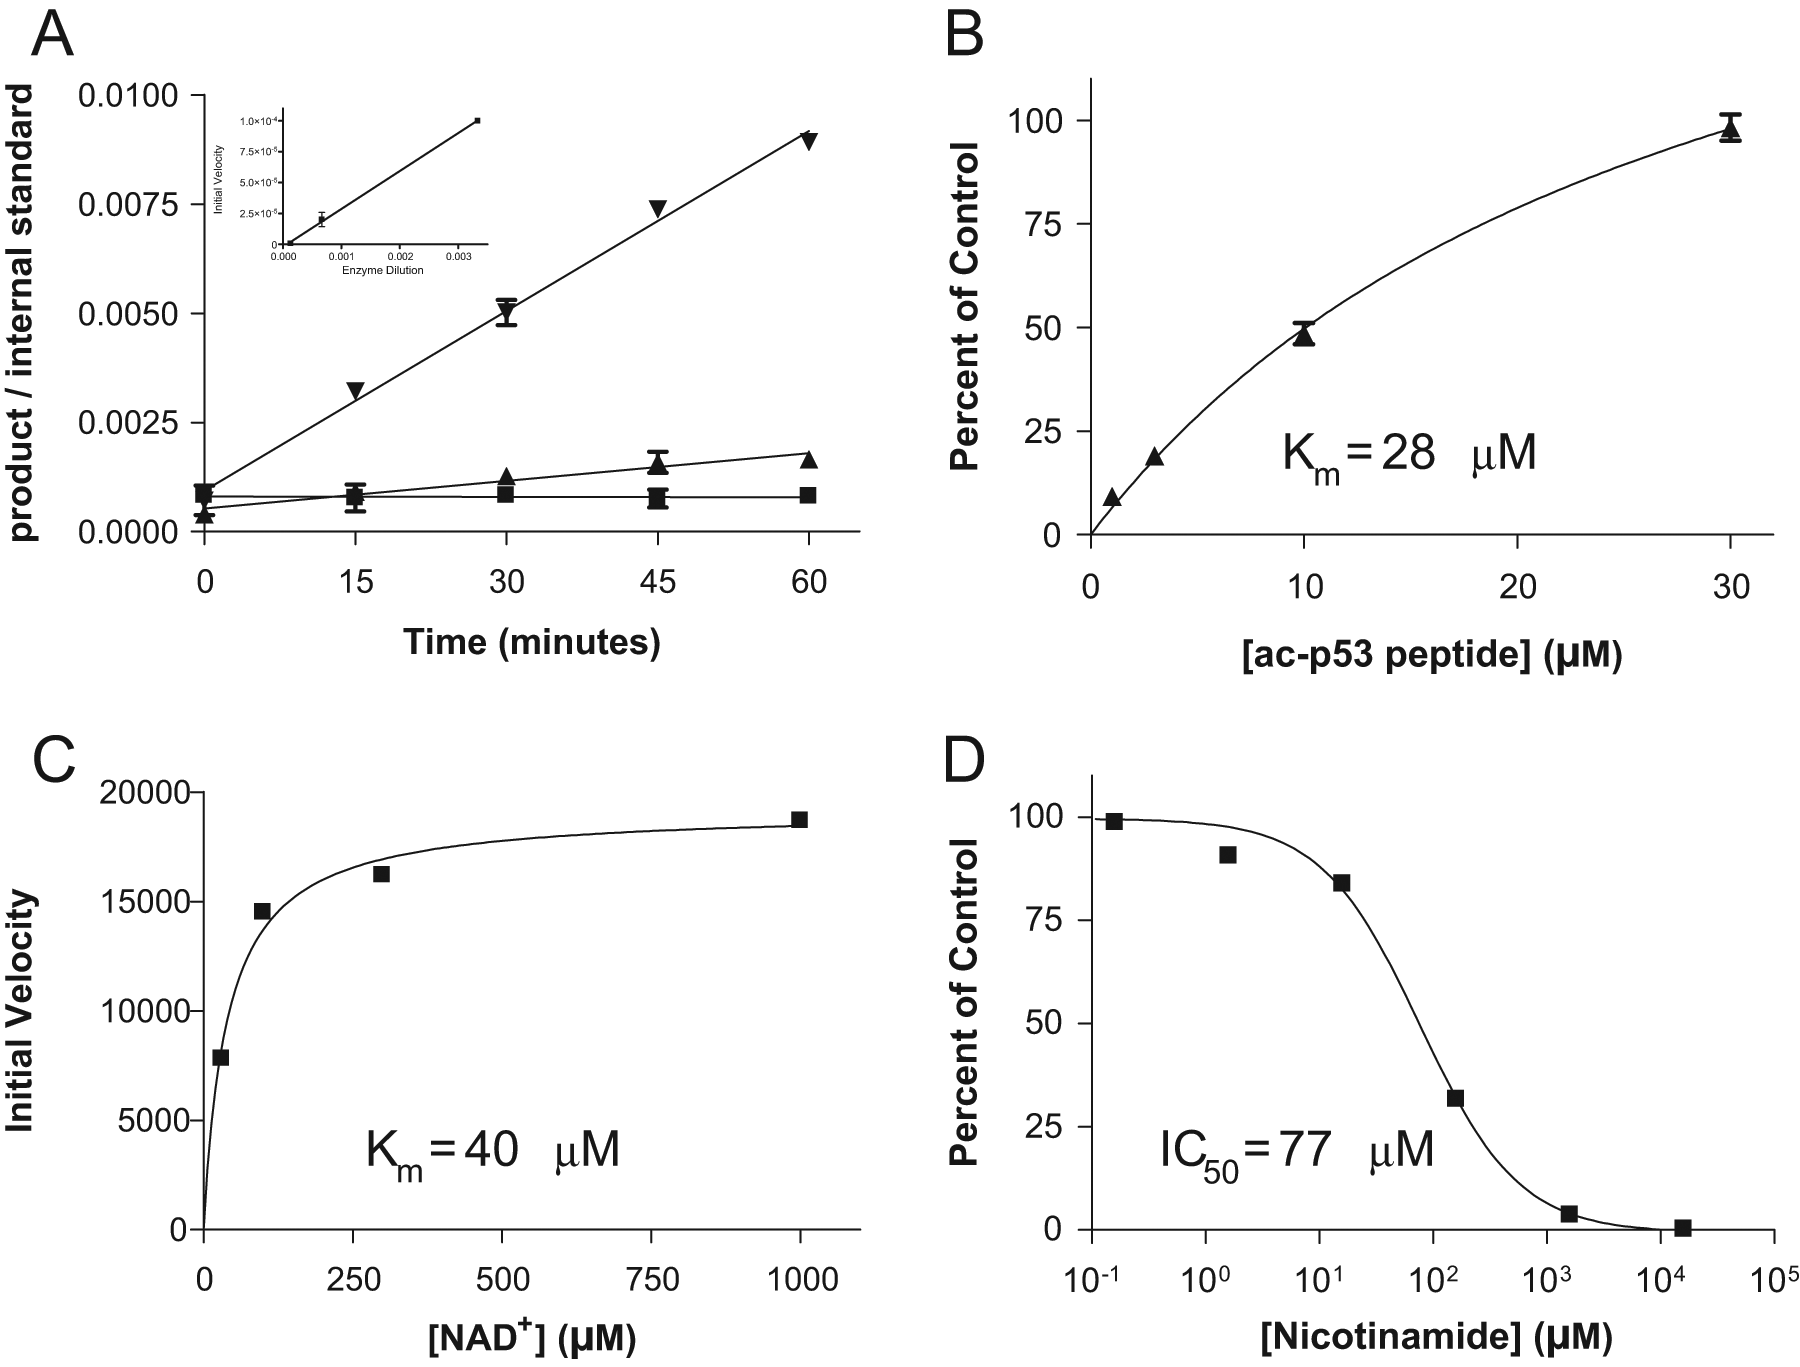
Monitoring the deacetylation of the acetyl-p53 peptide by SIRT1 by measuring the unique OAADPr co-product. SIRT1 titration time course data (
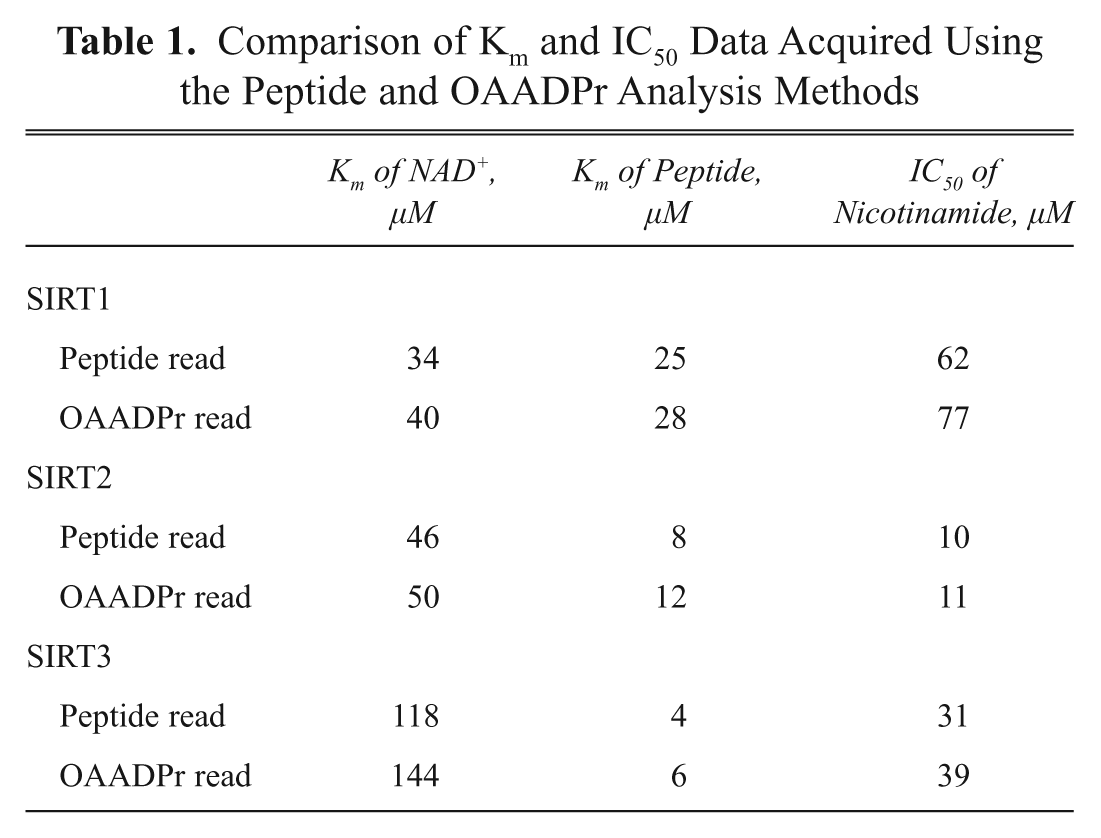
To validate the widespread applicability of this method further, assays with additional sirtuin isoforms (SIRT2 and SIRT3) were developed on relevant peptide substrates (p53 and histone 4). Peptide and NAD+ titration experiments, followed by nicotinamide inhibition experiments, were set up for each sirtuin-substrate pair. Reactions were then analyzed twice, once under a method optimized to detect the substrate and product peptides and once to analyze the presence of OAADPr. Results, given in Table 1 , demonstrate good agreement between the values for the relevant kinetic parameters obtained via the two different methods, regardless of the enzyme and/or substrate of the reaction.
Comparison of Km and IC50 Data Acquired Using the Peptide and OAADPr Analysis Methods
There is interest in the sirtuin field in identifying not only inhibitors but activators of this class of enzymes. To establish whether this new detection method is capable of revealing activation, should it occur, activation/inhibition/control experiments were set up with a TAMRA-labeled 20-mer peptide as well as with its unlabeled 20-mer equivalent, which were previously described.
19
The experiments were analyzed via the two orthogonal methods, and the results, depicted as percent of control in
Figure 5
, show that the data acquired under the two methods are essentially superimposable. The observed resveratrol-mediated activation of sirtuin activity on the TAMRA-labeled peptide (
Fig. 5A
) is preserved under the OAADPr analysis method (
Fig. 5B
), and the loss of that observed activation when the same reaction is conducted on the unlabeled peptide (
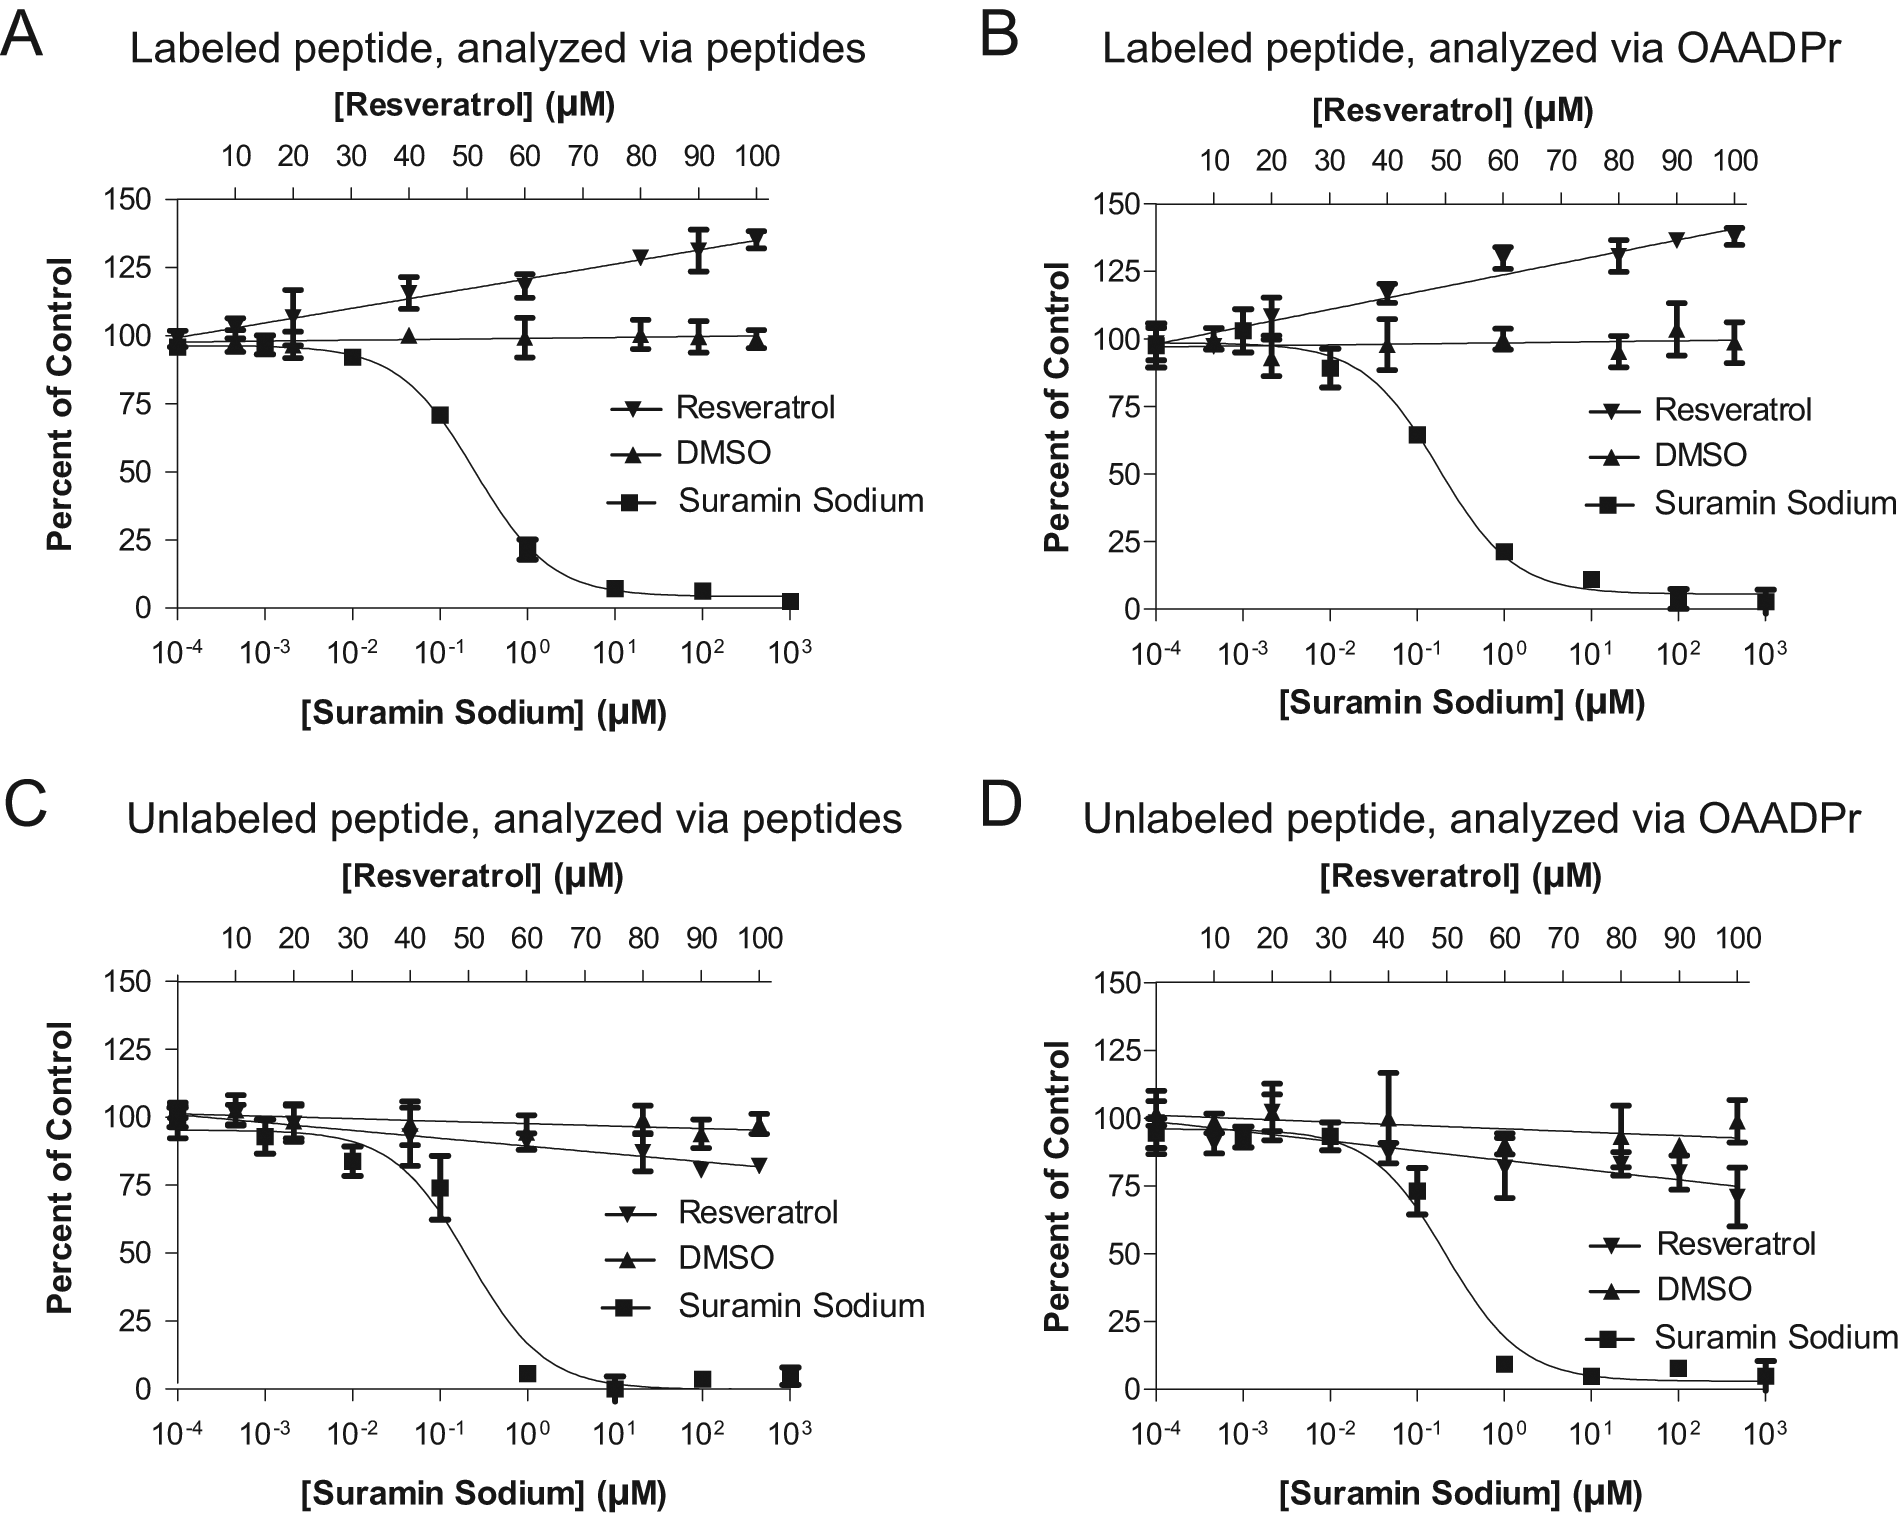
Substrate-dependent activation of SIRT1 by resveratrol. The ability of resveratrol to activate SIRT1 deacetylation of the peptide containing the TAMRA fluorophore is observed when analyzing the reactions via substrate and product peptides (
OAADPr allows study of more biologically relevant substrates
Although most in vitro screening assays are performed on peptide substrates, these are mere surrogates for what the enzymes will encounter in the body. Because the OAADPr method obviates the need to detect the protein/peptide substrate of the reaction, it makes possible the use of much more native substrates, such as whole-histone proteins, that are themselves challenging to detect in a high-throughput manner. After the development of an assay demonstrating SIRT3-mediated deacetylation of calf thymus histone proteins, a nicotinamide inhibition study was set up and analyzed for OAADPr production. The results, shown in Figure 6 , demonstrate that not only can the OAADPr method detect the deacetylation of whole-histone proteins, but it also can be used to monitor inhibition of the reaction. An IC50 value of 42 µM was calculated.
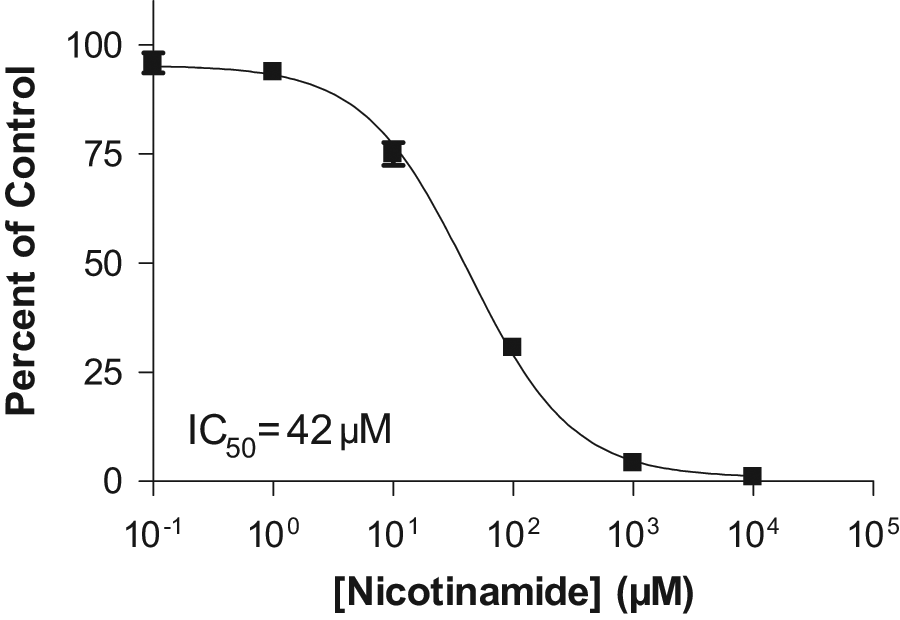
Nicotinamide inhibition of SIRT3 deacetylation of whole-histone proteins, as analyzed via OAADPr production.
Discussion
The sirtuin class of histone deacetylases has received much attention lately, yet the limitations of current protocols used to study these enzymes suggest the need for better screening methods. For example, radio-isotope-based assays can be disadvantageous because of the associated radiation hazards, regulatory issues, and material handling costs. Also, methods that require labeled substrates and/or secondary reactions can be susceptible to data artifacts and present additional opportunities for error. In contrast, using high-throughput mass spectrometry to monitor the conversion of a label-free peptide to its deacetylated product directly has been established as a robust and reliable screening method.
The enzymatic parameters obtained using the methods described here agree well with literature values obtained using other assay formats. The Km of NAD+ has previously been reported to be approximately 40 µM for SIRT1 12 and SIRT2. 13 In addition, the IC50 value of nicotinamide with several sirtuins has previously been approximated at 50 µM, 21 although 10 µM has also been reported for the SIRT2 enzyme. 13 These data correlate very well with those presented here ( Table 1 ) and provide a high degree of confidence in both HT-SPE/MS-based detection strategies.
In addition to providing the same types of kinetic parameter and inhibition data that are possibly obtained by other methods, mass spectrometry offers an advantage in that it is able to provide a more detailed picture of successive reactions. Because the readout is incremental, it is possible to distinguish between the conversion of a triply-acetylated substrate to a doubly-acetylated product and the further conversion of that doubly-acetylated molecule (that is now a substrate) to a singly-acetylated product and so on. Although these reactions would appear identical under other methods (i.e., both would release radioactivity), mass spectrometry can differentiate all possible acetylation states of a substrate–product spectrum based on the differences in their molecular weight. This extra layer of accessible knowledge allows a much deeper understanding of the complexity of the reaction and enables answers to questions previously unanswerable, such as whether the triply-acetylated and doubly-acetylated states of a peptide are equally good sirtuin substrates or whether certain lysine sites are particularly susceptible or resistant to deacetylation.
Although robust and exceptionally informative, these peptide-based MS methods do require MS and desalting conditions to be developed for each new substrate of interest and are limited to substrates that can be detected by MS at the concentrations used in screens. In 2000, a previously unidentified co-product of the sirtuin deacetylation reaction was discovered when it was determined that sirtuins transfer the acetyl group from the protein substrate to the NAD+ cofactor, releasing nicotinamide and OAADPr in a tightly coupled process. 22 The OAADPr products were subsequently identified as a mixture of 2′-OAADPr, which is the enzymatic product, and 3′-OAADPr, which is formed in solution by intramolecular transesterification. 23 The detection method developed accounted for this equilibrium of acetylated products by tracking an MS fragment that was common to both OAADPr species and measuring the abundance of the two species together. In doing so, the resulting detection method for OAADPr production was established and validated to provide data equivalent to that for MS detection of the peptides. As displayed in Table 1 , when SIRT1 deacetylation of the acetyl-p53 peptide is analyzed under both the traditional peptide-focused method and the OAADPr method, the data are in good agreement. In fact, comparison of kinetic parameters obtained using the two methods for several isoforms paired with multiple substrates shows that essentially the same results are achieved under both methods. Even phenomena such as substrate-specific activation, as in the case of the TAMRA-labeled 20-mer peptide, are reproduced when monitoring the formation of OAADPr but disappear when studying the unlabeled equivalent under both the peptide and the co-product methods.
In addition to eliminating the work of optimizing MRM transitions and desalting conditions for each substrate, the OAADPr method actually eliminates any dependence on the reaction’s substrate and allows the screening of substrate/product pairs that might not be detectable by mass spectrometry at the concentrations at which a screen would be run. For example, the deacetylation of whole-histone proteins by SIRT3 has been monitored using this method ( Fig. 6 ), and the IC50 value of 42 µM that was obtained using this method is in good agreement with previous findings described above. Thus, the OAADPr method allows screening under more realistic scenarios with more biologically relevant substrates, potentially enabling the identification of inhibitors with improved in vivo properties.
These two label-free sirtuin screening methods represent a complement of straightforward tools that open the door to more accurate and efficient screening of this class of HDACs. Each method is capable of answering a different slate of questions of interest, and together they can paint a clearer picture of the activities of these enzymes on a multitude of substrates. These two MS-based protocols then can serve as a means to allow more promising sirtuin-modulating compounds to be identified, improving the therapeutic options available to treat the wide array of disease states in which sirtuins have been implicated.