
Abstract
Mass spectrometry imaging (MSI) provides pharmaceutical researchers with a suite of technologies to screen and assess compound distributions and relative abundances directly from tissue sections and offer insight into drug discovery–applicable queries such as blood-brain barrier access, tumor penetration/retention, and compound toxicity related to drug retention in specific organs/cell types. Label-free MSI offers advantages over label-based assays, such as quantitative whole-body autoradiography (QWBA), in the ability to simultaneously differentiate and monitor both drug and drug metabolites. Such discrimination is not possible by label-based assays if a drug metabolite still contains the radiolabel. Here, we present data exemplifying the advantages of MSI analysis. Data of the distribution of AZD2820, a therapeutic cyclic peptide, are related to corresponding QWBA data. Distribution of AZD2820 and two metabolites is achieved by MSI, which [14C]AZD2820 QWBA fails to differentiate. Furthermore, the high mass-resolving power of Fourier transform ion cyclotron resonance MS is used to separate closely associated ions.
Introduction
During the discovery and development of new therapeutics, an understanding of compound biodistribution, accumulation, efficacy, and toxicity is of fundamental importance. Differentiating between alternative compounds in a series, or between chemical classes, requires the screening of many analogues to determine which would be most advantageous to progress. For later-stage compounds, this can be time-consuming and laborious, as indirect monitoring is typically performed using labeled compounds. 1 The use of labeled compound, typically 3H- or 14C labeled in quantitative whole-body autoradiography (QWBA), risks misrepresenting the abundance of a compound, as all measurements are based on the abundance of the label. Should a compound be metabolized, leaving the label with any subsequent metabolite, it cannot be distinguished from the parent compound. Similarly, pharmacodynamics understanding requires additional labels or probes to measure the distribution of endogenous compounds.
Overcoming the concern of tracking only the label often requires extensive bioanalytical investigation using sample homogenization, which results in losing all the spatial distribution information. 2 Other drawbacks in label-based studies include the time required to synthesize the probe and the associated direct and indirect costs. 3 This limits the number of compounds that can be evaluated. Nevertheless, QWBA remains a crucial component of studies in the later stages of compound development prior to a compound becoming a clinically approved drug. This is due to the sensitivity of the methodology and applicability of the technique to address specific questions about exposure and accumulation in different tissues and to relate to human mass balance studies. In addition, data can feed into investigational new drug applications, and there is also regulatory acceptance of the methodology. 4
New analytical techniques that allow higher-throughput screening of compounds and a direct measurement of compound biodistribution in tissues can significantly affect drug discovery. Recently mass spectrometry imaging (MSI) technologies are offering drug discovery researchers the ability to screen compounds without the requirement of labeled compound or indirect probe-based measurements. By direct sampling from the surface of a tissue section, using one of several, distinct ionization methods, MSI technologies are able to delineate between parent compound and metabolites. Images representing the relative distribution of compound can be generated by relating the spatial position at which the mass spectra were acquired with the relative abundance of the selected target ion.5,6 Further, relative abundance images can be generated by selection of other target ions within the acquired spectra that can either be compound metabolites or endogenous small molecules, lipids, or peptides. Currently, there are three commonly employed MSI ionization methods that have particular utility for research in drug discovery. 7 The most common is matrix-assisted laser desorption ionization (MALDI), 8 with desorption ionization electrospray9,10 and secondary ionization mass spectrometry11,12 providing additional modes of sample ionization applicable to drug distribution analysis. These techniques have been extensively reviewed, and each has advantages and limitations that determine their applicability to wide-ranging applications.13–16
Presented here is an example of the utility of MSI to measure the distribution of compounds and their metabolites directly from tissue sections. The distribution of a therapeutic cyclic peptide, AZD2820, within a mouse kidney tissue section is made by MALDI-MSI and compared directly with corresponding QWBA data for a 14C radiolabel analogue of the same peptide. AZD2820 is a cyclic heptapeptide with partial agonist properties at the melanocortin-4 receptor mediating appetite suppression, intended to be a parenterally administered antiobesity drug. This compound was chosen for this study because of the availability of QWBA study data and additional tissue for MSI analysis. No inference regarding the efficacy or safety of AZD2820 can be made from the data presented. The data presented exemplify the potential of direct label-free analysis and the utility of applying such technologies to screening compound biodistribution in early drug discovery.
Materials and Methods
Chemicals and Reagents
AZD2820 (C49H69FN16O9) and [14C]AZD2820 were supplied by AstraZeneca compound management, Sweden. Solvents were high-performance liquid chromatography (HPLC) grade (Fisher Scientific, Loughborough, UK). All other chemicals were purchased from Sigma-Aldrich (Dorset, UK) unless otherwise stated.
Animals
Tissues from AZD2820-treated animals were obtained from AstraZeneca (DMPK R&D, Södertälje, Sweden, ethical approval No. 50/09). Male C57Bl:6J pigmented mice weighing 19 to 22 g were purchased from Charles River Laboratories (Germany). The mice were acclimatized for 1 wk prior to dosing. Animal identification and conditions of housing, acclimatization, environment, diet, and water were in accordance with facility standard operating procedures.
Quantitative Whole-Body Autoradiography
The QWBA experiment was performed following industry standard protocols. In brief, the distribution of radioactivity in mouse tissue was measured after subcutaneous administration of [14C]AZD2820 using phosphor-imaging. A single dose of 4 mg/kg (3.8 µmol/kg, 7 MBq/kg) of [14C]AZD2820 was given to male mice. The mice were sacrificed between 0.5 h and 7 d after administration. Compound was formulated for dosing as solution in 5% mannitol (v/w) for subcutaneous administration. The animals were sacrificed with enflurane (Efrane, Abbott Laborotories), frozen in acetone, and cooled to −70 °C with solid CO2. After removal of limbs and tail, the carcass was embedded, with left lateral side uppermost, in a 2.5% aqueous solution of carboxymethyl cellulose and frozen for at least 10 min in acetone at −70 °C. The animal blocks were stored at −20 °C until sectioning. At sectioning, each block was mounted in a Leica CM3600 Cryomacrotome (Leica Microsystems GmbH, Germany) maintained at approximately −20 °C. Sagittal whole-body sections (30 µm) were obtained to include organs and tissues of interest. The sections were mounted on invisible tape (type 810; 3M) and numbered consecutively with radioactive ink. All sections were dried at −20 °C for at least 1 d prior to exposure on phosphor-imaging plates. Sections were chosen for phosphor-imaging to best represent the tissues and organs of interest. Together with two sets of calibration standards, the sections were placed on phosphor-imaging plates, which had been precovered with a thin plastic film. The imaging plates were exposed and enclosed in light-tight cassettes in a lead-shielding box to protect from environmental radiation. Following exposure, the imaging plates were scanned at a pixel size of 50 µm using FLA-7000 (FujiFilm Sverige AB, Sweden).
MSI Analysis
AZD2820 mouse kidney tissues were prepared for MALDI analysis following similar methods as previously described.
17
In brief, following a single subcutaneous administration of nonlabeled AZD2820 (25 mg/kg), mice were sacrificed. Direct matching of time points was not possible as nonradiolabel experiments were performed primarily for reasons beyond the scope of this experiment and kidney tissue collection was opportunistic. Animal welfare prohibits rerunning animal experiments for publication purposes alone. Kidneys were dissected 30 and 120 min postdose and snap frozen on dry ice–chilled isopropanol and stored at −80 °C. Tissue sectioning was performed on Leica CM3050S cryostat (Leica, Microsystems GmbH, Germany) at −20 °C. Kidney sections (12 µm thick) were thaw mounted onto indium tin oxide–coated mass spectrometry–compatible glass slides (cat. No. 237001; Bruker Daltonics, Germany). Subsequent transfer of samples was performed on dry ice, and storage was at −80 °C. Tissue washing was performed prior to matrix coating and consisted of 30 s in 70% ethanol 30% water followed by 30 s in 100% ethanol before being dried under a stream of nitrogen. Wet matrix (4 mg/mL α-cyano-4-hydroxycinnamic acid [CHCA] in 50% acetonitrile/50% 0.1% trifluoroacetic acid in HPLC-grade water) was applied manually using a pneumatic TLC sprayer. The MALDI target was repeatedly rotated during the coating procedure to prevent any bias in matrix thickness. MALDI MSI was performed using an Ultraflex II TOF/TOF and 12 T SolariX Fourier transform ion cyclotron resonance (FTICR) MS (Bruker Daltonics) in positive ion mode using Smartbeam lasers. The laser spot size was set at medium focus (approximately 50 µm laser spot diameter), and laser power intensity was optimized at the start of each run and then fixed for the MSI experiment. Data were analyzed and normalized using FlexImaging version 2.0, and extracted masses were selected with a 0.2 Da window. An estimation of the sensitivity of the analysis was performed by spotting different concentrations of AZD2820 on control tissue and then performing the analysis in exactly the same way as the dosed tissues. The following amounts were put on tissue in 0.2 µL (50:50 ethanol:water): 0.32 pmol, 0.064 pmol, 12.8 fmol, 2.6 fmol, 0.5 fmol, and 0 fmol. The ion distribution of AZD2820 is visualized on a rainbow scale from 0% to 10% of maximum intensity. The experiment was repeated four times, and the average signal from 0.5 fmol on tissue was approximately three times the background signal (summarized in
Results and Discussion
A primary function of QWBA analysis is to obtain a quantitative overview of the distribution of the radiolabel and then infer the distribution of the administered compound. This can be achieved from whole-animal tissue sections, as shown in
Figure 1
. The image is representative of data obtained for the distribution of [14C]-labeled AZD2820 cyclic peptide (structure shown in
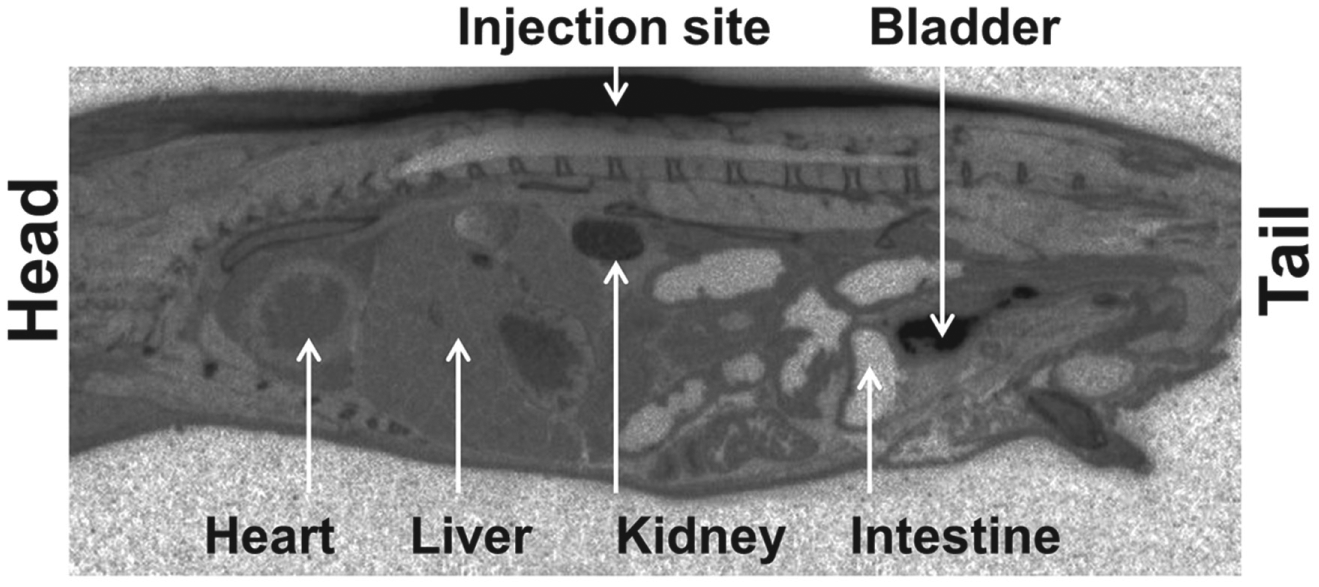
[14C]AZD2820 male pigmented mouse, 1 h after subcutaneous administration. Autoradiogram showing the distribution of radioactivity (dark areas) over a whole-body sagittal tissue section from a male C57Bl:6J mouse 1 h after single subcutaneous administration of [14C]AZD2820.
As [14C]AZD2820 has two major metabolites that retained the radiolabel (
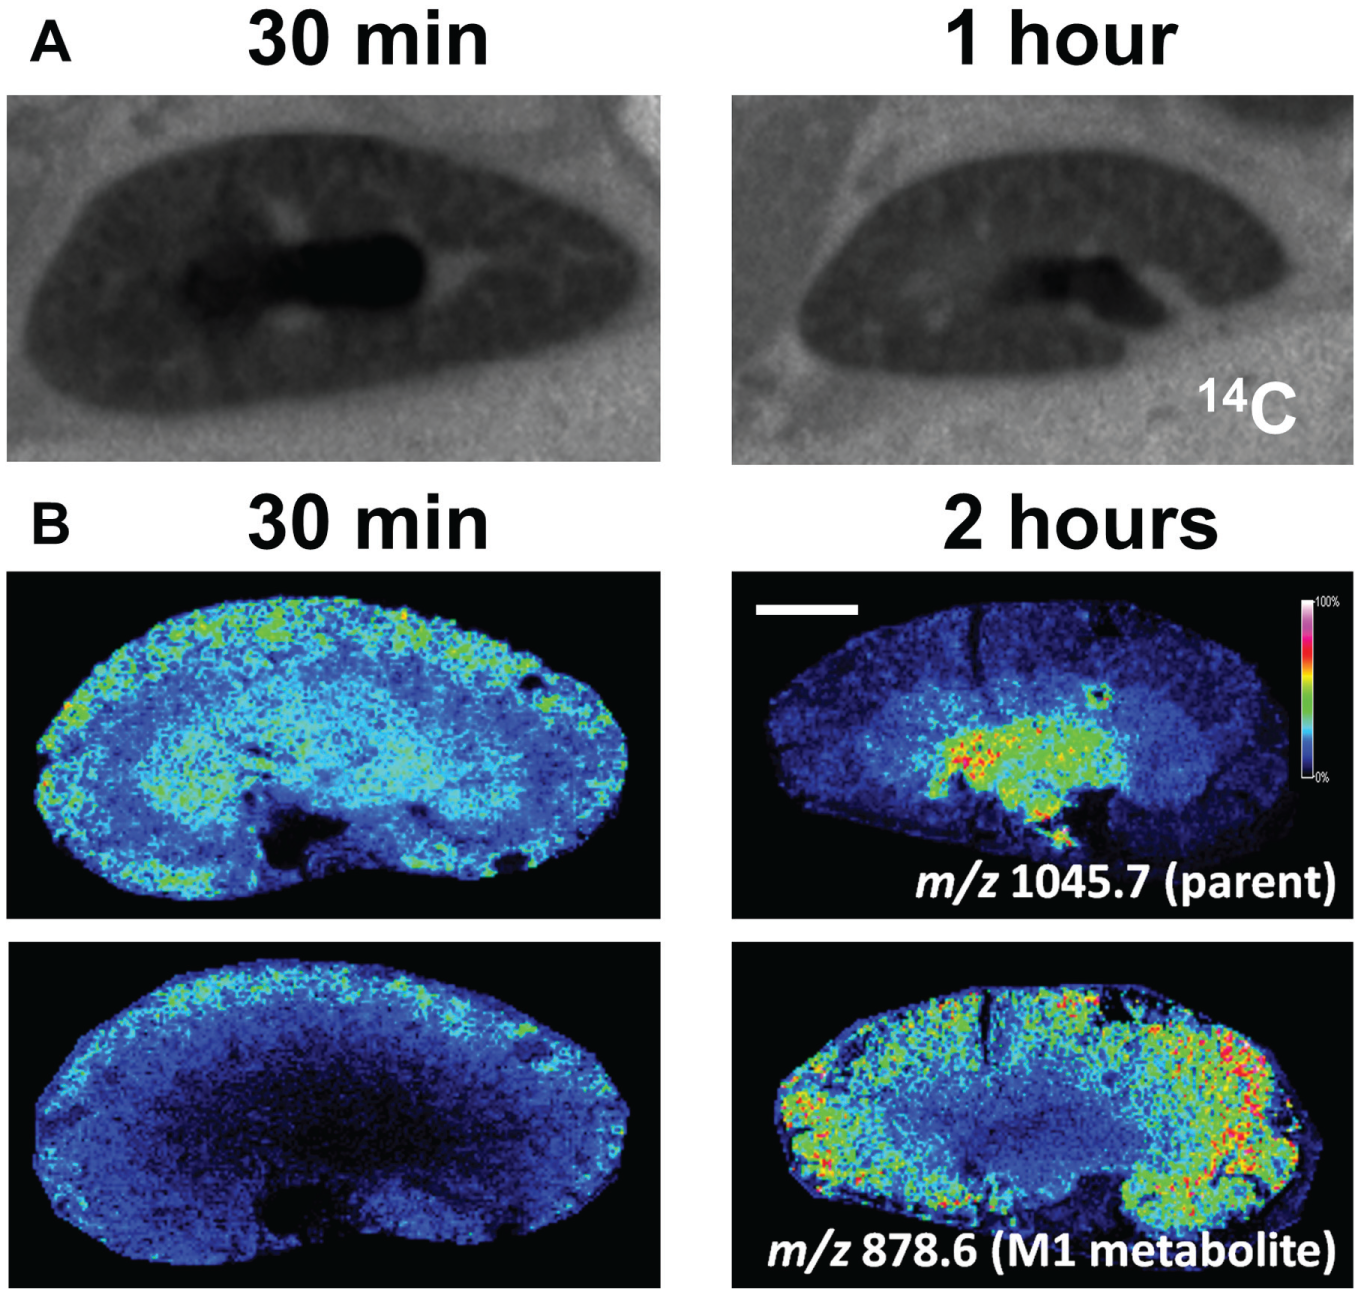
Matrix-assisted laser desorption ionization mass spectrometry and autoradiogram images of distribution of AZD2820 in mouse kidney. (
Analysis of the distribution of the M2 metabolite was more complex as it has a molecular weight similar to that of the parent compound. Figure 3 shows the theoretical isotope distribution of AZD2820 (m/z 1045.55) and the M2 metabolite (m/z 1046.53). With the mass-resolving power of the MALDI-TOF mass spectrometer, the second isotope peak of the AZD2820 will mask the monoisotopic peak of the M2 metabolite. This is shown in the overlaid theoretical isotope distributions. This simulated theoretical isotope distribution was similar to the actual detected spectra collected from the kidney tissue sections, as seen in Figure 3A . Therefore, both parent compound and M2 metabolite will contribute to extracted ion images for m/z 1046.53 (using a 0.2 Da mass window typical for MALDI-TOF MS). MSI typically overcomes multiple compounds contributing to the relative abundance of a target mass by performing fragmentation of the target and mapping the unique fragment masses. However, the similarity of the composition of these compounds could generate similar fragments. To overcome this issue, the analysis was repeated on a mass spectrometer with higher mass-resolving power. FTICR MS determines the m/z of ions using the cyclotron frequency of the ions in a magnetic field. 21 As a result, the mass-resolving power can be in excess of 1,000,000 on instruments with a higher magnetic field rather than the 15,000 achieved on the TOF mass analyzers. Figure 3B shows that with increased mass-resolving power, it was possible to differentiate between the AZD2820 (C49H69FN16O9) second isotope peak at m/z 1046.5524 and the M2 metabolite (C49H68FN15O10) m/z 1046.5336. Figure 3C compares lower spatial resolution MALDI FTICR MS image data to that collected at high spatial resolution on the MALDI-TOF MS. The parent compound distributions are comparable at both 30 and 120 min postdose. The significant difference between FTICR and TOF acquired data is seen for M2 metabolite at 120 min postdose. The MALDI-TOF is unable to distinguish between the second parent isotope and the first M2 metabolite isotope peak. Therefore, the MALDI-TOF extracted image for the M2 metabolite is the same as the parent distribution. The MALDI FTICR can differentiate between the second parent isotope peak and the M2 metabolite. The M2 metabolite is detected at 30 min postdose but has substantially decreased in abundance by 120 min. We attempted to map the distribution of the M2 metabolite using the second (m/z 1047.55), third, and fourth isotope peaks in the MALDI-TOF MSI data. However, the parent isotope peak signal still contributed to the abundance for the first two isotope peaks. For the last isotope peak, there was an endogenous interfering signal, which makes the measurements less specific. Therefore, FTICR-MS analysis was performed. This exemplifies the power of label-free distribution analysis and highlights that validation by higher mass-resolving power FTICR MS is often required. Although not performed during this study, it is worth reiterating that high spectral resolution MSI analysis of drugs can also simultaneously detect and monitor endogenous metabolites. These can then be used as pharmacodynamic or toxicity markers. 22 Although other groups have previously published data on small-molecule QWBA versus MSI, 23 we have presented on large-molecule therapeutics, which to our knowledge have not previously been compared by MSI and QWBA. We also provide all parent and metabolite structures. Furthermore, we present distribution data not at a systemic level but focus on a suborgan level and show how different the MSI data are compared with QWBA. What is also highlighted here is the complexity of closely matched metabolite and parent compounds, requiring multiple MSI platforms to truly elucidate the relative distributions. The experiment outlined here demonstrates the ability to simultaneously monitor the distribution of parent compound and drug metabolites and exemplifies the usefulness of MSI as a screening tool for drug discovery.
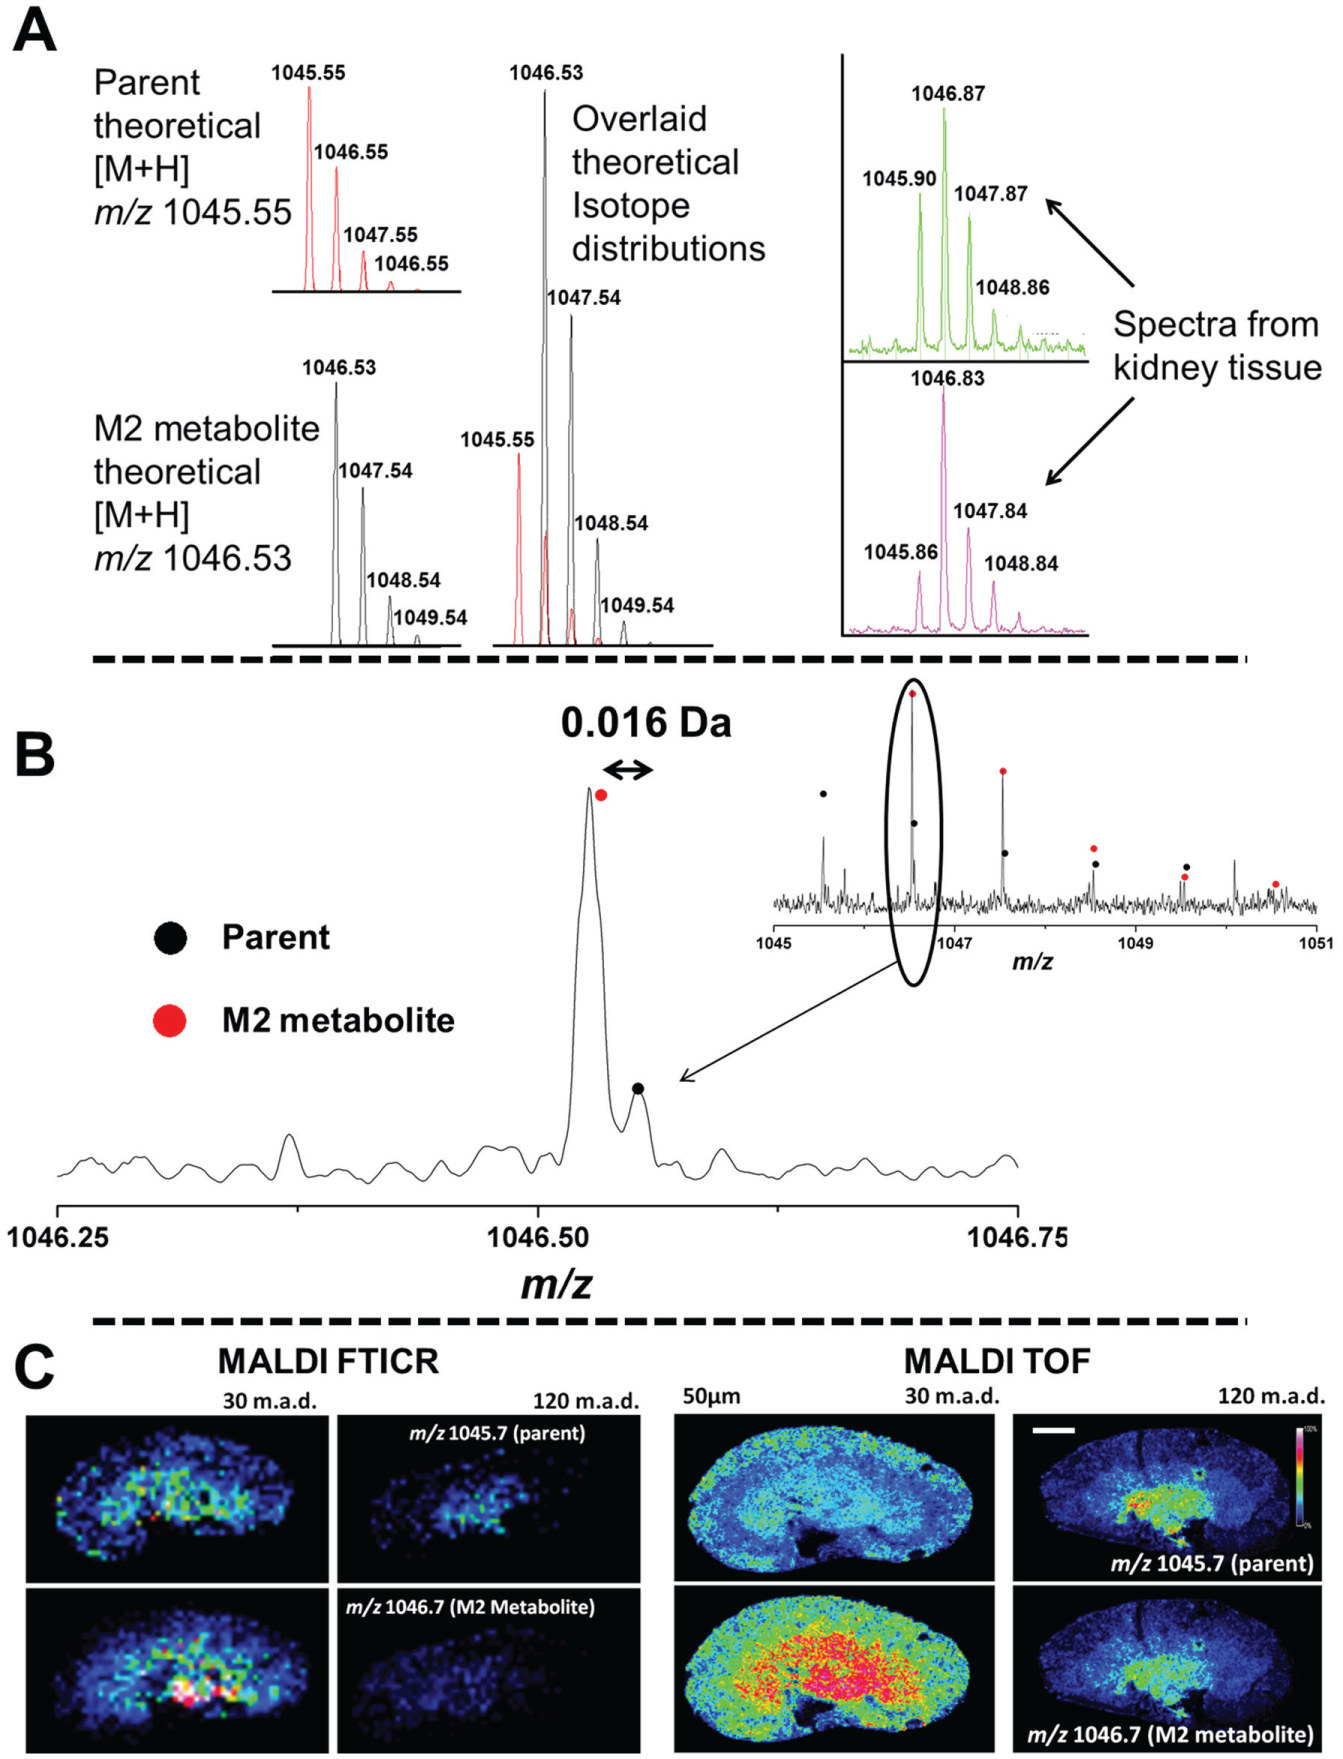
Comparison of mass-resolving power of Fourier transform ion cyclotron resonance (FTICR) and time of flight (TOF) to distinguish between AZD2820 and M2 metabolite. (
We believe the data presented highlight that MSI data can complement that generated by QWBA. The data show that for certain targets, higher spatial resolution and quicker MALDI-TOF MSI are sufficient (detection and mapping parent and M1 metabolite). However, the utility of FTICR MSI needs to be employed for accurate mass validation and M2 metabolite analysis. No one analytical technique is universally advantageous; however, MSI may offer researchers in drug discovery a relatively rapid screening tool for assessing compound and metabolite distribution at a tissue level.
Footnotes
Acknowledgements
The authors thank the AstraZeneca animal laboratory staff for their support in sample preparation.
Declaration of Conflicting Interests
The authors declared no potential conflicts of interest with respect to the research, authorship, and/or publication of this article.
Funding
The authors disclosed receipt of the following financial support for the research, authorship, and/or publication of this article: This work was supported by the Swedish Research Council (Medicine and Health No. 2013-3105, Natural and Engineering Science No. 2014-6215, and Research Infrastructure No. 2009-6050 to P.E.A.).