
Abstract
Histone acetyltransferases (HATs) catalyze the transfer of an acetyl group from an acetyl-coenzyme A donor molecule to specific lysine residues within proteins. The acetylation state of proteins, particularly histones, is known to modulate their intermolecular binding properties and control various cellular processes, most notably transcriptional activation. In addition, deregulation of HAT activity has been linked to the development of a number of cancers; therefore, compounds that affect these enzymes have strong potential as therapeutic agents. The research presented here demonstrates three label-free HAT screening approaches, all based on the fast and direct measurement of one or more substrate-product pairs by high-throughput mass spectrometry techniques. The first approach involves monitoring all possible acetylation states of a peptide concurrently to measure HAT activity. The second approach measures acetylation reactions, on both peptides and whole protein substrates, via direct detection of the acetyl-coenzyme A cosubstrate and coenzyme A coproduct. Lastly, the authors demonstrate the ability to monitor directly the acetylation state of whole histone proteins in the same high-throughput manner using time-of-flight mass spectrometry. The generation of compound-mediated inhibition data using each of these techniques establishes mass spectrometry as a versatile, label-free, and biologically relevant screening approach to this challenging target class.
Introduction
C
HAT enzymes vary with respect to their homology to yeast proteins and can be classified into five distinct families: (1) GNAT (for homologues to the yeast Gcn5 acetyltransferase protein), (2) MYST (MOZ, Ybf2/Sas3, Sas2, and Tip60 proteins), (3) p300/CBP (p300 and CBP proteins), (4) transcription factor related (TFIIIC and TAF1 proteins), and (5) nuclear receptor associated (ACTR and SRC-1 proteins). 5 Despite the lack of sequence similarity between the three best-characterized families, GNAT, MYST, and p300/CBP, protein members share a similar structural core, affinity for acetylating histone tails, and binding pocket for the acetyl donor molecule, acetyl-coenzyme A (AcCoA).6,7
Substrate specificity of HATs is accomplished by the combination of proteins in complex with the HAT enzyme and the amino acids surrounding the substrate lysine residue.8,9 For example, Gcn5 recognizes a number of histones but has particular affinity to histone 3 on the basis of its 10 N-terminal amino acids. 9 A number of nonhistone HAT substrates have also been identified, including p53, which is acetylated by p300 to modulate p53-dependent transcription, cell growth, and apoptotic response.10,11 Moreover, a recent report by Choudhary et al. described the use of high-resolution mass spectrometry (MS) to identify 3600 acetylation sites on 1750 proteins, underscoring the potential breadth of regulation accomplished by acetylation. 3
A number of assay formats have been developed to study this modification. Traditionally, HAT activity was measured with a radioactive filter binding assay. 12 In this format, [ 3 H]acetyl-coenzyme A (CoA) is used to donate radioactive groups to the substrate, which are then retained on a filter and quantified by scintillation. However, because of the discontinuous character of this format, other radioactive assays that were more amenable for high-throughput screening, such as those based on streptavidin-covered beads 13 and scintillation proximity, 14 were developed. These assays, however, still presented the high costs and special handling precautions associated with radioactive work, incentivizing the development and use of nonradioactive formats.
Another approach for measuring HAT activity uses antibodies that specifically recognize acetylated proteins. 15 After the acetylation reaction, products are typically resolved by electrophoresis, transferred to a membrane, and protein immunoblotted using the appropriate antibody. Although this technique is very sensitive, it is not typically regarded as quantitative or high throughput.
To overcome these drawbacks, several spectroscopic assays to measure HAT activity have been developed that leverage the production of CoA during the HAT reaction ( Fig. 1 ). Detection of CoA production can be carried out using a secondary reaction that requires CoA as a substrate. In one example, pyruvate dehydrogenase couples the consumption of CoA to the formation of NADH, which can be quantified photometrically. 16 A clear advantage of this format is its broad applicability, because CoA production is common to all HAT activity regardless of enzyme or substrate. Relative to other assays, however, coupled assays can require more product formation (low µM) to produce significant changes in signal and demand considerable amounts of material. Therefore, there is still an unmet need for high-throughput HAT assays that require no special handling precautions, use inexpensive materials, and have high sensitivity.
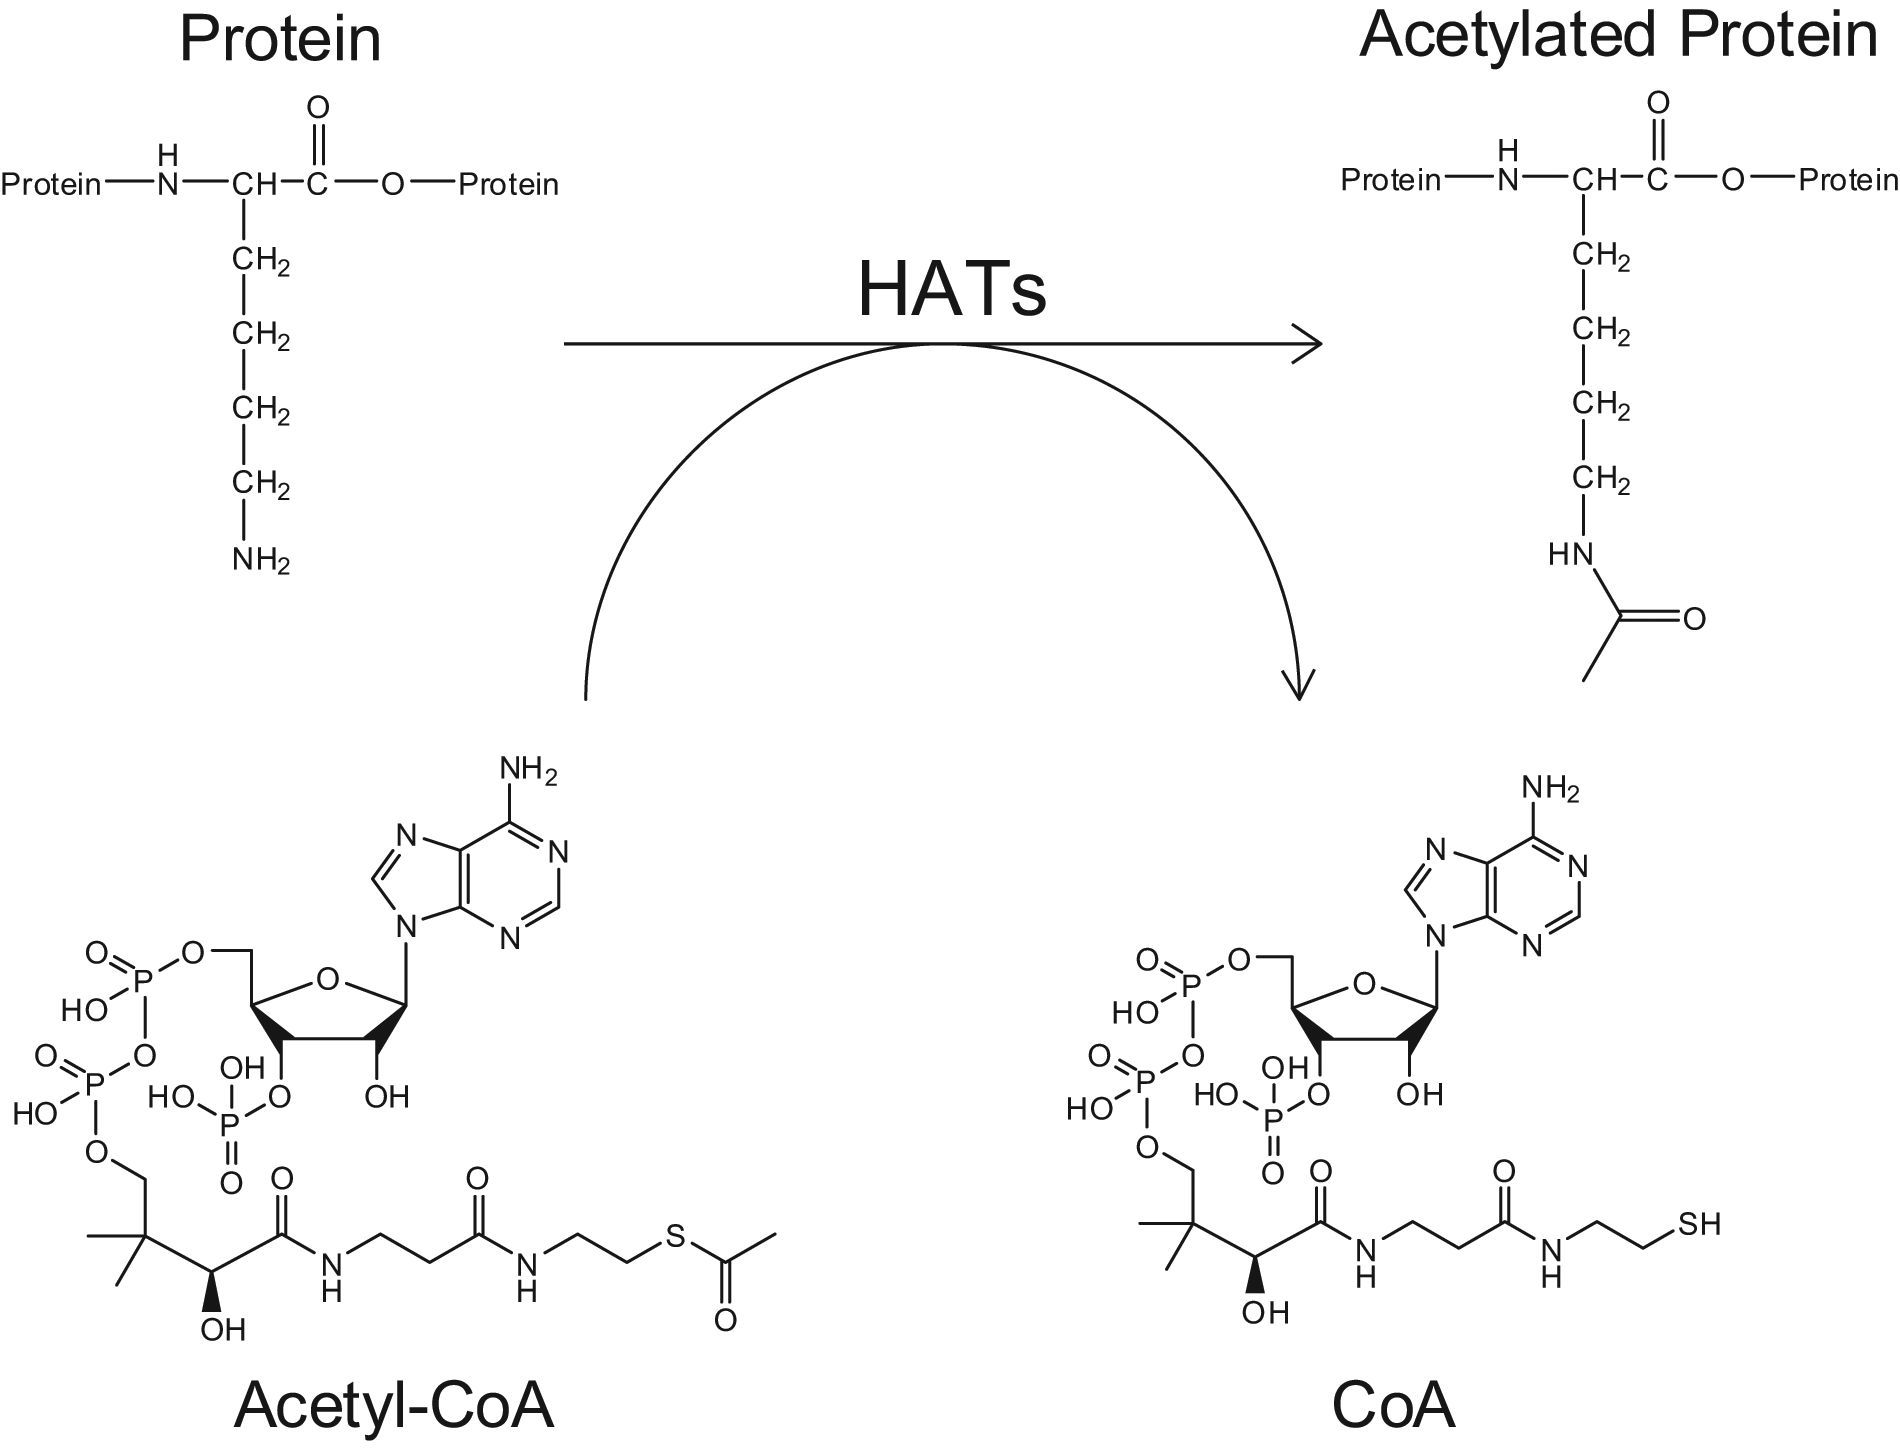
Reaction scheme of protein acetylation by histone acetyltransferases (HATs). Lysine residues are acetylated by HAT enzymes in a reaction that consumes acetyl-CoA. Reaction products include the acetylated protein and CoA molecules, providing multiple ways to measure HAT activity directly.
In this article, three label-free methods for studying HAT activity are presented. Each method is based on the fast and direct measurement of one or more substrate-product pairs using a high-throughput solid phase extraction tandem mass spectrometry (HT-SPE/MS) system. In the first method, the peptide species are monitored by MS to determine linear conversion ranges, Michaelis Km constants, and IC50 values for multiple inhibitors. In this fashion, the pCAF and p300 enzymes were characterized on the histone 3 (5–23) and p53 (368–386) peptides, respectively. Because MS-based methods enable multiple transitions to be measured discretely at the same time, reactions between p300 and the p53 substrate were observed to produce up to quadruply-acetylated peptide over time, illustrating an advantage of using HT-SPE/MS to study reactions with the potential for multiple modification events.
In the second method presented, HAT activity is measured by monitoring the AcCoA cosubstrate and CoA coproduct directly by MS, obviating the need for a second enzymatic step. Using this method, reactions between the same enzyme-peptide pairs described above were measured and IC50 data for multiple inhibitors were produced. Comparison of IC50 data generated by MS analysis on the peptide species and MS analysis on the AcCoA/CoA species displayed good correlation between the two methods. Because the AcCoA cosubstrate and CoA coproduct are integral to the HAT reaction ( Fig. 1 ) regardless of the enzyme and protein substrate involved, monitoring these species facilitates the measurement of whole protein modification, and inhibition of p300-mediated acetylation of whole histone proteins is demonstrated.
The third method of measuring HAT activity presented here involves the use of time-of-flight (TOF) MS to monitor the mass of whole proteins directly. Using HT-SPE/MS, we demonstrate the fast acquisition of scan-range data quantifying the abundance of histone proteins modified with zero, one, and two acetyl groups. Comparison of inhibition data generated using this detection method and that for AcCoA/CoA measurement revealed good correlation, establishing the direct detection of whole proteins by high-throughput TOF-MS as a viable screening strategy. In summary, the three methods presented here define unique and powerful tools for label-free screening of HAT enzymes and characterizing the roles of acetylation in epigenetics.
Materials and Methods
Reagents
pCAF and p300 enzymes along with histone 3 peptide (p-271, Histone H3 Peptide, residues 5-23, Ac-QTARKST GGKAPRKQLATK-NH2) and p53 peptide (p-198, p53 Peptide, 368-386, Ac-HLKSKKGQSTSRHKKLMFK-NH2) were obtained from Enzo Life Sciences (Plymouth Meeting, PA). Whole histone proteins (H5505, histone from calf thymus), AcCoA, CoA, garcinol, curcumin, and anacardic acid were from Sigma Aldrich (St. Louis, MO). All other general biochemical reagents were obtained from Sigma-Aldrich or Fisher Scientific (Pittsburgh, PA).
MS optimization
Analytes of interest (peptides, AcCoA, and CoA) were each diluted to a concentration of 1 to 2 µM into 1:1 ethanol:doubly-distilled water (ddH2O) containing 0.1% formic acid and infused at ˜30 µL/min into a triple-quadrupole (QQQ) mass spectrometer operating in positive electrospray ionization mode for peptides or negative electrospray ionization mode for AcCoA and CoA. Each analyte’s preferred charge state in Q1 was found (parent ion), along with a specific Q3 fragment (daughter ion) that was chosen to maximize signal in multiple reaction monitoring (MRM) mode. All other MS parameters were individually optimized for each molecule.
Whole histones were diluted to 1 mg/mL in ddH2O containing 1% formic acid and placed in the odd columns of a 96-well plate (even columns contained just 1% formic acid). MS conditions were determined from analysis of samples after desalting by HT-SPE/MS. Initial parameters were chosen based on a generic protein detection method. These parameters were verified, and MS conditions were optimized over a series of injections.
HAT reactions
pCAF reactions with the H3 peptide were carried out at room temperature in reaction buffer containing 50 mM HEPES pH 8.0, 0.1 mM EDTA, and 0.05% BSA. AcCoA was present at 1.4 µM (enzyme titration time course and IC50s), 20 µM (peptide titration), or 10, 5, 2.5, or 1.25 µM (AcCoA titration). H3 peptide was present at 0.67 µM (enzyme titration time course and IC50s); 5, 2.5, 1.25, or 0.625 µM (peptide titration); or 10 µM (AcCoA titration). pCAF was added to the reactions at 50 nM (enzyme titration time course), 0.5 nM (peptide titration), 2.6 nM (AcCoA titration), or 1.3 nM (garcinol and anacardic acid IC50s). IC50 plates were prespotted with inhibitor (1 µL of a 50× stock in dimethyl sulfoxide). Reactions were initiated by the addition of 1/10th volume of 10 × peptide substrate and quenched by the addition of an equal volume of 2% formic acid.
Acetylation of the p53 peptide by p300 was carried out at room temperature in the same reaction buffer as above. Reactions contained AcCoA at 120 µM (successive acetylation experiment), 8 µM (enzyme titration time course and IC50s), 100 µM (peptide titration), or 3.75, 7.5, 15, or 30 µM (AcCoA titration). p53 peptide was present at 10 µM (successive acetylation experiment); 1.5 µM (enzyme titration time course and IC50s); 2.5, 5, 25, or 50 µM (peptide titration); or 50 µM (AcCoA titration). Enzyme was added at a concentration of 44 nM (successive acetylation experiment); 2.25, 4.5, 9, or 18 nM (enzyme titration time course); 22 nM (peptide titration); 11 nM (AcCoA titration); or 9 nM (IC50s). IC50 plates were prespotted with inhibitor (1 µL of a 50× stock in dimethyl sulfoxide), subjected to a 15-min preincubation before initiation, and quenched after 7.5 min. As with pCAF, reactions were initiated by the addition of 1/10th volume of 10× peptide substrate and quenched by the addition of an equal volume of 2% formic acid.
Reactions with whole histones and p300 were conducted at room temperature in the same buffer as above containing 200 µM AcCoA, 2 mg/mL whole histone proteins, and 110 nM p300 enzyme. Inhibition reactions were done in plates prespotted with inhibitor (1 µL of a 50× stock in dimethyl sulfoxide) and again preincubated for 15 min before initiation with a 1/10th volume of 10× histone proteins. Reactions were incubated for 40 min and then quenched by the addition of 1/10th volume of 10% formic acid.
SPE and MS detection
Quenched samples were analyzed by HT-SPE/MS on an Agilent RapidFire 200 high-throughput MS system using either a triple-quadrupole mass spectrometer fitted with an electrospray ionization source and running in MRM mode or an Agilent 6530 Q-TOF system fitted with an ESI JetStream source operating in positive TOF mode. The RapidFire system aspirated aliquots of each sample sequentially. Of each aliquot, 10 µL was applied to an SPE cartridge, the packing material of which was chosen to best retain the analyte(s) of interest. After a wash step to remove the reaction components that are incompatible with MS, the sample was reverse eluted and sent to the mass spectrometer, which was either already monitoring the mass transitions of interest or was scanning the range of interest. Reactions were analyzed twice, once using a method to detect the substrate and product peptides or proteins and once under a method designed to detect the AcCoA and CoA cosubstrate and coproduct. Details for each detection method are provided below.
H3 peptide
Using the RapidFire system, samples were aspirated for 250 ms, loaded onto cartridge A, washed with ddH20 supplemented with 0.01% trifluoroacetic acid and 0.09% formic acid for 3 s, and eluted in 80% acetonitrile supplemented with 0.01% trifluoroacetic acid and 0.09% formic acid for 5 s. A reequilibration step of 500 ms brings the total cycle time to 8.75 s. The mass spectrometer was operated in positive mode, and transitions of 414.7/475.3 (0ac), 423.1/485.8 (1ac), 431.5/496.3 (2ac), 439.9/506.8 (3ac), and 448.3/517.3 (4ac) were monitored. Preliminary experiments with pCAF revealed the formation of just the 1ac product (data not shown), so all percentage conversion data are calculated based on the amount of 1ac observed.
p53 peptide
Using the RapidFire system, samples were aspirated for 250 ms, loaded onto cartridge A, washed with ddH20 supplemented with 0.01% trifluoroacetic acid and 0.09% formic acid for 3 s, and eluted in 80% acetonitrile supplemented with 0.01% trifluoroacetic acid and 0.09% formic acid for 3 s. A reequilibration step of 500 ms brings the total cycle time to 6.75 s. The mass spectrometer was operated in positive mode, and transitions of 463.4/533.7 (0ac), 471.5/544.1 (1ac), 479.9/554.6 (2ac), 488.3/565.1 (3ac), 496.7/575.6 (4ac), 505.1/586.1 (5ac), and 513.5/596.6 (6ac) were monitored. Multiple acetylation states were observed for the p53 peptide, and in all experiments other than the substrate titrations, percentage conversion data were calculated based on the sum of all possible products. The peptide substrate titration experiments was conducted in the range of linear conversion of the first acetylation step (0ac to 1ac), and values for only those two species were used to generate the curves from which the Km value was calculated.
Whole histones
Using the RapidFire system, samples were aspirated for 250 ms, loaded onto cartridge E, washed with ddH20 supplemented with 0.01% trifluoroacetic acid and 0.09% formic acid for 5 s, and eluted in 80% acetonitrile supplemented with 0.01% trifluoroacetic acid and 0.09% formic acid for 5 s. A reequilibration step of 500 ms brings the total cycle time to 10.75 s. The Q-TOF mass spectrometer was operated in positive mode scanning from 500 to 1700 at a rate of 1 spectrum/s.
AcCoA and CoA
Using the RapidFire system, samples were aspirated for 250 ms, loaded onto cartridge D, washed with ddH20 for 3 s, and eluted in 2:1:1 H2O:acetone:acetonitrile containing 5 mM ammonium acetate in 3 s. A reequilibration step of 500 ms brings the total cycle time to 6.75 s. The mass spectrometer was operated in negative mode, and transitions of 808.3/158.9 (AcCoA, cosubstrate) and 766.3/408.1 (CoA, coproduct) were monitored.
Data processing and analysis
Peptide and AcCoA/CoA data were collected by RapidFire-QQQ-MS analysis and integrated using Agilent’s proprietary RapidFire Integrator software (version 3.4). Whole histone data were collected on a RapidFire-TOF-MS system. Spectra were extracted from the peaks of the resulting chromatograms and deconvoluted using MassHunter Qualitative Analysis B.03.01, and the generated AUCs were recorded for each acetylation state. Integrated data were analyzed using Excel 2007. Km values were calculated in GraphPad Prism 5 (GraphPad, San Diego, CA) using the Michaelis-Menten algorithm, Velocity = (Vmax · [S])/(Km + [S]), where Vmax is the maximum rate, [S] is the substrate concentration, and Km is the substrate Michaelis constant. IC50 values were calculated in GraphPad Prism 5 using the one-site competition algorithm Y = Bottom + (Top – Bottom)/(1 + 10^(X-LogIC50)), where LogIC50 is the concentration of the competitor required to inhibit half of the maximum reaction, Top is the plateau of reaction in the absence of inhibitor, and Bottom is the plateau of reaction at maximum inhibitor concentration. Reactions were run in at least triplicate, and error bars represent one standard deviation.
Results
HAT activity ( Fig. 1 ) transfers the acetyl group from an acetyl-CoA molecule to an unmodified lysine residue of a peptide, thus creating two products: an acetylated peptide and a molecule of CoA. MS can detect either mass shift, allowing the reaction to be followed either by monitoring the peptide substrate/product pair or the acetyl-CoA/CoA pair. The lower limit of detection for each method was determined to be approximately 10 nM (data not shown).
Characterization of pCAF-mediated acetylation of an H3 peptide
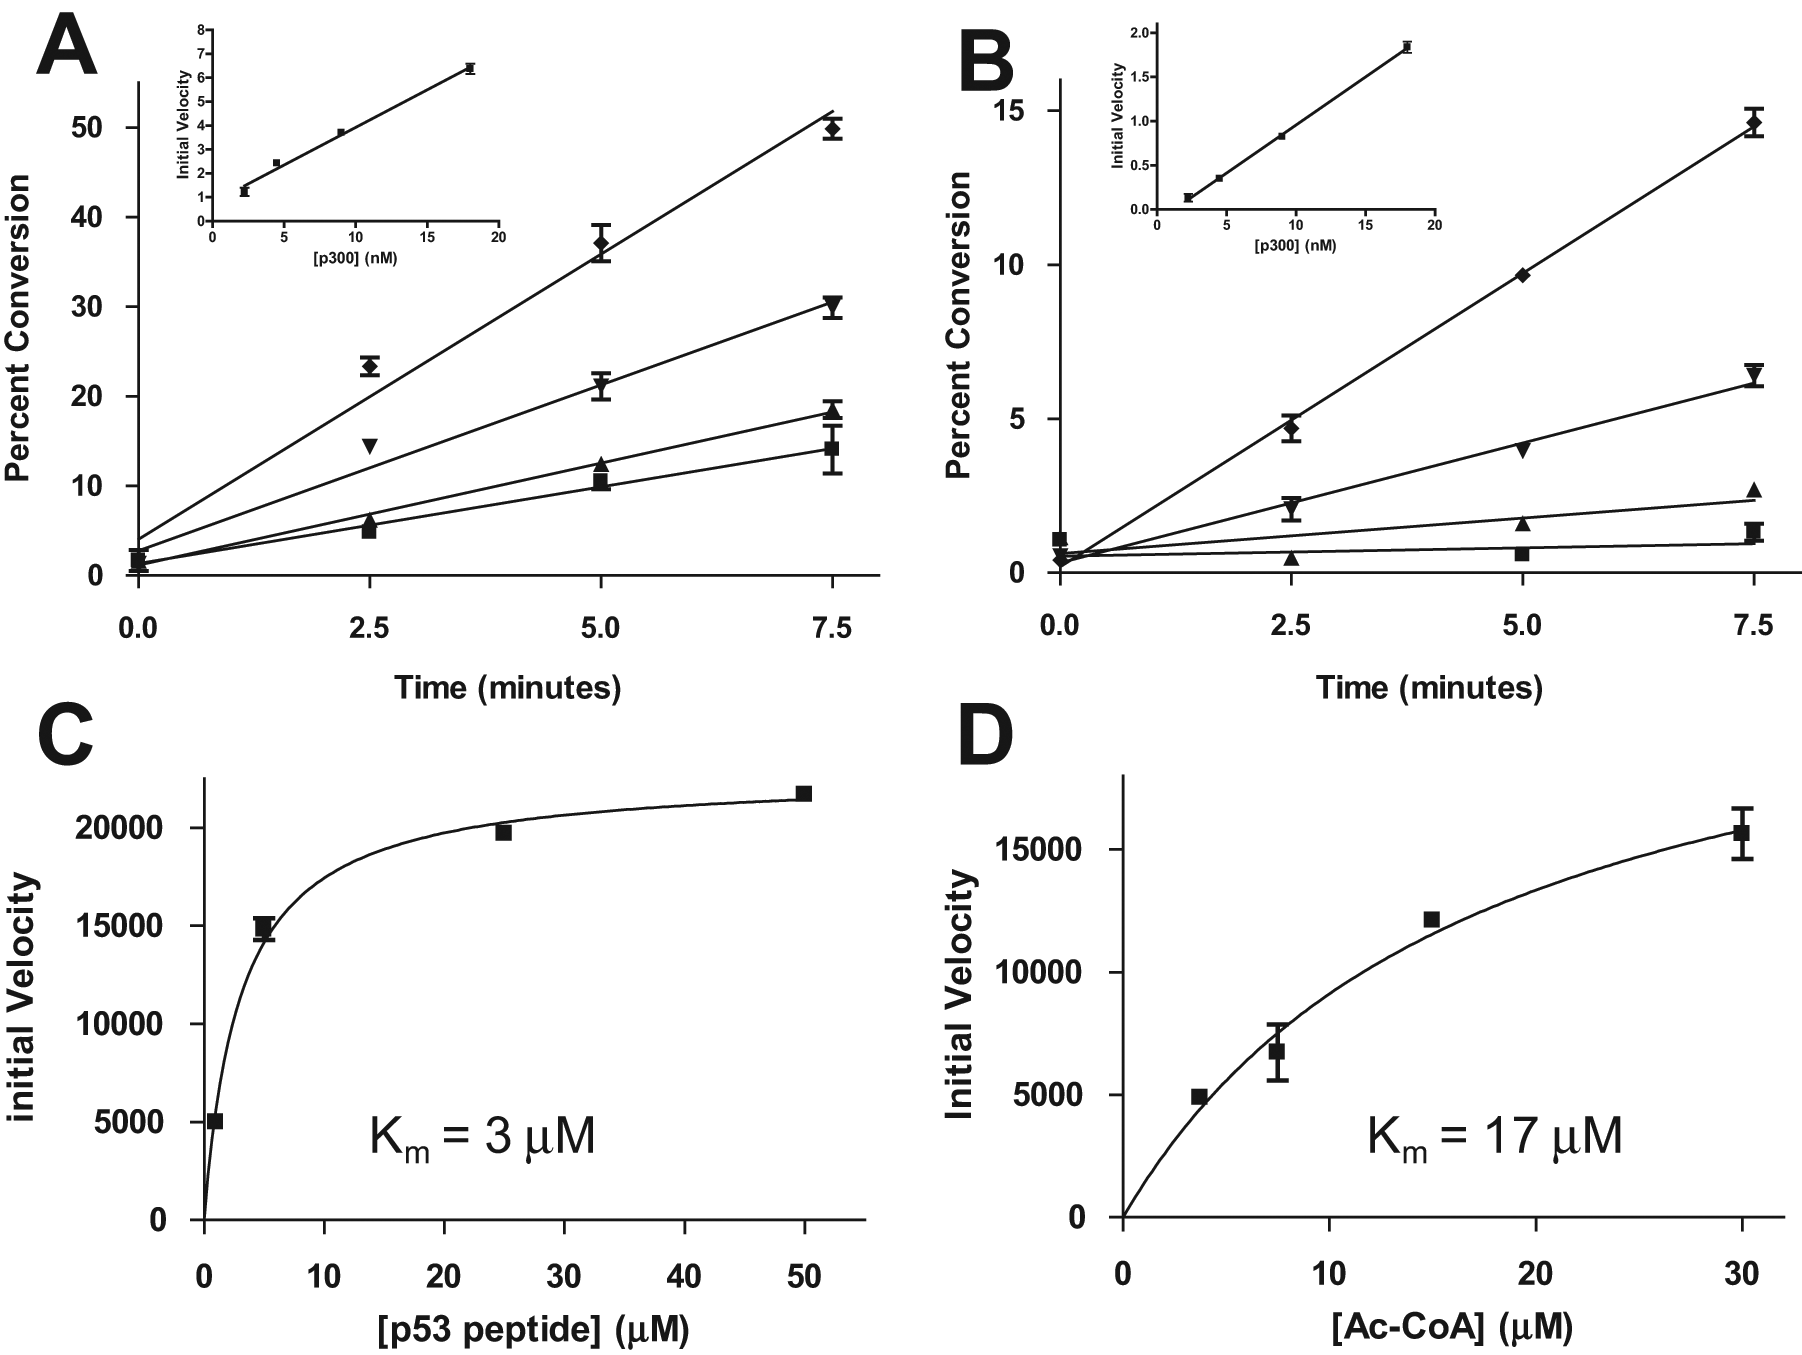
The first step in assay development for the pCAF HAT enzyme with an H3 peptide was to carry out an enzyme titration time course to determine what reaction conditions ensure linear product formation with time as well as linear enzyme kinetics. Reactions were carried out at four different enzyme concentrations for time periods up to 10 min. The samples were then analyzed twice, once for the peptide/acetylated peptide and once for AcCoA/CoA. Figure 2A depicts the results obtained via the peptide method, showing linear formation of product with time for different lengths of time at the various enzyme concentrations. Plotting the slope of the linear portion of each time course against the enzyme concentration demonstrates that the experiment was done in the range of linear enzyme kinetics. Figure 2B shows the results of the same experiment analyzed for conversion of AcCoA to CoA. The results are virtually identical, establishing that the two methods produce essentially the same results and revealing the interchangeability of the two methods.
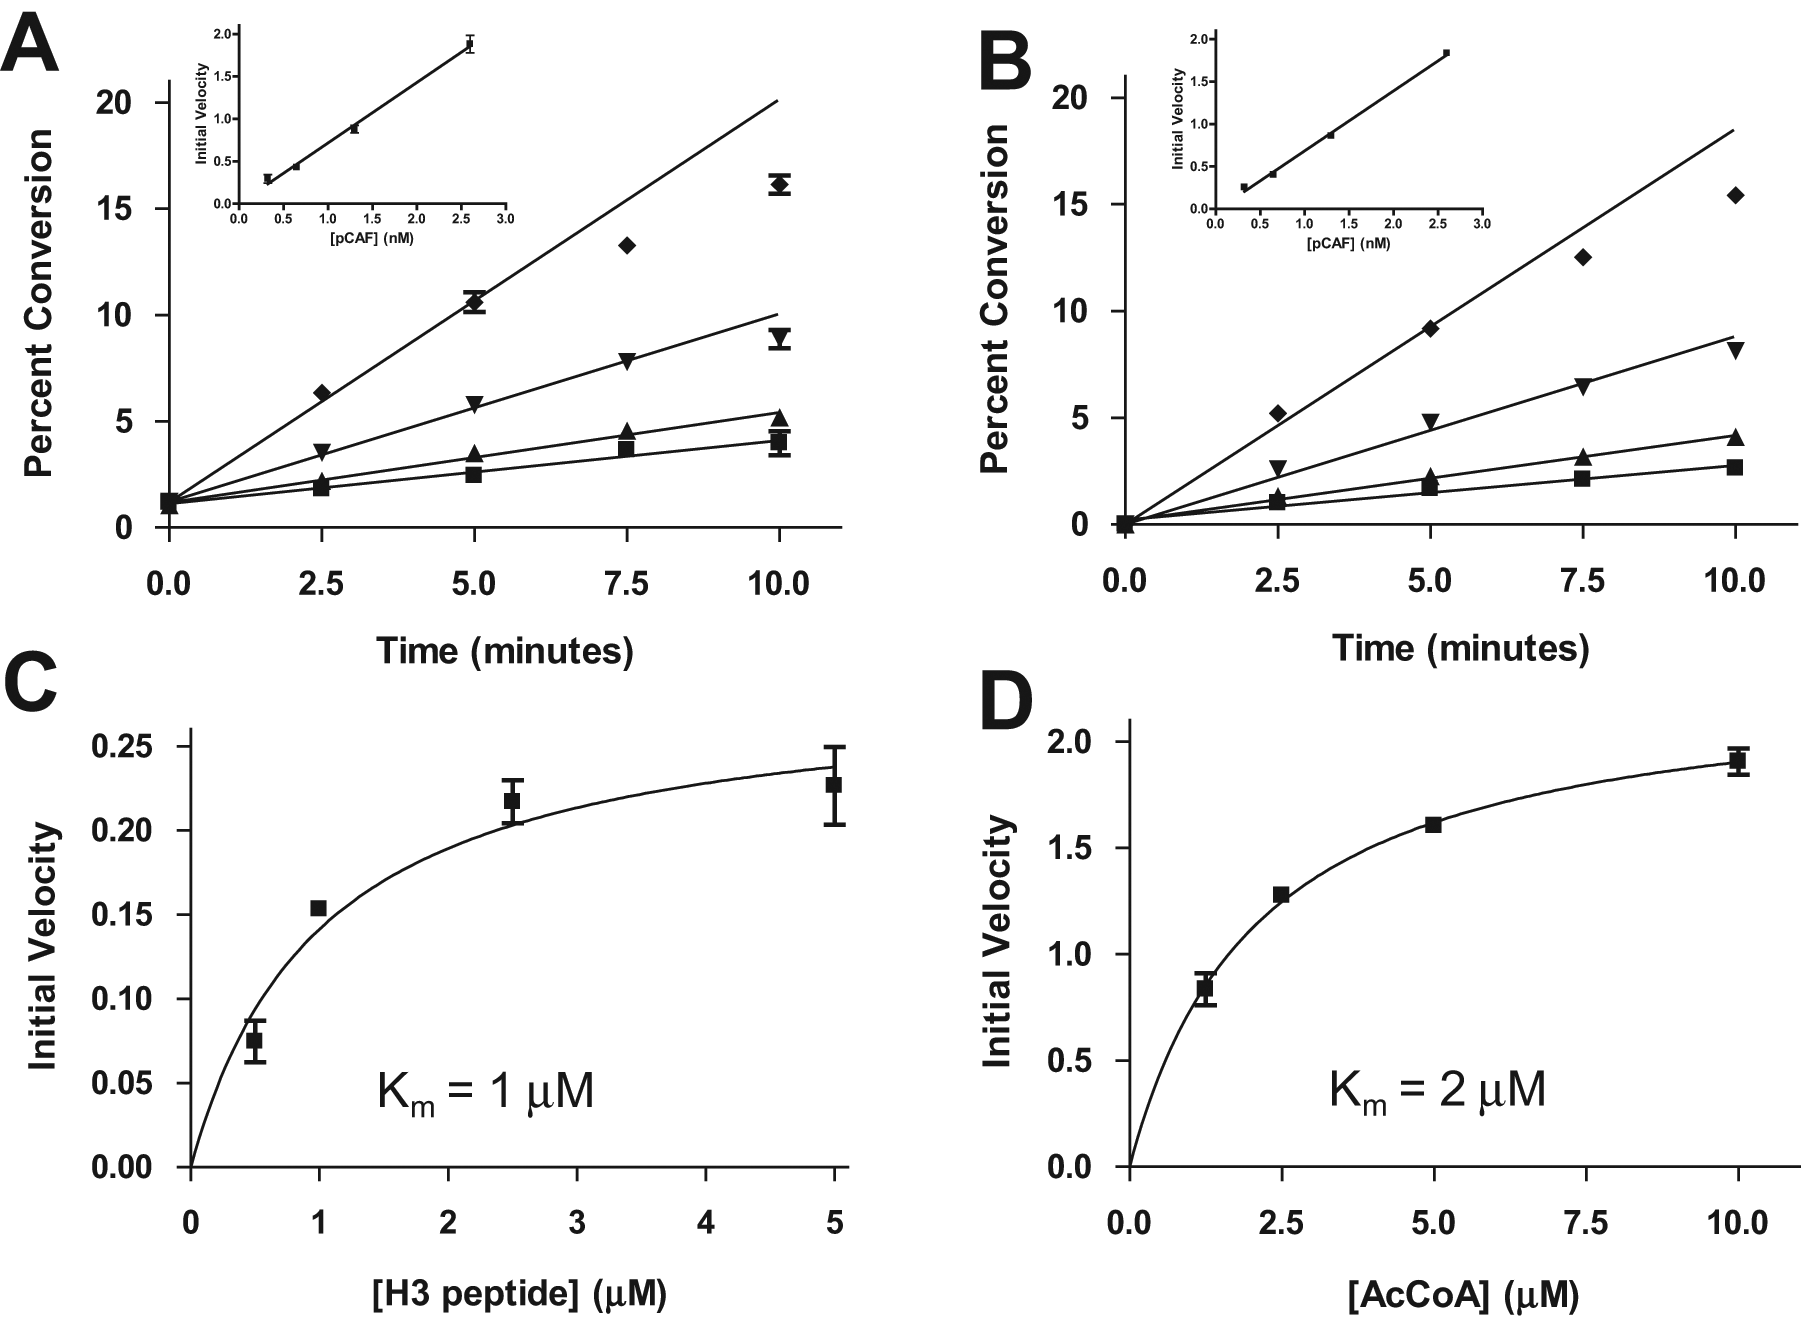
Acetylation of an H3 peptide by pCAF. Enzyme titration time course data were analyzed for the substrate/product peptides (
Studies investigating enzyme velocity as a function of substrate concentration were conducted by titrating one substrate, either the H3 peptide or AcCoA, while the other substrate was at a saturating concentration (in each case, 10 × Km; see the Materials and Methods section). For each experiment, the conversion of the titrated substrate to its corresponding product was monitored. Plotting the initial velocities of those time courses against the corresponding substrate concentration allowed enzyme velocity curves to be generated, from which Km values of 1 µM ( Fig. 2C ) and 2 µM ( Fig. 2D ) were obtained for the H3 peptide and AcCoA cosubstrate, respectively.
Knowledge of these values allowed inhibition experiments to be set up with two different compounds, garcinol and anacardic acid, at eight concentrations. Each reaction was analyzed under both methods, with the results of the peptide analysis shown in Figure 3A and the AcCoA/CoA method in Figure 3B . Under the peptide method, IC50 values of 52 and 33 µM were obtained for garcinol and anacardic acid, respectively, whereas 75 and 32 µM were obtained under the AcCoA method. The good agreement between the values obtained under the different methods further demonstrates the superimposable nature of data acquired under the two protocols.
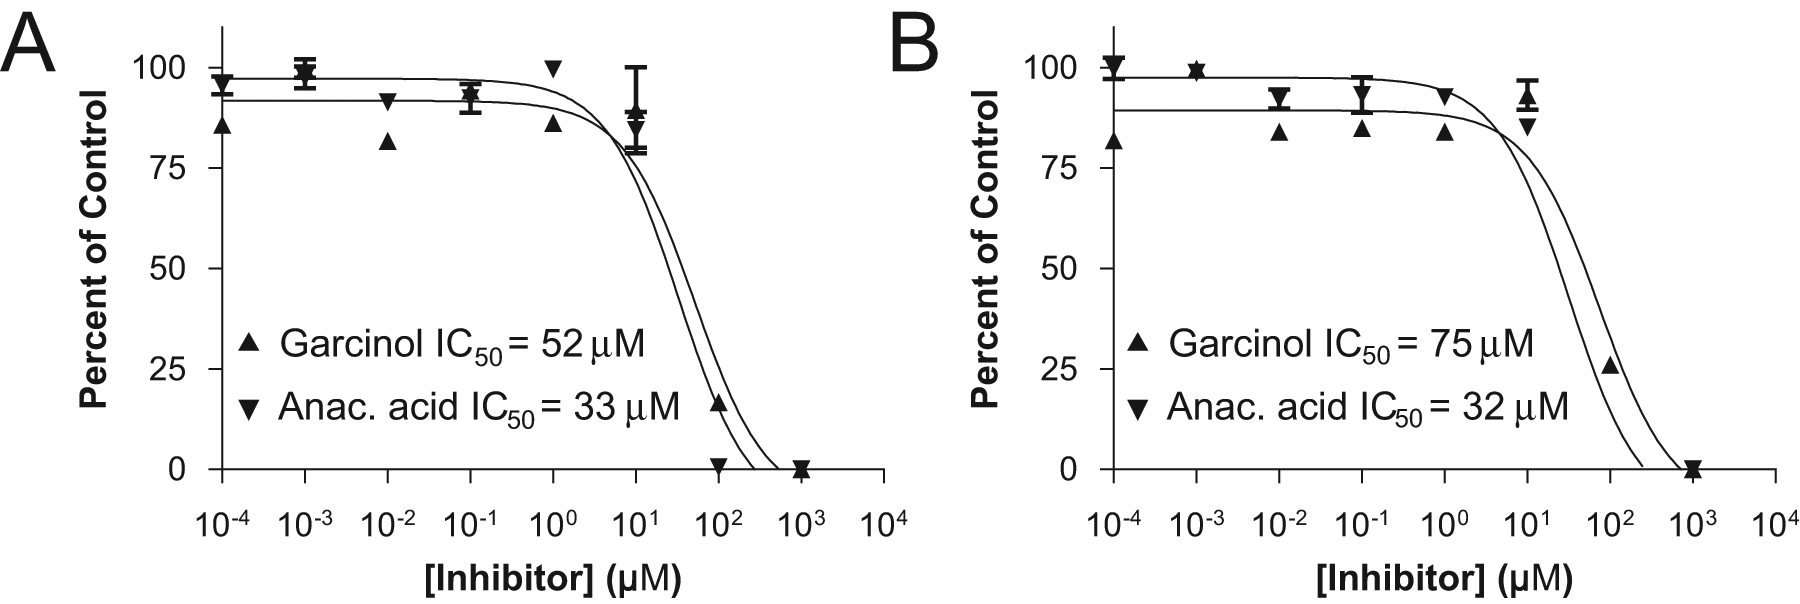
Inhibition of pCAF by garcinol and anacardic acid (anac. acid), analyzed for the substrate/product peptides (
Mass spectrometry allows the acquisition of additional information
In addition to providing two robust options for monitoring the peptide acetylation reaction, MS offers the advantage of allowing the attainment of much more detailed information than is available through other methods. Because the acetylation reaction takes place at lysine residues, the possibility exists of multiple modifications to a peptide or protein substrate that contains several lysines. Traditional methods of screening cannot tell the difference, for example, between two substrates being singly acetyled versus one substrate being doubly acetylated. Because each acetylation state is of a unique molecular mass, however, mass spectrometry can independently quantify the amount of each state present in a reaction. As shown in Figure 4 , a p53 peptide representing residues 368 to 386 and containing six lysines was incubated with p300 enzyme in an extended time course. MRM transitions for all seven possible acetylation states (0ac–6ac) were monitored, and the results for 0ac–4ac, presented in Figure 4 , demonstrate that successive modifications to p53 do in fact occur. No molecules with acetylations at more than four of the six lysine sites are observed in the span of a 7-h incubation. Therefore, the data for the 5ac and 6ac species were omitted from the figure.
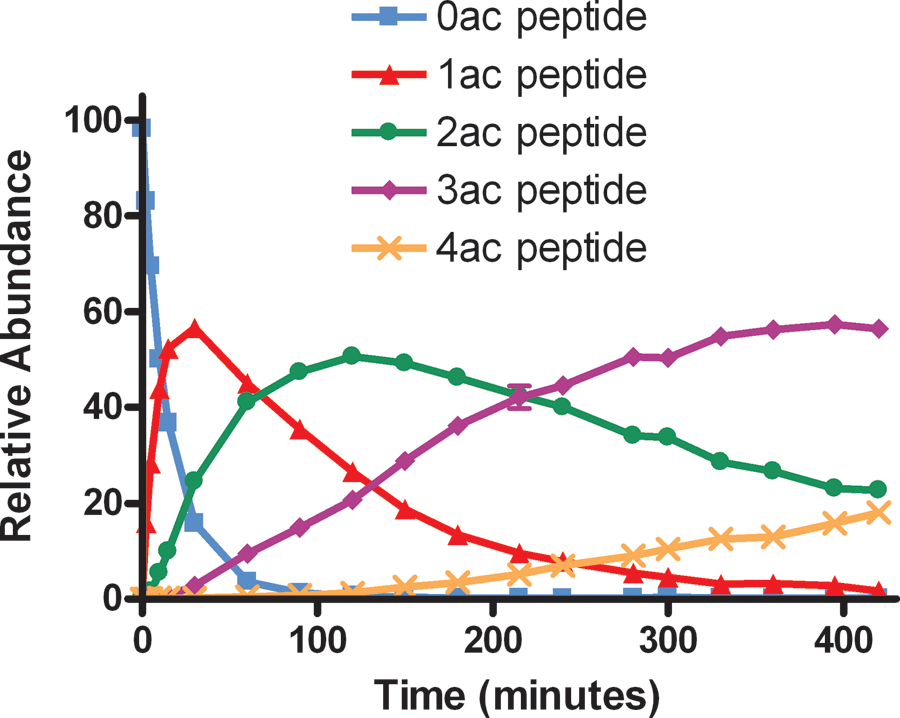
Successive acetylation of a p53 peptide by p300. The conversion of 0ac substrate (blue squares), to 1ac (red triangles), 2ac (green circles), 3ac (purple diamonds), and 4ac (orange X signs) species is observed over time.
Characterization of p300-mediated acetylation of a p53 peptide
Similarly to the pCAF assay previously discussed, a full study of the modification of a p53 peptide by the p300 enzyme was also carried out, starting with a time course experiment at four different enzyme concentrations. The samples were analyzed for both the p53 substrate and product as well as the AcCoA cosubstrate and CoA coproduct. Peptide results, shown in Figure 5A , demonstrate linear product formation with time at all four enzyme concentrations tested. Plotting the slopes against the enzyme concentration reveals that the experiment was conducted in the range of linear enzyme kinetics. The AcCoA results ( Fig. 5B ) agree almost exactly with the peptide results, showing both linear product formation over time and linear reaction velocity as a function of enzyme concentration, once again underscoring the agreement between data acquired under the two methods.
Acetylation of a p53 peptide by p300. Enzyme titration time course data were analyzed for the substrate/product peptides (
As with pCAF, substrate titration experiments were next carried out to determine the Michaelis constants for the peptide and AcCoA substrates. Figure 5C depicts the initial velocities of time courses using various amounts of peptide substrate against the peptide concentration. The data allowed a Km value of 3 µM to be calculated for the p53 peptide. Likewise, time course experiments were conducted at four concentrations of AcCoA cosubstrate. The initial velocities for the four sets of reactions are plotted against AcCoA concentration in Figure 5D , and the GraphPad curve fit allowed a Km value of 17 µM to be calculated for the AcCoA cosubstrate.
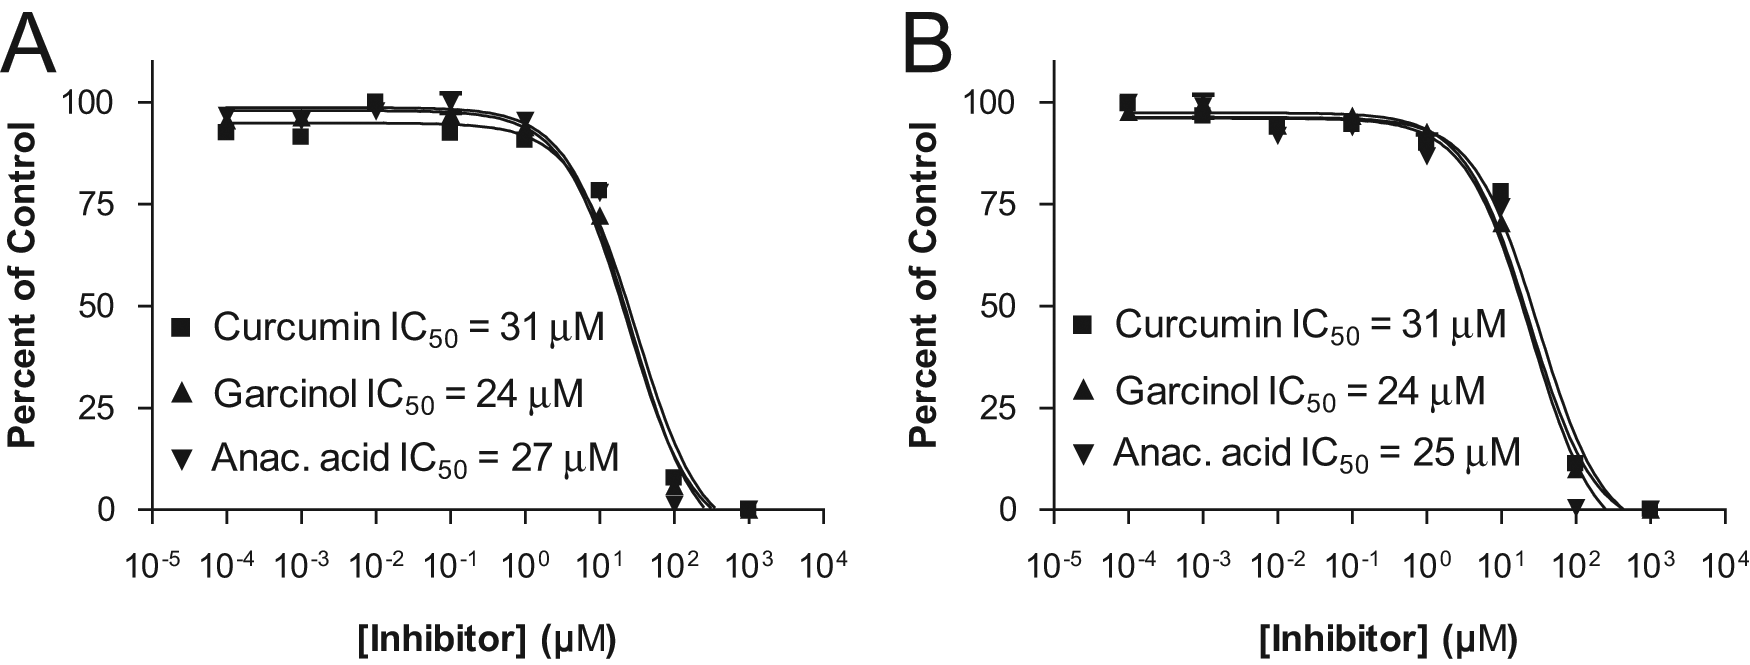
Inhibition of the reaction was observed under both detection methods with three different compounds, specifically curcumin, garcinol, and anacardic acid. Inhibitor titration experiments were conducted and analyzed both for the p53 peptide substrate and product and for AcCoA and CoA. Figure 6A shows the results obtained under the peptide method, with curve fits generating values of 31 µM for curcumin, 24 µM for garcinol, and 27 µM for anacardic acid. The results obtained via the AcCoA/CoA method are presented in Figure 6B , with curve fits producing values of 31 µM for curcumin, 24 µM for garcinol, and 25 µM for anacardic acid, which correlate well with the values obtained via the peptide method.
Inhibition of p300 by curcumin, garcinol, and anacardic acid, analyzed for the substrate/product peptides (
HT-SPE/MS enables screening using whole protein substrates
The RapidFire system is compatible with many types of mass spectrometers, facilitating the study of more biologically relevant molecules, such as whole proteins, that are a better representation of the in vivo reaction. For example, whole proteins, which are frequently poor candidates for detection by QQQ-MS, are well suited to study by TOF-MS. Figure 7A depicts the deconvoluted TOF-MS data obtained from HT-SPE/MS analysis of p300 enzyme incubated with whole histone proteins in the presence of six concentrations of garcinol (each concentration was tested in triplicate). The deconvoluted spectra show the observation of just the unacetylated state (0ac) in the presence of high inhibitor (front) and the appearance of acetylated states (1ac and 2ac) as the concentration of garcinol decreases. Analysis of the TOF-MS data in GraphPad Prism produced an IC50 value of 35 µM ( Fig. 7B , squares).
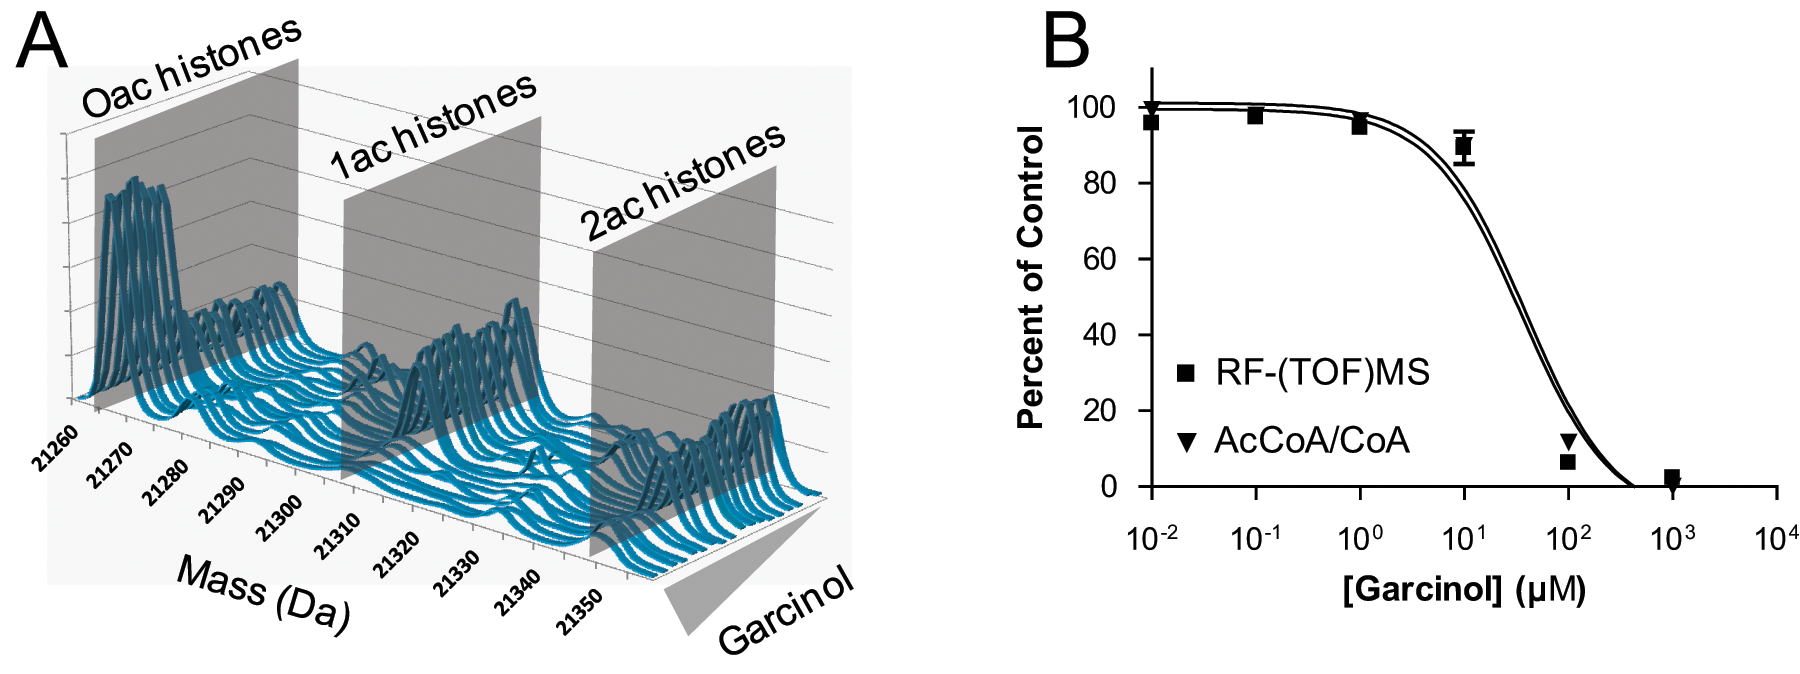
Inhibition of p300 by garcinol when using whole histone proteins as a substrate. Deconvoluted RapidFire time-of-flight (TOF) mass spectrometry (MS) data for 18 reactions (endpoint IC50, six concentration in triplicate) showing increasing acetylation (going toward back) with decreasing inhibitor concentration (
In some cases, however, access to a TOF-MS is unavailable, a whole protein substrate of interest is challenging to detect directly, or a complementary confirmation of results is desired. Because the equimolar conversion of AcCoA to CoA occurs independent of the substrate to which the acetyl group is transferred, monitoring this co-reaction eliminates the need to develop new methods for each new substrate to be studied. The same whole histone acetylation reactions depicted in Figure 7A were analyzed by QQQ-MS, monitoring for AcCoA and CoA. The results ( Fig. 7B , triangles) generated an IC50 value of 39 µM, which agrees quite well with that acquired via measuring the whole protein, establishing the AcCoA method as a valid surrogate for direct protein detection in cases in which TOF-MS is not feasible or when new method development is inefficient or impractical.
Discussion
The acetylation of histones and other proteins by HATs plays a major role in regulating a multitude of biological events. As such, characterizing these enzymes is critical to understanding the role of acetylation in epigenetic control, and numerous assays have been developed to identify small-molecule modulators of HAT activity. High-throughput MS is particularly suited for screening HATs because it enables the label-free and direct measurement of acetyltransferase substrate and product molecules, circumventing many challenges associated with radiometric, coupled reaction and antibody-based approaches.
Here, reaction protocols for two HAT enzymes, pCAF and p300, were developed to illustrate the utility of the HT-SPE/MS platform. The pCAF enzyme is an attractive target for drug discovery because of its role in cell-cycle arrest and cellular differentiation. 17 In addition, pCAF has been observed to act cooperatively with p300, a major affector of gene expression, to mediate transcription through a multitude of mechanisms.18–20 Therefore, robust assay protocols for these enzymes could potentially enable the discovery of selective inhibitors for therapeutic applications.
Michaelis constant and inhibition values obtained here for the pCAF assay show good correlation with previous literature. Using the HT-SPE/MS system, a Km of AcCoA for pCAF was determined to be 2 µM ( Fig. 2D ), as compared with a reported 2.1 µM for full-length enzyme. 21 The IC50 value for anacardic acid has previously been reported to be 42 µM. 22 This value is very similar to what was calculated here using the peptide analysis ( Fig. 3A , 33 µM) and CoA analysis ( Fig. 3B , 32 µM). Also, we determined the IC50 value of garcinol to be 52 µM when analyzed for the peptide species ( Fig. 3A ) and 75 µM ( Fig. 3B ) when analyzed for the CoA species. These values show good correlation with 69 µM reported elsewhere 22 and corroborate the low potency of this HAT inhibitor.
Despite the presence of four lysine residues in the histone 3 peptide substrate (see the Materials and Methods section), experiments revealed that pCAF acetylated only one of these sites (data not shown). This result was expected as pCAF tends to monoacetylate nucleosomal substrates, preferentially at lysine 14 on the histone 3 tail. 23
In contrast, p300 was found to acetylate the p53 peptide at four unique lysine sites. As shown in Figure 4 , as reaction time increases, the disappearance of the 0ac peptide species (blue squares) is coupled to the formation of the 1ac (red triangles), 2ac (green circles), 3ac (purple diamonds), and 4ac (orange X signs) products. Although the peptide contained a total of six lysine residues (see the Materials and Methods section), no formation of the 5ac or 6ac species was observed (data not shown). A previous report that p300 acetylates p53 within its carboxy terminus at four sites (lysine 372, 373, 381, and 382) 24 is consistent with our observations and underscores the utility of monitoring multiple products discretely with high-throughput MS.
Similar to the data obtained for the pCAF assay, good correlation is also observed when comparing the p300 Michaelis constant and inhibition values here to previous reports. Depending on the enzyme form and substrate used, literature values for the Km of AcCoA have varied between 1 µM and 30 µM, 25 and the concentration determined here ( Fig. 5D , 17 µM) falls in the middle of this range. Inhibition of p300 with curcumin, garcinol, and anacardic acid has also been studied, and IC50 values for these molecules have been reported as 25 µM, 26 µM, and 35 µM, respectively.26,27 When analyzing IC50 reactions for the peptide species, values of 31 µM, 24 µM, and 27 µM were obtained for these three molecules ( Fig. 6A ). Near identical values (31 µM, 24 µM, and 25 µM) were determined for the three inhibitors when the reactions were analyzed for the CoA species ( Fig. 6B ), establishing a high degree of confidence in the correlation between the two methods as well as to previously described assay formats.
Given the established validity of measuring HAT reactions by monitoring the AcCoA/CoA species, the method was extended to study the acetylation of whole histone proteins by p300. The IC50 data for garcinol when histone proteins are acetylated ( Fig. 7B ) were very similar to when the p53 peptide was acetylated ( Fig. 6B ), confirming the versatility of the AcCoA/CoA method, enabling HAT reactions to be studied independent of the enzyme/substrate pair.
Still, in situations in which a more detailed understanding of the acetylated species being produced is desired, TOF-MS can provide data on whole proteins because of its wide mass detection range. To illustrate the fast and direct measurement of whole protein modification, the IC50 of garcinol was analyzed by HT-SPE/MS. The presence of 0ac, 1ac, and 2ac histone proteins was observed, and the extent of product formation correlated well with inhibitor concentration ( Fig. 7A ). Analysis of the TOF-MS data revealed an IC50 curve that was superimposable with the data generated by measuring the CoA species ( Fig. 7B ), establishing HT-SPE/MS as an accurate method for analyzing modifications to whole proteins directly.
In summary, the three methods described here present powerful tools for screening HAT enzymes. First, using HT-SPE/MS to measure the substrate and product peptides enables multiple potential products to be monitored directly, discretely, and concurrently. Understanding the true nature of the products formed can assist enzyme characterization, facilitate the development of a robust screening protocol, and provide more detailed data on activity inhibition. Second, in situations in which the simplicity of monitoring the CoA species is appropriate, the direct measurement of AcCoA and CoA circumvents the need for developing peptide-/protein-specific methods and thereby provides the means to study the acetylation of any HAT substrate. Third, use of the HT-SPE/MS system enables the modification of whole proteins to be analyzed directly and maximizes the benefits of direct measurement of truly native substrates. The three methods presented here advance our ability to investigate acetylation in distinct ways and should accelerate our understanding of this epigenetic modification.