
Abstract
In this paper, we study urban road infrastructure in densely populated cities. As the subject of our study, we choose road networks from 35 populous cities worldwide, including China, India, Pakistan, Colombia, Brazil, Bangladesh, and Cote d’Ivoire. We abstract road networks as complex systems, represented by graphs consisting of nodes and links, and employ tools from network science to study their topological properties. Our multi-scale analysis includes macro-, meso-, and micro-scale perspectives, deriving insights into both common and unexpected patterns in these networks. At the macro-scale, we examine the global properties of these networks, summarizing the results in radar diagrams. This analysis reveals significant correlations among key metrics, indicating that more robust networks tend to be more efficient, while diameter and average path length show negative correlations with other properties. At the meso-scale, we explore the existence of sub-structures embedded within the road networks using two main concepts, namely, community and core-periphery structures. We find that while these densely populated city road networks show particularly strong community structures (high modularity values, close to 1.0) that are not typical to other networks, they exhibit a low level of presence of core-periphery structures, with an average coreness of 6.3%. This points to the cities being polycentric. At the micro-scale, we find nodal-level properties of the network. Specifically, we compute the various centrality measures and examine their distributions to capture the prevalent characteristics of these networks. We observe that the centrality measures present different distribution patterns. While the degree distribution demonstrates a limited range of degree values, the betweenness centrality distribution follows a power law, and the closeness centrality exhibits a binomial distribution—yet these patterns remain consistent across the studied cities. Overall, our multi-scale analysis provides valuable insights into the topological properties of urban road networks, informing city planning, traffic management, and infrastructure development in similar urban environments.
Introduction
Continuous urbanization is fostering the growth of cities around the world (UN Habitat, 2022). These cities act as the hubs or marketplaces for goods and services. They offer more economic opportunities and have attracted influxes of citizens seeking their fortune. Such growth puts strains on the city infrastructures including the transportation system. The seamless functioning of city services relies heavily on an efficient and robust road network which is the subject of study in this paper. Similar to most real-world networks, urban road networks evolve and grow over time, and their complexity increases from the rise of interconnectedness, and the dynamic processes involved, as vehicles navigate within the networks’ configuration and structure (Boeing, 2018).
As urban areas continue to expand and evolve, understanding the structure and dynamics of urban road networks becomes crucial for ensuring sustainable development and improving the quality of life for residents. Given that road networks are the backbone of urban mobility, their design and functionality directly impact economic growth, accessibility, and environmental sustainability. Understanding the topological characteristics of road networks is also essential for a variety of stakeholders, especially urban planners, transportation engineers, and policymakers.
By analyzing the topological features of road networks, these stakeholders can make informed choices regarding infrastructure development, traffic control, and sustainable urban development (Badhrudeen et al., 2022; Buhl et al., 2006). Urban planners benefit from an understanding of the network’s structure when creating efficient designs that encourage public transportation use, mitigate traffic congestion, and improve overall connectivity within urban areas (Casali and Heinimann, 2019; Strano et al., 2012). In transportation engineering, topological assessments are used to understand, evaluate, and also improve the design and functions of transportation networks/systems such as enhancing traffic flow efficiency and pinpointing critical network nodes for infrastructure enhancements (Baruah and Bora, 2018; Jayasinghe et al., 2017). Policymakers leverage this knowledge to allocate resources efficiently and prioritize infrastructure initiatives (Burghardt et al., 2022; Tsiotas and Polyzos, 2017).
In recent years, advancements in understanding the structure and dynamics of urban road networks have been made through the application of various mathematical tools including complex network analysis, graph theory, and epidemic theory (Boeing, 2018) and the corresponding dynamic processes (Kozhabek et al., 2024) to analyze network topology. Various questions have been investigated using such approaches. These include, for instance, the identification of travel behaviors of city inhabitants (Levinson and El-Geneidy, 2009), the evaluation of transportation performance (Levinson, 2012), and the comprehension of the urban organization (Crucitti et al., 2006; Newman, 2012). We present a summary of relevant studies in which we segregate the different perspectives taken by the literature into three scales in the Literature Review section.
In this work, we contribute towards the study of topological properties of real-world urban road networks. We selected 35 densely populated cities and studied their road networks (see the Supplemental Material, Road Network Dataset section for the details of the dataset which is extracted from OpenStreetMap). Further, we contribute methodologically and propose a multi-scale analysis approach subjecting the chosen road networks to three prevalent perspectives found in the literature, namely, macro-, meso-, and micro-scale (see Theoretical Network Metrics section). We employ a collection of metrics and concepts from network science and draw insights into different properties of these networks and present them in the Results and Analysis section. From our multi-scale analysis, we gained different insights, for example, robust networks tend to be more efficient and that many of these cities exhibit polycentric structures, with multiple centers of connectivity. We also observed distinct patterns in the distribution of centrality measures, with betweenness following a power-law distribution, highlighting important differences in how these road networks function compared to other real-world networks. These insights can guide urban planning, particularly in managing city decentralization and improving infrastructure resilience. This study contributes to the field by offering a scalable, multi-scale analysis framework that can be applied to other urban networks. The methodology and findings presented here provide valuable insights for transportation engineers and policymakers in shaping more efficient and resilient urban environments. Finally, we summarize our findings in the Conclusions section.
Literature review
In recent years, aided by the availability of new datasets, there have been various studies on transportation systems including air transportation (e.g., Diop et al., 2021; Siozos-Rousoulis et al., 2021), rail and metro networks (e.g., Derrible and Kennedy, 2010; Wang et al., 2017), public transportation networks (e.g., bus network Li et al., 2020), and urban road networks (e.g., Jiang et al., 2008; Lämmer et al., 2006; Lee and Jung, 2018; Liu, 2019; Reza et al., 2022). These studies have focused on different aspects or questions ranging from understanding topological properties (e.g., computing the efficiency of the network) to finding vulnerabilities or bottlenecks (e.g., identifying key nodes against failure or targeted attacks). In this paper, we focus on road networks which prove to be challenging and rich in properties due to the fact that, unlike air, rail, and buses, vehicles do not follow timetables/schedules, and depending on the level of abstractions, the road networks may include various different link types and features (roundabouts vs junctions, highways vs small lanes, traffic lights, etc.). Methodologically, tools and concepts from network science (Barabási, 2013), with roots from graph theory, have widely been used in the examination and understanding of these complex networks (Newman, 2012). In fact, the well-known Königsberg’s bridges problem, solved by Euler in 1735, can be considered as the earliest and simplified transportation optimization problem. This problem not only served as a basis for the development of graph theory but also introduced the initial concepts of network topology into transportation research (Barabási, 2013). Since then, there are various metrics and approaches developed.
One intuitive way to study road networks is to view the entire topology as one whole system and compute some overall properties (often taking the mean value of some indicator). Basic metrics such as network diameter/radius, link density, average degree, average path length, and global clustering coefficient are commonly used. The significance of these metrics has been explored, for instance, in Buhl et al. (2006), Jiang and Claramunt (2004), and Barthélemy (2011). Average node degree is one of the most used metrics (not limited to road networks). It offers a first insight into the level of connectivity in the network. However, road networks are spatial networks, and thus, the physical road infrastructure is often constrained by the actual geographical space and terrain of the geographical area. Studies such as Boeing (2017) and Barthelemy (2018) have all noted that due to spatial restrictions, often the degree is also constrained.
Another dimension of complexity relates to the fact that geography and environment evolve over time and hence metrics may also change (e.g., Casali and Heinimann (2019) analyzed the road network topology in Zurich over the period between 1955 and 2012 and found some spatial metrics considered here (e.g., betweenness and closeness centrality metrics) can be used to identify changes in infrastructure. Casali and Heinimann (2019) further highlighted that nodes with high betweenness tend to be locations that offer accesses to narrow passages such as bridges and tunnels. Additionally, the paper by Cheng et al. (2023) conducts a large-scale empirical analysis of urban road networks across 363 cities in China, revealing that while some topological metrics like average node degree and edge density remain consistent across various boundary definitions, significant differences exist in metrics such as clustering coefficient and average edge length, with only 21%–28% overlap in high-centrality nodes between networks extracted using administrative and daily travel range boundaries. Hillier et al. (2012) apply Depthmap software to analyze urban spaces primarily within a macro framework, illustrating how spatial configuration significantly affects accessibility and connectivity in urban road networks. On the other hand, other studies such as Novak and Sullivan (2014) and Sharifi (2019) highlighted the importance of path-based metrics such as average path lengths which may also be influenced by physical space as well as dynamic events/processes (congestion, disruptions, or road closures). While it is valuable to analyze the network as a whole system and compute overall properties, focusing solely on these macroscopic metrics may overlook crucial insights at smaller scales.
As opposed to the above-mentioned body of work focusing on the average behavior of the network as one whole system, other studies have focused on the sub-structure of the network. The detection of community structures in a network was first introduced by Newman and Girvan (2004) where modularity is proposed to measure the presence of communities in a network. This has subsequently been applied to road networks (e.g., Duan and Lu, 2013; Duan and Lu, 2014; Song and Wang, 2010). Specific to urban cities, Kloosterman and Musterd (2001) found that modularity has a correlation with regional urbanization and exploited it as an indicator of the presence of either polycentrism or monocentrism in regional structures. Modularity is also used to find nodes with the closest relations in a road network (Tang et al., 2013).
On the other hand, Sun et al. (2016) proposed a spectral method based on modularity to obtain traffic communities in a network focusing on taxi trips which is used to understand the effects of various traffic needs on the spatial distribution of communities. A heuristic approach was employed by Yildirimoglu and Kim (2018) to maximize modularity based on the interactions between different traffic types. The core-periphery structure is another sub-structure often found in networks and could describe the existence of highly mesh nodes in the center of a city. Works such as Cucuringu et al. (2016) and Lee et al. (2014) extend the application of this concept to road networks, developing the idea of transport-based coreness instead of the original concept purely based on connectivity as in Borgatti and Everett (2000). Examining the sub-structure of the network offers insights into the intermediate structures and connections within the system.
Meanwhile, there is also another body of work focusing on nodal-level properties of a network (i.e., focusing on the importance or role of individual nodes). These works commonly use a combination of different centrality measures to answer their research questions. Degree, betweenness, and closeness centralities appear to be the most used measures (e.g., Crucitti et al., 2006; Lin and Ban, 2017; Liu, 2019; Porta et al., 2006; Reza et al., 2022; Shang et al., 2020a) in this category of studies. In Crucitti et al. (2006), the authors conducted an analysis of centrality measures and their spatial distributions across urban networks in different cities around the world. Centrality is also used to examine growth patterns as a result of urbanization. For instance, the evolution of Paris from 1789 to 2010 was investigated, highlighting a reorganization in the spatial distribution of centrality (Barthelemy et al., 2013). As prior mentioned, Casali and Heinimann (2019) also tracked the evolution of the road network in Zurich and they found that traditional metrics such as alpha, beta, and gamma indices failed to capture the changes in time while studying the network using centrality metrics such as betweenness and closeness reveals new insights such as critical nodes increasingly become even more critical over time based on betweenness centrality. In Strano et al. (2012), authors identified two urbanization processes, densification, and exploration, in a northern area of Milan, using differences in betweenness centrality values at each edge to quantify these processes.
The relationship between centrality measures in road networks and land use was also explored (e.g., in Wang et al., (2011) and; Zeng, 2020)). These works found that closeness centrality showed the highest correlation with land use densities, while betweenness centrality exhibited a weaker correlation. In Jiang et al. (2008), authors investigated the correlation between traffic flow and centrality measures in self-organized road network systems. In the city of Bologna, Porta et al. (2009) studied the connection between the centrality of the street interconnections and the densities of commercial and service activities. They discovered a high correlation between these activities and the global betweenness of the street network, as well as a slightly lower correlation with the global closeness centrality.
From the above, we can already see the literature has adopted various different perspectives when studying road networks. Employing aggregated network-wide metrics offers insights into the network property as a whole while nodal-level metrics give indications on the importance of nodes in the network. As such, the different perspectives have their strengths. We thus see a gap in which most relevant studies are still studying road networks focusing on one particular perspective or even specific metric. This paper is then motivated by the opportunity and potential to exploit the advantages offered by different perspectives in studying road networks.
In this paper, we thus advocate for a multi-scale analysis approach to understand the full range of road network characteristics. By conducting multi-scale analysis, we aim to uncover more insights, especially by linking observations or dependencies from one scale to another. For instance, while macro-scale properties may offer an overall indication of a network on specific properties, these could be explained better with nodal-level observations. Certain centrality distributions or clustering may directly result in the formation of some sub-structures such as communities. Closely correlated metrics at different scales may be identified to inform future research on their similarity and thus offering limited additional insights from one to the other (Wang et al., 2017). By integrating these analyses, we aim to paint a more comprehensive picture of the overall network topology, capturing global, regional, and local properties.
Theoretical network metrics
In this section, we detail the tools and metrics from network science used in our analysis. Based on our literature review, we have consolidated and logically categorized them into three scales: macro-, meso- and micro-scales. They were chosen based on their ability to capture different aspects of network structure. Each metric type serves a distinct purpose. We will elaborate on this in the next subsections.
We abstract the road networks and represent them as undirected graph,
The illustration in Figure 1 delineated metrics at macro- meso-, and micro scales. By consolidating metrics from these distinct scales, a more comprehensive understanding of the architecture can be achieved, enabling a detailed assessment and analysis. Conceptual visualization of the micro-, meso-, and macro-scale metrics.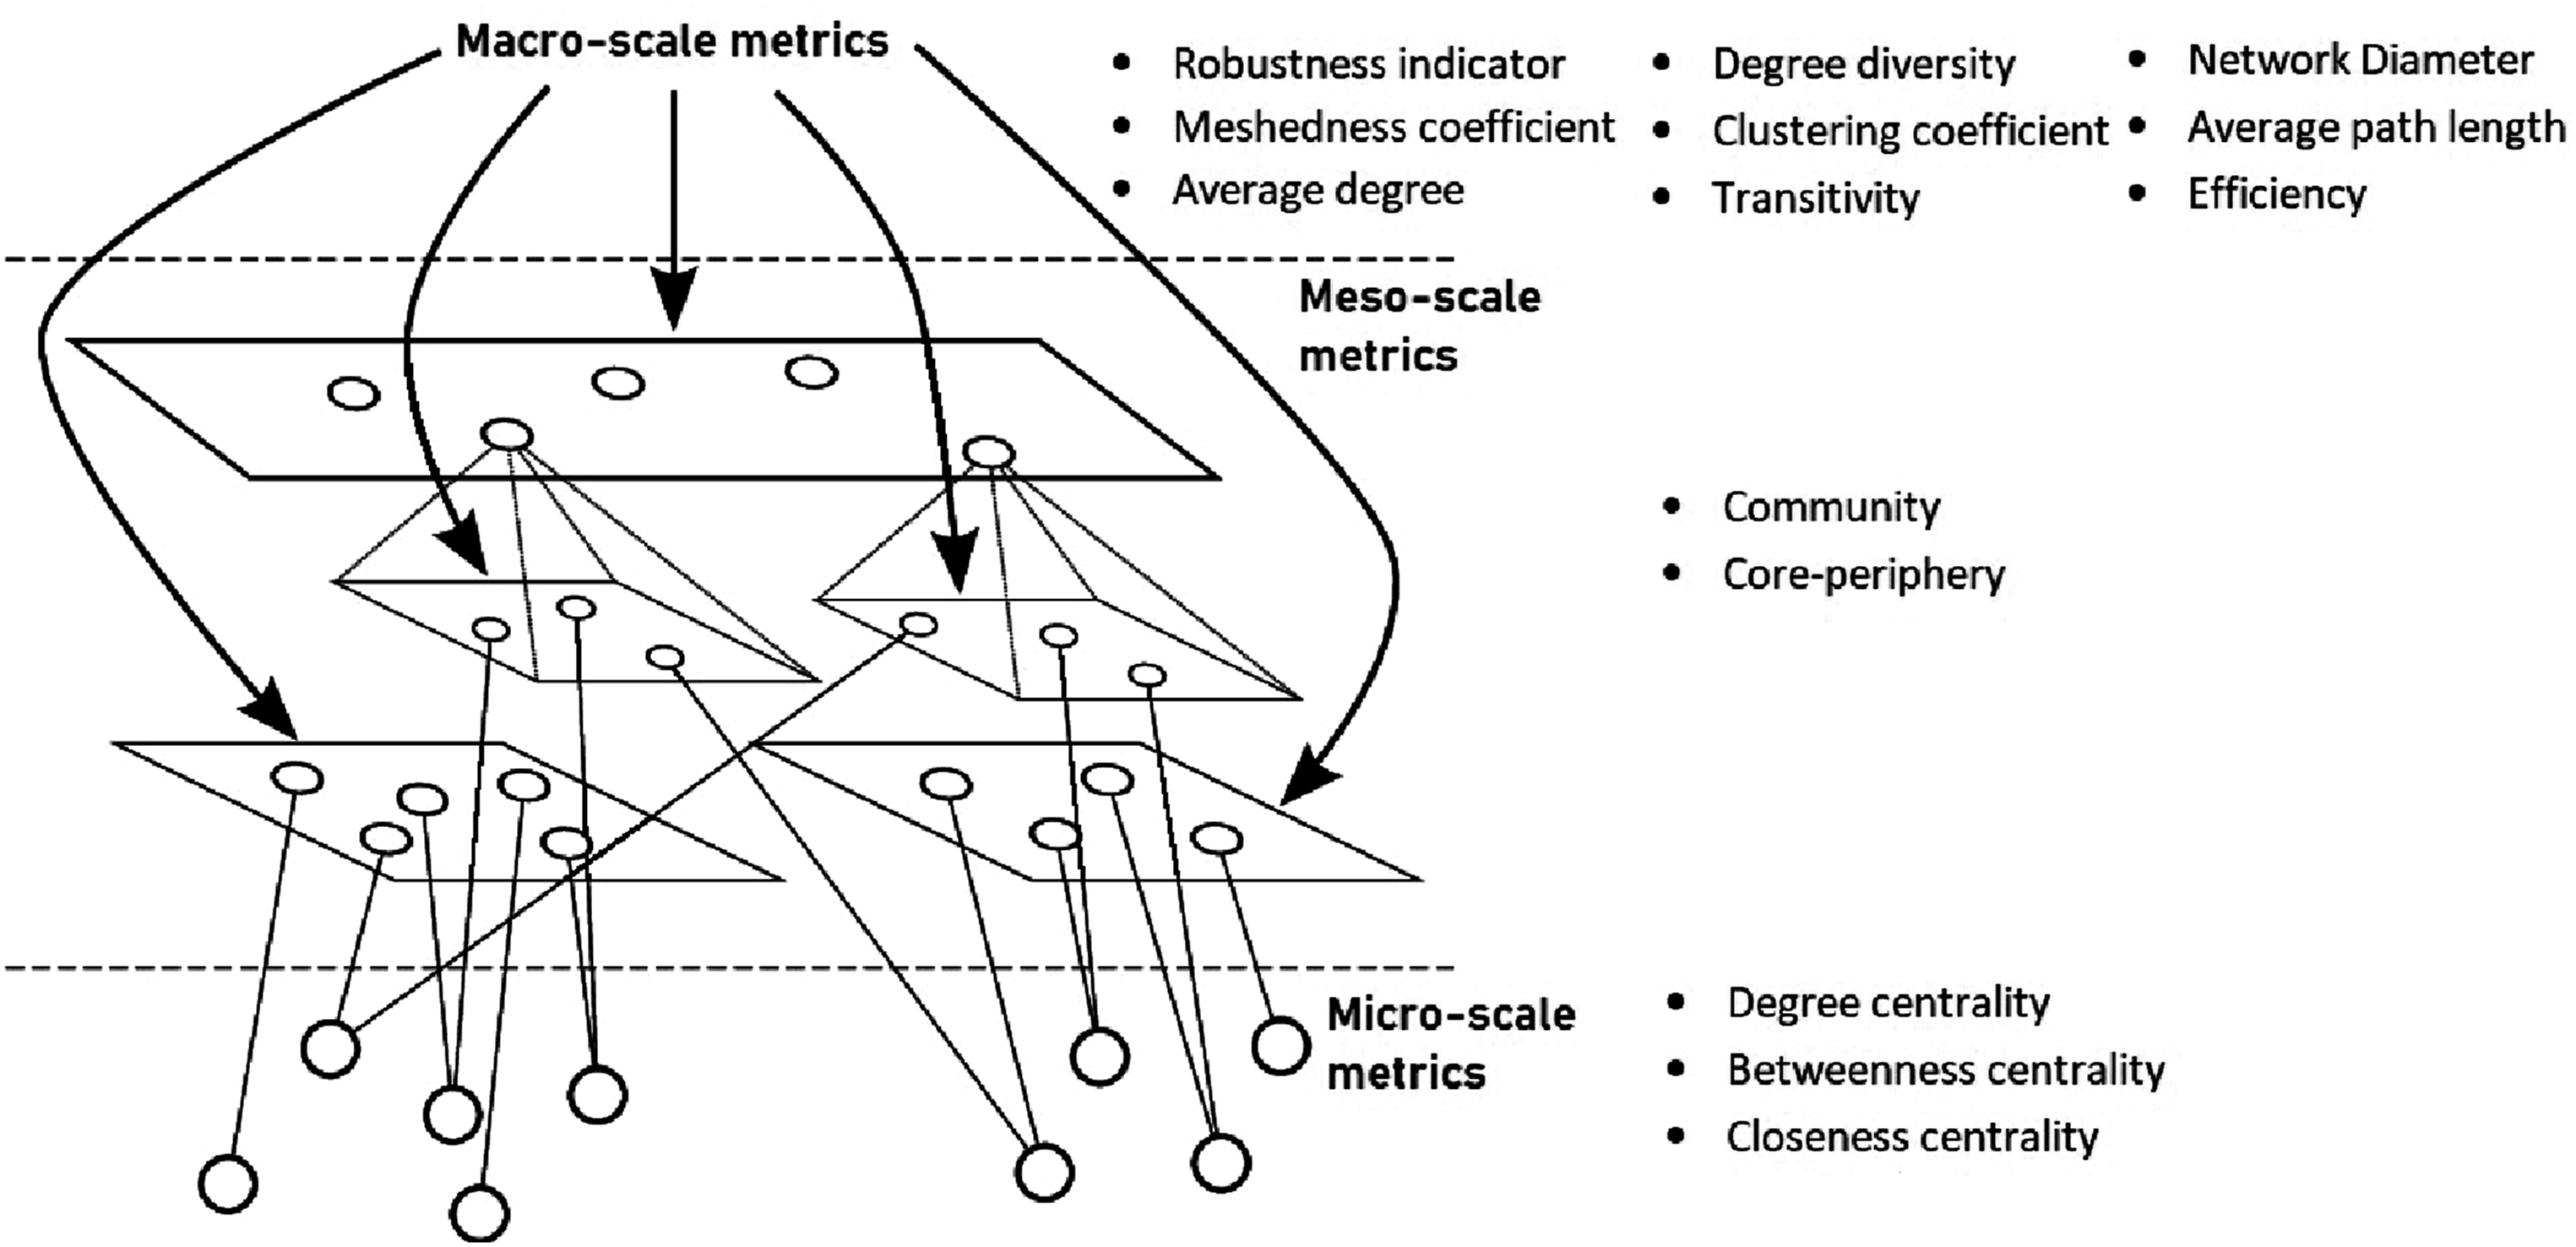
Macro-scale metrics
By macro-scale metrics, we are referring to metrics that describe the network as a whole. Often this is an average value of certain measures. We consider nine such global metrics. They can be further segregated into three categories based on the specific features considered by the metric. • Macro-scale metrics based on overall network size and links. Specifically, we consider the robustness indicator and meshedness coefficient which are both computed as a function of N and L. • Macro-scale metrics based on local connectivity. These metrics consider the average of some local features of each node. The prominent input for these metrics is based on the node degrees and/or their immediate neighbors. For this, we consider average degree, degree diversity, clustering coefficient, and transitivity. From our literature review, given that road networks commonly have constrained degrees due to spatial features, we can hypothesize that the urban road networks could exhibit low average degree and limited degree diversity while relatively higher clustering coefficient and transitivity despite low degree since in these crowded cities, nodes are likely to be physically close to each other. • Macro-scale metrics based on paths. These metrics consider the paths between pairs of nodes to characterize the network. We consider network diameter, average path length, and network efficiency for this.
In the following, we introduce the metrics mentioned above.
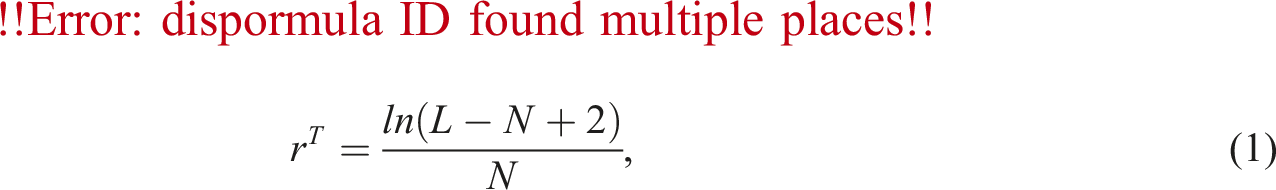
The robustness indicator, r T
The robustness indicator, first introduced in Derrible and Kennedy (2010), was later modified by Wang et al. (2017) and was used to measure the robustness of metro networks. In its original form, it considers the number of alternative paths in the network as a ratio of those paths over the total number of nodes in the network. It considers multi-edge scenarios where there may be multiple links between a pair of nodes. Similar to Wang et al. (2017), we also do not consider multi-edge graphs and our networks are also sufficiently sparse. Essentially, r
T
increases when there are more alternative paths available to reach a destination, and decreases in larger systems that may be more difficult to maintain. Thus, for this work, we use the following:
Meshedness coefficient, m
In the context of street networks, Cardillo et al. (2006) proposed the concept of meshedness coefficient, m, by considering the network as a planar graph since in reality, road networks are spatially embedded networks. The coefficient exploits the Euler formula, F = L − N + 1 as the numerator where F is the number of faces of the planar graph while the maximum number of faces when considering a maximally connected planar graph, Fmax = 2N − 5 as the denominator:

As the name implies, meshedness coefficient is a measure that quantifies the degree of interconnectedness or “meshedness” in the network. One property of this measure is that it ranges between 0 and 1. With maximal planar graphs where L = 3N − 6, we obtain m = 1 while m = 0 for tree graphs. A high meshedness coefficient indicates a high level of connectivity and redundancy in the road network (Lin and Ban, 2013; Wang et al., 2013). This means that there are multiple routes or paths between different locations, which can increase the robustness and resilience of the network. Conversely, a low meshedness coefficient indicates a less connected network with fewer alternative routes (Knaap and Rey, 2023).
Average degree,
One of the most commonly used quantities in complex network analysis is the node degree which indicates the number of immediate neighbors of a node. For instance, in the context of road networks, this has been used in various forms (Crucitti et al., 2006; Lee and Jung, 2018; Lin and Ban, 2017; Liu, 2019; Porta et al., 2006; Reza et al., 2022; Shang et al., 2020a; Shang et al., 2020b; Zeng, 2020) with the simplest being the average degree of all nodes in the considered network which could be obtained as follows:

Degree diversity, κ
A closely related degree-based metric of average degree is the degree diversity, the second-order average, which is given as Wang et al. (2017):

This quantity is often used in epidemic and percolation theory. For instance, in epidemic theory, it relates to the epidemic threshold below which the epidemic will die off (Boguná et al., 2003). To normalize the degree diversity within the range of [0, 1], we take the inverse of the degree diversity.
Clustering coefficient, CC G
First introduced in Watts and Strogatz (1998), the clustering coefficient has become a widely used metric to assess how the neighbors of a node are connected with one another. The clustering coefficient of a node represents the proportion of links that exist between its neighboring nodes out of the maximum possible number of links (Boeing, 2017, 2018). The clustering coefficient of node v
i
is defined as follows:


For a graph with N nodes, the clustering coefficient is bounded by 0 ≤ CC G ≤1 where 0 is obtained in a tree and 1 is reached in a complete graph. In our context, it serves as a measure of the connectivity of a road network by assessing the degree to which the neighborhood of a specific intersection/junction is interconnected (Jiang and Claramunt, 2004). The average clustering coefficient is likely to be higher in spatially embedded networks such as road networks due to the fact that nodes located in close proximity are more likely to be connected (Barthelemy, 2018).
Transitivity, τ G
Transitivity was introduced by Newman et al. (2002), as an alternative formulation of the clustering coefficient of a graph (Schank and Wagner, 2005). Let G denote a simple and undirected graph. A triangle, represented by
A triple refers to a subgraph in G with three nodes and two edges. A triple at v
i
is defined as one where v
i
is incident to both edges of the triple. The number of triples at v
i
in terms of its degree d
i
is given by:

The transitivity of a graph, τ
G
, is defined as the ratio of three times the number of triangles in G to the number of triples in G, as proposed in Brinkmeier and Schank (2005):

Since each triangle contains exactly three triples, it follows that 3λ(G) ≤ T(G). Consequently, the transitivity τ(G) is always a rational number ranging from 0 to 1. Transitivity is closely related to the clustering coefficient and is sometimes used as an alternative where both provide insights into the local connectivity structure of a network (Schank and Wagner, 2005).
Network diameter, D
Distance between nodes in a network is often important in network analysis. This is also true for road networks. The network diameter is one of the most basic quantities describing the network in terms of node distance. It is the maximum node eccentricity that corresponds to the longest shortest path amongst all pairs of nodes in the network of interest (Wasserman and Faust, 1994).

Average path length, H G
While network diameter only uses one particular path as an indicator of the graph property, a more informative measure considering all shortest paths is the average path length, H
G
(Newman, 2012). Essentially, it is the mean of shortest path lengths between all node pairs (Newman et al., 2002):

Efficiency, eff G
The measure of network efficiency provides an indication of how easily traffic spreads through an arbitrary network. It is given by the average of reciprocals of all the shortest paths between node pairs and can be given as follows (Latora and Marchiori, 2002):

In this measure, the network is considered to be more efficient when nodes can reach each other in fewer hops (i.e., shorter paths).
Meso-scale metrics
Mesoscopic structures relating to subgraph patterns in complex networks have recently gained much attention. In this work, we focus on two main concepts: community and core-periphery structures.
Community
A population often consists of different communities where a subset of nodes have more connections among them than to others. A string of research has attempted to capture such phenomena. Given the social contact network, the goal is to find community structures in the graph. In this work, we exploit the concept of modularity, Q, one of the most used functions in determining communities in a network (Newman and Girvan, 2004), which is measured by using the following:

Core-periphery
The core-periphery structure is a common pattern seen in many real-world networks, such as social networks, neural networks, and transportation systems. In this structure, nodes in the network are divided into two main groups: core nodes and periphery nodes. Core nodes are highly interconnected with each other, forming a tight-knit group that acts as the central part of the network. On the other hand, periphery nodes are linked to core nodes but do not connect with one another, meaning they operate more independently (Borgatti and Everett, 2000). This separation helps us understand the different roles that nodes play in the network and how information and resources move through it. Researchers have built on this idea; for example, Kojaku and Masuda (2017a) developed a scalable algorithm to find multiple non-overlapping core-periphery groups within a network. Similarly, Holme (2005) introduced a CP coefficient that uses closeness centrality and the k-cores deposition technique to identify core nodes, assuming that these core nodes generally have high closeness centrality. Additionally, Rombach et al. (2014) explores the dynamics of core-periphery structures, highlighting their importance for understanding how networks behave, their resilience, and how effectively they transmit information and resources.
The distinction between core and periphery plays a significant role in the function and dynamics of the network. In transportation networks, core nodes may be central hubs with numerous connections, while peripheral nodes represent smaller, less connected locations. This observation supports the use of the transport-based core-periphery detection algorithm known as the Path-Core (PC) algorithm, as proposed by Cucuringu et al. (2016), which effectively focuses on paths rather than just immediate neighbors. We have also considered different algorithms (e.g., Borgatti’s algorithm [Borgatti and Everett, 2000]) but most proved to be computationally infeasible for the large datasets we consider here.
According to the PC algorithm, core-periphery structure identification bears a resemblance to betweenness centrality (defined later in the Micro-scale Metrics section) in network analysis. The Path-Core metric of node v
i
, PC(v
i
), is defined as follows:

Micro-scale metrics
For micro-scale metrics, we are looking into nodal-level measures of nodes in a network. Specifically, we exploit widely used centrality measures to rank nodes or links based on their relative importance and examine their distributions to derive insights into the characteristics of given networks. Various works such as Crucitti et al. (2006), Lämmer et al. (2006), and Barthélemy (2011) have already utilized centrality measures in the context of road networks, and in this work, we choose the three most commonly used centrality measures as follows.
Degree centrality
The simplest yet most widely used centrality measure is the degree centrality. The degree centrality of a node is the number of direct neighbors the node has (see subsection Average degree). Networks with different degree distributions can exhibit vastly different properties. For instance, Erdös–Rényi random graph model (Erdos et al., 1960) has a binomial degree distribution (or a Poisson distribution in the limit of large N) while scale-free networks (Barabási, 2013) have power-law degree distribution and both models have different properties (Erdos et al., 1960). Degree centrality of a node v
i
, c
D
(v
i
), is defined as follows:

Betweenness centrality
The betweenness centrality measures the number of times a node lies on the shortest paths between all pairs of nodes in a network (Wasserman and Faust, 1994). It appears as a natural representation of load in terms of traffic in road networks. With the assumption that road users normally use the shortest route to get to their destinations, then betweenness centrality provides a good indicator to measure the burden of nodes in the transport process. Even in instances where movement within the network is random, locations with high betweenness centrality experience higher volumes of traffic or congestion, as indicated by Crucitti et al. (2006) and Barthélemy (2011). Hence, nodes characterized by high betweenness centrality are more susceptible to disruptions and congestion. Betweenness centrality of a node v
i
, c
B
(v
i
), is defined as follows:

Betweenness distribution has been found to follow power-law in scale-free graphs which are used to model various types of real-world networks such as the Internet and road networks (Faloutsos et al., 1999). Such betweenness distribution is exploited in path-based problems (e.g., in content caching problems in computer networks [Chai et al., 2013]).
Closeness centrality
Closeness centrality measures how close a node is, in terms of shortest path lengths, to all other nodes in the network (Wasserman and Faust, 1994). It is defined as the reciprocal of the average of those N − 1 shortest paths and can be computed as follows:

While betweenness centrality focuses on the role of a node as a connector or intermediary between other nodes, closeness centrality focuses on the distance of a node to other nodes in the network. A node that is closer to all others is deemed to be of higher relative importance (e.g., a higher level of accessibility with others).
Results and analysis
We analyze road networks from 35 populous cities worldwide, including 20 cities from China, 9 from India, 2 from Pakistan, and 1 each from Colombia, Brazil, Bangladesh, and Côte d’Ivoire. Details of the dataset can be found in the Supplementary Material section 1.
Assessment at macro-scale
Macro-scale metrics results.
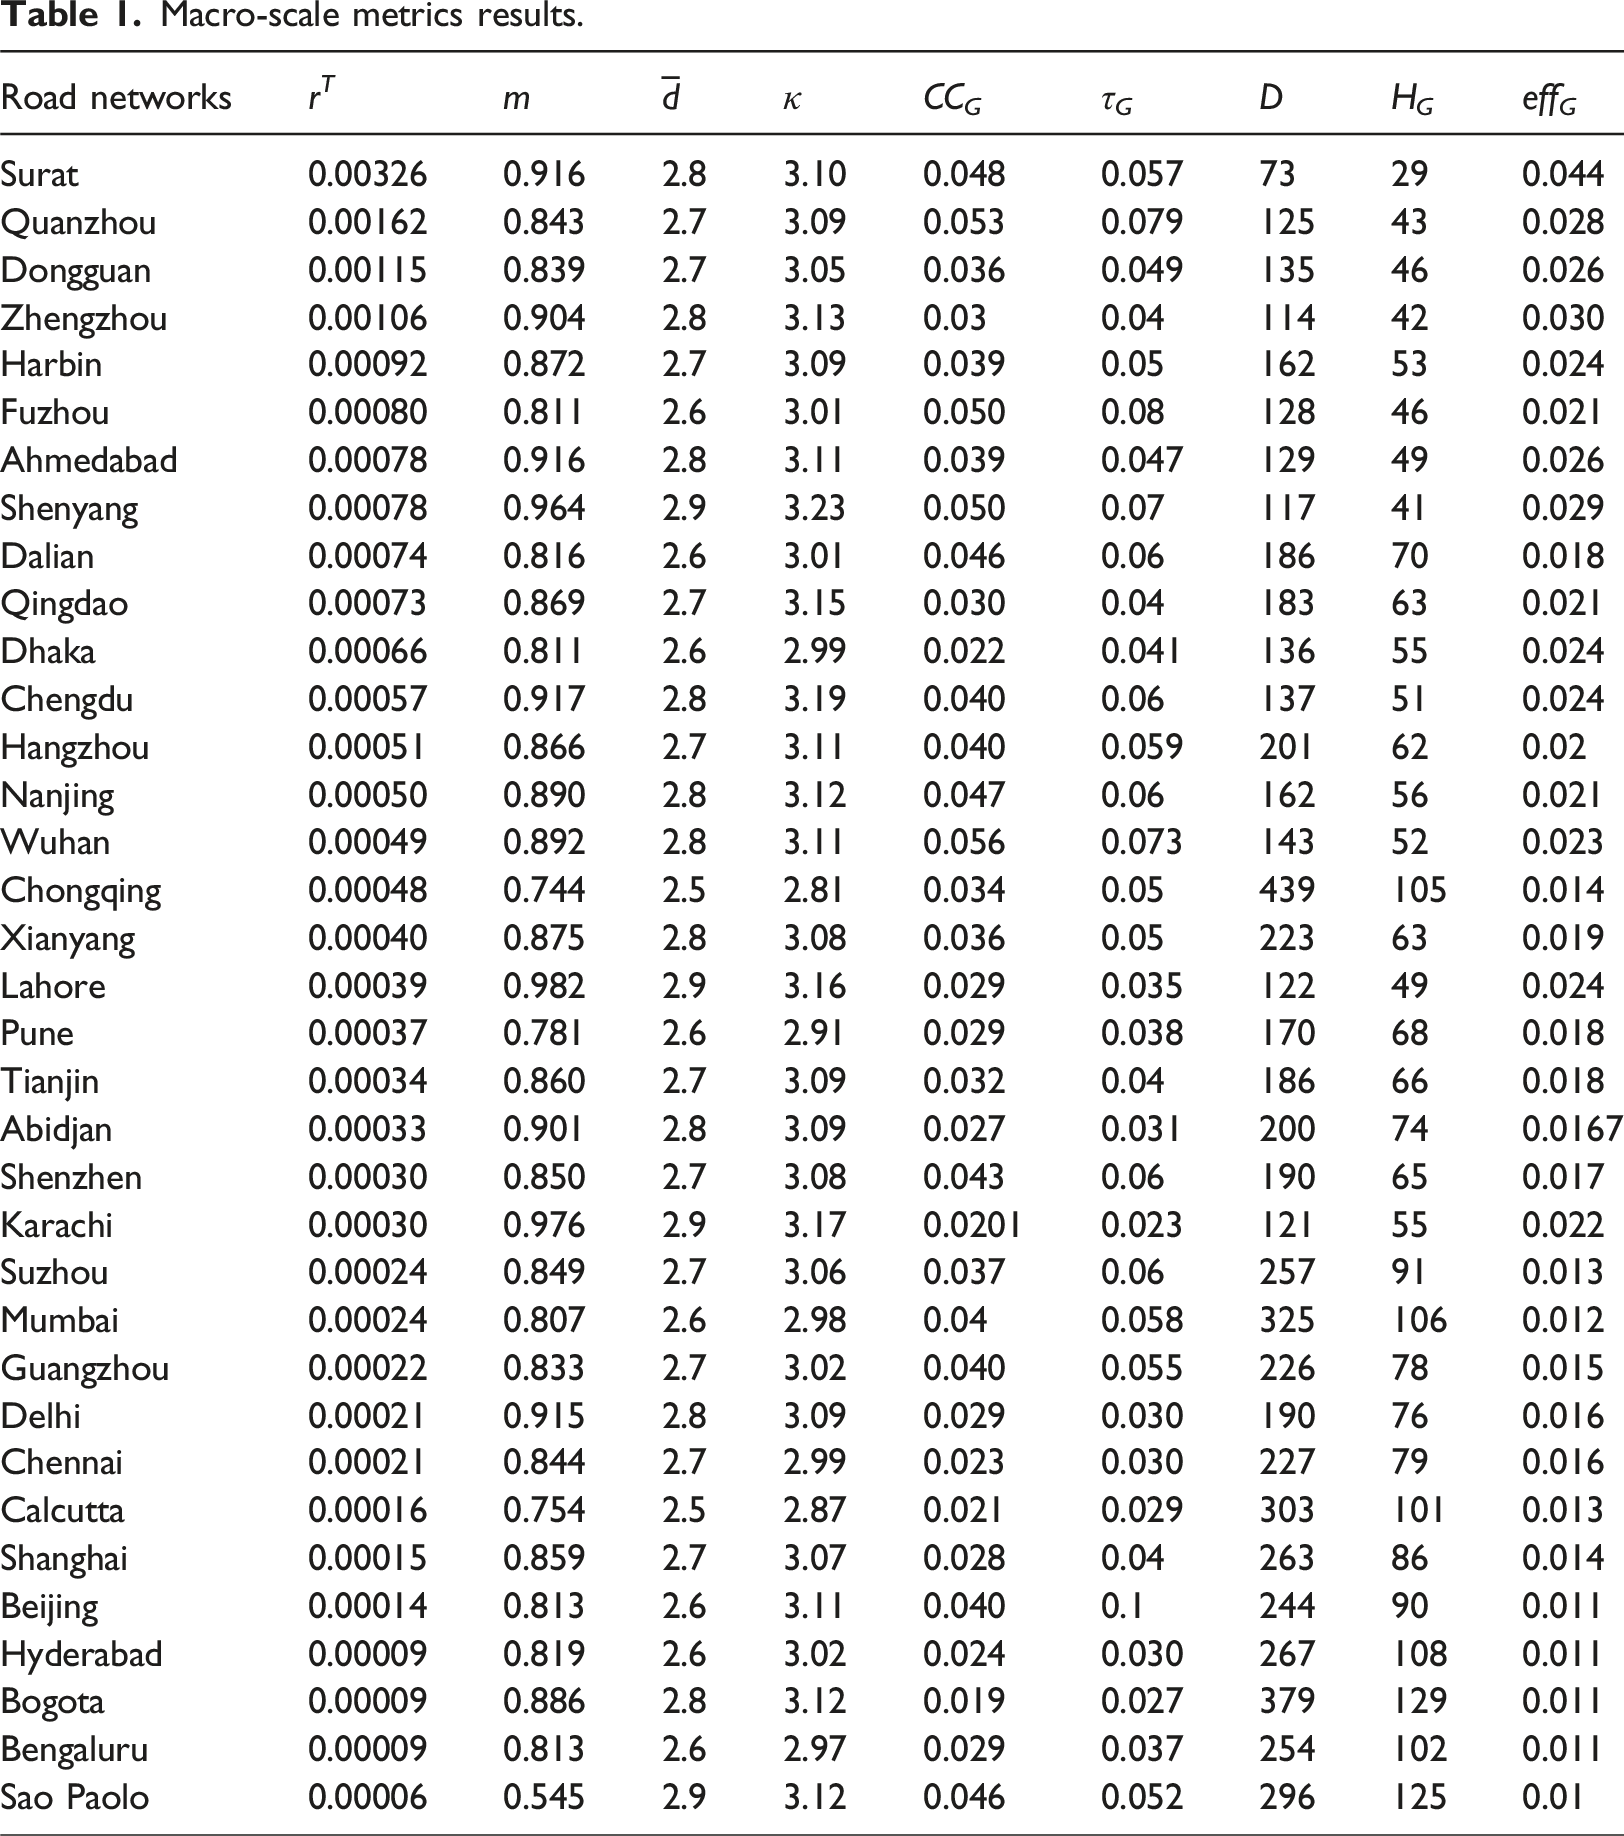
While degree-based metrics such as
The three remaining macro-scale metrics (i.e., D, H G , and eff G ) are all based on shortest paths. We note that both the diameter and average shortest paths of all the chosen networks are relatively high (at an average of 200 hops and 71 hops, respectively, from the 35 cities). This is due to the level of abstraction in the dataset where every junction and intersection is extracted as a node and particularly in big cities considered here, the number of nodes becomes large even across small spatial areas. An inter-city road network (where cities are nodes) will record much smaller D and H G due to the different methods of abstraction (in this case, cities are nodes). This then points to the observation that these urban city road networks do not exhibit small-world property (Watts and Strogatz, 1998). Also resulting from this, the network efficiency for the road networks is low (since by definition, efficiency is computed as a function of the inverse of shortest path lengths).
From the above discussion, we can already infer some relationships between the macro-scale metrics. We present the Pearson correlations of the nine metrics in Figure 2. From the heat map, we note the strong positive correlations among m, Pearson correlation heat map of macro-scale metrics.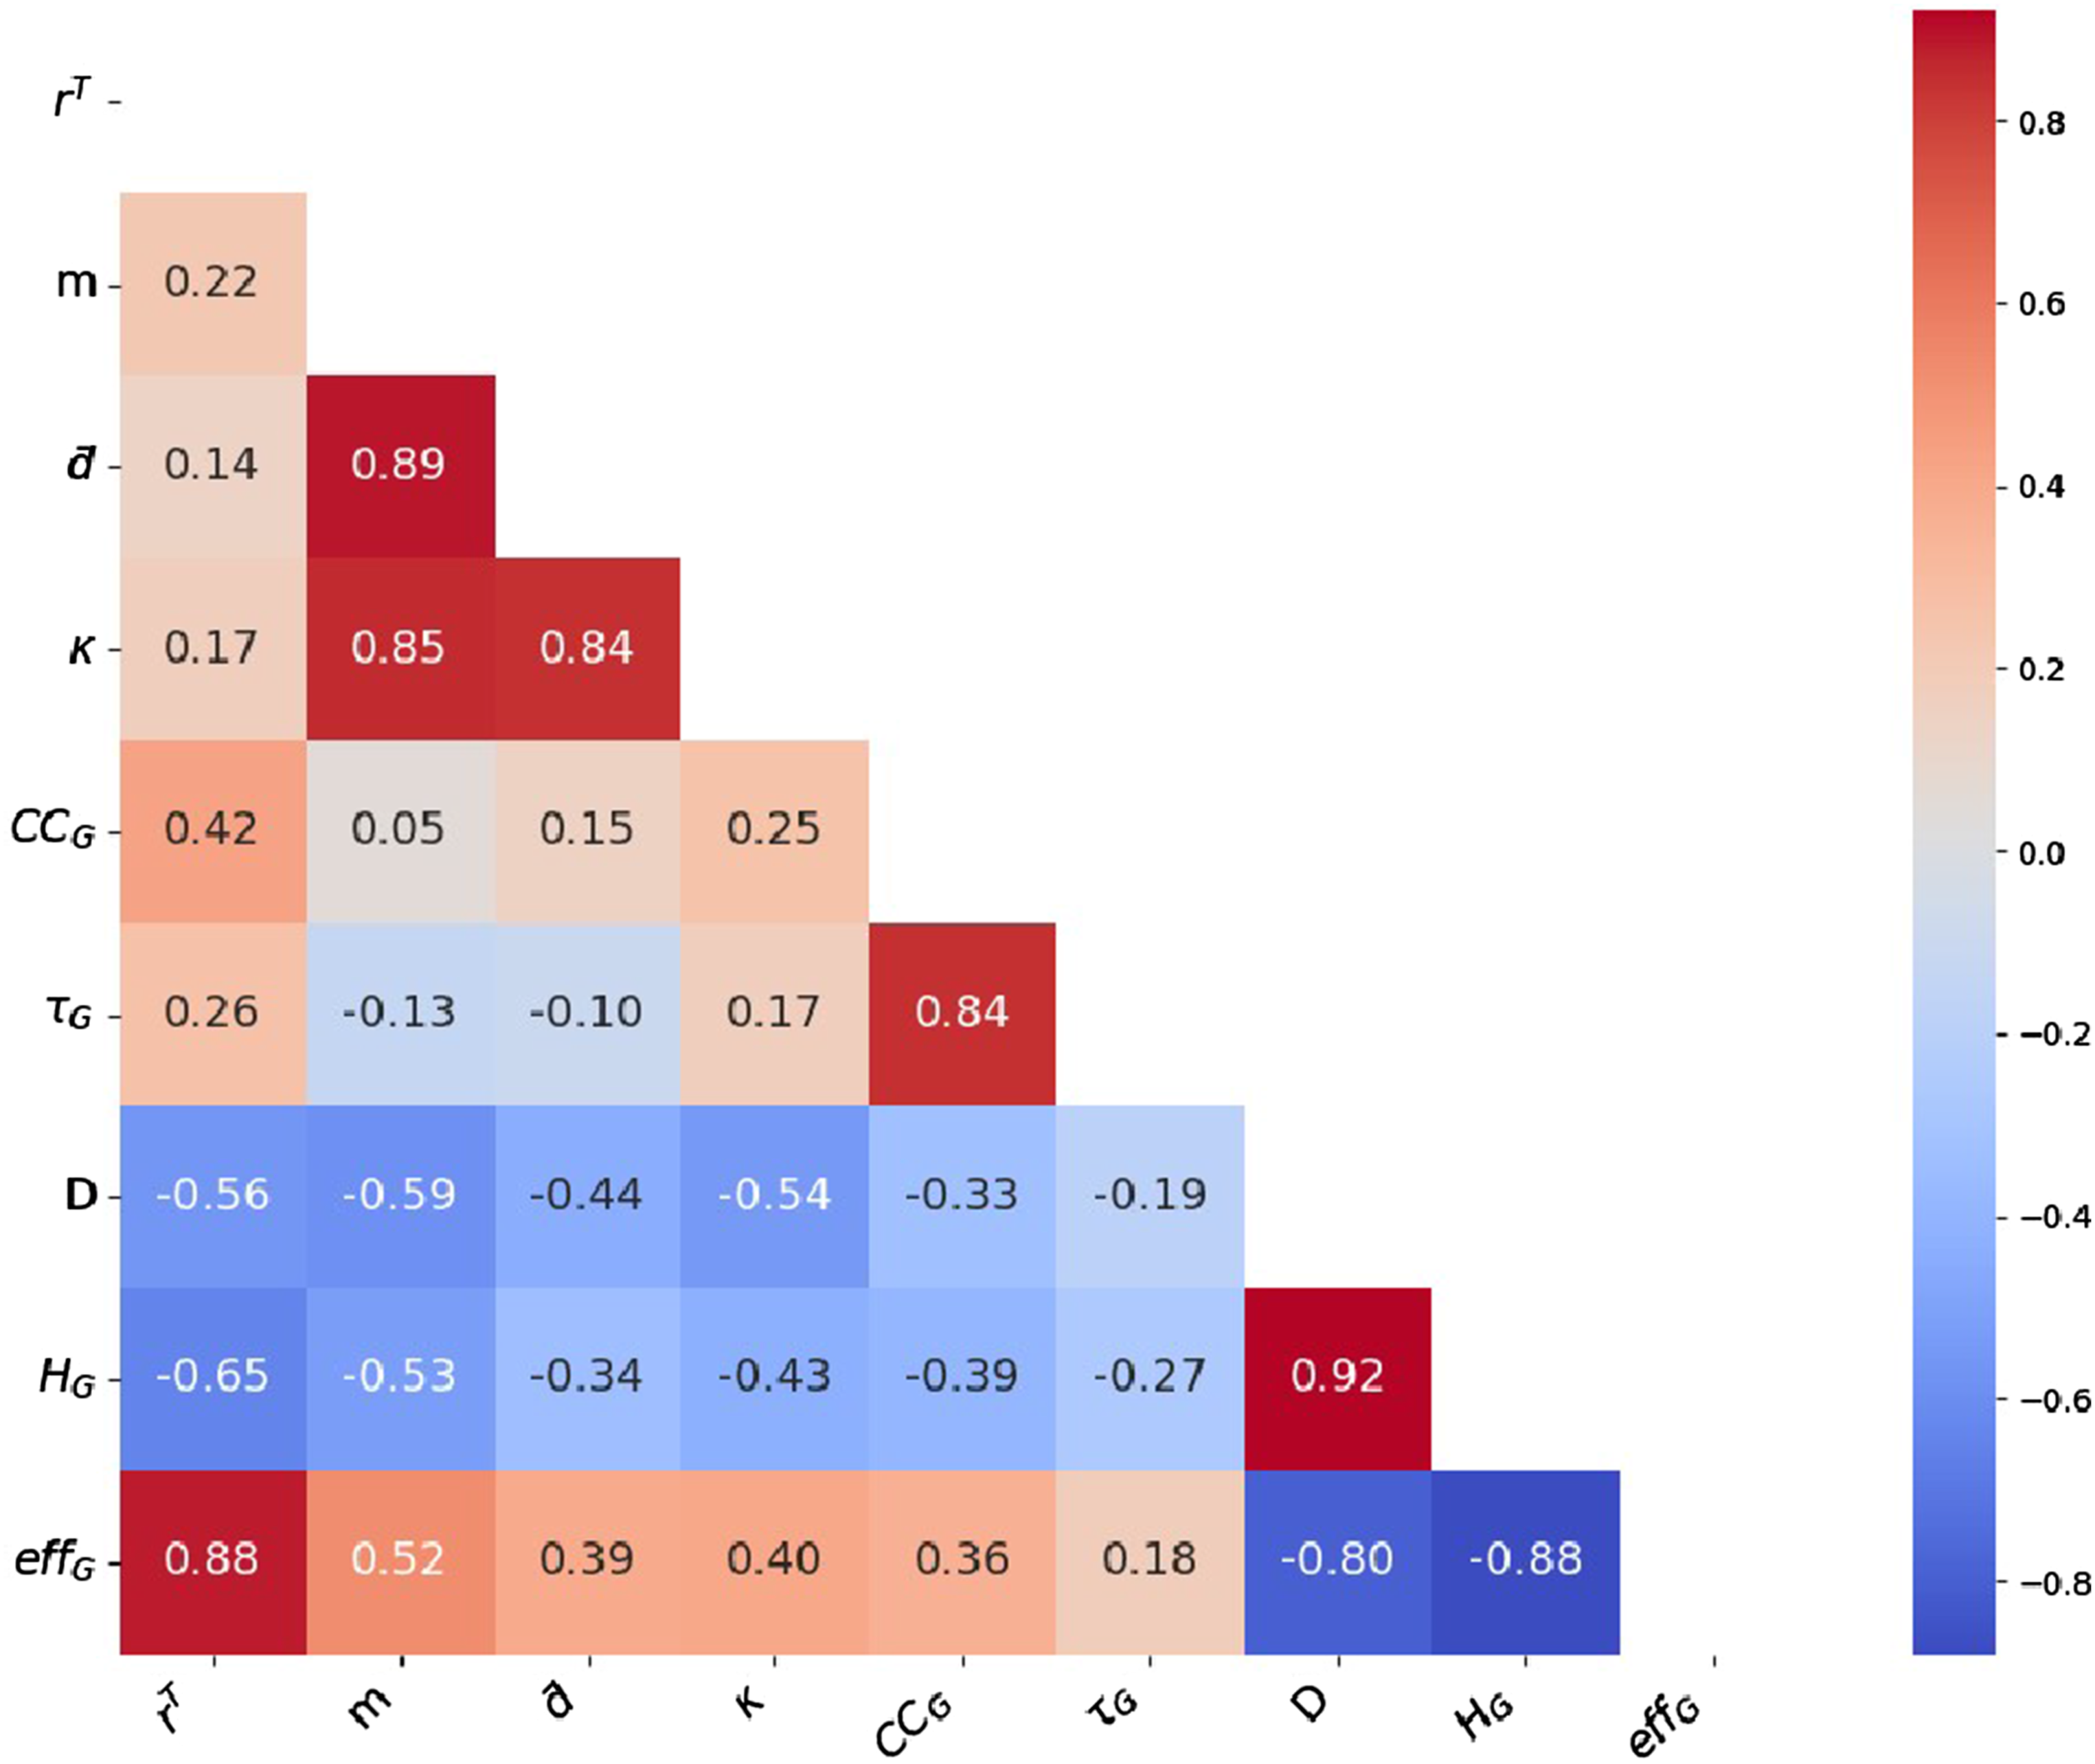
Finally, we summarize our results in radar diagrams in Supplementary Figure S2, providing a visual illustration of the various considered metrics. For this purpose, each value of x
i
in a set of macro-scale metrics from Table 1 is re-scaled to a
Assessment at meso-scale
Meso-scale metrics results.
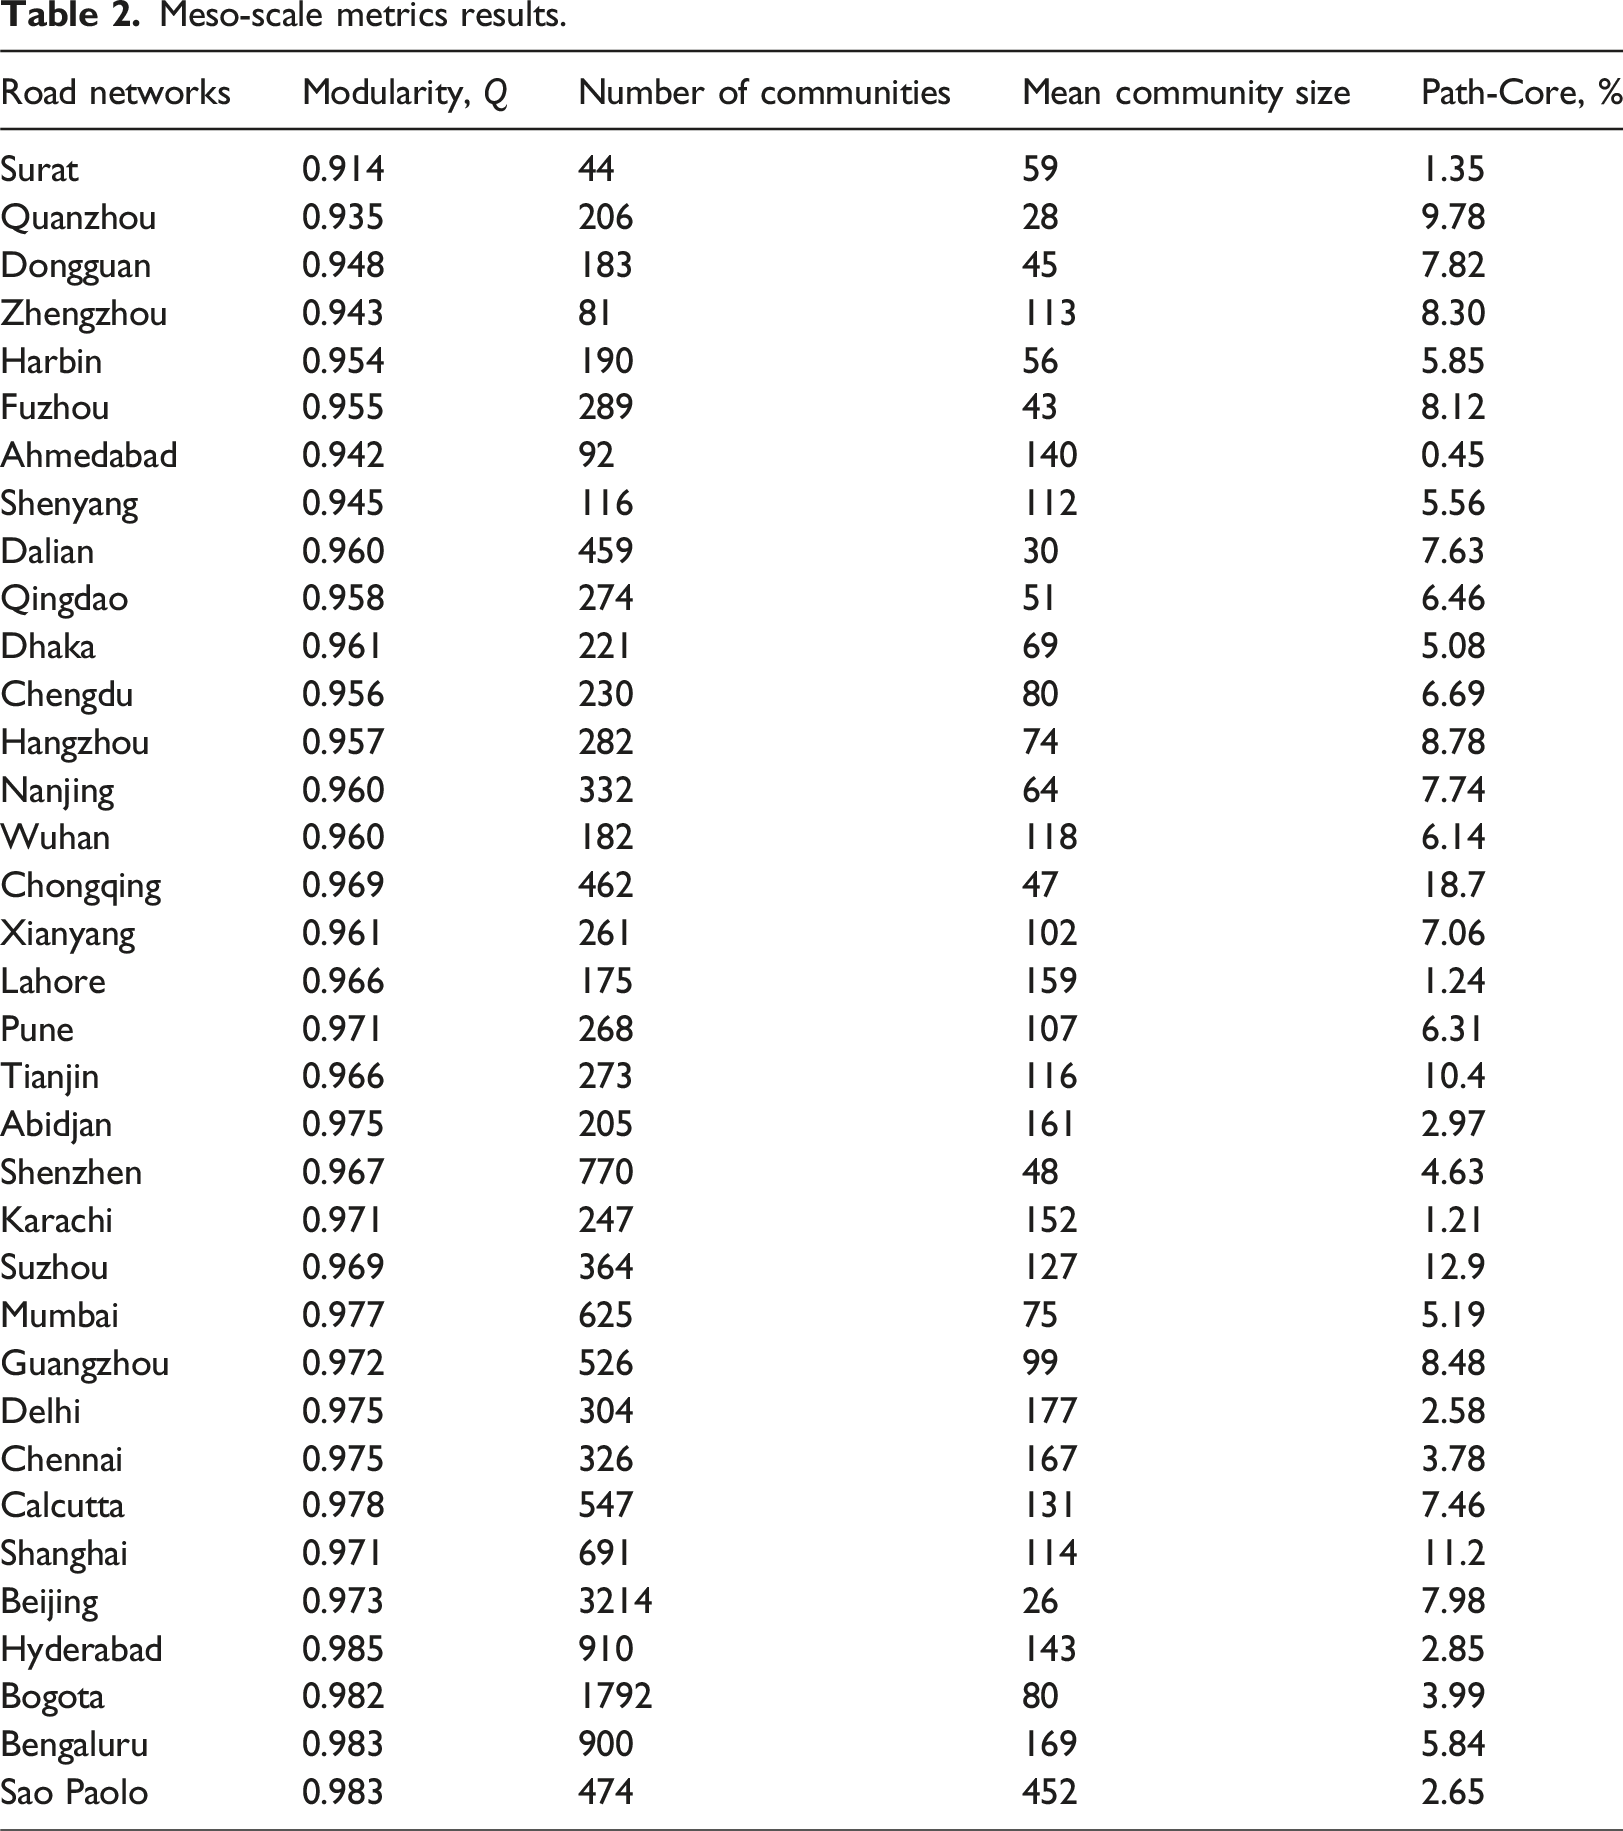
Results of the core-periphery identification using PC algorithm (Cucuringu et al., 2016) are presented in the last column of Table 2 as the percentage of core nodes in each road network. Chongqing is revealed as the city with the highest percentage of core nodes at 18.7% while the lowest is Ahmedabad with only 0.45% of nodes appearing as core. Nevertheless, across all the cities, the small percentage of nodes considered as core further reinforces the previous observation that these cities do not possess one single focal point but rather possess many areas of concentration, which may be due to multiple waves of development over time as the cities grow.
In our analysis, we also found correlations between macro- and meso-scale metrics. Specifically, we find that there modularity, Q, is positively correlated with N, H
G
, and D as shown in Figure 3 (i.e., ρ(Q, N) = 0.693, ρ(Q, D) = 0.70, and ρ(Q, H
G
) = 0.82). Pearson correlation of Q with N (a), Q with D (b), and Q with H
G
(c).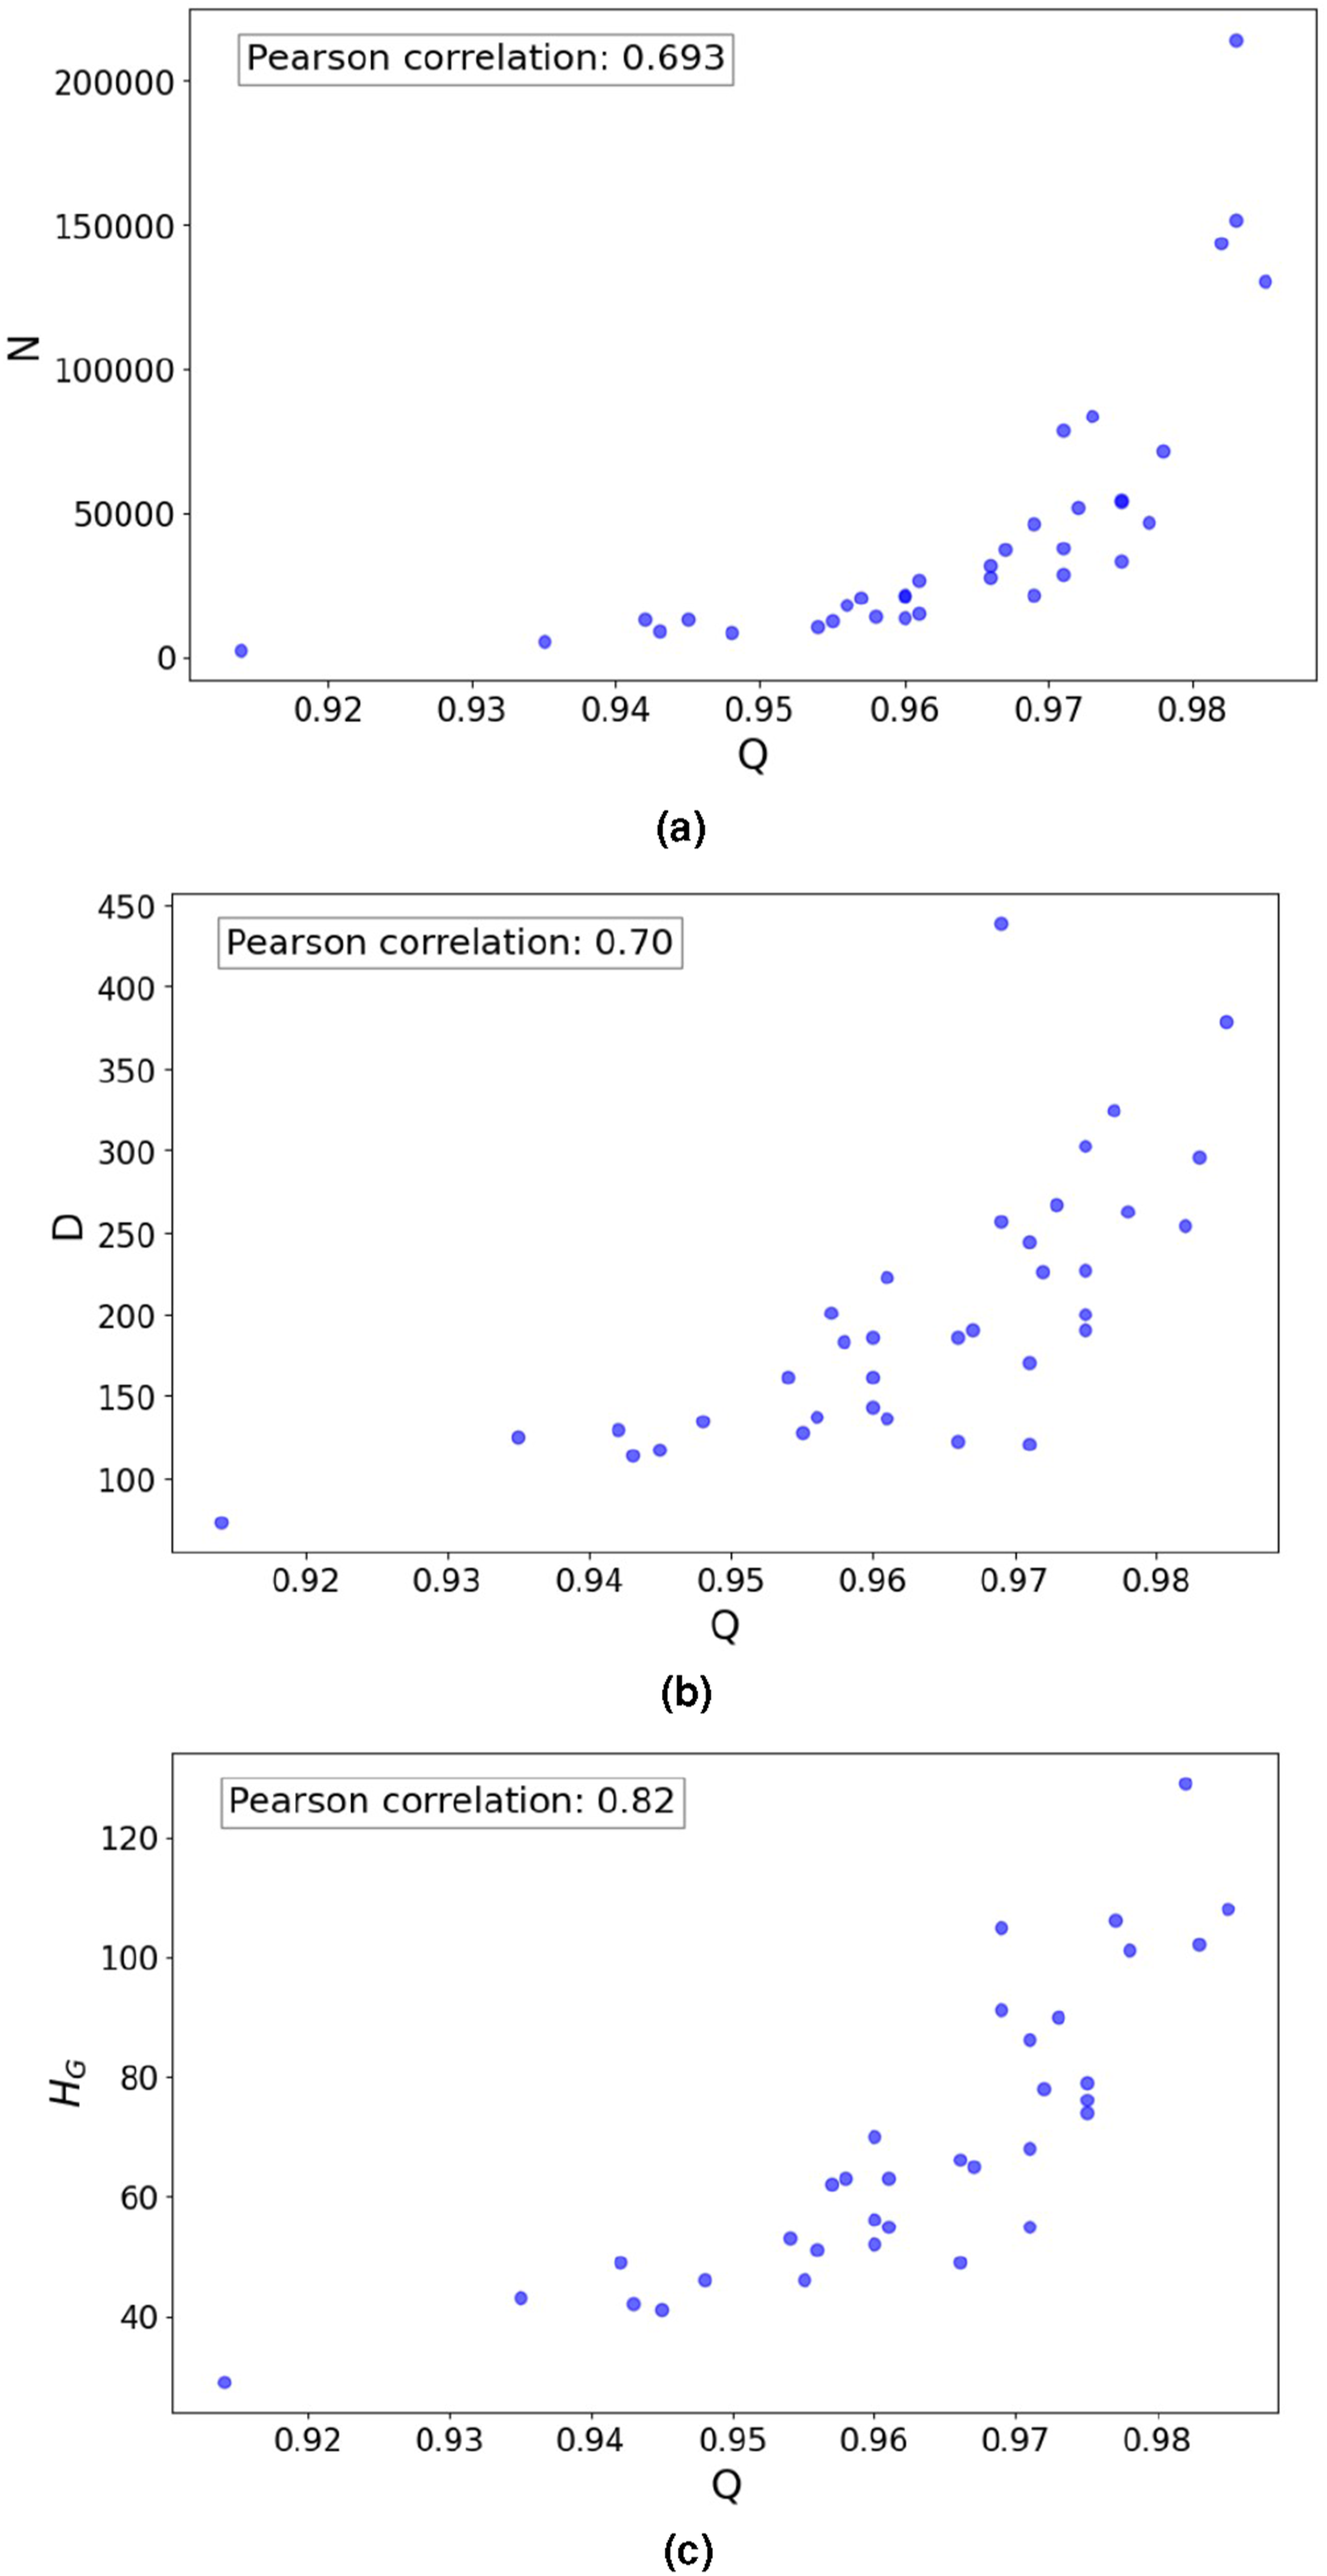
Assessment at micro-scale
The importance of different nodes in a network could be ranked using different centrality measures, and their distributions have been widely used to describe the properties of the networks under study. As prior mentioned, we have chosen the three most commonly used centrality measures in the literature for our study here. We begin with the degree distribution, presented in the Supplementary Figure S3 for all the cities. The plots reveal a lack of diverse degree values with the most common degree across all road networks being three, which corresponds to T-shaped intersections. This is in line with previous findings such as in Lee and Jung (2018) where the authors similarly highlighted that junctions with three connections are more frequently found than others and in Badhrudeen et al. (2022) which also corroborated this when studying 22 Korean urban road networks. Furthermore, we observe that crossroad junctions (i.e., two roads intersect resulting in a degree of four) are the second highest occurrences for many of the networks, especially for smaller ones, that is, Quanzhou, Zhengzhou, Ahmedabad, and Shenyang. On the other hand, larger city road networks (e.g., Bengaluru, Hyderabad, Beijing, Calcutta, Chennai, Delhi, and Pune) have many leaf nodes (degree = 1), likely because they are richly connected to other cities. Unlike many urban infrastructure networks which have been shown to be scale-free (e.g., water distribution networks [Sitzenfrei et al., 2020], telecommunication networks [Schintler et al., 2005], airline routes [Li et al., 2006], railway networks [Calzada-Infante et al., 2020], and public transportation network [Sienkiewicz and Hołyst, 2005]), it is also obvious that these road networks in densely populated cities do not exhibit scale-free properties as their degree distributions do not follow the power-law; we obtain R2 values ranging from 0.02 to 0.18. Similar power-law fitting experiments were conducted by Reza et al. (2022) and Akbarzadeh et al. (2018) on the road networks of Ingolstadt in Germany, Porto in Portugal, and other eight urban road networks across the world, and the outcomes aligned with those observed in the road networks of these highly populated cities. The lack of degree diversity may be caused by challenges (such as cost [Serafino et al., 2021]) or need (i.e., there is no need to have junctions connecting a high number of roads).
Contrary to degree distributions, we find that the betweenness distributions for the considered road networks strongly follow a power-law distribution,
A higher closeness centrality value for a road segment implies that it is closer to other nodes in terms of network distance (Lan et al., 2022; Lin and Ban, 2017). The closeness distributions, presented in the Supplementary Figure S5, offer yet another picture to describe the networks. Broadly, we find the observed distributions to be akin to a binomial distribution with several cities exhibiting left-skewedness in their distribution. For this, disconnected nodes (with closeness
As in the previous section, we also cross-examined if there are correlations between micro-scale and macro-scale metrics. From our analysis (see Figure 4), we found that average degree centrality strongly correlated with r
T
achieving Correlation between macro- and micro-scale metrics: r
T
and mean c
D
(a), eff
G
and mean c
C
(b).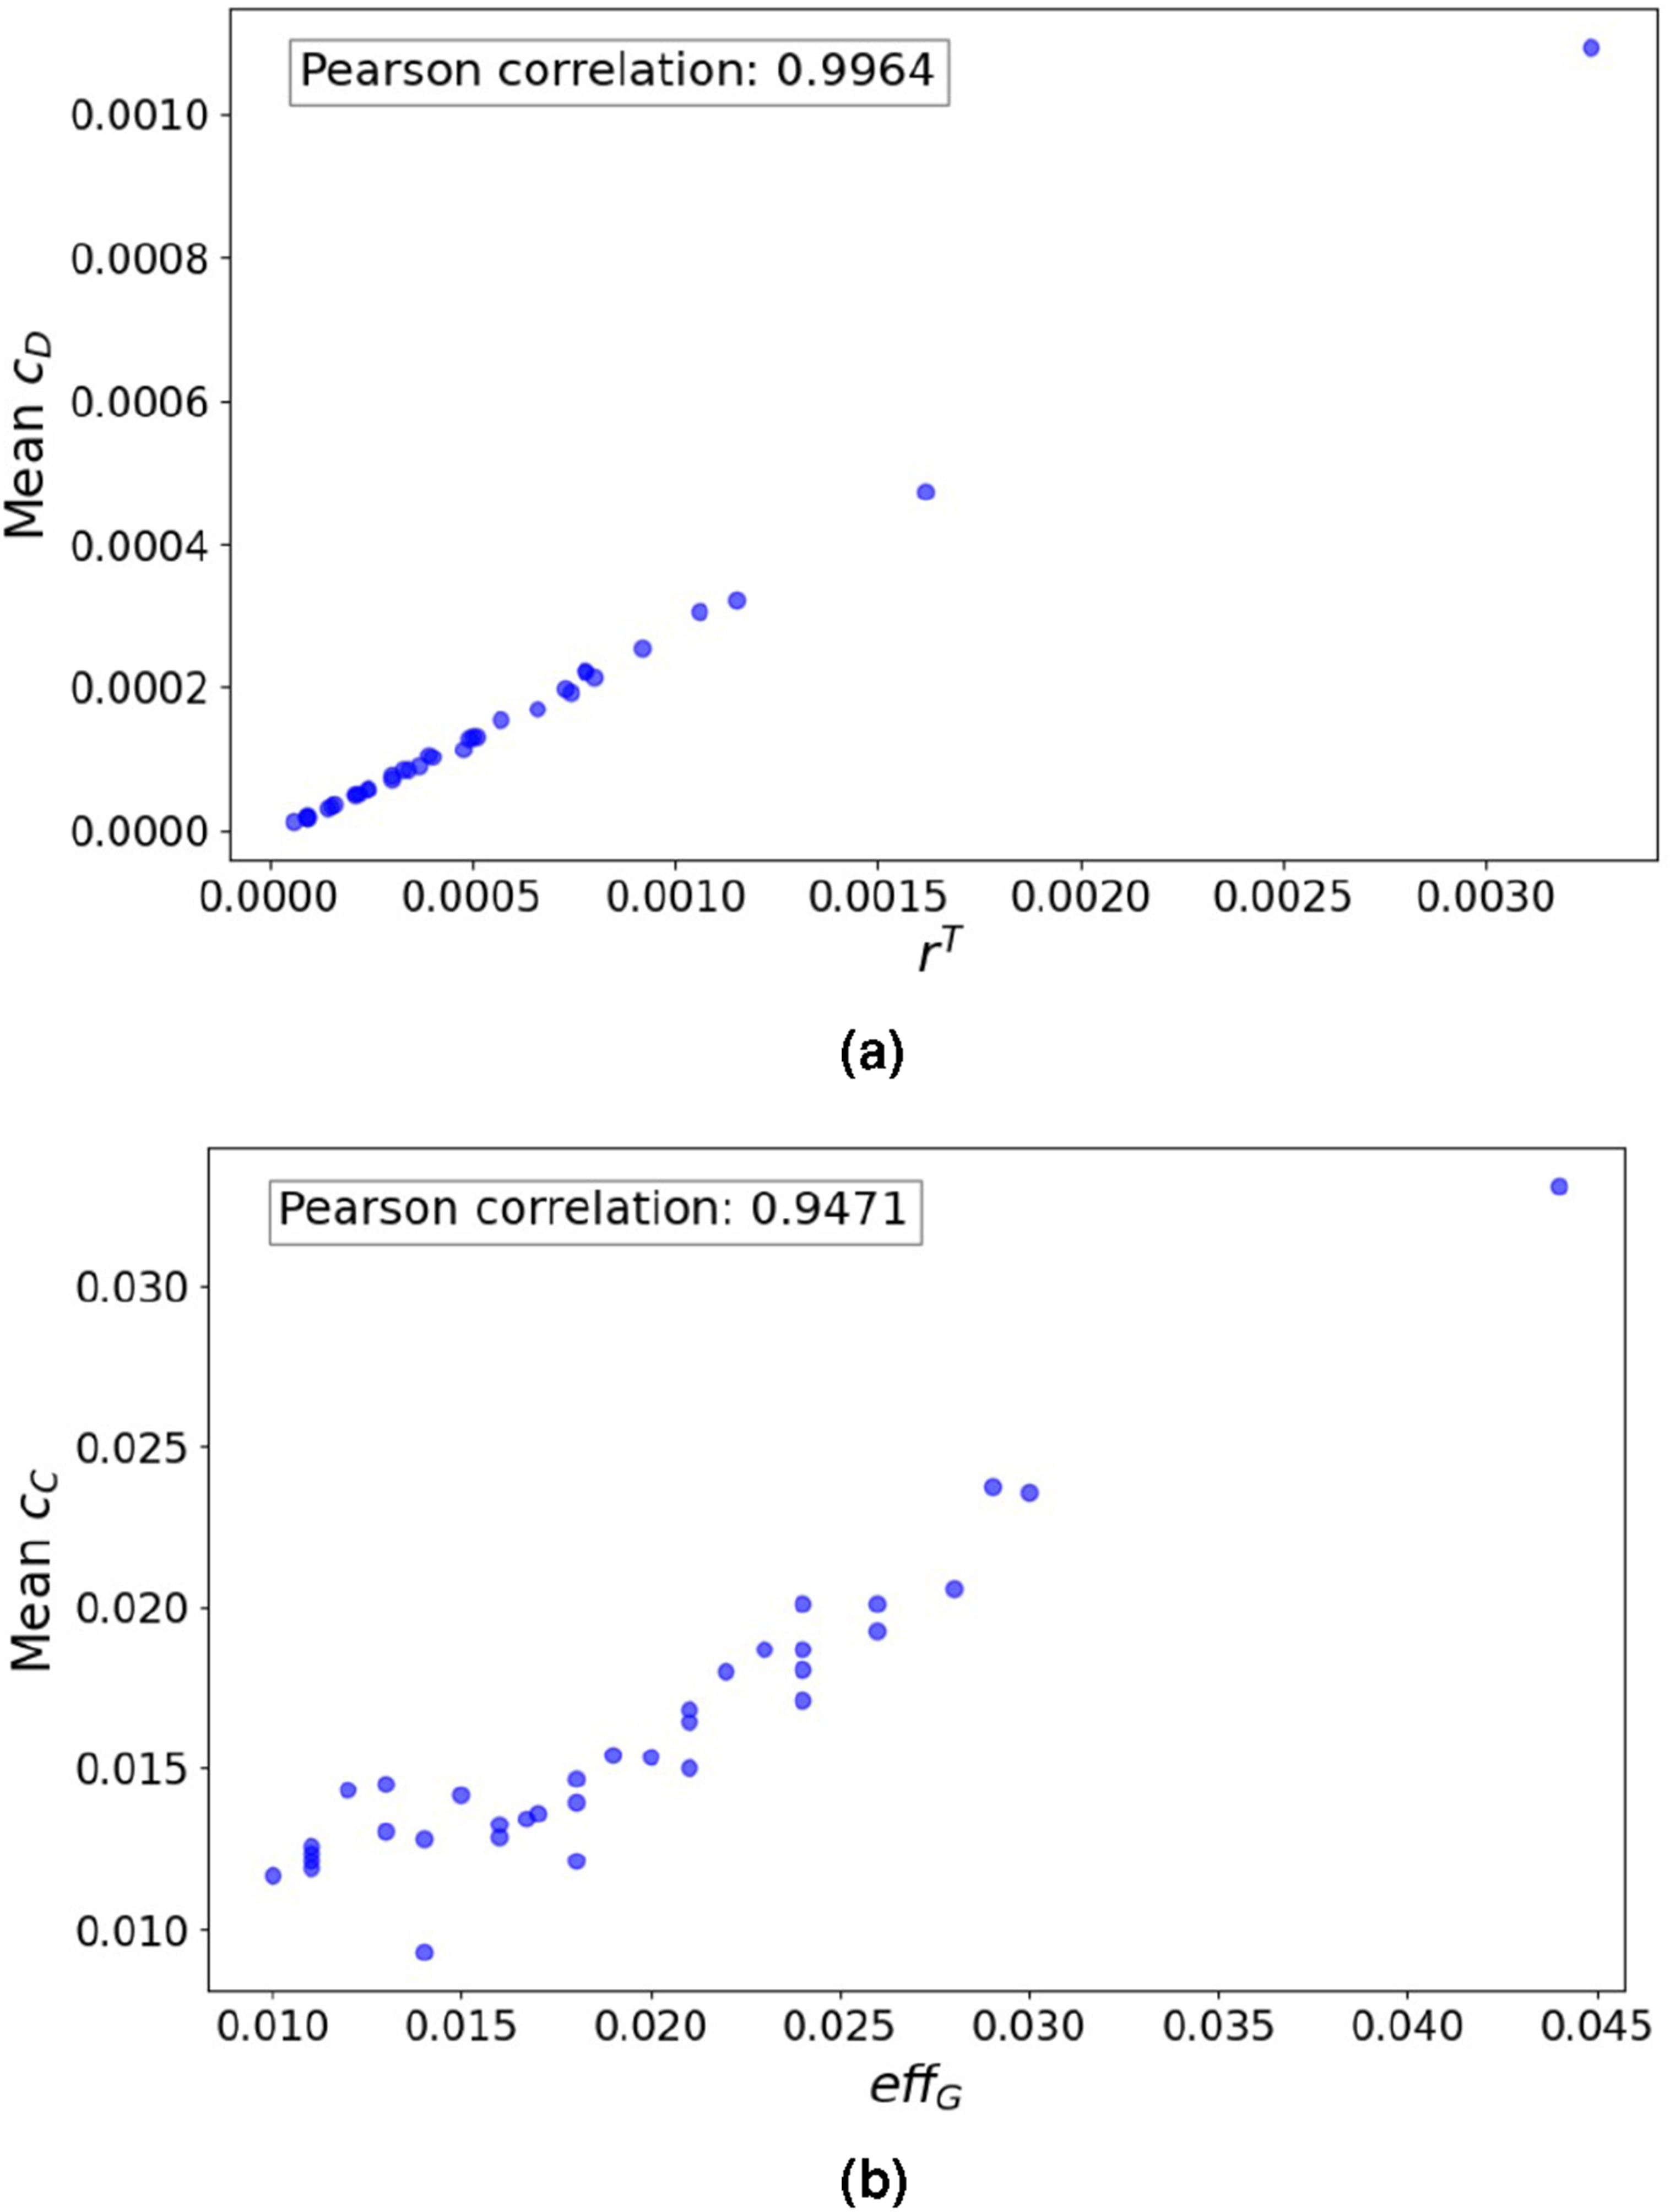
Contrasting Chinese and Indian cities
Out of 35 road networks in this study, 29 of them are from China (20 cities) and India (9 cities), the two most populous countries in the world. It is then interesting to discover the similarities or differences of road networks in these two countries. From our results, we observe that most Indian cities tend to exhibit higher diameter D and average path length H G than Chinese cities. From our study, Indian cities on average recorded D and H G to be 215 and 80 while Chinese cities only showed average D and H G to be 191 and 63, respectively. This suggests that Chinese cities exhibit stronger “small-world” property (Watts and Strogatz, 1998) than Indian cities.
At meso-scale, Chinese cities have a slightly higher number of communities (Chinese cities have 469 communities on average, while Indian cities have 446), reflecting the existence of more hubs in the city. For instance, Beijing which has 3214 communities is the Chinese city with the highest community count while the Indian counterpart, Hyderabad, only has 910 communities. On the other hand, Indian cities have a larger average community size than Chinese cities, averaging 177 compared to 127. Chinese cities, with a higher number of smaller communities, likely feature a decentralized, cluster-based structure, each with its own local services. This setup suggests a need for localized infrastructure. In contrast, Indian cities have larger community sizes, indicating a demand for higher-capacity infrastructure and services to support more densely populated areas. The Path-Core (PC)% metric reveals that Chongqing has 18.7% core nodes, compared to only 0.45% in Ahmedabad. This difference highlights that Chinese cities, averaging 8.5% core nodes, tend to have larger centralized hubs that may boost transportation efficiency, while Indian cities, with an average of 3.9%, might have more fragmented transportation structures.
The centrality distributions for road networks from both countries share similar shapes. Both groups exhibit power-law distributions in betweenness centrality distribution, suggesting traffic concentration at key intersections. Also, both groups of cities predominantly have nodes with a degree of 3 (T-shape junction). Nevertheless, Chinese cities exhibit a slightly more balanced degree distribution across degrees 1 to 4 while Indian cities show a higher concentration of nodes with a degree of 3.
Conclusions
This paper presents a topological study of road networks in densely populated cities. Using tools from network science, we first view the road networks as graphs consisting of nodes and links and then approach the analysis in three different scales, namely, macro-scale, meso-scale, and micro-scale. At the macro-scale, we used a range of metrics based on various aspects of the networks (i.e., based on several nodes and links, based on local connectivity, and based on paths). Among these, we find three groups of metrics which are highly positively correlated, (m,
From our analysis at the meso-scale, we found that the considered road networks represent a specific class of networks with particularly high modularity which is not often observed in other real-world networks. The high number of communities as well as the low sign of core-periphery structure also suggests that these cities are polycentric with multiple regions having a concentration of road connectivity likely due to high demand to access these regions (e.g., business districts). A future direction on this front would be to consider multiple core-periphery pairs, for instance, using the definition proposed in Kojaku and Masuda (2017b).
At the micro-scale (i.e., nodal level), we find the centrality measures considered showing different but consistent distributions. The degree distributions show a lack of degree diversity and highlight the physical spatial constraint in the construction of road infrastructure where most junctions follow the T-shape and there is a very limited number of junctions with high degrees. This then resulted in the distributions not following the power-law which is the opposite to the betweenness distributions which show a strong positive fit to the power-law. We found that the power-law exponent of these cities ranges between 0.98 and 1.44 which are steeper than networks such as the Internet (see Faloutsos et al., 1999). Closeness distributions, on the other hand, show (left-skewed) binomial distribution.
While individual metrics offer their own specific insights into the characteristics of the road networks and have different correlations with each other, we further summarize the key highlights below: • Macro-scale: We identified three groups of highly positively correlated metrics related to network characteristics, while diameter (D) and average path length (H
G
) were negatively correlated with other metrics. Road networks with higher r
T
were also found to be more efficient eff
G
. • Meso-scale: The road networks exhibited high modularity and polycentric structures, characterized by high number of communities and low core-periphery values. • Micro-scale: Centrality measures showed consistent distribution shapes across different networks, with degree distributions lacking diversity due to spatial constraints, while betweenness distributions fit a power-law model. Closeness distributions followed a left-skewed binomial pattern.
The results and observations from this work offer a multi-scale analysis of the topological properties of road networks in highly populated urban cities. Our approach offers a set of multi-scale pictures of urban road networks, enabling a more exploratory avenue to understand road networks. Methodologically, this approach is generic and could always be further expanded to include more metrics (e.g., other centrality metrics such as Katz and PageRank), depending on the purpose of study or use cases. Our analysis here should offer insights for relevant stakeholders for understanding, planning, and developing cities. For instance, both road networks in Bologna and central Nantes have been found to be monocentric systems (Viana et al., 2013) while in contrast, highly urban road networks studied here exhibit polycentrism (e.g., Shanghai in our study has evolved from a monocentric city centered around the Bund and People’s Square area to a polycentric city with multiple urban center areas such as Pudong, Hongqiao, and Minhang [Wu, 2015]). This would inform city authorities/planners whether to decentralize city development or how to distribute resources across different regions in the city.
Finally, our insights (e.g., the distribution shapes of the centrality measures, power-law exponent, and modularity) could also be exploited for modeling and assessing similar classes of networks. For instance, understanding that betweenness centrality follows a power-law distribution, particularly with the highest exponents observed in Sao Paolo (1.44) and Calcutta (1.39), indicates that betweenness centrality is concentrated in a small number of nodes. This concentration means that a few nodes account for a significant portion of the network’s total betweenness centrality. Consequently, traffic management systems can identify critical roads that handle a substantial share of traffic. These high-betweenness nodes can be targeted with real-time traffic signals and congestion management strategies, thereby reducing overall congestion in the city. Similarly, the insights regarding closeness centrality following a binomial distribution with the tail extending towards lower closeness values suggest a higher proportion of nodes that are farther from the central nodes. This indicates potential areas where improved connectivity could alleviate traffic bottlenecks and increase overall accessibility within Quanzhou and Chongqing. In conclusion, our study provides a multi-scale understanding of road networks in densely populated cities, offering insights that can inform city planning, traffic management, and infrastructure development in similar urban environments.
Supplemental Material
Supplemental Material - A multi-scale network-based topological analysis of urban road networks in highly populated cities
Supplemental Material for A multi-scale network-based topological analysis of urban road networks in highly populated cities by Assemgul Kozhabek and Wei Koong Chai in Environment and Planning B: Urban Analytics and City Science
Footnotes
Declaration of conflicting interests
The author(s) declared no potential conflicts of interest with respect to the research, authorship, and/or publication of this article.
Funding
The author(s) disclosed receipt of the following financial support for the research, authorship, and/or publication of this article: This work was supported by the Bournemouth-Christchurch-Poole (BCP) Council, UK, and an OpenBright Award.
Supplemental Material
Please find the following supplemental material available below. For Open Access articles published under a Creative Commons License, all supplemental materials carry the same license as the article it is associated with. For non-Open Access articles published, all supplemental materials carry a non-exclusive license, and permission requests for re-use of supplemental material or any part of supplemental material shall be sent directly to the copyright owner as specified in the copyright notice associated with the article.
References
Supplementary Material
Please find the following supplemental material available below.
For Open Access articles published under a Creative Commons License, all supplemental material carries the same license as the article it is associated with.
For non-Open Access articles published, all supplemental material carries a non-exclusive license, and permission requests for re-use of supplemental material or any part of supplemental material shall be sent directly to the copyright owner as specified in the copyright notice associated with the article.