
Abstract
The form and the size of cities influence their social, economic and environmental outcomes. The form of a city is itself influenced by the shape of its road network, but this relationship and how it is affected by city size are unclear. We analyse how road distances to the main centre vary across 300 European cities and how radial physical detours (i.e. the distance on the road network compared to the Euclidean distance) are affected by city size and extent. We use landuse and population data to sample potential residences and compute the fastest routes to the main centre. We find a linear relationship between road and Euclidean distances, and for the first time document an average radial physical detour of 1.343 across Europe. We then rescale distance bands so to make cities of different population size comparable and show the effect of different urban delineations. We find that physical detour ratios increase when core cities only are considered without suburbs. At the urban region scale, radial physical detours increase with city size, especially when other significant geographical factors (latitude, longitude, elevation change and proximity to coast) are controlled for. When the central part of cities only is considered, larger cities have smaller radial physical detours.
Introduction
In Europe, urban areas gather over two-thirds of the total population (Borrego et al., 2006). The increase of mobility of people within cities due to relaxed transport constraints and the concentration of human activities induce many economic, social and environmental impacts (e.g. Wiel, 1999; Brueckner, 2000; Ewing, 2008; EEA, 2016). Analysing these impacts requires a profound understanding of the complex relationships between the spatial organisation of landuses and transportation networks (Seto et al., 2011; NSF, 2018). Transport patterns impact the sustainability of cities and are influenced by the location of activities, as clearly demonstrated by urban forms and travel behaviour research (e.g. Boarnet et al., 2001; Cervero, 2001; Schwanen et al., 2004; Handy et al., 2005).
The shape of transportation networks can be seen as one side of urban forms, the other one being the shape and density of built-up land. Comparatively however, transportation network shapes are much less studied than urbanisation patterns. How the shape of transport networks relates to the shape of urbanisation, as well as to city size, is still not well understood, while being an essential premise for policy-making. Meeting societal challenges such as reducing traffic emissions or pollution intakes along travel paths (Schindler and Caruso, 2018) requires a better understanding of how travel distances are affected by urbanisation forms and vice versa, as well as by agglomeration and densification processes.
We contribute to this endeavour by exploring the relation between Euclidean and road network distances across Europe. More precisely, we aim to determine how the ratio of road network distances to Euclidean distances to the main centre of activities of each urban region – namely the radial physical detour – varies, and whether it is influenced by agglomeration (population size) and spatial expansion.
If road distances are not sufficient to describe actual travel patterns, the road infrastructure can be considered in the short term as a given to travel and residential choices. Our ‘detour’ is here to represent the physical structure of the road network, hence the form of the city in normal conditions, rather than the excess travel due to peak hour congestion, for example. Quantifying road distances and physical detours can be seen as a premise to indicate the over- or under-expansion of cities given their size, and can eventually highlight the relative effectiveness of cities’ internal morphology compared to others of similar size.
Most studies comparing urban expansion patterns across countries or regions in Europe are limited to landuse and do not relate to transport accessibility (Kasanko et al., 2006; EEA, 2016), or are limited by incomplete data (e.g. Arribas-Bel et al., 2011). As far as we know, only in OECD (2018) is accessibility implicitly entering an urban expansion metric via a population decentralisation index (ratio of core to total population). A cross-sectional empirical analysis of distances across many cities in Europe is thus justified and timely. While the European city is often depicted as dense, compact and sometimes sustainable compared to urban forms on other continents (Huang et al., 2007; Beatley, 2012), the rather simple question of how much physical detour road networks command on someone willing to travel from her/his residence to the main centre is still unanswered. Similarly, little is known about the variation of such detours across European cities and thus whether there is anything like a ‘European city’ model.
After quantifying a global radial physical detour in Europe, we show how these detours scale with city size (population). This builds on the urban scaling literature (Batty, 2013; Bettencourt, 2013) that seeks to identifying (dis-)benefits of agglomeration. Scaling relations between average road network properties and city size have been established by Bettencourt (2013), Louf and Barthelemy (2014a) and Lee and Jung (2018). Yet, empirical findings are still scarce, especially across a range of different city sizes for Europe. Moreover, there is no quantification of road distances and detours to accessing the main city centres. Even in polycentric settings and most certainly in Europe, the radial accessibility of the centre still has a strong effect on the urban structure, that is, density gradients and land values (Delloye et al., 2020; Lemoy and Caruso, 2020; Liotta et al., 2022). Radial accessibility is only one aspect of the infrastructure but a key one since it relates strongly with locational processes, travel patterns and classic planning interventions such as urban boundaries, congestion tolls or ring roads.
One thing is to quantify radial physical detours per city and across city size. Another is to find out whether the relationship is homogeneous within cities, that is, whether the infrastructure in the core differs from the suburbs. Zooming in not only helps refining the relationship between road network forms and urbanisation extents, but it also contributes to questioning the often-linear representation of transport costs against distance in urban models (following Alonso, 1964). Pragmatically, it also resolves the problem of a consistent delineation of cities across cases and size ranges, which we know is a recurrent problem for landuse and transport interaction appraisal (Thomas et al., 2018) or in the urban scaling literature (e.g. Louf and Barthelemy, 2014b; Cottineau et al., 2017; Jiang and Jia, 2011). Our solution consists in analysing physical detours for a series of urban extents while controlling for population size, using the scaling of homothetic urban profiles identified by Lemoy and Caruso (2020, 2021). Beyond the topical problem of road physical detours, this paper also demonstrates that this radial scaling can be used to compare more effectively various urban characteristics across a wide range of city sizes and extents.
The article is structured as follows: we first conduct a short review of theoretical and empirical evidence about road network shapes, detours and how road infrastructure changes with city size. We then suggest a simple theory of road network physical detours in the case of a disc-shaped city of varying extent, in order to formulate an expectation of radial physical detour ratios In the two following subsections, we describe our data processing and analytical methods. In our results section, we estimate physical detours using Google Maps for 301 European cities at the urban region scale and for reduced urban extents, and identify population size (scaling) effects. In the subsequent section, we explore the effect of other factors on the variability of physical detours across Europe and on the scaling estimates. Data reliability is then assessed with a comparison to radial physical detours obtained from Open Street Map (OSM), and robustness is checked after comparing to non-radial physical detours. We draw conclusions in the last section.
Road networks literature
Our work relates two research fields: one on road network topologies and detours, and one on how urban infrastructures and their functioning change with city size (scaling or agglomeration effects).
Road network shapes and detours
The topology of urban roads and streets networks has been studied from the perspective of graph theory, complex networks or network optimization. In these fields, the physical structure of networks is described by the arrangement of their constituting links and nodes (Jiang and Claramunt, 2004; Cardillo et al., 2006; Crucitti et al., 2006) and a series of indicators (centrality, regularity, straightness,…) based on their planar relationships.
Investigating network detours consists in assessing the additional length of trips on the road network compared to the Euclidean path. It is the inverse of straightness (or directness) indicators used in graph theory. Detours are unavoidable since moving on the road network is equivalent to bypassing blocks, themselves consisting of various landuse patches and clusters of buildings. An average detour being normal, only excessive detours, caused by further specific conditions or landuse patterns, are normatively worrying. It is thus the deviation to the general link between Euclidean and road distances that needs to be inspected. The higher the detour index than the expected, the lower is the network efficiency in terms of directness.
Detours have been computed on theoretical networks as well as on real-world networks. In the first case, a lengthening of around only 6% has been reported for trips on X-shaped networks, and a 10% lengthening for trips on equilateral triangle-based networks (Héran, 2009). Héran (2009) also suggests that, due to irregular but well-connected network structures, distances travelled on European roads are more efficient (average lengthening of 20%) than rectilinear distances travelled on Manhattan networks, more typical of American cities (30% average lengthening). In monocentric settings, Josselin et al. (2016) show that radio-concentric networks have better straightness than the rectilinear ones, no matter the number of radii. Perreur and Thisse al. (1974) also compared the radial trip cost to the circum-radial (peripheral) trip cost and highlight the potential of peripheral roads for reducing congestion.
In addition to straightness, regularity has been measured by the ratio between four-way intersections (i.e. X-junctions or degree 4 nodes) and three-ways intersections (i.e. T-junctions or degree 3 nodes). Regularity is linked to urban functions, histories, cultures and socio-economics, topographies and other geographical constraints. For example, Marshall (2004) shows that medieval cities usually have irregular street patterns with short or crooked streets, while modern cities often show a hierarchical network with regular, orthogonal or tree-like patterns. These street structures are assumed to result from either self-organisation (unplanned) or top-down planning. Rather than depicting an entire city, we can also hypothesise that these processes and forms also vary as one moves away from the centre, that is, in a radial manner, which also largely corresponds to history.
Empirically, Nordbeck (1964) performed one of the earliest attempts to quantify road detours. The distance was assumed to lie between the Euclidean distance and the square root of twice the Euclidean distance. A few years later, Cole and King (1968) found a road distance proportional to the Euclidean distance with a detour between 1.2 and 1.6 in the Great Britain. Other previous literature results show empirical detour ratios of 1.3 for urban grids in Ontario (Love et al., 1988), of 1.417 for distances between any address of the US to the nearest community hospital (Boscoe et al., 2012), and of 1.3 in China (Yang et al., 2018). This last study found a detour peak for very short trips using local streets (below 2 km) but then a constant ratio for all other trip lengths. There are many more empirical national or local case studies about distances travelled on the road network (e.g. Shahid et al., 2009; Boscoe et al., 2012; Puech et al., 2017) but they display different results and so far no unitary theory can be drawn at a continental scale. Table S1 summarises the results presented here. We participate to this empirical strand of the literature and contribute to a more unitary understanding by studying cities over an entire continent. We also add a radial perspective, which, as we have seen above, is seldom analysed theoretically and empirically. This centre-periphery lens is particularly interesting because it relates to the accessibility assessment of city centres, and because many urban planning policies are framed with distance to centre in mind (green belts, congestion charge areas, transport fares,…). Moreover, if real time costs are usually directly considered in applied transport economics or LUTI models, there is still no clear consensus today on how to include road distances and related costs in the more theoretical and parsimonious urban models of the Alonso (1964) tradition.
Road network properties and city size
The best-known evidence of the size distribution of cities is Zipf’s law, stating that cities are power law distributed (Jiang and Jia, 2011). In addition to this rank-size rule, other urban scaling relations have been characterising how different aggregate properties of cities vary with population size (Pumain et al., 2006; Bettencourt, 2013). A handful of research examined the scaling of aggregated network properties empirically:
Several studies converge towards a sublinear scaling of the total road length and area with population size (Bettencourt, 2013; Louf and Barthelemy, 2014a; Lee and Jung, 2018; Yang et al., 2018). Bigger cities need to spend less in infrastructure per capita than smaller ones; infrastructure grows less than proportionally with the population. Lee and Jung (2018) found that the relation between total street segment length and population in 22 Korean cities is sublinear, with power exponents ranging between 0.485 and 0.930 depending on the city structure and administrative status, and with an average exponent of 0.599 for all cities. Bettencourt (2013) found an exponent of 0.67 for road length in 12 Japanese cities. He also found a mean exponent of 0.84 for the network volume in US and German cities. This should however be contrasted against the clear proportionality found by Lemoy and Caruso (2020) for the artificial area in general, and the area of transport infrastructure in particular, using radial intra-urban analysis. Yang et al. (2018) found a scale-invariant detour ratio across 10 Chinese city sizes (diameters). The mean of their detour ratio is 1.3, except for very short trips using local streets. Conversely to infrastructure itself, Louf and Barthelemy (2014a) showed that the total delay due to congestion in 441 US cities scales superlinearly with population (exponent of 1.27), thus questioning the sustainability of bigger cities. Conclusions about the scaling of road network infrastructure are thus mixed and must be drawn with care. Table S2 summarises the results presented here.
Moreover, scaling relations also vary depending on how cities are spatially defined and cutoffs applied (Cottineau et al., 2017). If larger cities are more efficient in terms of road infrastructure in their centre, showing a sublinear scaling, they consume more infrastructure per capita when including their functional peripheries (scaling becomes superlinear). This emphasises the importance of varying cities’ definition, as we will systematically perform below.
Methods
In this section, we first construct a theoretical understanding of detours in order to relate our empirical estimations to expectations from a Manhattan theoretical network and cities of different extents. This effort follows the classic example of Kuiper (1986), who compared theoretical geometric distance distributions (with Manhattan or Euclidean measurements) between point patterns in rectangles, with road network distance distributions among European cities, that is, irregular geographical shapes. Second, we present the data and its processing. Finally, we present the analytical steps undertaken.
Theory: Road network on a disc city
In this study, urban form is described in accordance with the Alonso–Muth–Mills monocentric city model (Alonso, 1964; Muth, 1969; Mills, 1972). This centre-dominance model makes the strong assumption that transport costs are the same in all directions and linear functions of the Euclidean distance to the centre. Alongside this theoretical model, we assume a featureless plain without any geographical heterogeneity: the city is a disc. This simplifying assumption is made both for methodological and empirical reasons. First, it allows dialogue with urban economics where space is considered in one dimension. Second, monocentric cities have been proven to be valid in reality, except for cities at the top of the hierarchy. Even in polycentric systems, one centre is often predominant. Moreover, the polycentricism depends on the scale of analysis and on the cities’ delineation.
While the Euclidean distance metric is widely used in models because of its ease of implementation, it may not be sufficient to represent costs. The Manhattan road network distance is often presented as a more accurate distance measure, especially for very dense network topologies and recent cities. However, it can quickly overestimate the real travel distances. By definition, it is the distance computed on a square or rectangular grid. Compared to the straight-line distance, this grid-like network induces an increase in the travel distance, that is, a detour, whose maximal value is
By applying the Manhattan network to the framework of disc-shaped monocentric cities, an average detour factor can be obtained (Figure 1). This toy model gives a rather naïve, but accurate, expectation. The average distance between each point of the arc of the circle and the centre is computed using the integral of all vertical ( Road network model for a monocentric city.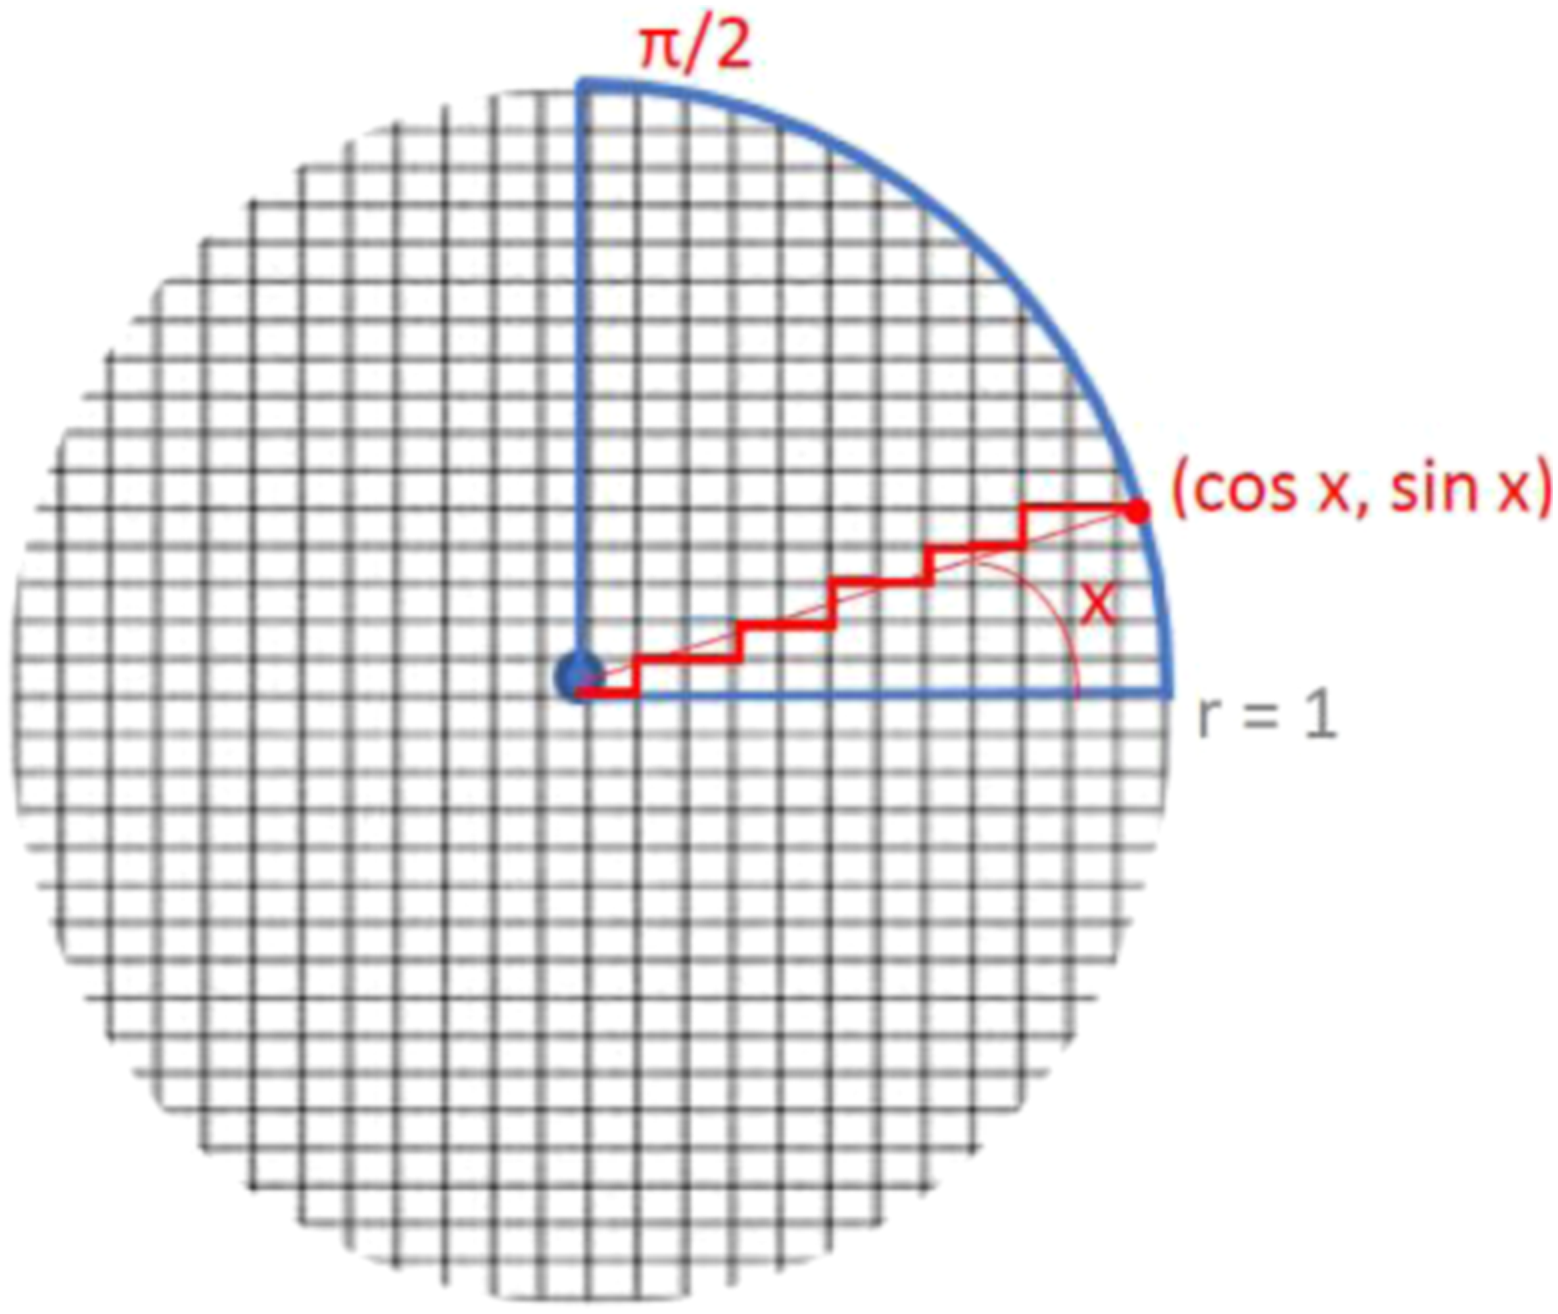
The following multiplier is then obtained
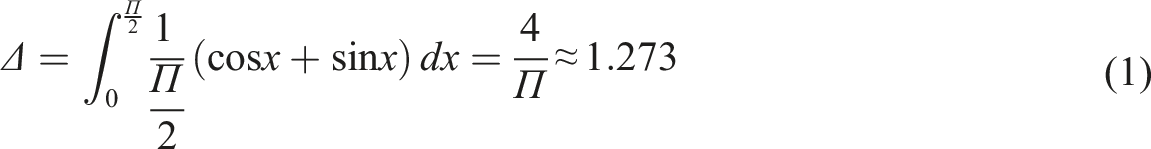
This average value of
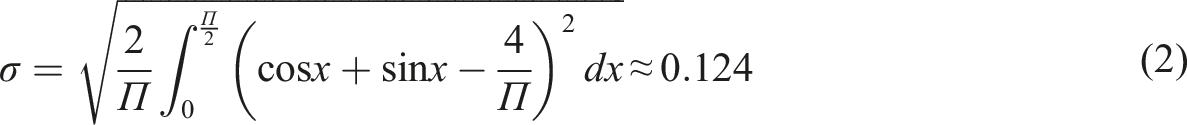
Equation (2) below shows the expected standard deviation
Computing radial road network distances
Road network distances and physical detours were computed for 301 European Larger Urban Zones (LUZs) (Copernicus, 2006). The border of these functional urban areas is defined as the limit of the employment attraction zone. Our metrics are based on empirical distance measurements between populated places and the main centre of the region. At least one residential point per 1 km2 grid cell (Eurostat, 2006) is randomly sampled as the potential origin of trips (systematic unaligned sampling). The sampling process is depicted for Namur as an example on Figure S1. For the entire dataset, the computational process resulted in more than 303,000 simulated trips.
The considered trips are the fastest paths to access the centre, using the Google Maps Algorithm, implemented through Friendly Batch Routing (Medard De Chardon and Caruso, 2014). A data bias check is conducted later using OSM data and the OSRM algorithm (OSRM, 2021). Identifying distances using fastest paths is consistent with the fact users of motorised transport are sensitive to travel times and may choose longer routes to save time (conversely to pedestrian or cyclists who value energy-saving logics). The fastest route accounts for one-way roads and allowed speed on every segment, conversely to shortest distances.
The fastest paths were computed without any specification of departure time, so that the average time independent of congestion is used in the minimisation. Mennicken (2022) shows that these obtained travel times are slightly longer but in range with times in free flow. An example is given in supplementary material figure S2: the times of these paths are very dissimilar to the congested peak times, and thus fit our purpose of a ‘physical’ detour.
Analytical steps
The computed network distance trips and respective physical detours are analysed in three ways: first, we describe the profile of road network distances against Euclidean distances and retrieve a physical detour in general and for each city (see method and corresponding results); second, we examine whether and how this relationship and the corresponding detour vary with city size; and third, we attempt to explain the variations in physical detours across Europe. For each of these questions, the effect of varying the extent of the city is explored.
Radial road network physical detours
Let’s denote by

We fixed the intercept
After considering the entire dataset, we perform linear regressions on each city c individually

From this equation, we retrieve an empirical physical detour per city
However, as argued earlier, we expect this detour to vary within cities and according to cities’ spatial extent. We therefore estimate the physical detour for increasing urban discs. In fact, city centres have more complex proximity networks than outskirts, where one finds more triangular blocks and star-shaped network nodes. As the distance to the centre increases, or when cities are defined in a very large manner given their population, we expect a smaller physical detour. Moreover, for example, in our dataset, Umea (SE) and Stara Zagora (BG) both have a population of around 136,000 inhabitants, but Umea shows Euclidean radial distance above 100 km while Stara Zagora goes no further than 6 km. This shows the need to treat such differences systematically, independently of the LUZ delineation once city size (population) is given.
We resolve the problem by applying the homothetic scaling of Lemoy and Caruso (2020). They show that urbanisation profiles are 2-dimensional objects that scale with the square root of city population. The rescaled distance to the city centre can be described with the relationship (5).
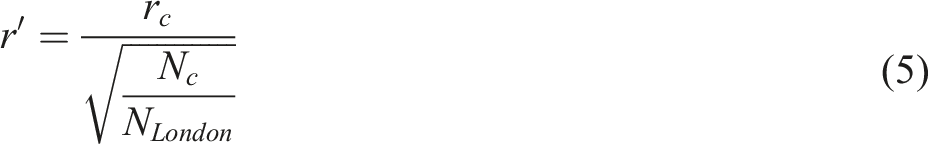
This formula gives the theoretical urban boundary, from the relation between the city’s population and the reference population (
After estimating the following equation

City size
Second, in addition to these general relations between Euclidean and network distances, our radial profiles are compared between cities of different population sizes. The aim is to identify whether there is a scaling for the radial physical detours, complementing other research that tends to point to a sub-linearity of urban infrastructure with city size, thus agglomeration economies.
We plot the relationship between the physical detour

The estimation is OLS-based after log transformation of the population of each city, that is,
Further, given discrepancies in cities definition and expansion for a given city size, we also perform this scaling analysis for varying city extents. We estimate the effect of population (model 1) on each of the physical detour ratios corresponding to varying

Spatial heterogeneity and causes
Third, we investigate the spatial heterogeneity in Europe, to offer a first reflection on the origins of the observed physical detours. After having tested the sole effect of city size on detours, we add other explanatory variables. Societal as well as natural constraints were reported in the literature to substantially influence inter-urban variation in residential land supply and prices, and thus in internal city structures (Rose, 1989; Guidry et al., 1999). The natural setting as well as the artificial setting (like railways, highways or business parks) of a city and its surroundings can also act as space separators or impassable barriers and determine the network shape and related physical detours.
We include the geographical location of the cities (latitude and longitude of the CBD in decimal degrees) as a proxy to capture European-wide territorial heterogeneity. For natural constraints, we select the proximity to the sea and the presence of mountains. The proximity to the sea is computed as the straight-line distance from the CBD to the closest coastline (EEA, 2018). This water constraint shapes the city structures and especially the road network geometry, and it may cause major detours. To represent the hilliness of the cities, we calculated the standard deviation of the elevation in LUZ areas, thanks to the GMTED2010 terrain elevation data (US Geological Survey, 2010).
It was deliberately chosen not to include any road network characteristic itself (such as the capacity, the number of crossroads, of one-ways streets,…) to avoid any information repetition. The physical detour rate is meant to represent the network shape on its own.
We perform a multiple linear regression (model 2) between the physical detour ratio and the five variables, on the original LUZ extents (equation (9)) and again for the same rescaled distances (equation (10))


All explanatory variables are taken at the CBD, except the elevation that varies with the chosen extent
Results
Physical detour estimates
To begin, we find that the distances computed on the road network (d) are directly proportional to the straight-line distances (r) to the centre. The overall linear regression (equation (3)) on the whole dataset gives a coefficient estimate of Plot of network versus Euclidean distance for 301 European cities. Slope of red line 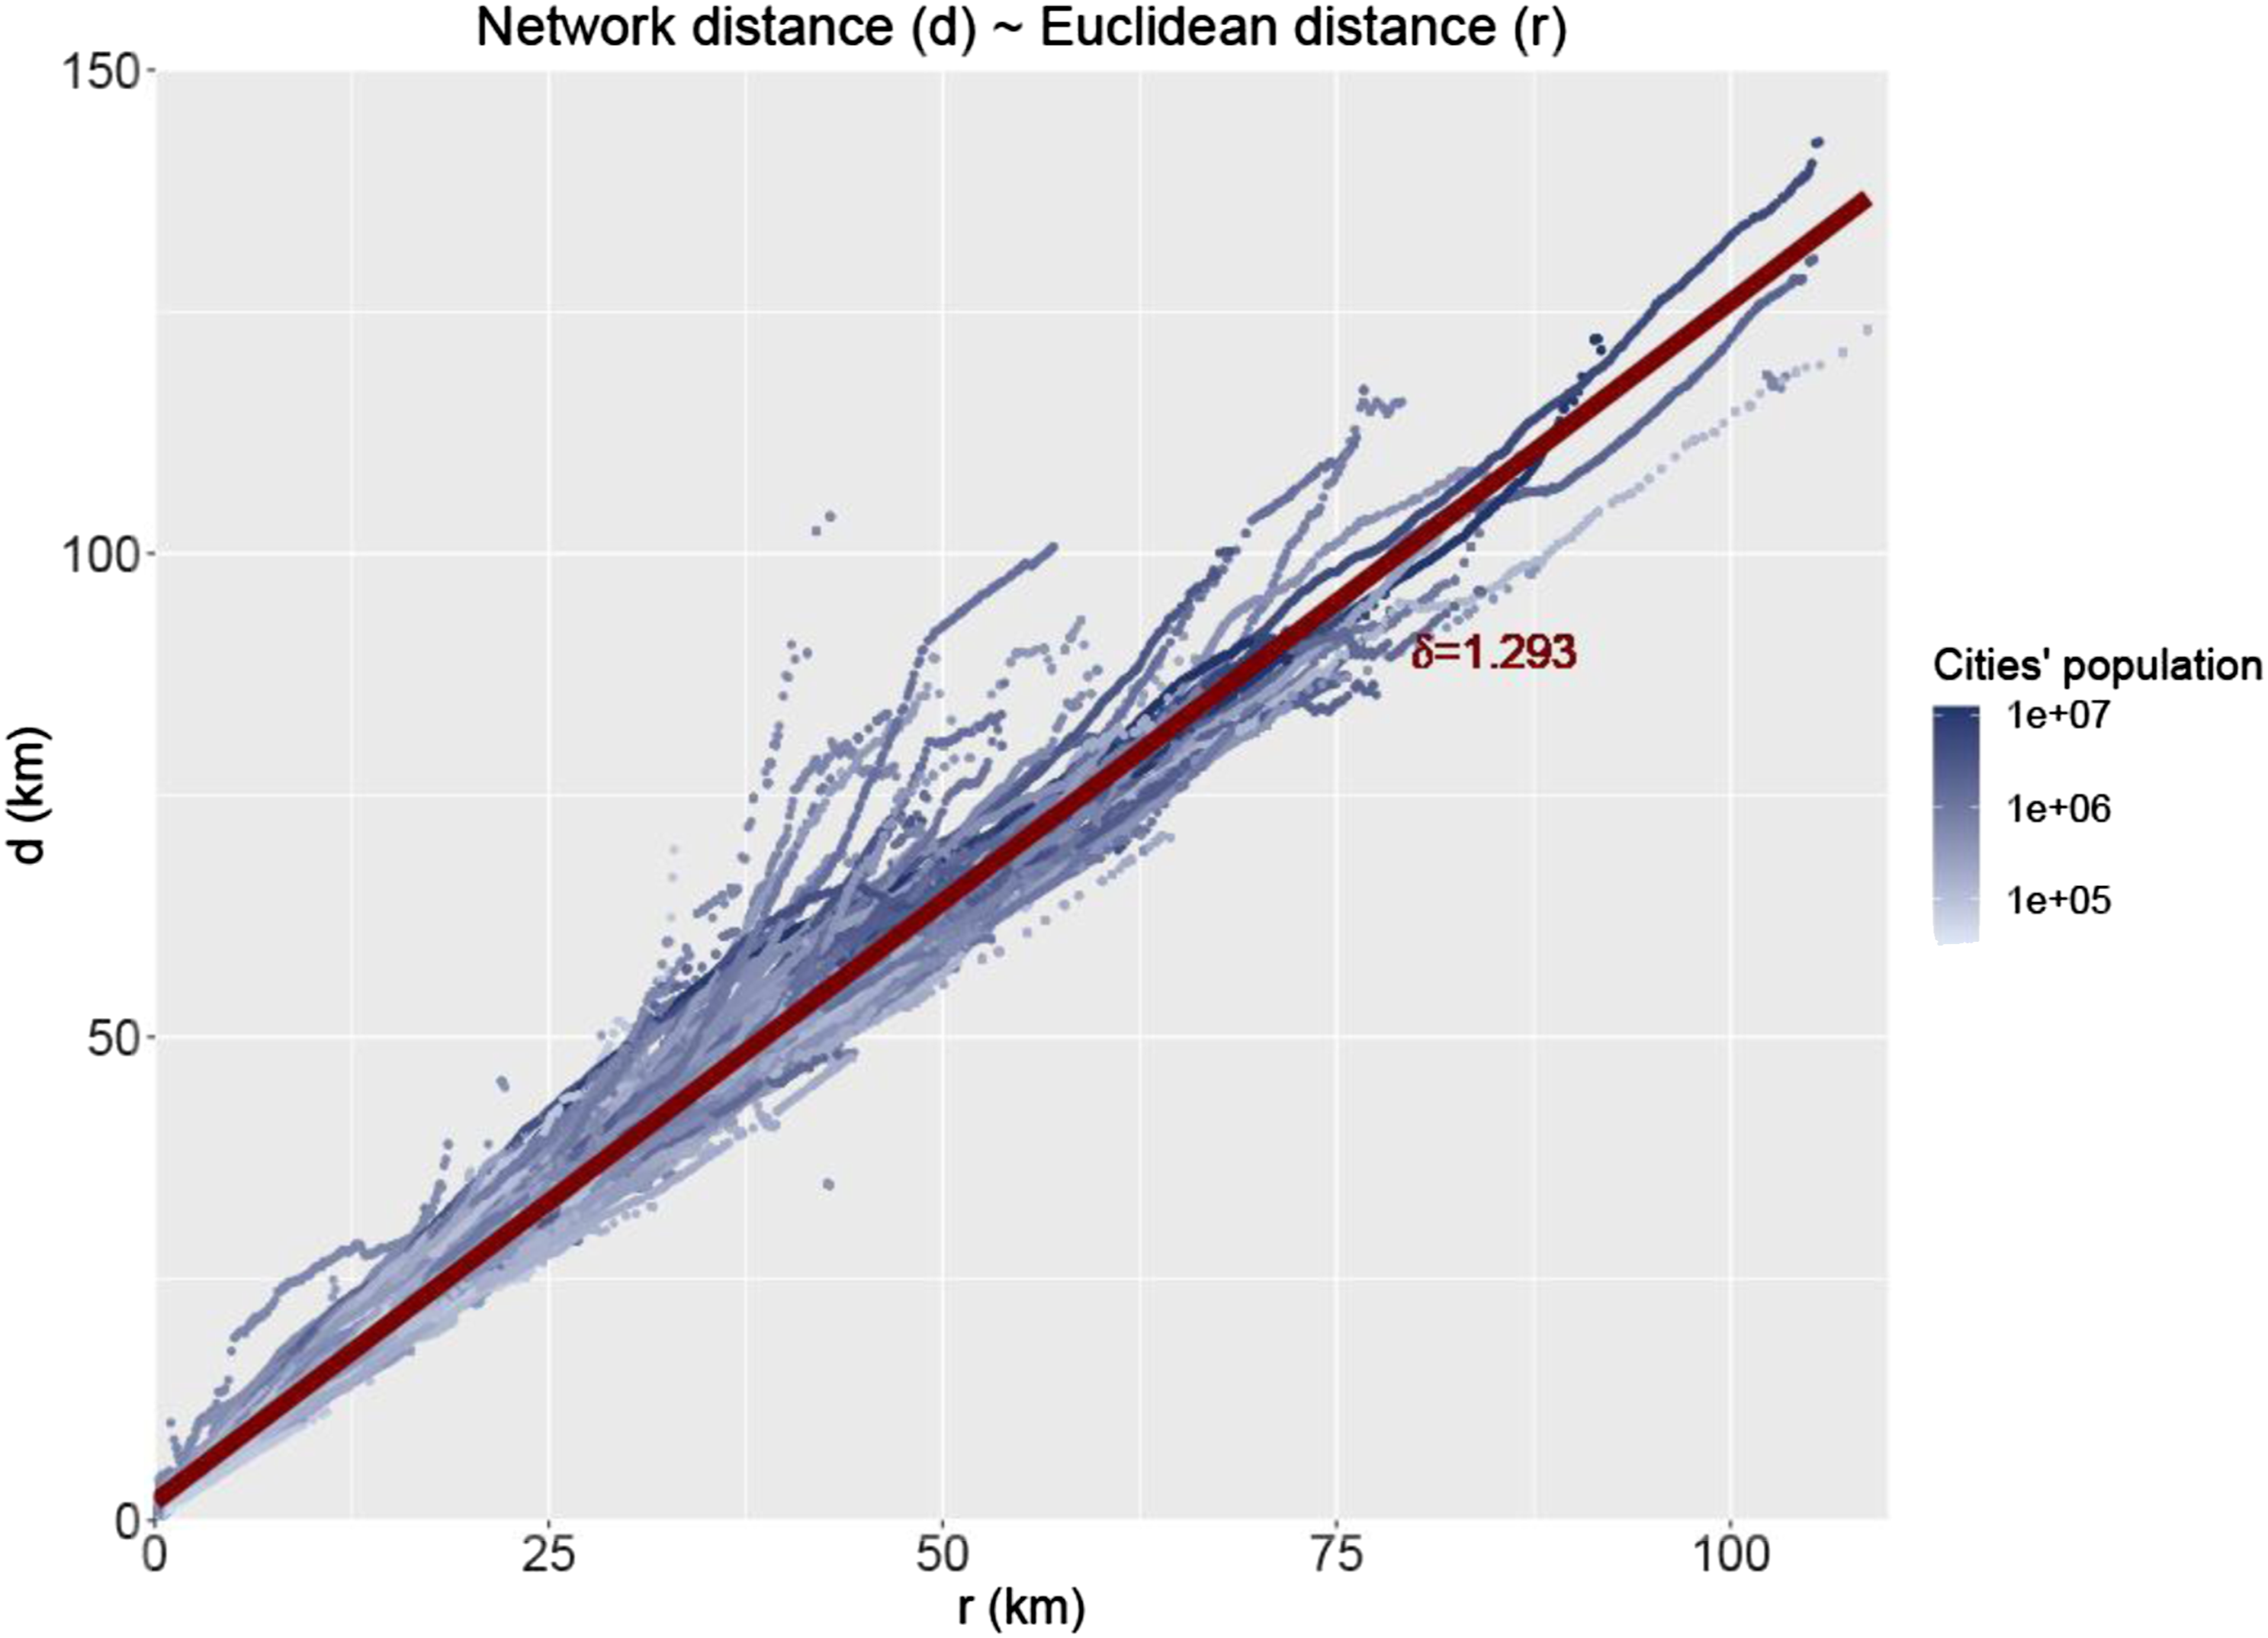

These empirical results are very close to our toy model, both in terms of mean and deviation, that is,
The average goodness of fit of our estimates is very high: both globally and for each city (
The radial physical detours were also estimated for each city and a series of increasing urban extents Boxplot of the estimated physical detours 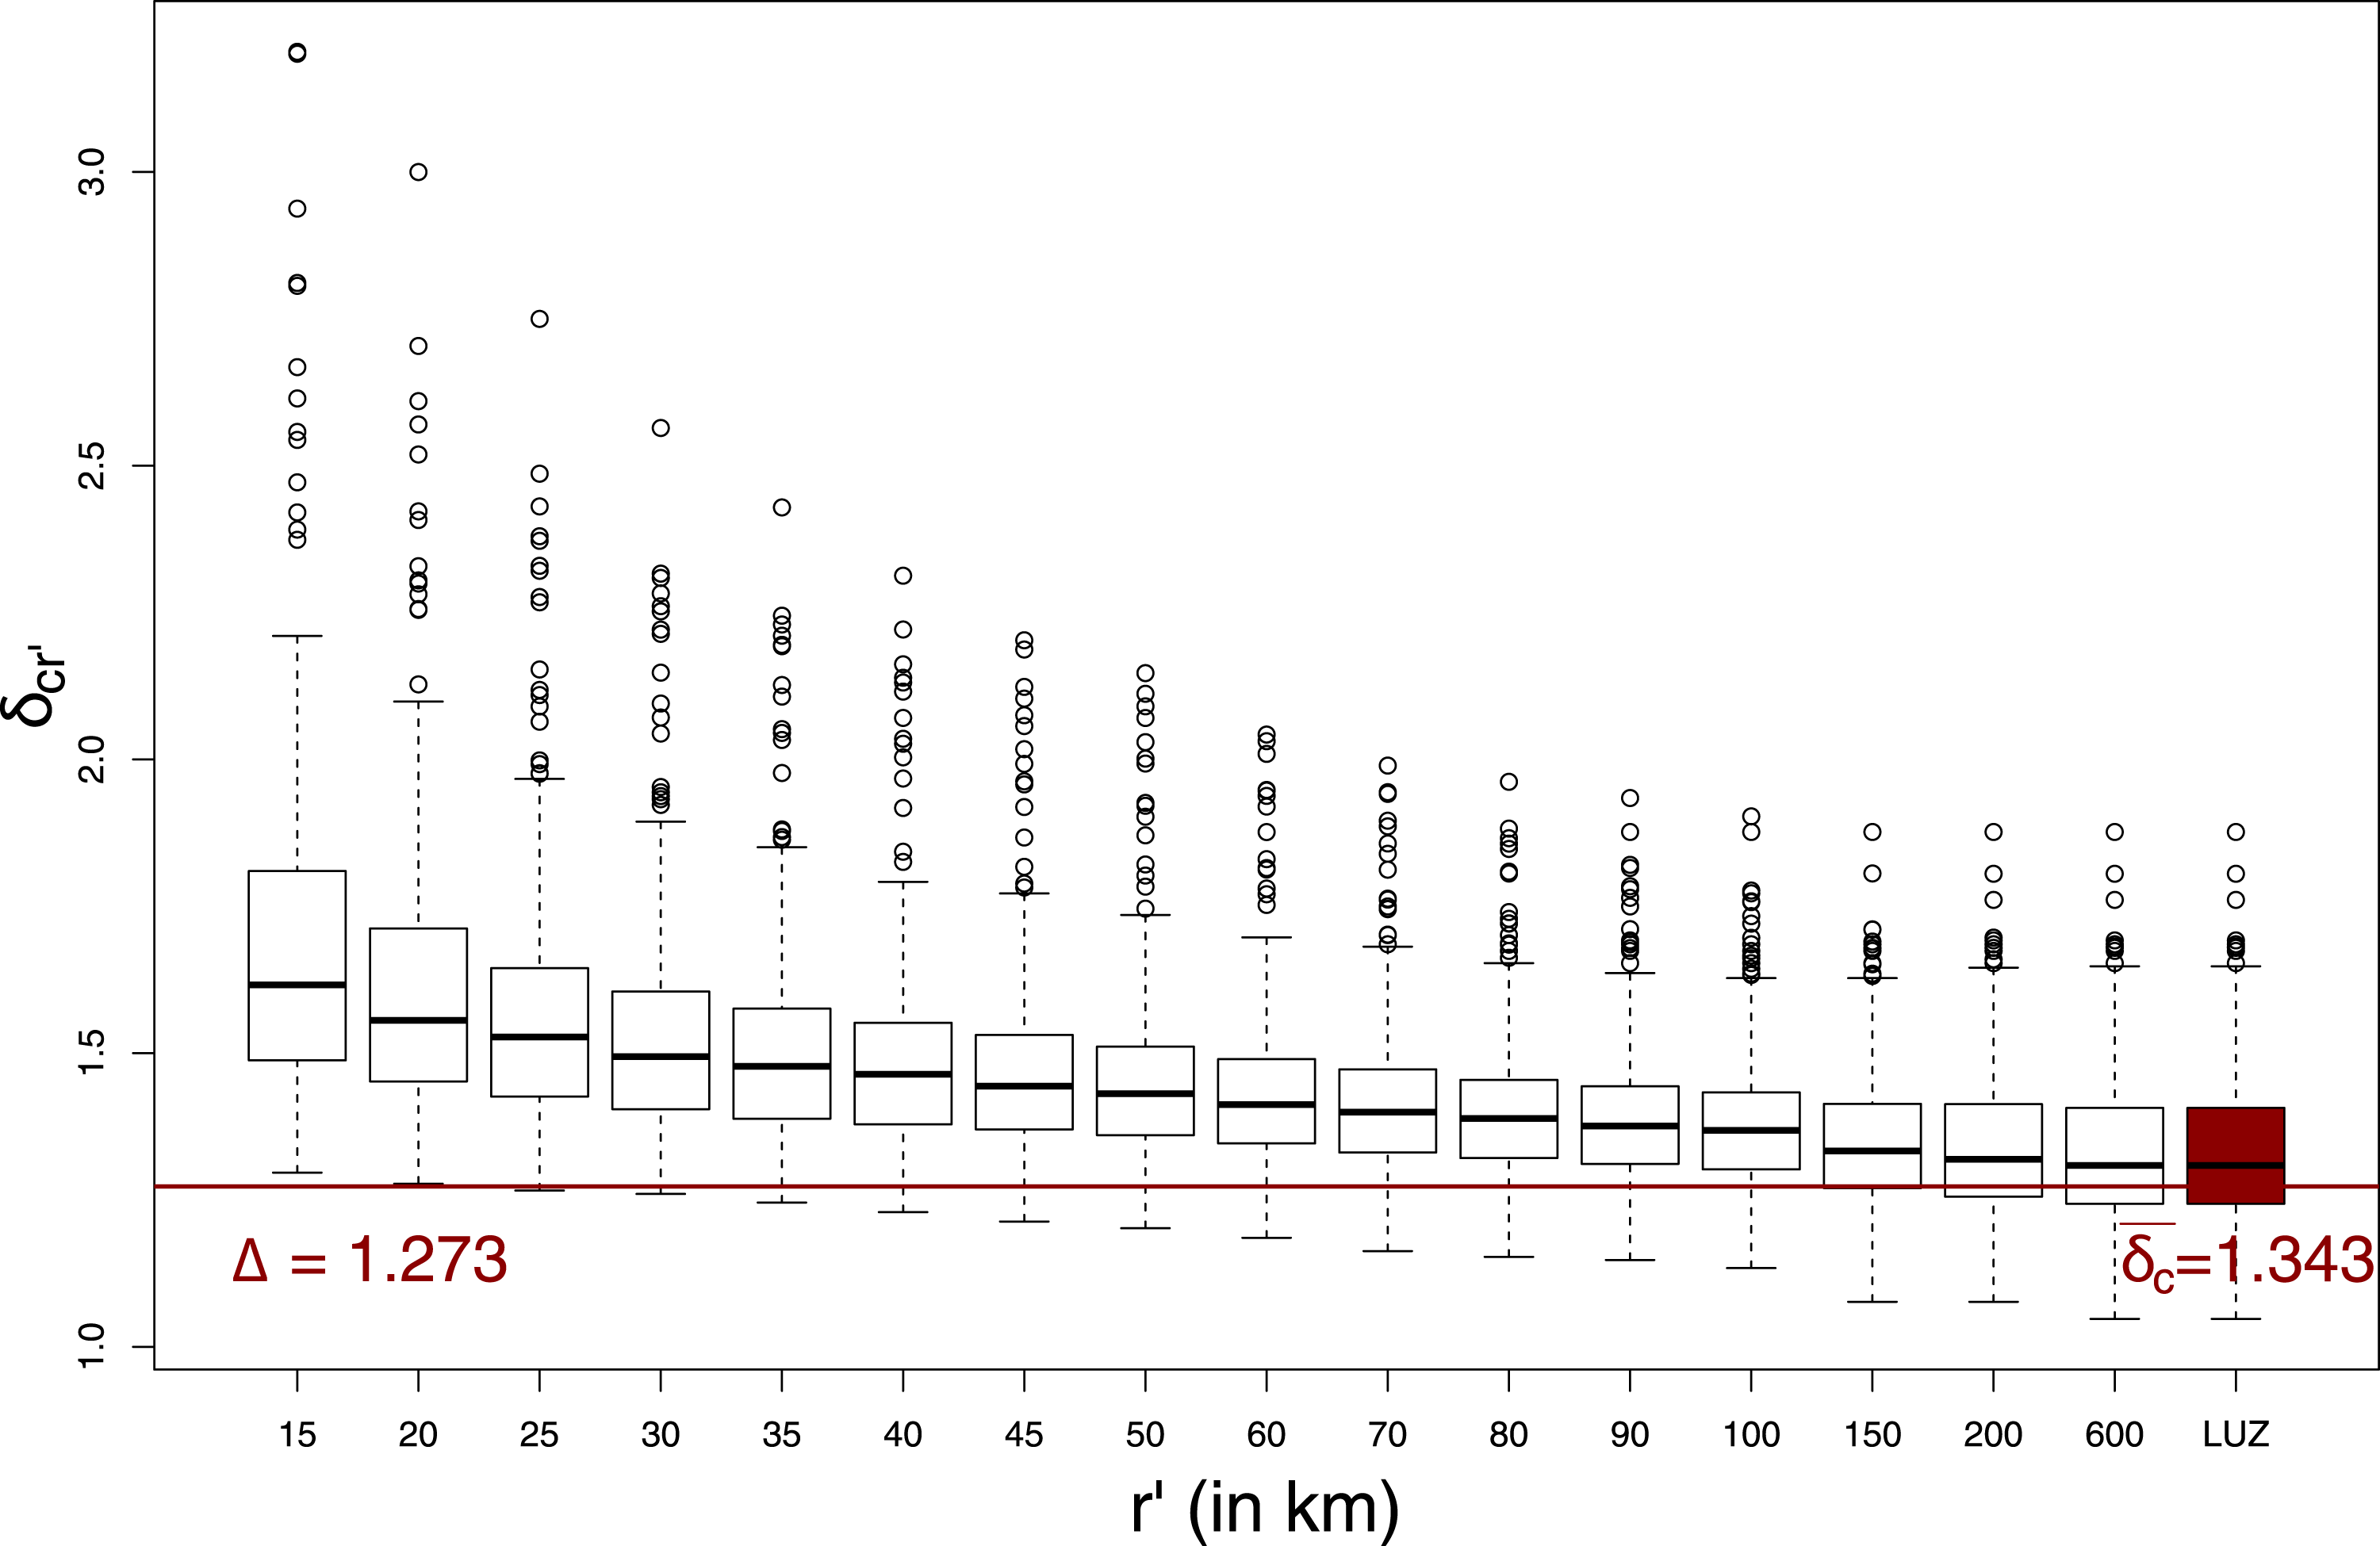
City size effects
The physical detours are now compared across cities of different sizes (population) to identify potential scaling behaviour and thus agglomeration benefits. No clear variation of the distance relation with city size can distinctly be identified from Figure 2 or 3 where colours represent population. The radial distance profiles for each city are overlapping. In Figure 5, we plot Physical detour estimate as function of the city size. Coloured by the SD of the elevation in the city.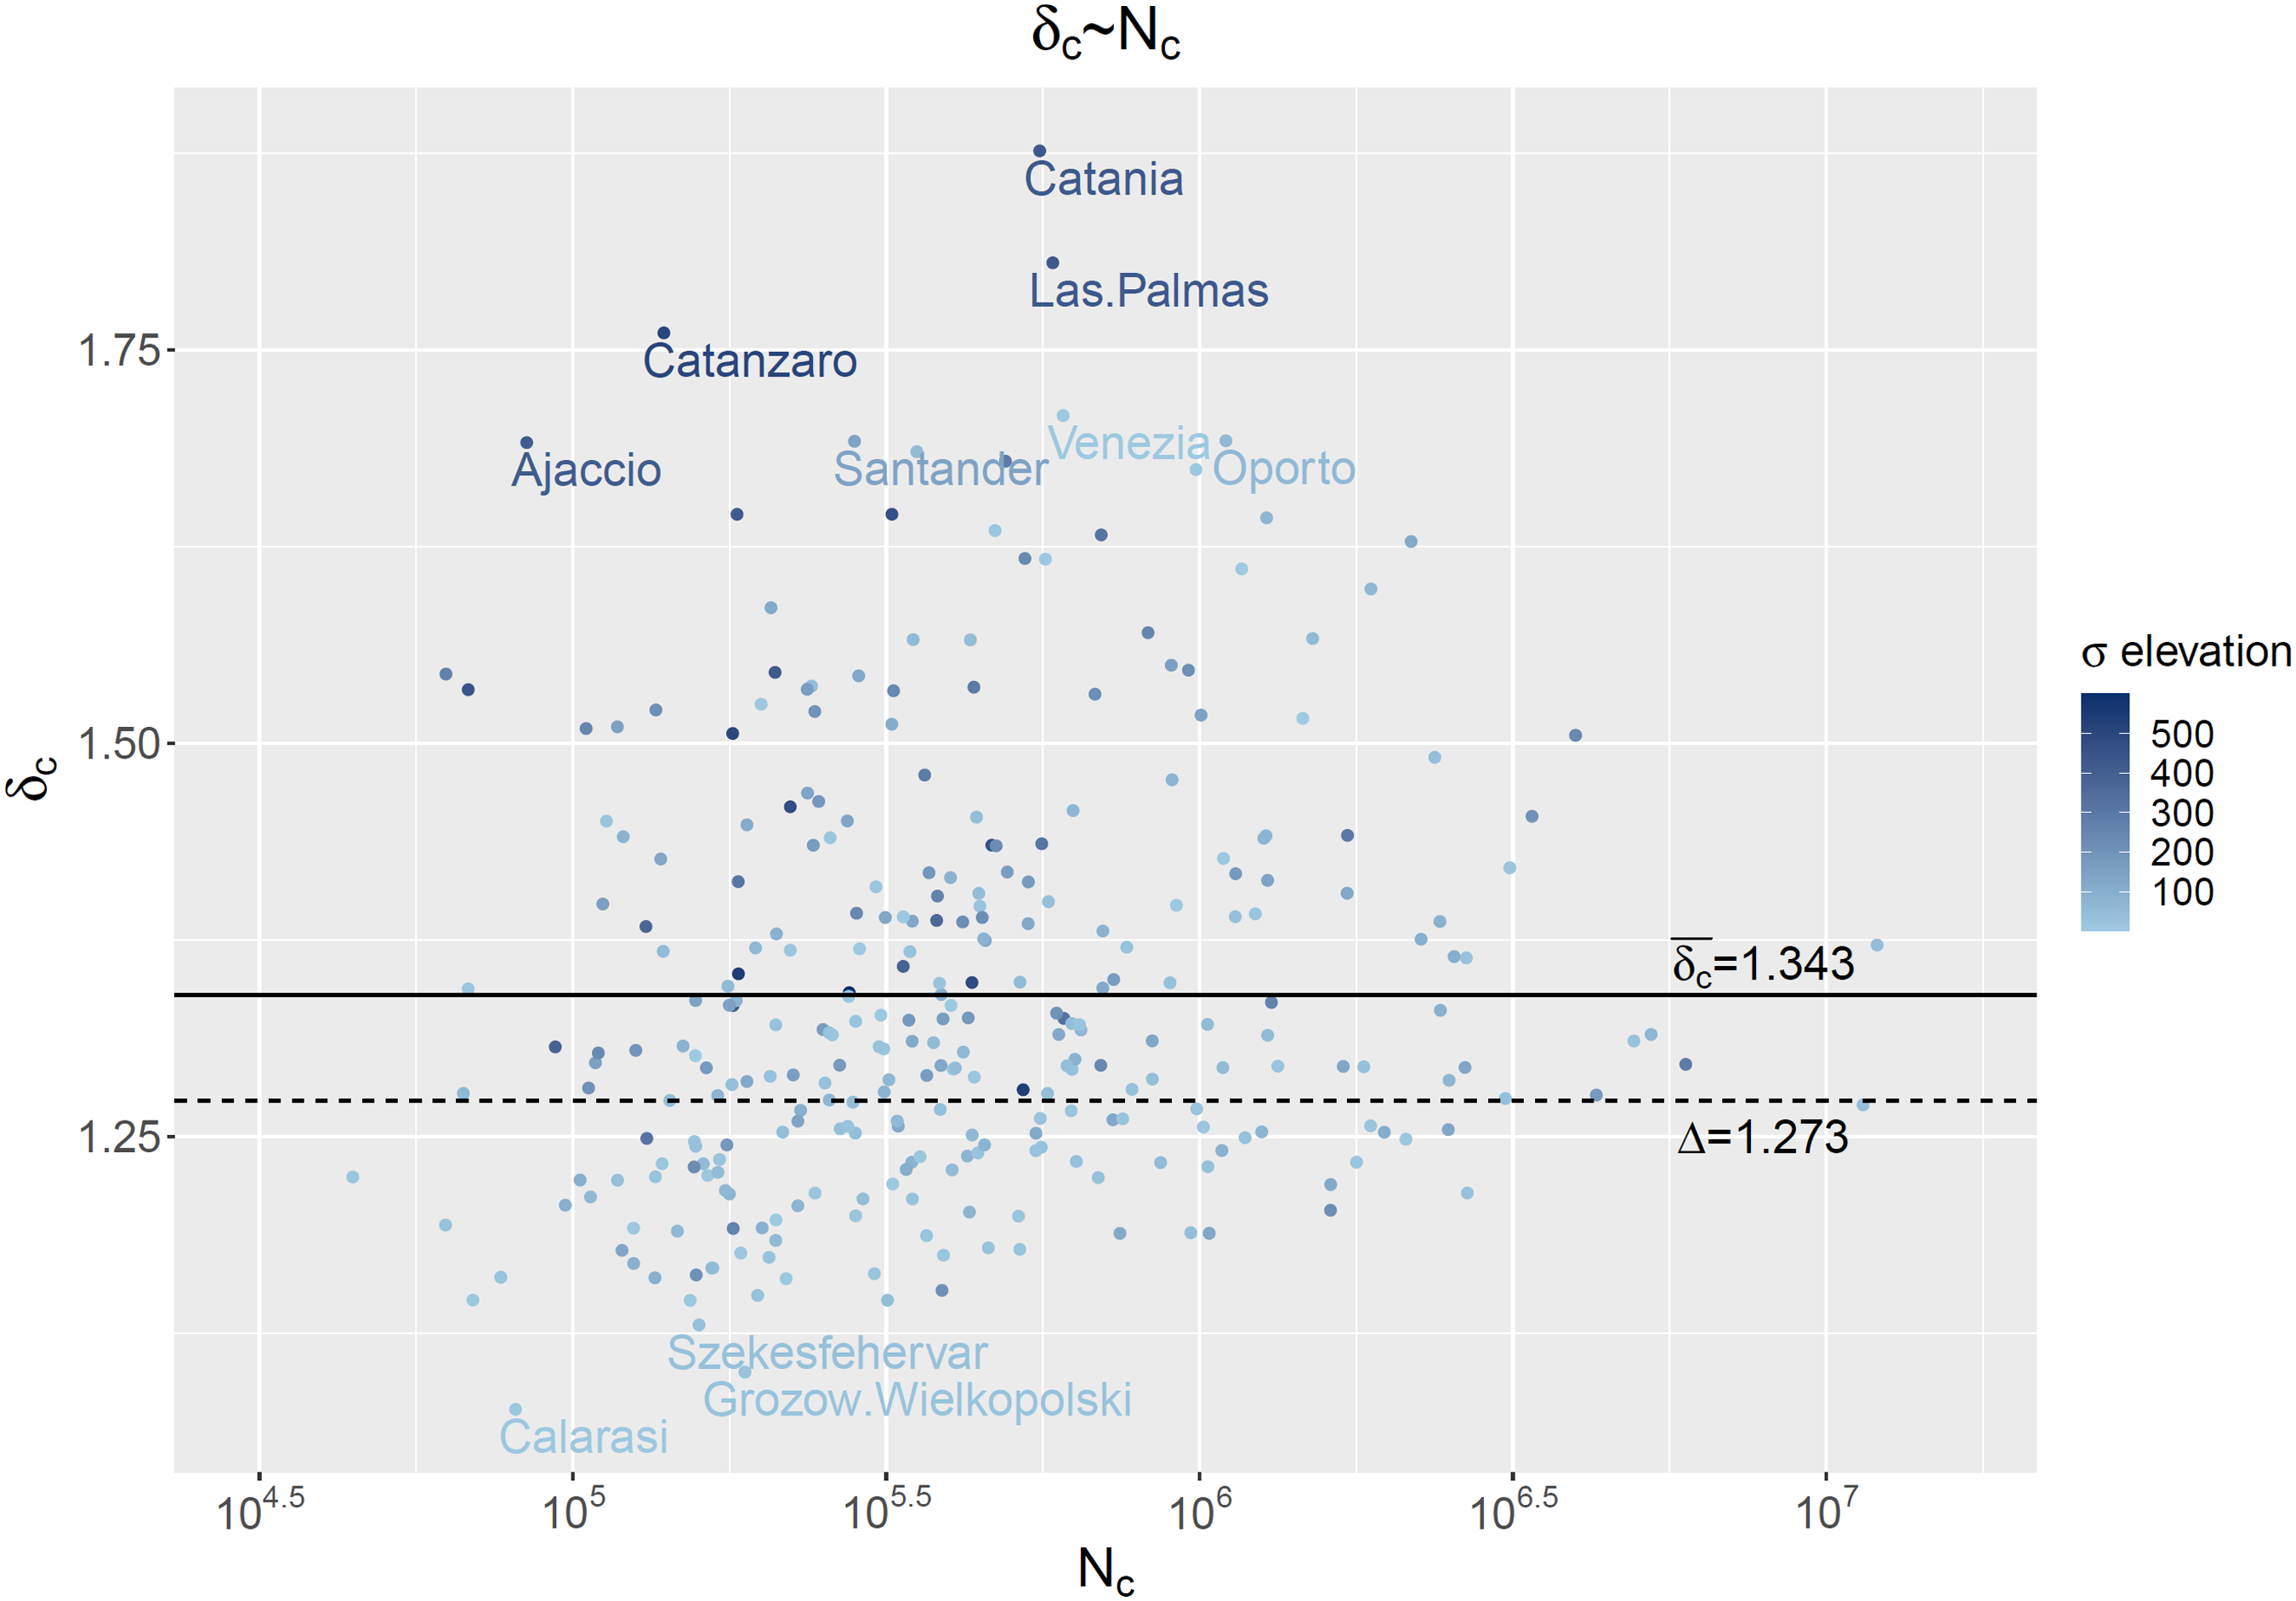
Standardised linear regression results.
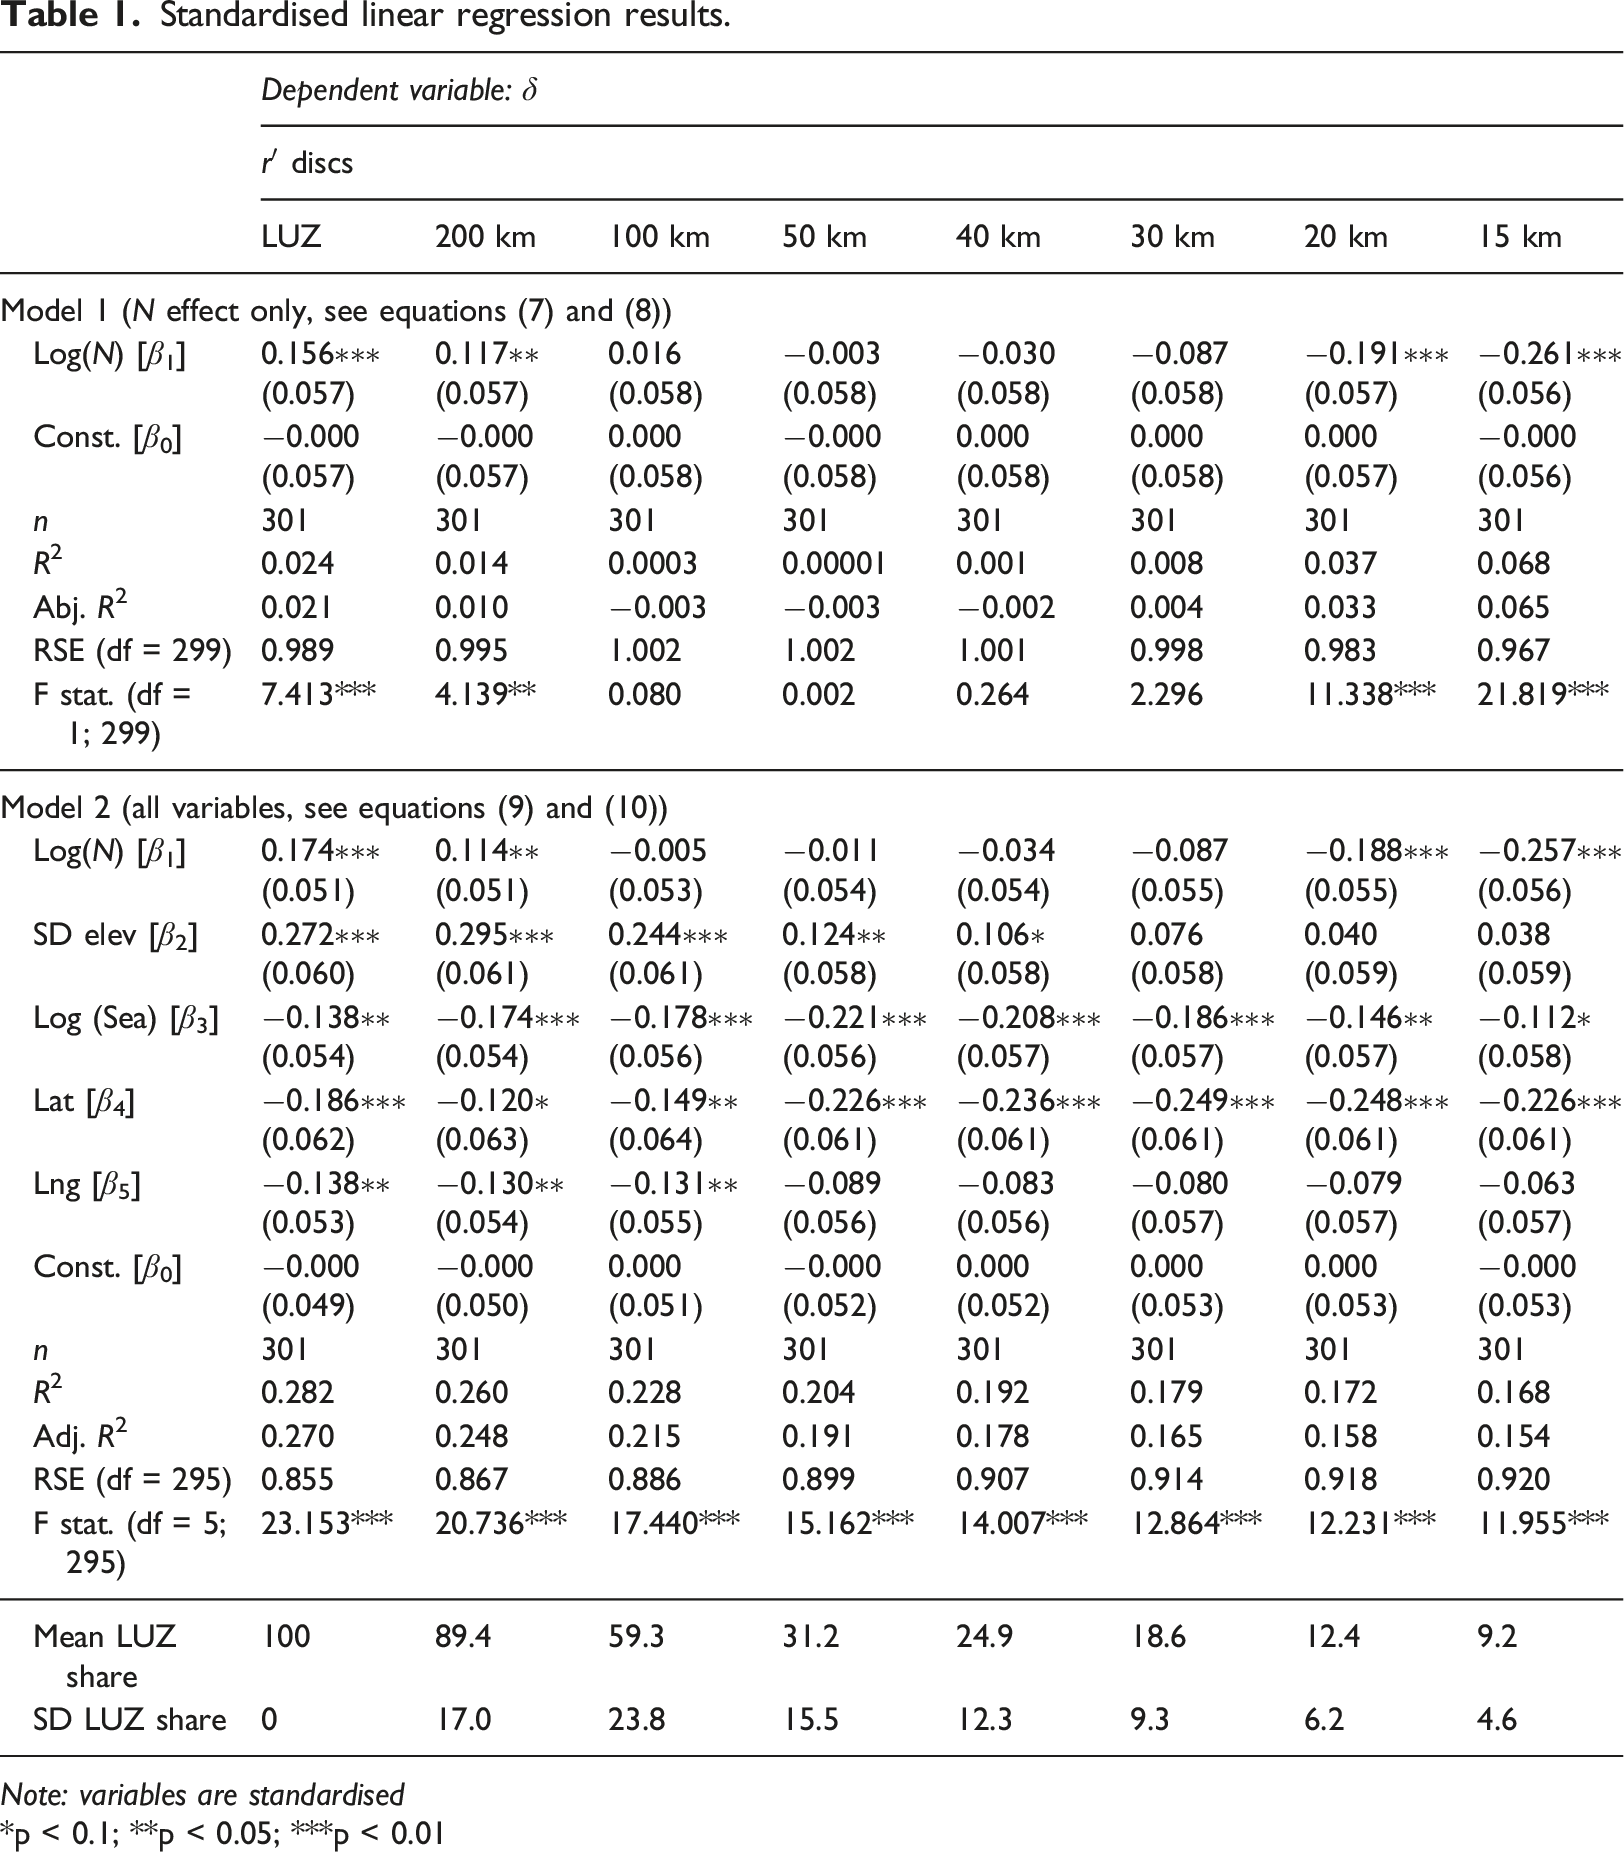
Note: variables are standardised *p < 0.1; **p < 0.05; ***p < 0.01
When considering rescaled cities, we observe an inversion of the distance–population relationship: the effect of
Exploring spatial heterogeneity and detour stability
Spatial heterogeneity of physical detours Europe
Population size alone can only explain a low share of the variability in physical detours across Europe. We thus explore this variability further based on a spatial heterogeneity map (Figure 6) and on adding potential factors in the regression. Spatial heterogeneity of the estimated physical detour per city 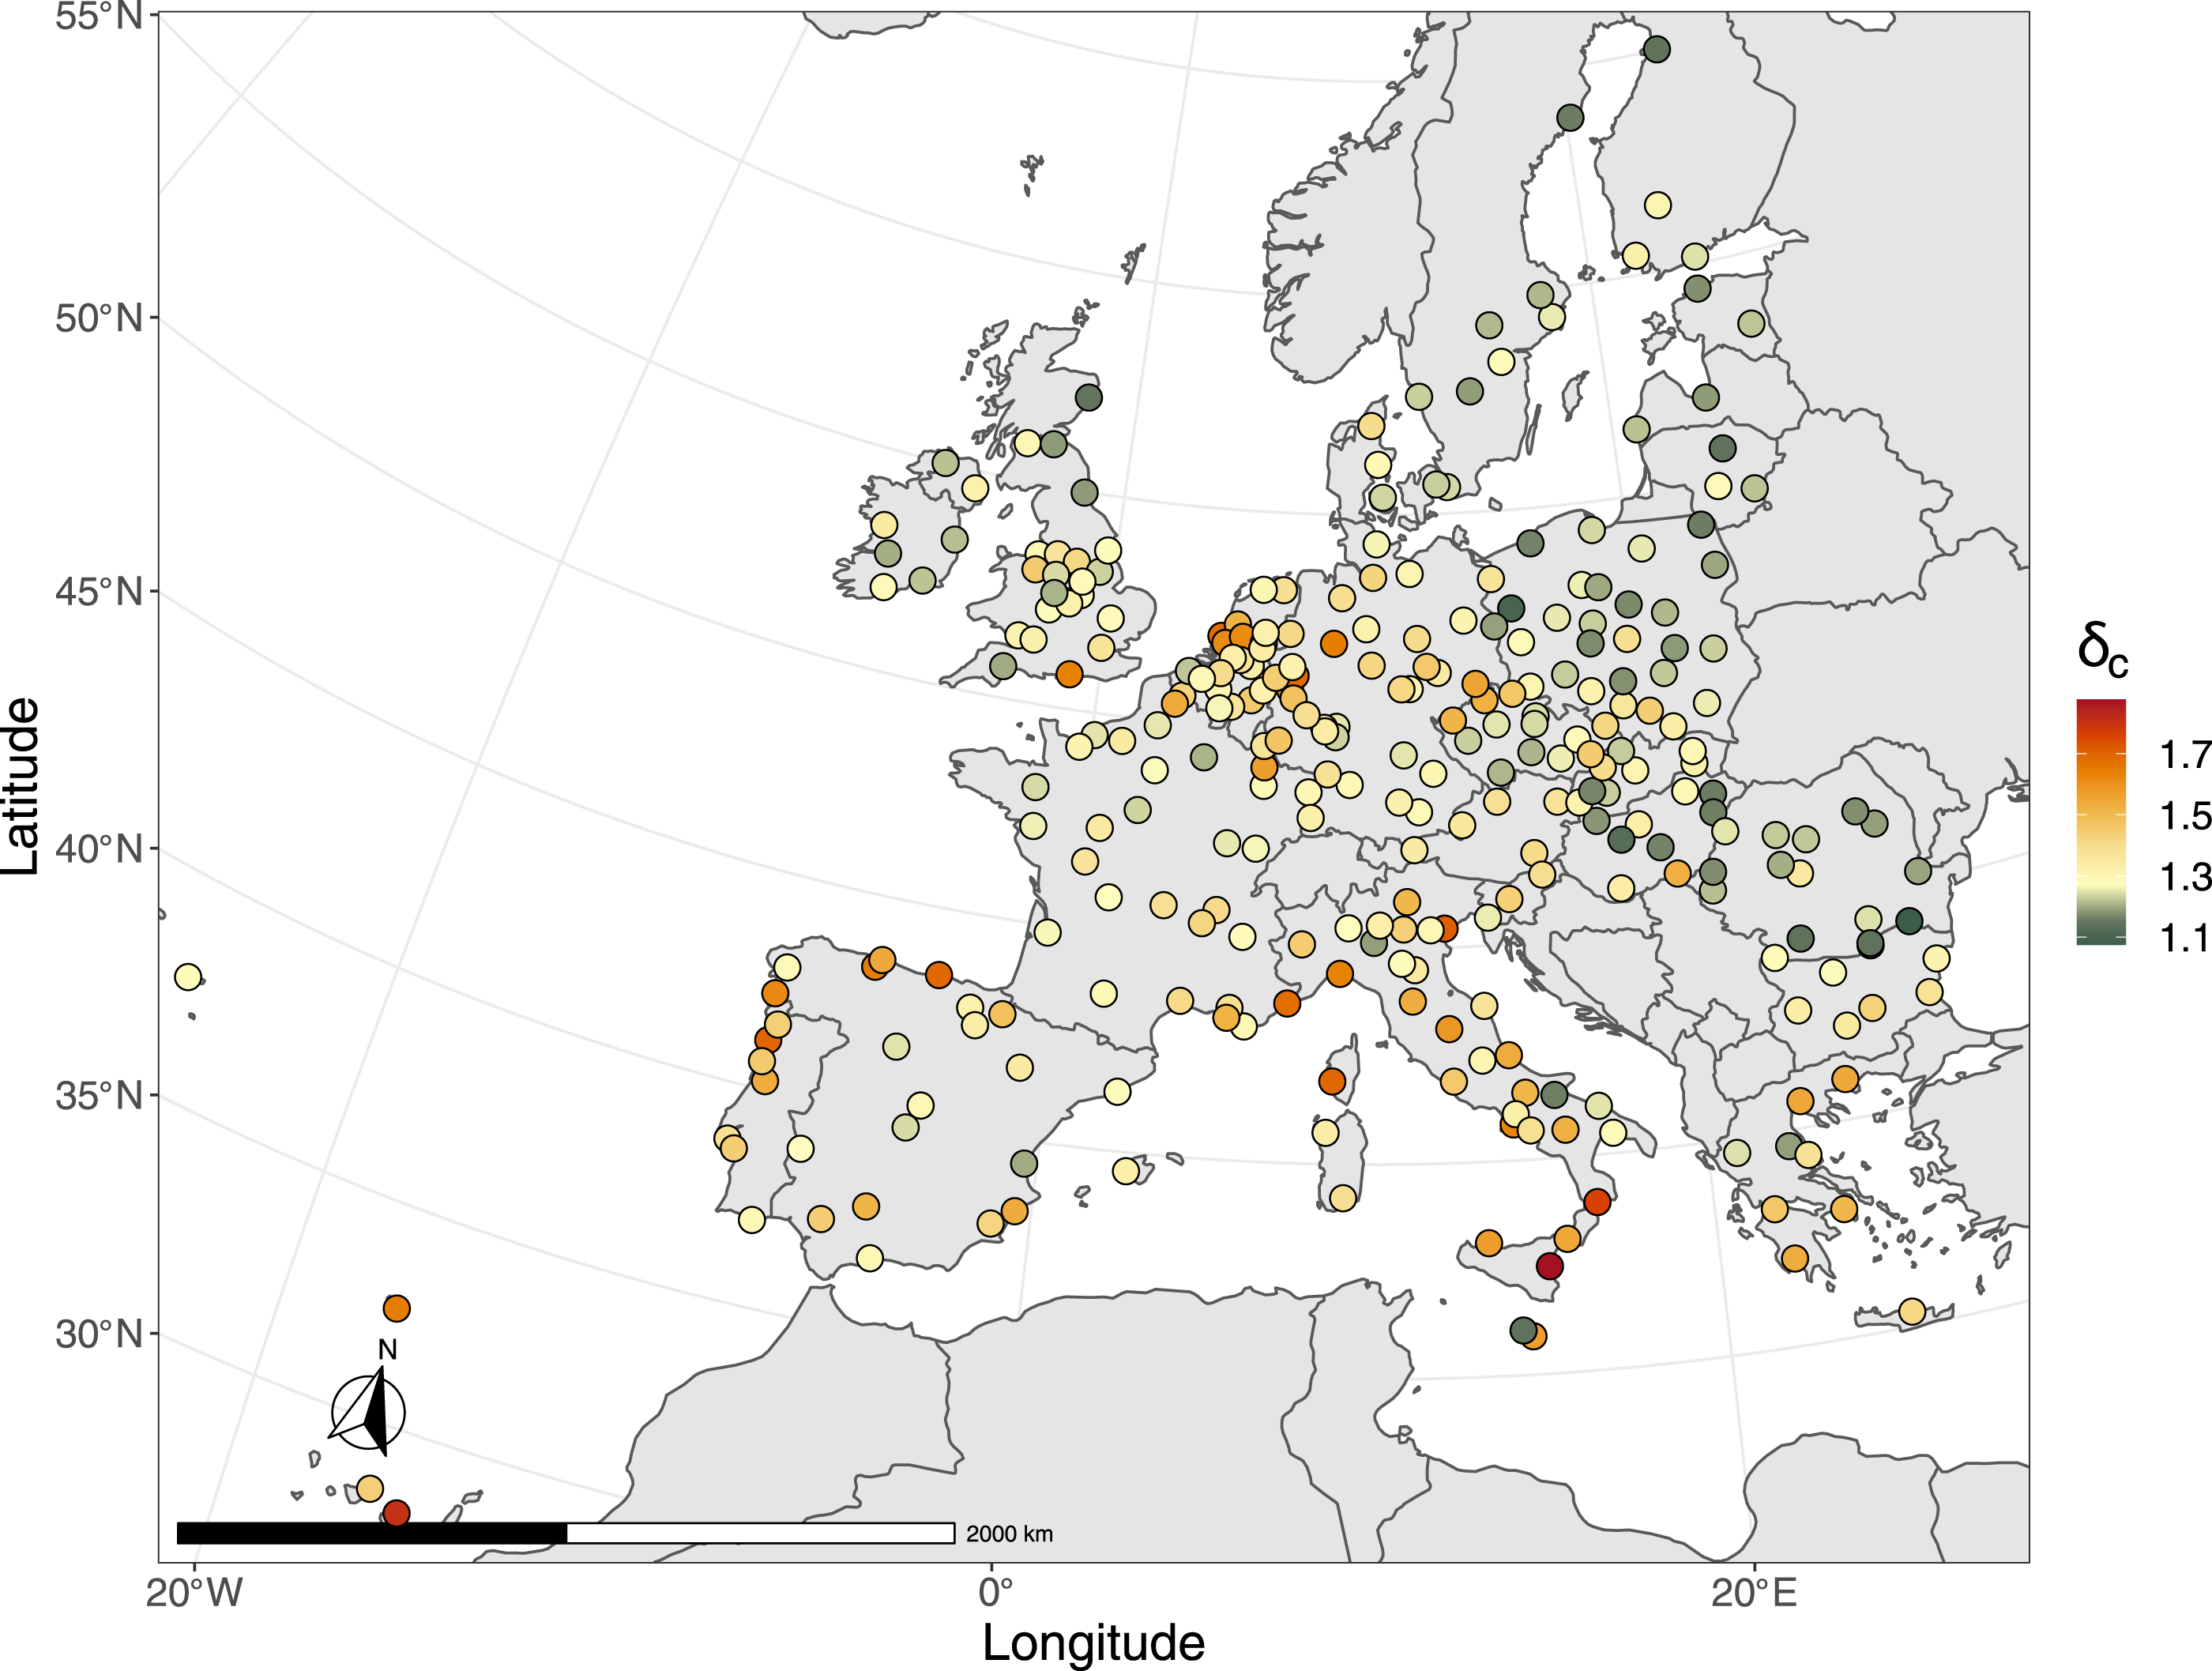
Model 2 in Table 1 shows the results of OLS estimates when other explanatory factors are added, again based on the full functional areas and on limited urban extents (from r’ = 200 to r’ = 20 km). The last two rows indicate the share of the original LUZ radius included in the rescaled disc (mean and standard deviation).
The variability explained when covariates are added is still relatively low but maximised (R2 = 0.27) when the original LUZ extent is considered. The positive population effect is reinforced at that scale (
With no surprise, elevation change holds the largest share (9.75%) of the variation as hilly regions have sparse and serpentine roads. Coastal cities have also an accessibility disadvantage. There is then a North-East/South-West differentiation, well perceptible on the map (Figure 6). Lowering detours to the North and East are significant after controlling for natural features (table S8). Latitude and longitude likely proxy several societal, planning or historical effects, networks are not arbitrary (Brun, 2005). We see that cities built or rebuilt early in the 19th century, for example, display very low physical detours (e.g. Calarasi [1.08], Giurgiu [1.15] and Braila [1.20] [RO]) or that newer towns feature car-oriented layouts with roundabouts or grid-based road systems absent in earlier settings.
We now observe the coefficients’ variation with the redefinition of cities (next columns of model 2 in Table 1).
Most importantly, we confirm the inversion of the population size coefficient when the city definition is gradually narrowed down: larger cities have a disadvantage (detour-wise) at the urban region scale, which turns into an advantage when only the organisation of their core is considered. All the estimated scaling coefficients are similar in range to those of model 1, showing the estimated effects and the inversion are robust to exogenous factors.
In addition, we see that the
The topography coefficient is first positive, increasing physical detours at the urban region scale, but then constantly decreases to become non-significant when
Comparison of routing algorithms
In this section, we perform a routing algorithm reliability check, by comparing the distances and physical detours computed from Google Maps to those obtained from Open Street Map, using OSRM (2021). Similarly, we consider the quickest path length to obtain non-peak fastest routes and distances.
For computational reasons, we create a sub-sample of the original residential points. We randomly sample 4 points within each 1 km distance ring around city centres over the entire urban region. For example, in Brussels, expanding 40 km away from its centre, we use 160 sampled points. In total for the 301 cities, we obtain a sub-sample of around 40,000 residential points used as trip origins.
First, we find that the paths computed with OSM are consistent with those obtained with Google. On average, OSM trips are 2.04% shorter, but the relationship is linear and strong, with a proportionality of 0.971 (OLS without constant, see supplementary material table S9, figures S4 and S5). Given that the Google algorithm accounts for some average traffic, it is not surprising to find a slightly lower level.
Second, we regress for each city OSM road network distances against Euclidean distances to obtain radial physical detours, which we compare to those computed with Google.
As expected from the shorter distances, the physical detours are also smaller: the average across cities with OSM is 1.311 (±1 st Dev. of 0.105), which is only 1.85% difference to the 1.343 obtained with Google. The proportionality between both computations is strong (Figure 7). Plot between radial physical detours obtained with the two routing algorithms. The red line shows the overall fit (slope of 0.973).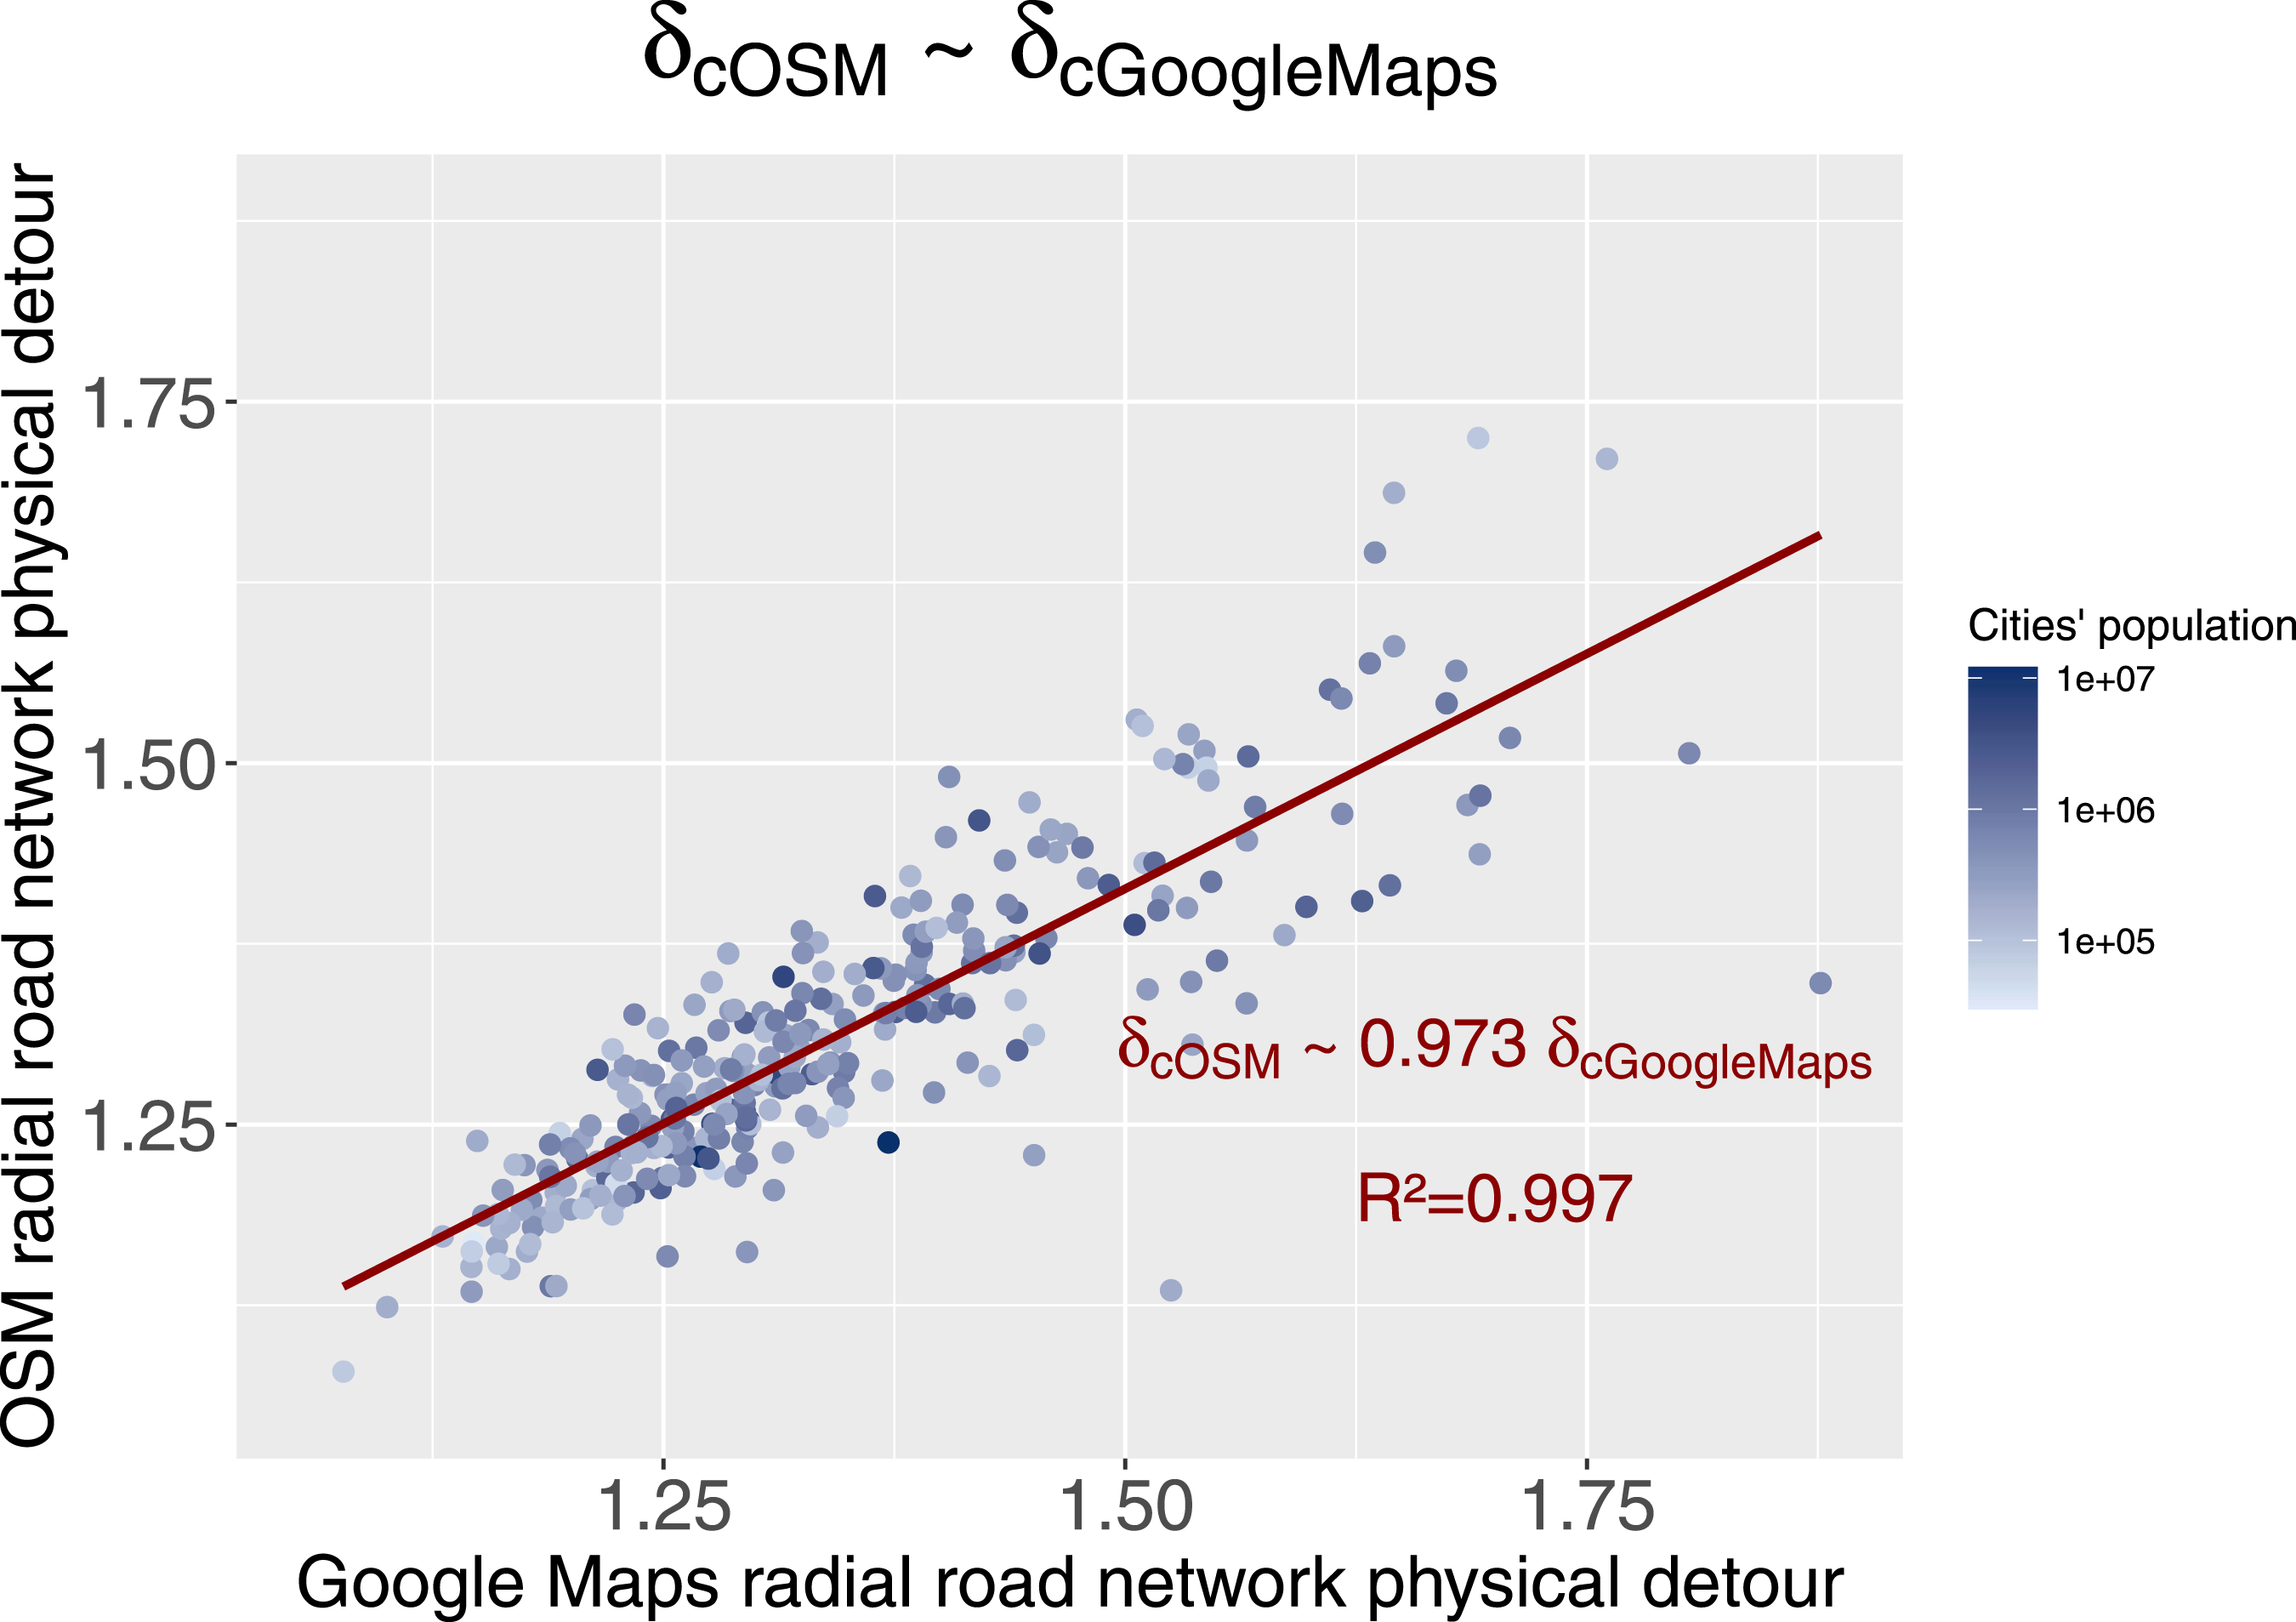
On Figure S5, we further show that the detour underestimation of OSM (overestimation of Google) tends to zero when the distance to the centre increases, suggesting that when functional regions are considered, the difference between algorithms reduces. One could thus be more careful when analysing only core cities, although the differences remain small.
Third, we repeat with OSM detours the linear regression against the logarithm of city population (Model 1, equation (7)). The coefficient is insignificant, while it was small with Google. After controlling for the other effects as of Model 2 (equation 9), the effect of population is significant although remaining very small (
Overall, this comparison against OSM suggests that distances and detours are consistent across data and algorithms but further challenges the existence of the scaling of city size on physical detours. This in turn abounds with the need, demonstrated before, to delineate cities similarly in any scaling analysis.
Non-radial road network distances
Considering that the largest urban systems often show a polycentric organisation (e.g. Louf and Barthelemy 2013), we perform an additional exploratory analysis using non-radial trips between internal sub-centres.
In practise, without precise information on job location (destinations) for such a large sample, we identify clusters of high population density. We follow the methods developed by Riguelle et al. (2007) to define sub-centres. It relies on LISA (Anselin, 1995) and relates to the local spatial context, not city size. It does not require exogenously defined density thresholds, which could also depend on size.
We use the same populated cells as in the radial analysis and retain only positive clusters at a 0.001 significance level. Each cluster also needs to be at least 2.5 km distant from another, otherwise they are merged. A total of 237 cities have at least 2 clusters and are considered for the non-radial analysis. We select randomly one residential point by cluster and use them both as origins and destinations. After computing all the possible pairwise combinations with Google and OSM, we obtain around 20,000 non-radial road network distances.
Conversely to radial detours, it is difficult to form a theoretical expectation for non-radial physical detours without a proper formalised theory on where sub-centres emerge within polycentric cities. Empirically, Figure 8 shows that the relation between the radial and the non-radial physical detours (Google-based) is positive, with a proportionality of 1.124 (OLS without constant, see supplementary tables S10 and S11). The non-radial physical detours tend to be lower in cities for which the number of computed non-radial trips is high (dark blue), that is, when there are more clusters. On average for all cities, we find a non-radial detour of 1.516, which is 13.72% larger than radial ones (+0.176). The standard deviation is 0.229, which is twice as much as in the radial case. Note that with OSM data, the non-radial physical detours are similar in variations (±1 st Dev. of 0.212) for a slightly lower average of 1.467 (as expected from above). Plot between cities’ non-radial and radial physical detour ratios. The red line shows the overall fit (slope of 1.124).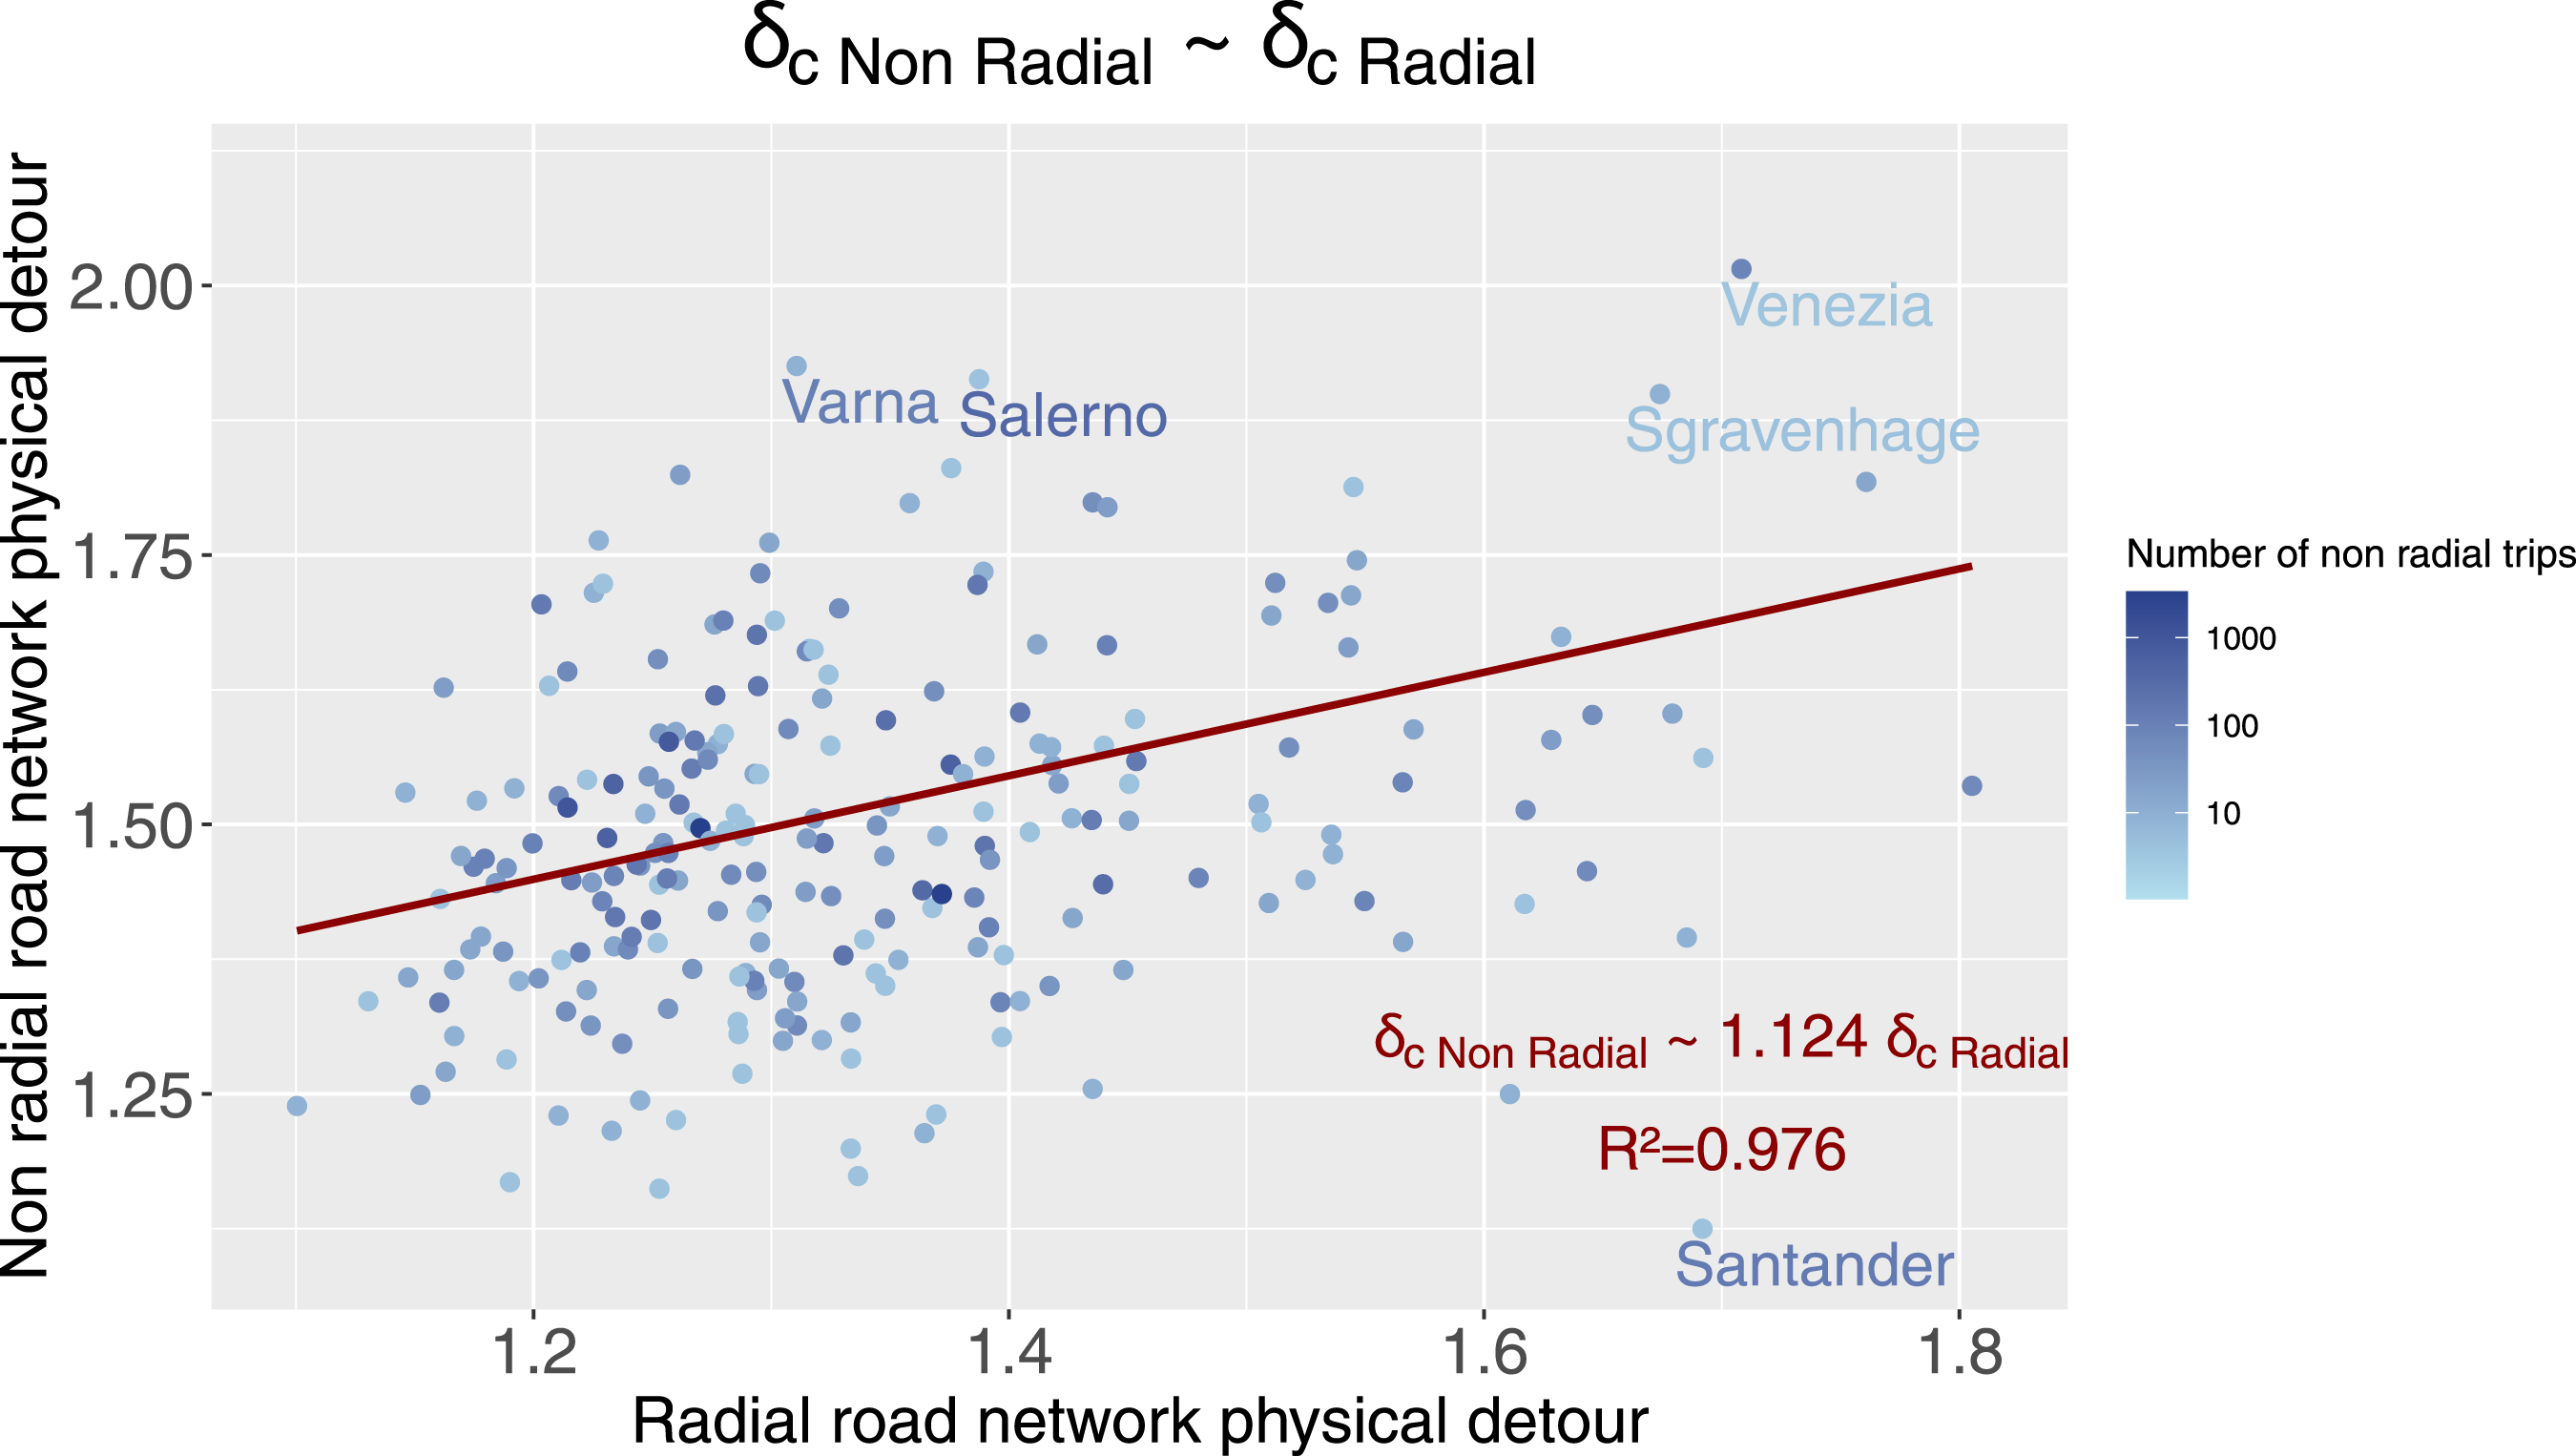
From these average values, radial physical detours can be seen as minimal detours. It is actually surprising to find non-radial detours to be higher because polycentricity is in essence a reorganisation of cities that should counteract the negative effect of monocentricity when cities grow. As polycentricity does not lead to reduced physical detours across sub-centres, our result suggests that sub-centres rather act as many monocentric structures, smaller in size, within the city. Polycentricity is thus rather a question of scale of analysis and city delineation within which radial proximity remains consistent.
After trying to explain the variation of non-radial physical detours across Europe, we find little significant factors (Table S11): only the latitude and the distance to the sea remain significant, leaving much of the unexplained to local network or urbanisation particularities.
Importantly however, we find that population size is no longer a significant effect even when other factors are controlled for (see Models 1 and 2 estimates for non-radial trips in Table S11). It is an important finding suggesting that, if there is a scaling for road networks, it is only for radial trips. Urban growth generates a problem of accessibility to the core, not a general accessibility problem. When a city becomes larger, polycentricity comes as a rescue by bringing new sub-centralities, rather than facilitating any trip across the city.
Conclusion
Our systematic investigation of road networks across Europe, and particularly the radial physical detours, is neither a trivial nor a purely technical question. As we have demonstrated, road network is an important aspect of urban form with great variations across space and city size. It is too often ignored in transport research while it is a fundamental physical constraint to individual travel and to urbanisation patterns.
We have offered here a first global empirical understanding of road network morphologies across 301 European cities with a database of 303,000 trips generated with Google Maps. Consistency was analysed against a sub-sample of 40,000 trips with OSM and 20,000 non-radial trips.
We have clearly established the linear relationship between the network distance and the Euclidean distance to the centre. The average physical detour implied by the road network is 1.343, which is close, but definitely above the expected detour we would see if urban regions were entirely covered by Manhattan networks. The same conclusion is drawn from OSM, with a slightly lower estimate of 1.311. The linearity and these coefficients are important to urban and transport research as they simplify distances in models: one would not need to resort to complex road network computations and databases but use Euclidean distances plus a pre-factor as a good proxy.
Yet, there are important variations depending on cities’ definitions. We have compared cities of different sizes and ‘cut’ them at comparable extents (using the homothetic scaling of Lemoy and Caruso (2020)), showing that urban cores bear more physical detours on average than entire functional urban regions (LUZs).
We have further enquired whether agglomeration effects can make some cities more ‘efficient’ in infrastructural terms. We discovered a small but significant scaling with population size: at the urban region scale, increasing city size seems to imply a dis-economy of scale, especially when other significant geographical factors (latitude, longitude, elevation change and proximity to coast) are controlled for.
Most importantly, however, we have shown that the scaling depends largely, in intensity and direction, upon cities’ spatial definition. When cities’ central part only is considered, the disadvantage of large cities becomes an advantage: core areas of larger cities have smaller radial physical detours. This confirms the results of Cottineau et al. (2017) on total road length: bigger cities are less efficient when including their functional peripheries but less consumptive of infrastructure per capita when considering only their central part. Hence, we rejoin other authors (e.g. Louf and Barthelemy, 2014b; Cottineau et al., 2017) to remind that urban scaling research needs to address the issue of defining cities properly before suggesting whether further agglomeration is desirable. Our radial approach proved to be effective to compare cities of different sizes and discuss key properties in terms of urban structure. Being far away or close to the centre is very central to both residents and planners, and how much of the urban periphery is included is important for policy-making. Establishing the formal link with fractals (Batty and Longley, 1994; Chen, 2013), especially for radial measures on the road network (e.g. Thomas and Frankhauser, 2013), seems opportune at this stage. In general, one should explicitly consider the analysis window (its distance to the centre, in addition to its shape and size as in Thomas et al., 2012) in the measure of fractal dimensions.
Since our reliance on radial trips could be considered a limitation, we conducted a series of tests after identifying residential clusters from an LISA analysis within each city and computing non-radial trips across these clusters. The related physical detours were found to be larger, more variable and unrelated to city size. If polycentricity emerges when cities become larger, our results suggest that efficiency gains would come from radial proximity to sub-centres at a lower scale, rather than from trips all around urban regions.
Finally, our trip potentials are interesting because they relate explicitly to the urban structure and population distribution without the need to consider the difficult question of the endogeneity of travel behaviour and location decisions. Yet, in the future, we would like to compare our findings to actual trips and study travel times and congestion effects similarly along population size and gradual radial city delineations.
Supplemental Material
Supplemental Material - Road network distances and detours in Europe: Radial profiles and city size effects
Supplemental Material for Road network distances and detours in Europe: Radial profiles and city size effects by Estelle Mennicken, Geoffrey Caruso and Rémi Lemoy in Environment and Planning B: Urban Analytics and City Science.
Footnotes
Acknowledgements
The authors want to thank Cyrille Médard de Chardon for the development of the routing application Friendly Batch Routing and his technical help. They are also grateful to Philippe Gerber and Alex Hagen-Zanker for enriching discussions. Estelle Mennicken acknowledges funding from LISER. Geoffrey Caruso acknowledges funding from the FNR SCALE-IT-UP project (grant number C17/SR/11693518) and from FNR UrbanForms (INTER/Mobility/2020/14519030). The authors confirm that there are no known conflicts of interest associated with this publication.
Declaration of conflicting interests
The authors declared no potential conflicts of interest with respect to the research, authorship and/or publication of this article.
Funding
The authors disclosed receipt of the following financial support for the research, authorship and/or publication of this article: This work was supported by the Fonds National de la Recherche Luxembourg; C17/SR/11693518 and INTER/Mobility/2020/14519030.
Supplemental Material
Supplemental material for this article is available online.
References
Supplementary Material
Please find the following supplemental material available below.
For Open Access articles published under a Creative Commons License, all supplemental material carries the same license as the article it is associated with.
For non-Open Access articles published, all supplemental material carries a non-exclusive license, and permission requests for re-use of supplemental material or any part of supplemental material shall be sent directly to the copyright owner as specified in the copyright notice associated with the article.