
Abstract
We apply a percolation method to South Korea’s road networks and identify major urban clusters. The results show that Korea has developed a highly mono-centric spatial structure, in which the Seoul Metropolitan Area expands to northern Chungnam, far beyond the limits conventionally assumed. A percolation threshold of 1080 m is critical in delineating Korea’s functional regions, and the results at this threshold show great similarity to flow-based maps. Similar model outputs support the percolation approach as an alternative to conventional flow-based methods. The similarity is higher for larger clusters, where the supply of road infrastructure better meets demand thanks to size-biased public resource allocation. Also, the similarity between model outputs tends to increase with a time lag, since road network configurations take time to catch up with the demand revealed in traffic flows. These findings speak for the need for increased connectivity in Korea’s smaller cities.
Keywords
JEL codes
O18, O20, R12, R42, R58
Introduction
Urban and regional analysis is often conducted on administrative boundaries, but administrative regions may not effectively reflect existing functional complementarity (Dawkins, 2003; Dijkstra et al., 2021; Harrison and Hoyler, 2015). Identifying functional regions matters in dealing with the gap between economic and regulatory boundaries and thus in improving administrative efficiency (Duranton, 2021). However, delineating functional boundaries is not straightforward, since they are dynamic and evolve over time (Brenner, 2003; Storper, 2014).
A conventional approach to estimating the spatial boundaries of functional regions relies on statistical or geo-computational methods using commuting or trade flow data (e.g., Bosker et al., 2021; Brown and Hincks, 2008; Masser and Scheurwater, 1980; Mitchell and Watts, 2010). Although commuting and trade flows convey a good deal of information on cross-city linkage and interdependency, the limited availability of such flow data reduces the applicability of the flow-based approach (Dingel et al., 2021). Dependence on administrative boundaries is another issue, since flow data itself is collected based on political jurisdictions. Finally, flow-based estimation often presumes the total number of functional regions or their central cities before analysis. With these presumptions positing gradualism, however, we may be inclined to neglect those changes in spatial structure that go beyond preexisting configurations, such as new-town development and the evolution of city regions (e.g., Yeh and Chen, 2020).
Fine-resolution raster data, such as nightlight satellite images or population grids, is often used as an alternative to conventional flow data (e.g., Cao et al., 2020; Ch et al., 2021; Dingel et al., 2021; Duranton, 2021; Henderson et al., 2012; Nam and Reilly, 2013). These data sets are widely available for the entire globe, and a morphology-based urban delineation using them reduces the need for strong presumptions regarding clustering patterns. Despite its merit, the sole focus of a morphological approach on physical forms weakens the rationale to treat the identified clusters as functional regions built on connectivity. Geospatial big data sources—such as those on points of interest, taxi/transit services, social media usage, smart-card transactions, and cellular-phone signals—have also been increasingly tested as an alternative to conventional survey-based flow data (e.g., Cai et al., 2017; Houssou et al., 2019; Niu and Silva, 2021; Ratti et al., 2010; Sulis et al., 2018). However, the applicability of such data is bounded by data availability in both spatial and temporal dimensions, and approximating spatial interdependency from big data may also be questioned as to its validity and robustness.
In sum, the limitations of existing methods demand an alternative approach. In recognition of this need, we apply a percolation approach (Arcaute et al., 2016) to estimating functional regions in South Korea based on road networks. On the methodological front, South Korea is chosen as a case example due to the availability of multiple reference maps for comparison. The Korean government has made various attempts to change the existing mono-centric spatial structure in power and resource allocation, which is biased toward the Capital Region, and has widely adopted the concept of functional regions to establish a model for competitive local regions (Government of the Republic of Korea, 2001; 2019). Most of the estimated Korean functional regions are based on flow data, and the comparison of our results with these regions is crucial in evaluating the performance of the percolation model. In addition, the Korean context, where various regional policies have been tested at multiple levels, can also help us demonstrate a set of policy implications that can be drawn from reasonably delineated functional boundaries. Finally, our study of the Korean case can also enrich the empirical literature, as existing percolation-based urban analysis leans toward the cases of the West and China (Arcaute et al., 2016; Huynh et al., 2018; Long et al., 2016).
Empirical approaches to delineating functional regions
Conventional flow datasets used to identify functional regions include commuting (Brown and Holmes, 1971; Duranton, 2015, 2021; Farmer and Fotheringham, 2011; Masser and Scheurwater, 1980; Mitchell and Watts, 2010), migration (Brown and Hincks, 2008; Masser and Scheurwater, 1980), and travel flows (Kwon and Seo, 2018). These datasets are often built on large scale sample surveys (Mu and Yeh, 2020), and flow-based approaches using them are subject to a few key limitations in application. One limitation is high data requirements and limited data availability. Reliable inter-city flow data and other complementary sub-national datasets do not exist in many parts of the developing world (Dingel et al., 2021). The dependence of estimated results on administrative boundaries also limits the applicability of the flow-based approach. Flow data itself is collected on political jurisdictions and is often released to the public after some degrees of aggregation (Mitchell and Watts, 2010). The unit of analysis is thus constrained by the units used for the original surveys or aggregated data, which significantly affects estimation results. Finally, too strong a condition presumed for flow-based estimation restricts the approach. Conventionally, flow-based methods presume the total number of functional regions or their central cities before analysis, since the absence of the presumption would make flow analysis for all possible origin-destination pairs an extremely computation-intensive task. This presumption of positing gradualism in spatial structure—that is, presuming that the number of functional regions is stable over time—may incur a substantial cost in estimated outcomes by overlooking the possibility of more radical changes in urban systems.
In recognition of these limitations, more recent studies have tested alternative geospatial big data sources, such as point-of-interest coordinates (Gao et al., 2017; Niu and Silva, 2021), taxi/transit service usage (Houssou et al., 2019; Wu et al., 2019), socio-media check-in (Cai et al., 2017; Jia et al., 2019; Poorthuis, 2017), smart-card transactions (Sulis et al., 2018; Zhong et al., 2014), and cellular-phone signals (Chen et al., 2020; Ratti et al., 2010). These alternatives may help reduce the limitations inherent in conventional survey-based flow data. However, they at best offer only approximate information on cross-regional interdependency, since they are not collected for that particular purpose. Also, the compiled data of this sort may not be available for the place and time needed for a particular study. Even when the data of interest is available, access to it is often strictly controlled due to privacy concerns (Smith et al., 2012).
Many studies taking a morphological approach use fine-resolution raster data, such as nightlight satellite images and population grids (e.g., Cao et al., 2020; Ch et al., 2021; Duranton, 2021; Fan et al., 2014; Henderson et al., 2012; Li and Zhou, 2017; Liu et al., 2019; Zhou et al., 2015). These datasets, which cover the entire globe for relatively recent years, have merit in terms of their wide availability, and they help researchers avoid subjective presumptions on the number or spatial limits of major urban clusters. A raster-based morphological approach, however, primarily focuses on physical clustering patterns while largely neglecting key drivers underlying them (Batty, 2007; Nam, 2017). Simply being located in proximity may not necessarily represent functional complementarity or interdependency among multiple spatial units, and thus treating the identified clusters as functional regions lacks a rationale. In addition, this approach requires a subjective choice of threshold light-intensity or population-density values to define urban areas, and the chosen threshold can have substantial impacts on analysis results (Dijkstra et al., 2021; Henderson et al., 2021; Nam and Reilly, 2013). Nightlight intensity as a proxy for urbanization also has limited applicability in less developed countries or in smaller cities, as it is often too weak to allow researchers to distinguish urban areas (Dingel et al., 2021; Harari, 2020; Song et al., 2020). The compromised raster-data quality of the developing-country portion may be another issue. Population grids are often estimated from census data, and thus the quality of the former is constrained by that of the latter (Doxsey-Whitfield et al., 2015; Li and Nam, 2017).
In this context, a percolation approach based on road network or comparable stock data may be a more practical alternative. Arcaute et al. (2016) is a pioneering study that applies percolation logic in physics to identifying urban regions using British road network data. The primary rationale for a percolation analysis is that the density of existing road networks reflects the intensity of activity levels, such as commuting or trade flows, although a time lag may exist between them (Arcaute et al., 2016). In this sense, substituting the former for the latter in identifying functional boundaries secures some ground. Furthermore, road network data is not restricted to geographical units or scales, and is more widely available with easy access options through globe-wide collaborative open projects, such as OpenStreetMap (e.g., Boeing, 2020). 1 Accordingly, the percolation method has been since applied to other regions, such as China and the U.S. (Long, 2016; Huynh et al., 2018), as well as to an international comparison (Cao et al., 2020).
Despite the merits of the percolation approach, it is not clear how well the percolation-based delineation of functional regions approximates flow-based outputs. Can a stock-based approach produce results reasonably close to those based on a flow-based approach? So far, few studies have offered reasonable answers to these questions; this motivates our study.
Methodology
Percolation analysis of road networks
The primary data used for our percolation analysis is Korea’s national road network data, whose comparables for other countries are widely available through national official channels or open sources. In addition to such low data requirements, the percolation method has merit in that it does not require a presumption about the number of clusters or their spatial limits.
The first step of our analysis is to create an undirected graph of Korea’s road networks. The graph is based on point-and-line data, which marks the location of highway junctions and intersections (nodes) and offers information on connectivity between nodes (links). A key bridging step between the original data and the graph is to construct an adjacency matrix that identifies each pair of neighboring nodes and determines the length of the links defined by each pair. Once the undirected graph is prepared, a thresholding process is applied to it. As is done in Long (2016) and Masucci et al. (2015), the percolation algorithm is illustrated in a toy example (Figure 1). The procedure begins with a reasonably large threshold distance ( Simplified illustration of the percolation method. Note: refers to the length of the link. Source: Created by the authors.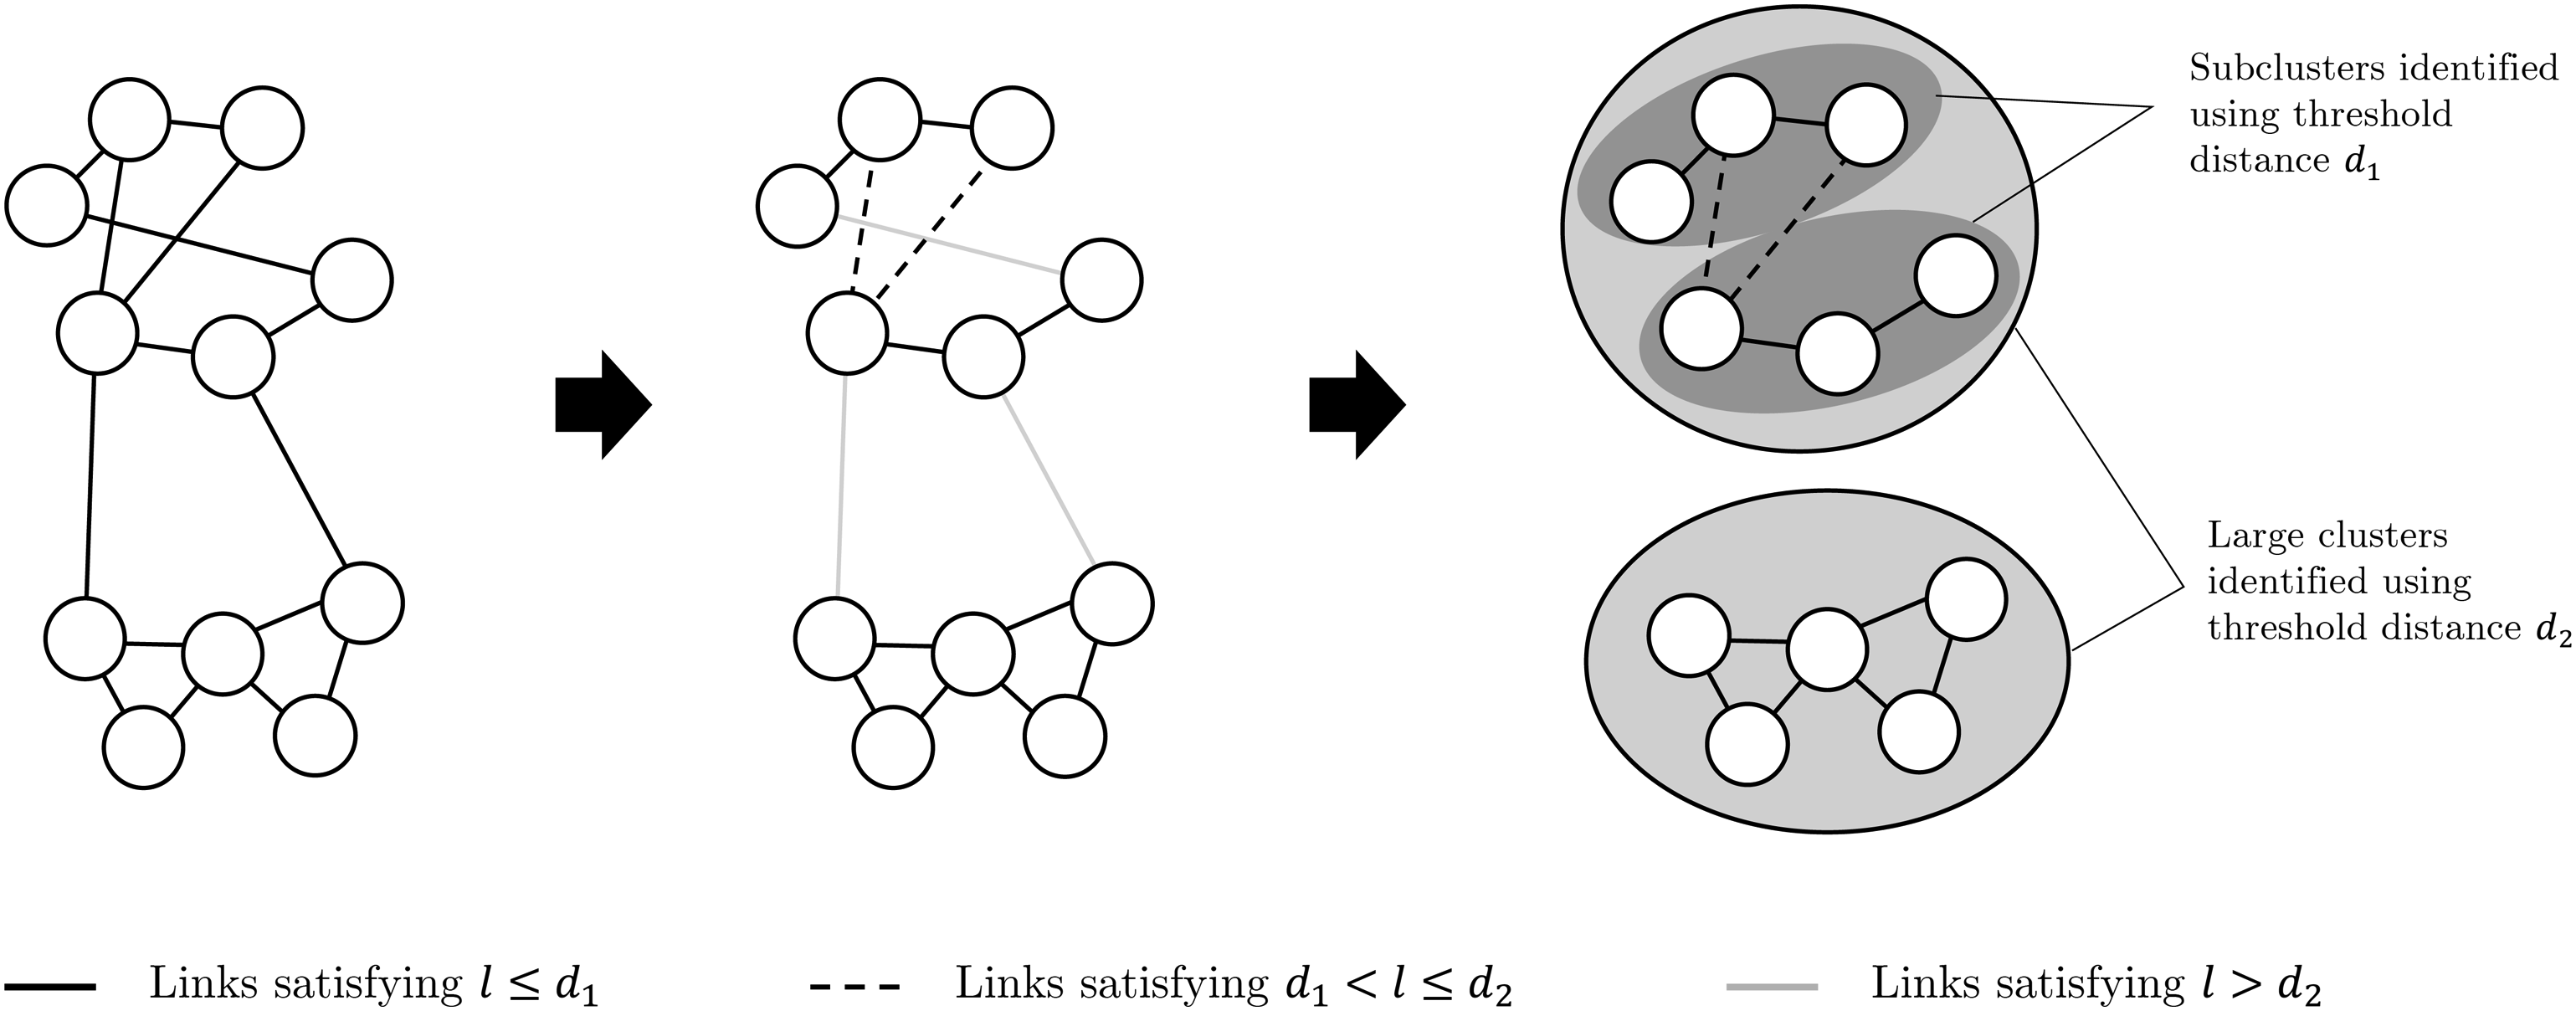
This iterative percolation process continues until it identifies a reasonable number of functional regions. There is no fixed rule regarding the choice of the appropriate threshold distance, which may differ by country and data resolution. However, an overly large threshold distance may identify entire nodes as a single cluster; conversely, too small a threshold distance can detect only a limited set of central cities.
The estimated clustered nodes are then projected onto a map of Korea’s administrative boundaries to delineate functional regions (see Figure S1 for Korea’s administrative boundaries). We use city and county-level boundaries for the mapping, since city-level municipalities in Korea (i.e., city, county, and district) are the lowest level administrative units having publicly elected leaders and forming the basis of local autonomy (Park et al., 2019).
Model’s performance assessment
To assess our model’s performance, we first pick three reference maps and compare our estimated results with them (see Section “identified functional urban regions” for further details). There is no consensus on Korea’s regional boundaries in a functional sense, since they may differ depending on the data and method used for analysis, not to mention their dynamic nature. However, the three maps chosen are built on a conventional flow-based approach using similar functional-region concepts (e.g., labor markets) and are widely referred to within academic and policy circles when delineating functional regions. For the comparison of our results with the reference maps, we use the Jaccard index, which is commonly used to measure the degree of similarity in a pair of model outputs (Farmer and Fotheringham, 2011; Liu et al., 2019; Rybnikova et al., 2021). The Jaccard index
A second set of tests compares central cities in each region identified by population density and by road network closeness centrality, and investigates the correlation between road network–based closeness centrality and socioeconomic indicators (e.g., population density, local income tax, and PM2.5). Two road network closeness centrality indices are tested. One is
Data
The main data used for our percolation analysis is Korea’s official road network shapefiles constructed for 2018 and distributed by the National Geographic Information Institute (2021). The original dataset is comprised of >10 million nodes and links with rich attribute information, including road width/length and pavement condition. Of the nodes and links, we ignore minor road sections with widths ≤4 m, which are not appropriate for vehicular traffic, and consider a total of 634,426 nodes and 770,182 links for analysis.
Other complementary data sets are from various sources. Socioeconomic variables, such as city and county-level population and local income tax, are constructed from the Korean Statistical Information Service (KOSIS) database (Statistics Korea, 2022). Population-weighted, annual mean PM2.5 levels in 2019 are computed using the 36″✕36″ PM2.5 concentration grids developed by Hammer et al. (2022) and the 60″✕60″ LandScan population grids distributed by the Oak Ridge National Laboratory (2022).
Results
Korea’s urban hierarchies
Following the approach used by Arcaute et al. (2016), we highlight key sets of intersection clusters identified at different threshold distances and their corresponding urban geographical patterns (Figures 2 and 3). Overall, our analysis results clearly demonstrate Korea’s mono-centric urban hierarchy, in which the Seoul Metropolitan Area (SMA) occupies a dominant position in the national urban system. When a percolation process begins from an initial threshold distance of 2000 m with a 40-m decremental interval, only a single giant cluster is detected within the threshold range of ≥1880 m. Seoul, showing the highest centrality index, may be viewed as the central city of this cluster, which contains >85% of Korea’s entire road intersections analyzed. The northeast of Gangwon and Gyeongbuk Provinces is largely excluded from the cluster, revealing their weak network connectivity arising from unfavorable topography. The Taebaek mountain range is vertically stretched across the east of the Korean peninsular along Gangwon and Gyeongbuk Provinces, and this geographical condition functions as a barrier to linking to Korea’s main road networks. Largest clusters of Korea’s road network intersections identified at different percolation thresholds. Source: Created by the authors. Korea’s major urban clusters and their hierarchies. Note: Jeju Island is excluded from analysis. Clusters represented as circles are labeled after their central cities. The size of each circle is proportional to the number of road junctions included in the corresponding cluster. Source: Created by the authors.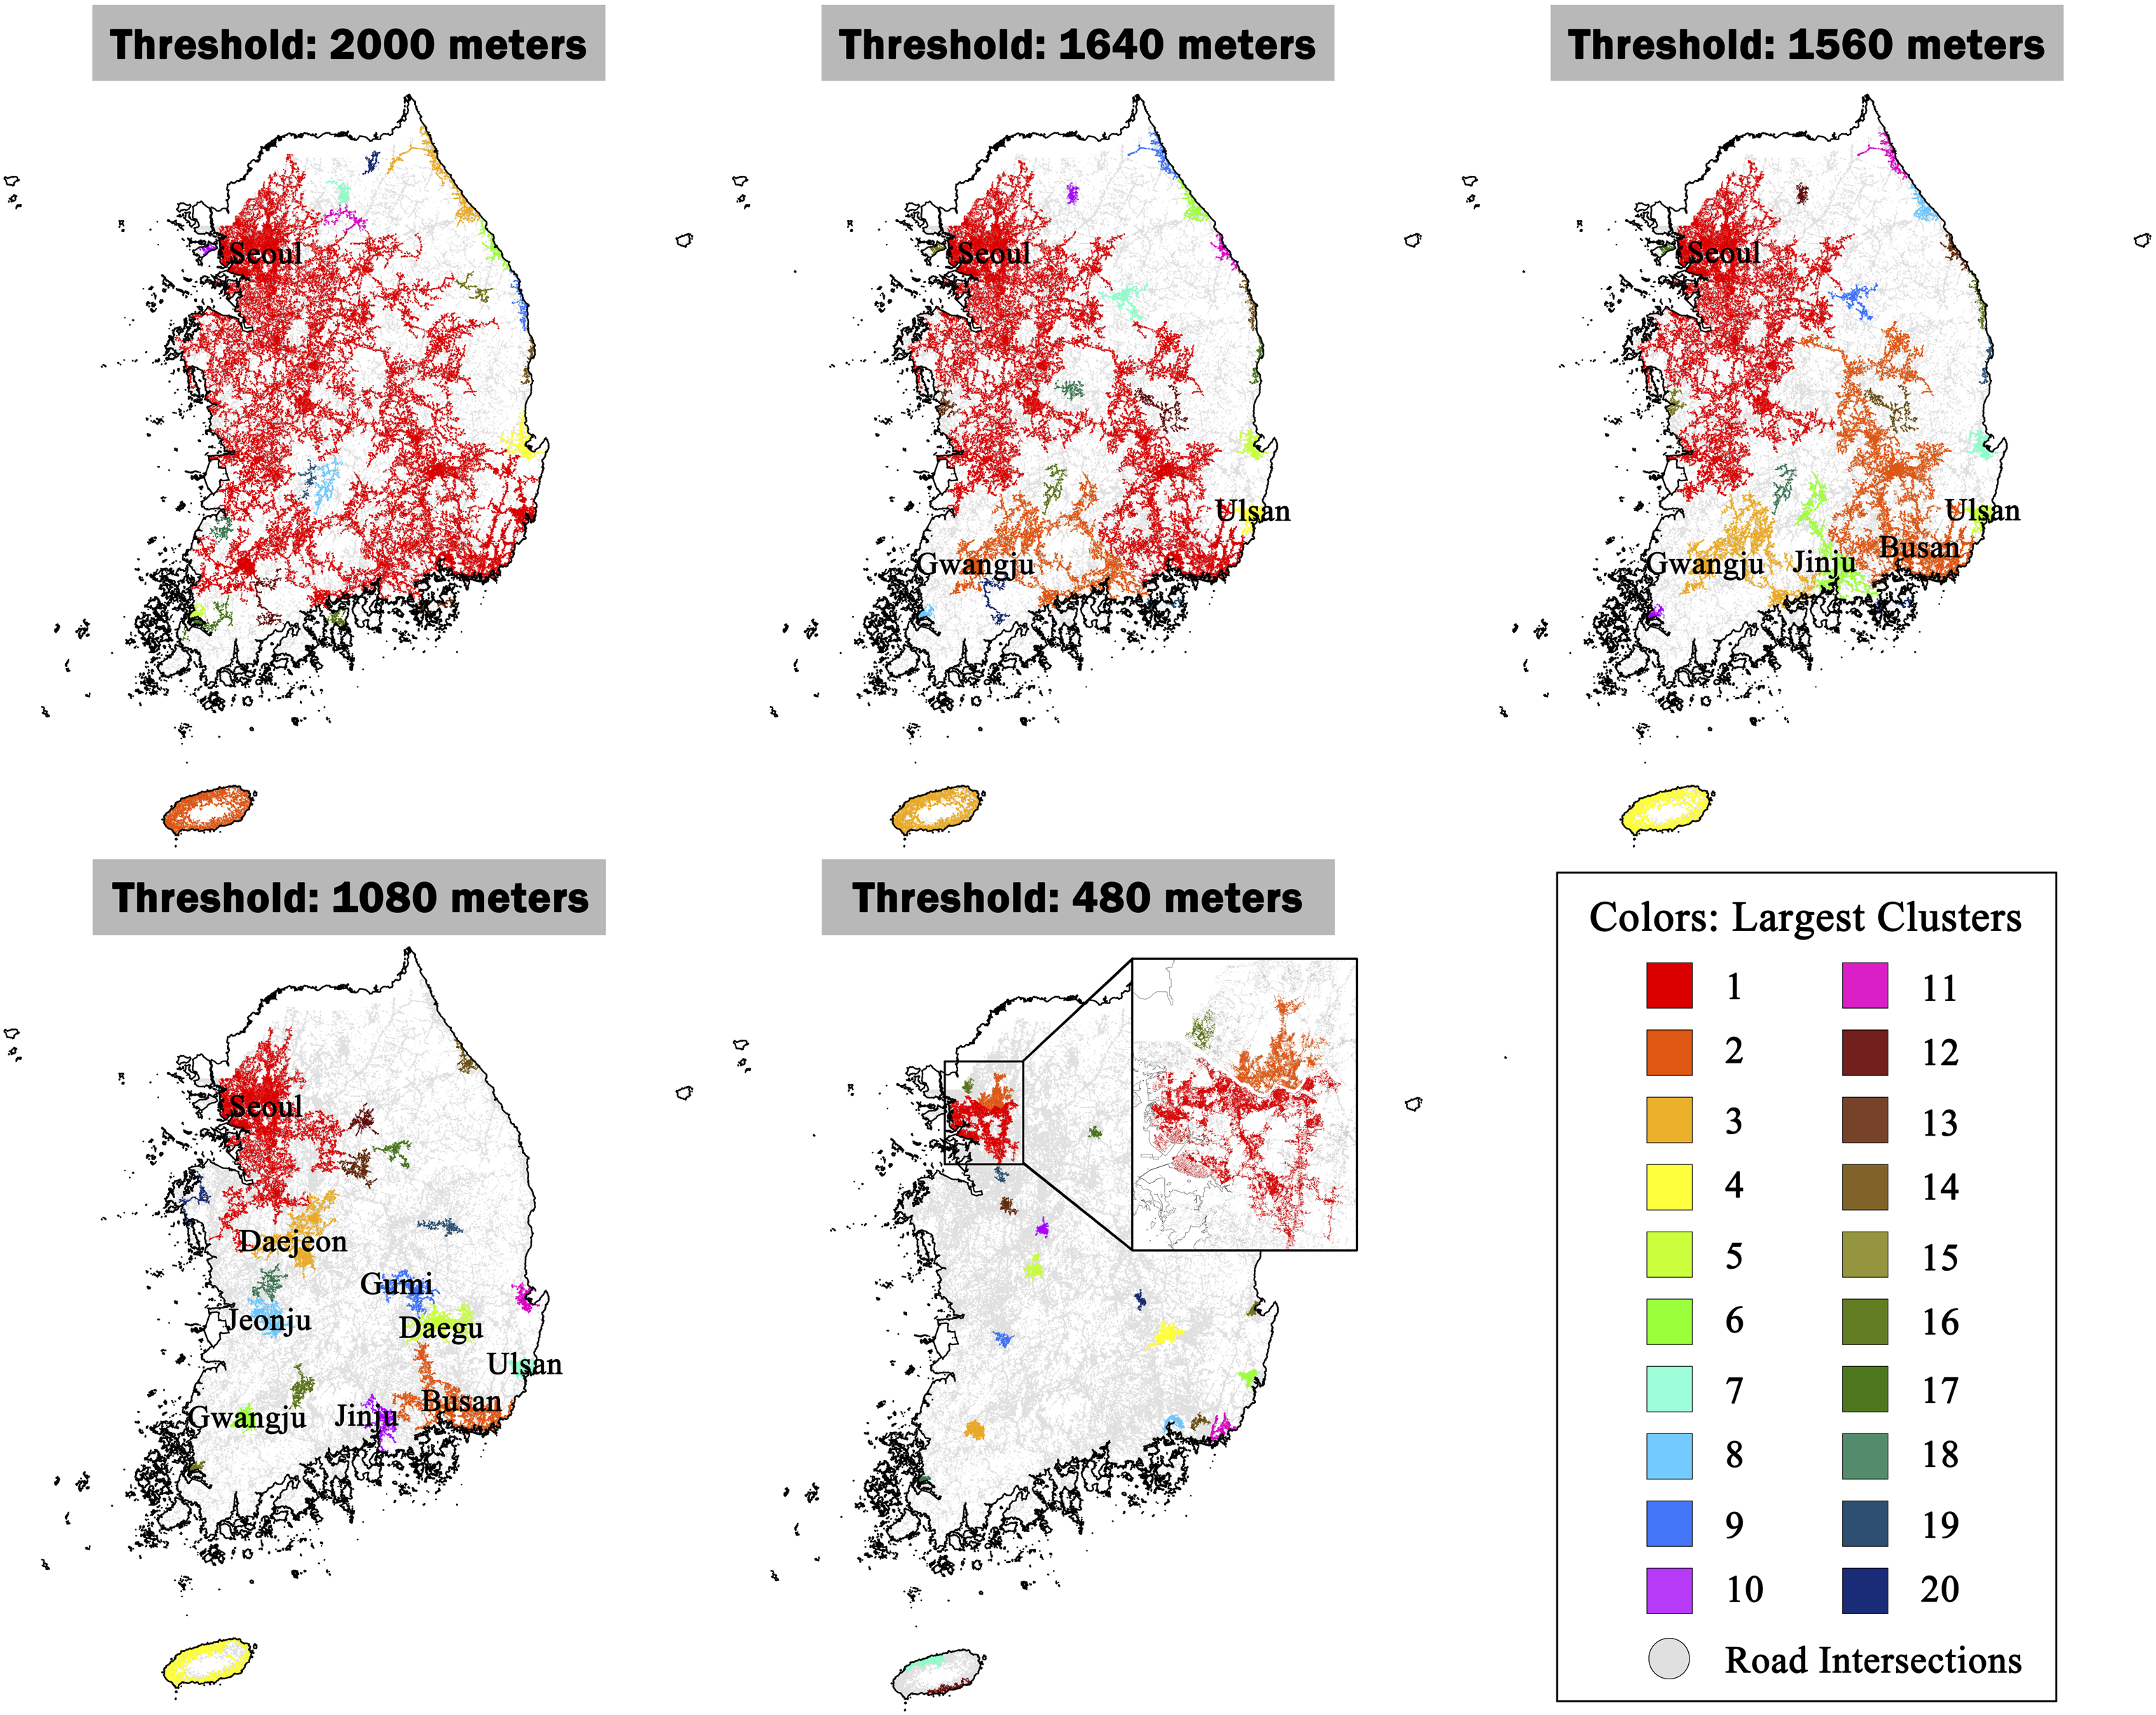
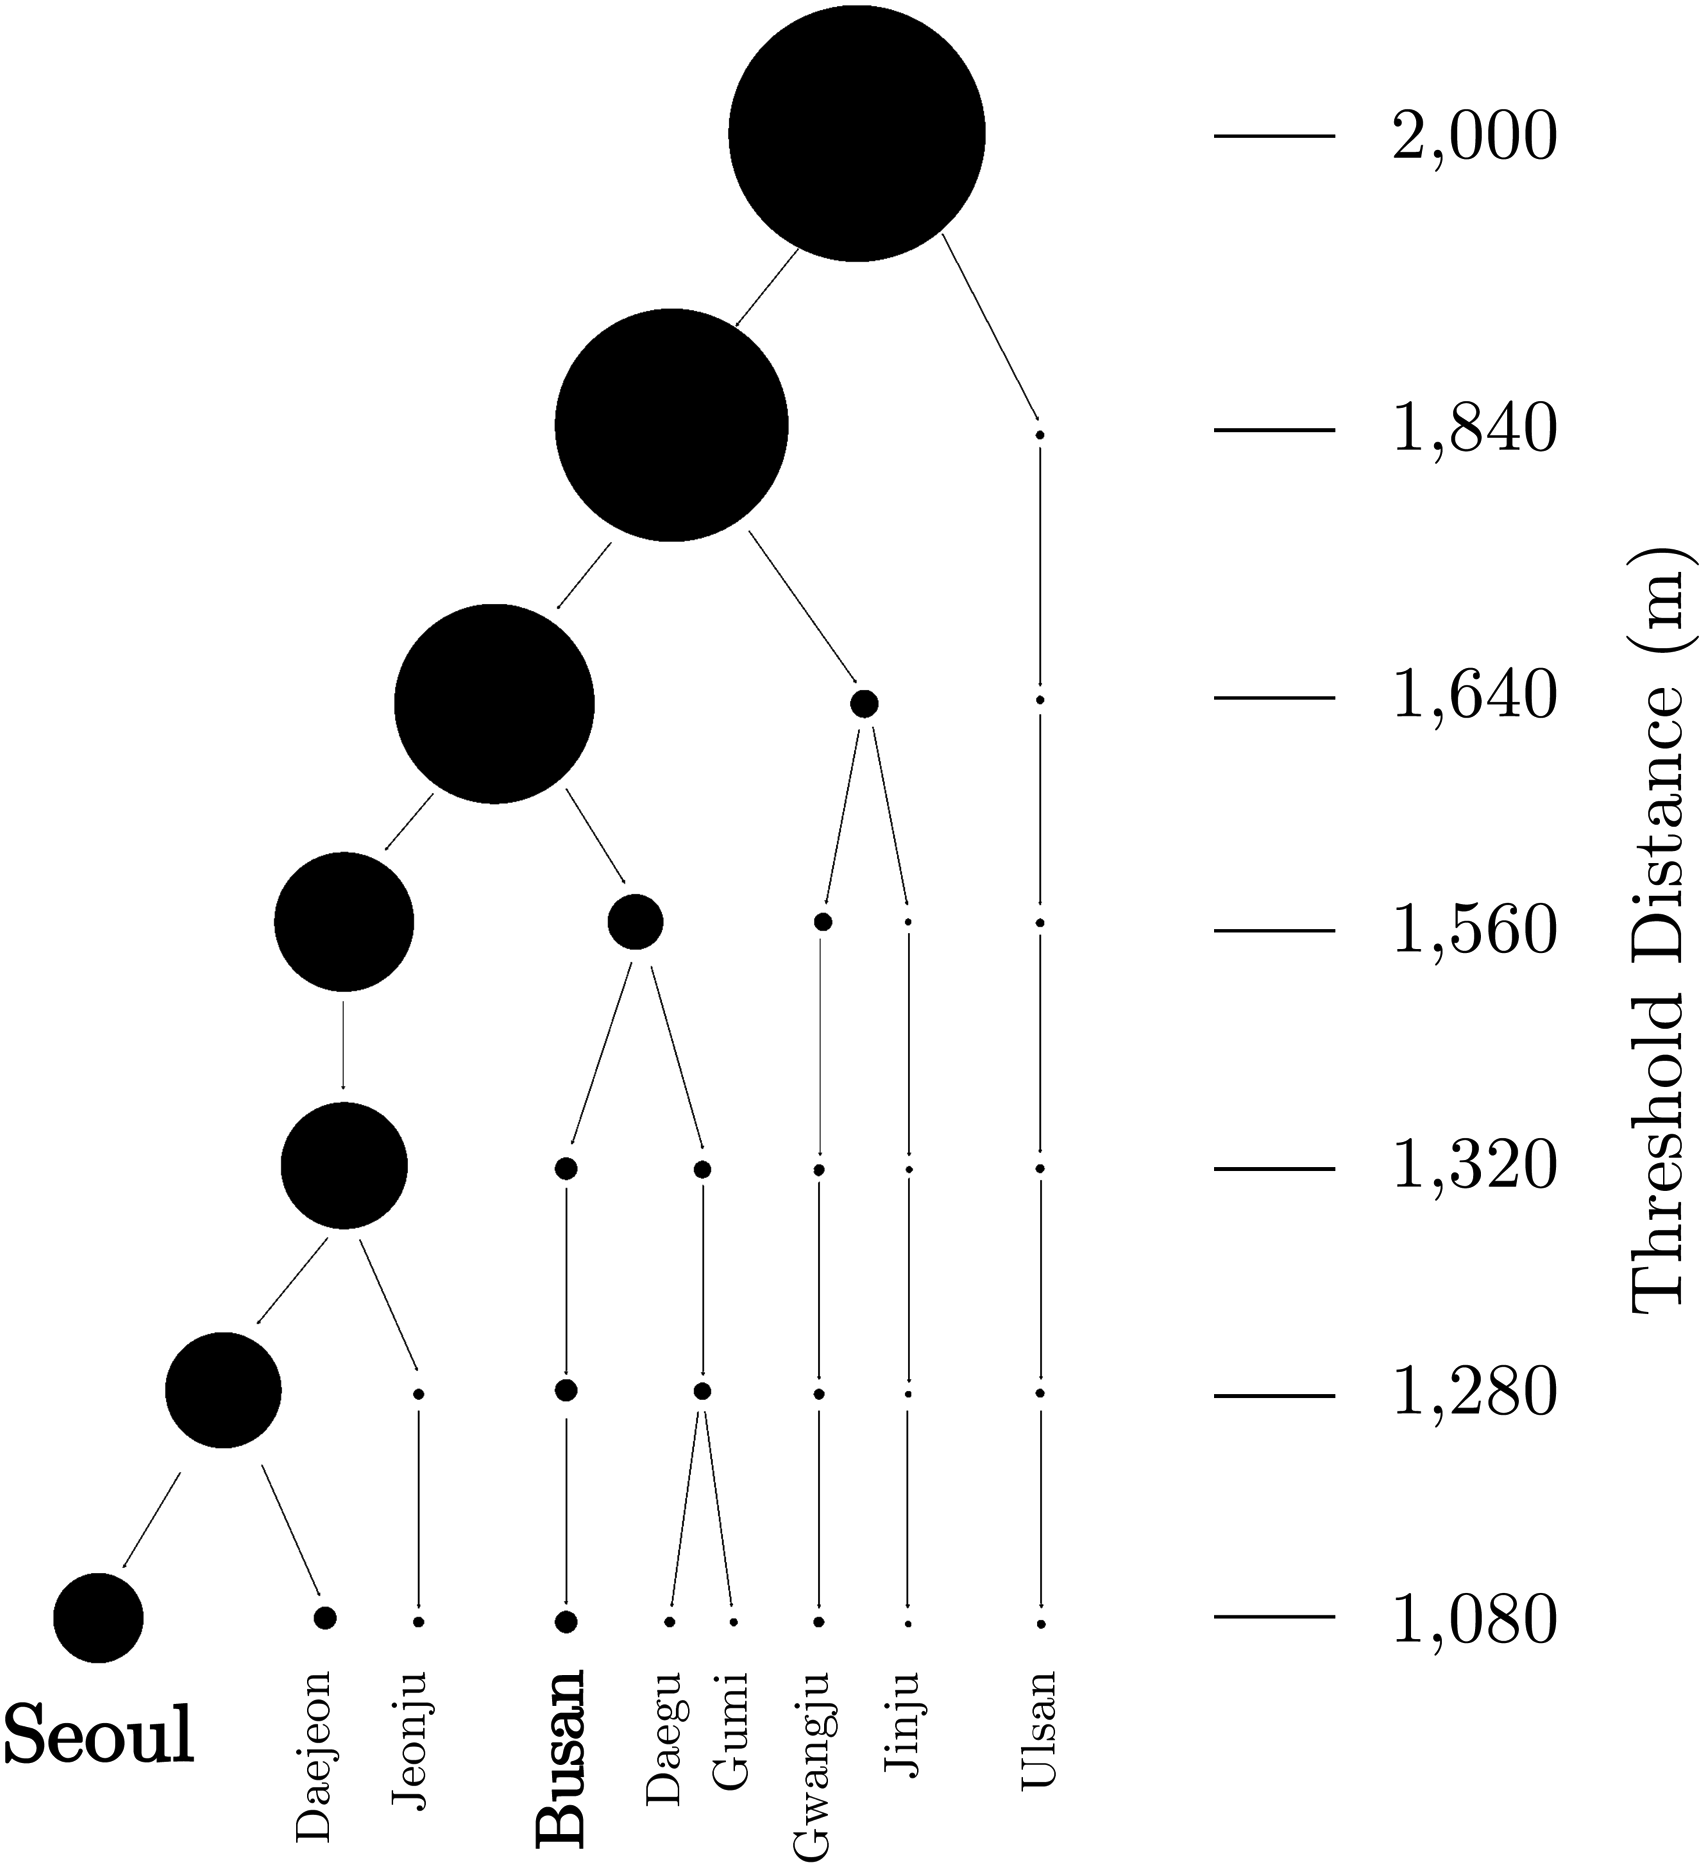
The Seoul-centered single cluster begins to branch off when Ulsan and Gwangju—both of which are province-level metropolitan cities—are separated at the thresholds of 1840 m and 1640 m, respectively. Then, five major urban clusters emerge at the threshold distance of 1560 m: Busan is split from the Seoul-centered main cluster, Jinju is disjointed from the Gwangju cluster, and Ulsan remains independent. This level of connectivity is of particular importance in Korea’s urban hierarchy in that Busan—Korea’s second largest city and most important container seaport—is identified as a separate cluster. The Seoul–Busan axis was a primary economic corridor for Korea’s initial growth pole development strategy, and Busan has served as a center of the Southeastern Maritime Industrial Region—one of the two mega-city regions essential for Korea’s export-oriented industrialization (Kim et al., 2014; Nam, 2009).
The identification of Korea’s most densely urbanized regions is evident at the threshold of 1080 m. At this level of connectivity, at least 15 major clusters are identified in South Korea’s main territory (excluding Jeju Island), and the gap in size between the SMA and the other clusters is still large. Six out of Korea’s eight province-level cities (and their vicinity), representing the country’s most densely urbanized areas, are recognized as independent clusters, except for Incheon merged to Greater Seoul and Sejong merged to Greater Daejoen. One point to be noted is that the estimated boundaries of the Greater Seoul area are stretched further to the north of Chungnam Province. This may highlight the mismatch between the functional and administrative boundaries in Korea’s context, given that the SMA is commonly defined as the aggregation of Seoul, Incheon, and Gyeoggi, complying with their political jurisdictions while excluding Chungnam. However, our results demonstrate that the SMA and Chungnam are well connected and may form an even larger Greater Seoul region from a functionality perspective. In fact, Daejeon and its vicinity, located in the south of Chungnam, are part of the Greater Seoul area at thresholds of ≥1120 m, forming a much greater Seoul-centered urban cluster than conventionally assumed.
Finally, sub-regional urban areas are found at the threshold of 480 m. Only Seoul and its close vicinity form a sizeable cluster at this level of connectivity, while a few other local cities are identified as quasi-isolated points, rather than as a cluster. This finding suggests that thresholds ≤480 m in Korea’s context are too restrictive to consider functional complementarities at a regional level. Thresholds ≤480 m even bisect the city of Seoul into north (Gangbuk) and south (Gangnam) across the Han River, and may be more suited to examine connectivity at district or lower levels. As a comparison, Long (2016) identifies individual cities in China with a threshold of 500 m.
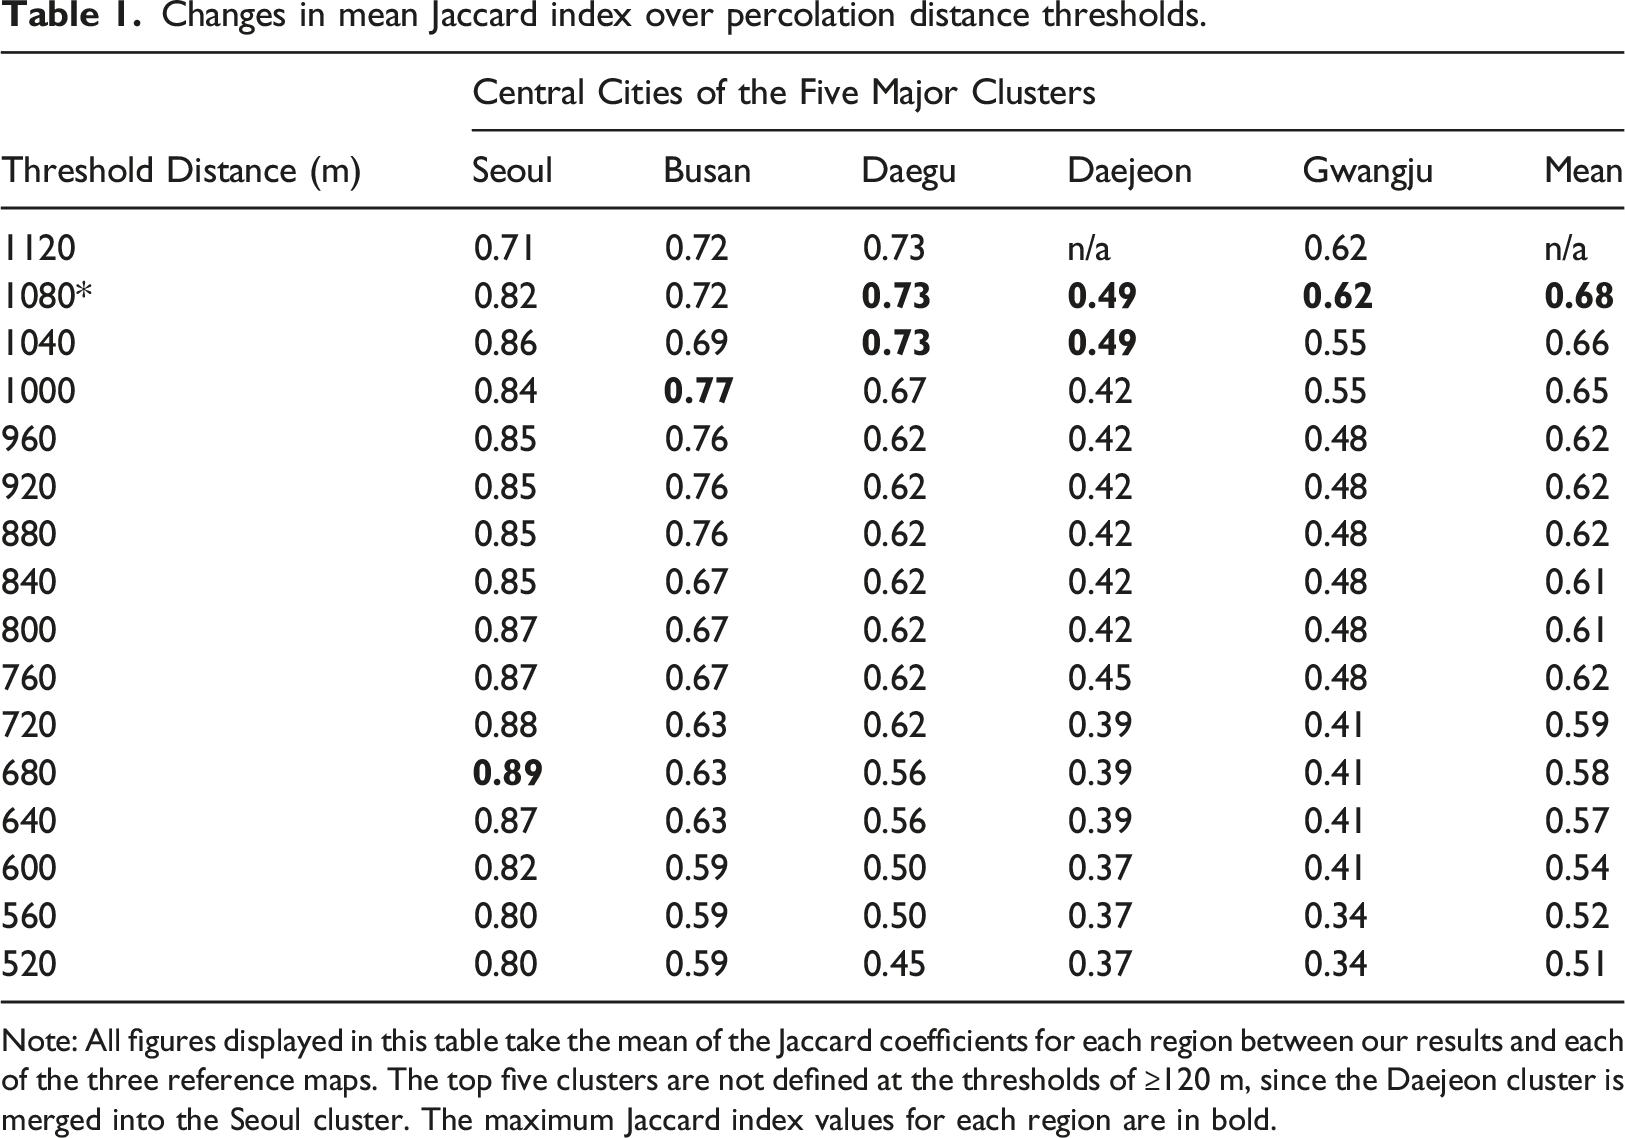
Identified functional urban regions
To assess the model’s performance relative to conventional flow-based approaches, we first choose three reference maps of Korea’s functional regions estimated from relatively recent flow data (Kim et al., 2012; Kim and Woo, 2019; Lee and Lee, 2015) and then compare our results with them (Figure 4). Out of multiple percolation threshold choices available, we choose the 1080 m case for comparison, since the major clusters identified at this threshold include all of Korea’s most densely urbanized regions. In fact, the mean Jaccard index for Korea’s five major functional regions identified peaks at the threshold of 1080 m (0.68), presenting the highest overall similarity at this level of connectivity (Table 1). One caveat is that the three chosen reference maps themselves present substantially different estimation results, arising from dissimilarities in data sources, methods, and time periods of interest. It is hard to tell which one of them is superior to the others in the absence of official functional-region boundaries in Korea’s context. Thus, our assessment focuses on the similarity between our results and conventional flow-based approaches as a whole. Functional regions defined at 1080 m threshold, compared with reference cases: (a) Our results; (b) Reference map from Kim et al. (2012); (c) Reference map from Lee and Lee (2015); (d) Reference map from Kim and Woo (2019). Note: Identified functional regions are highlighted in non-white colors. Source: Created by the authors. Changes in mean Jaccard index over percolation distance thresholds. Note: All figures displayed in this table take the mean of the Jaccard coefficients for each region between our results and each of the three reference maps. The top five clusters are not defined at the thresholds of ≥120 m, since the Daejeon cluster is merged into the Seoul cluster. The maximum Jaccard index values for each region are in bold.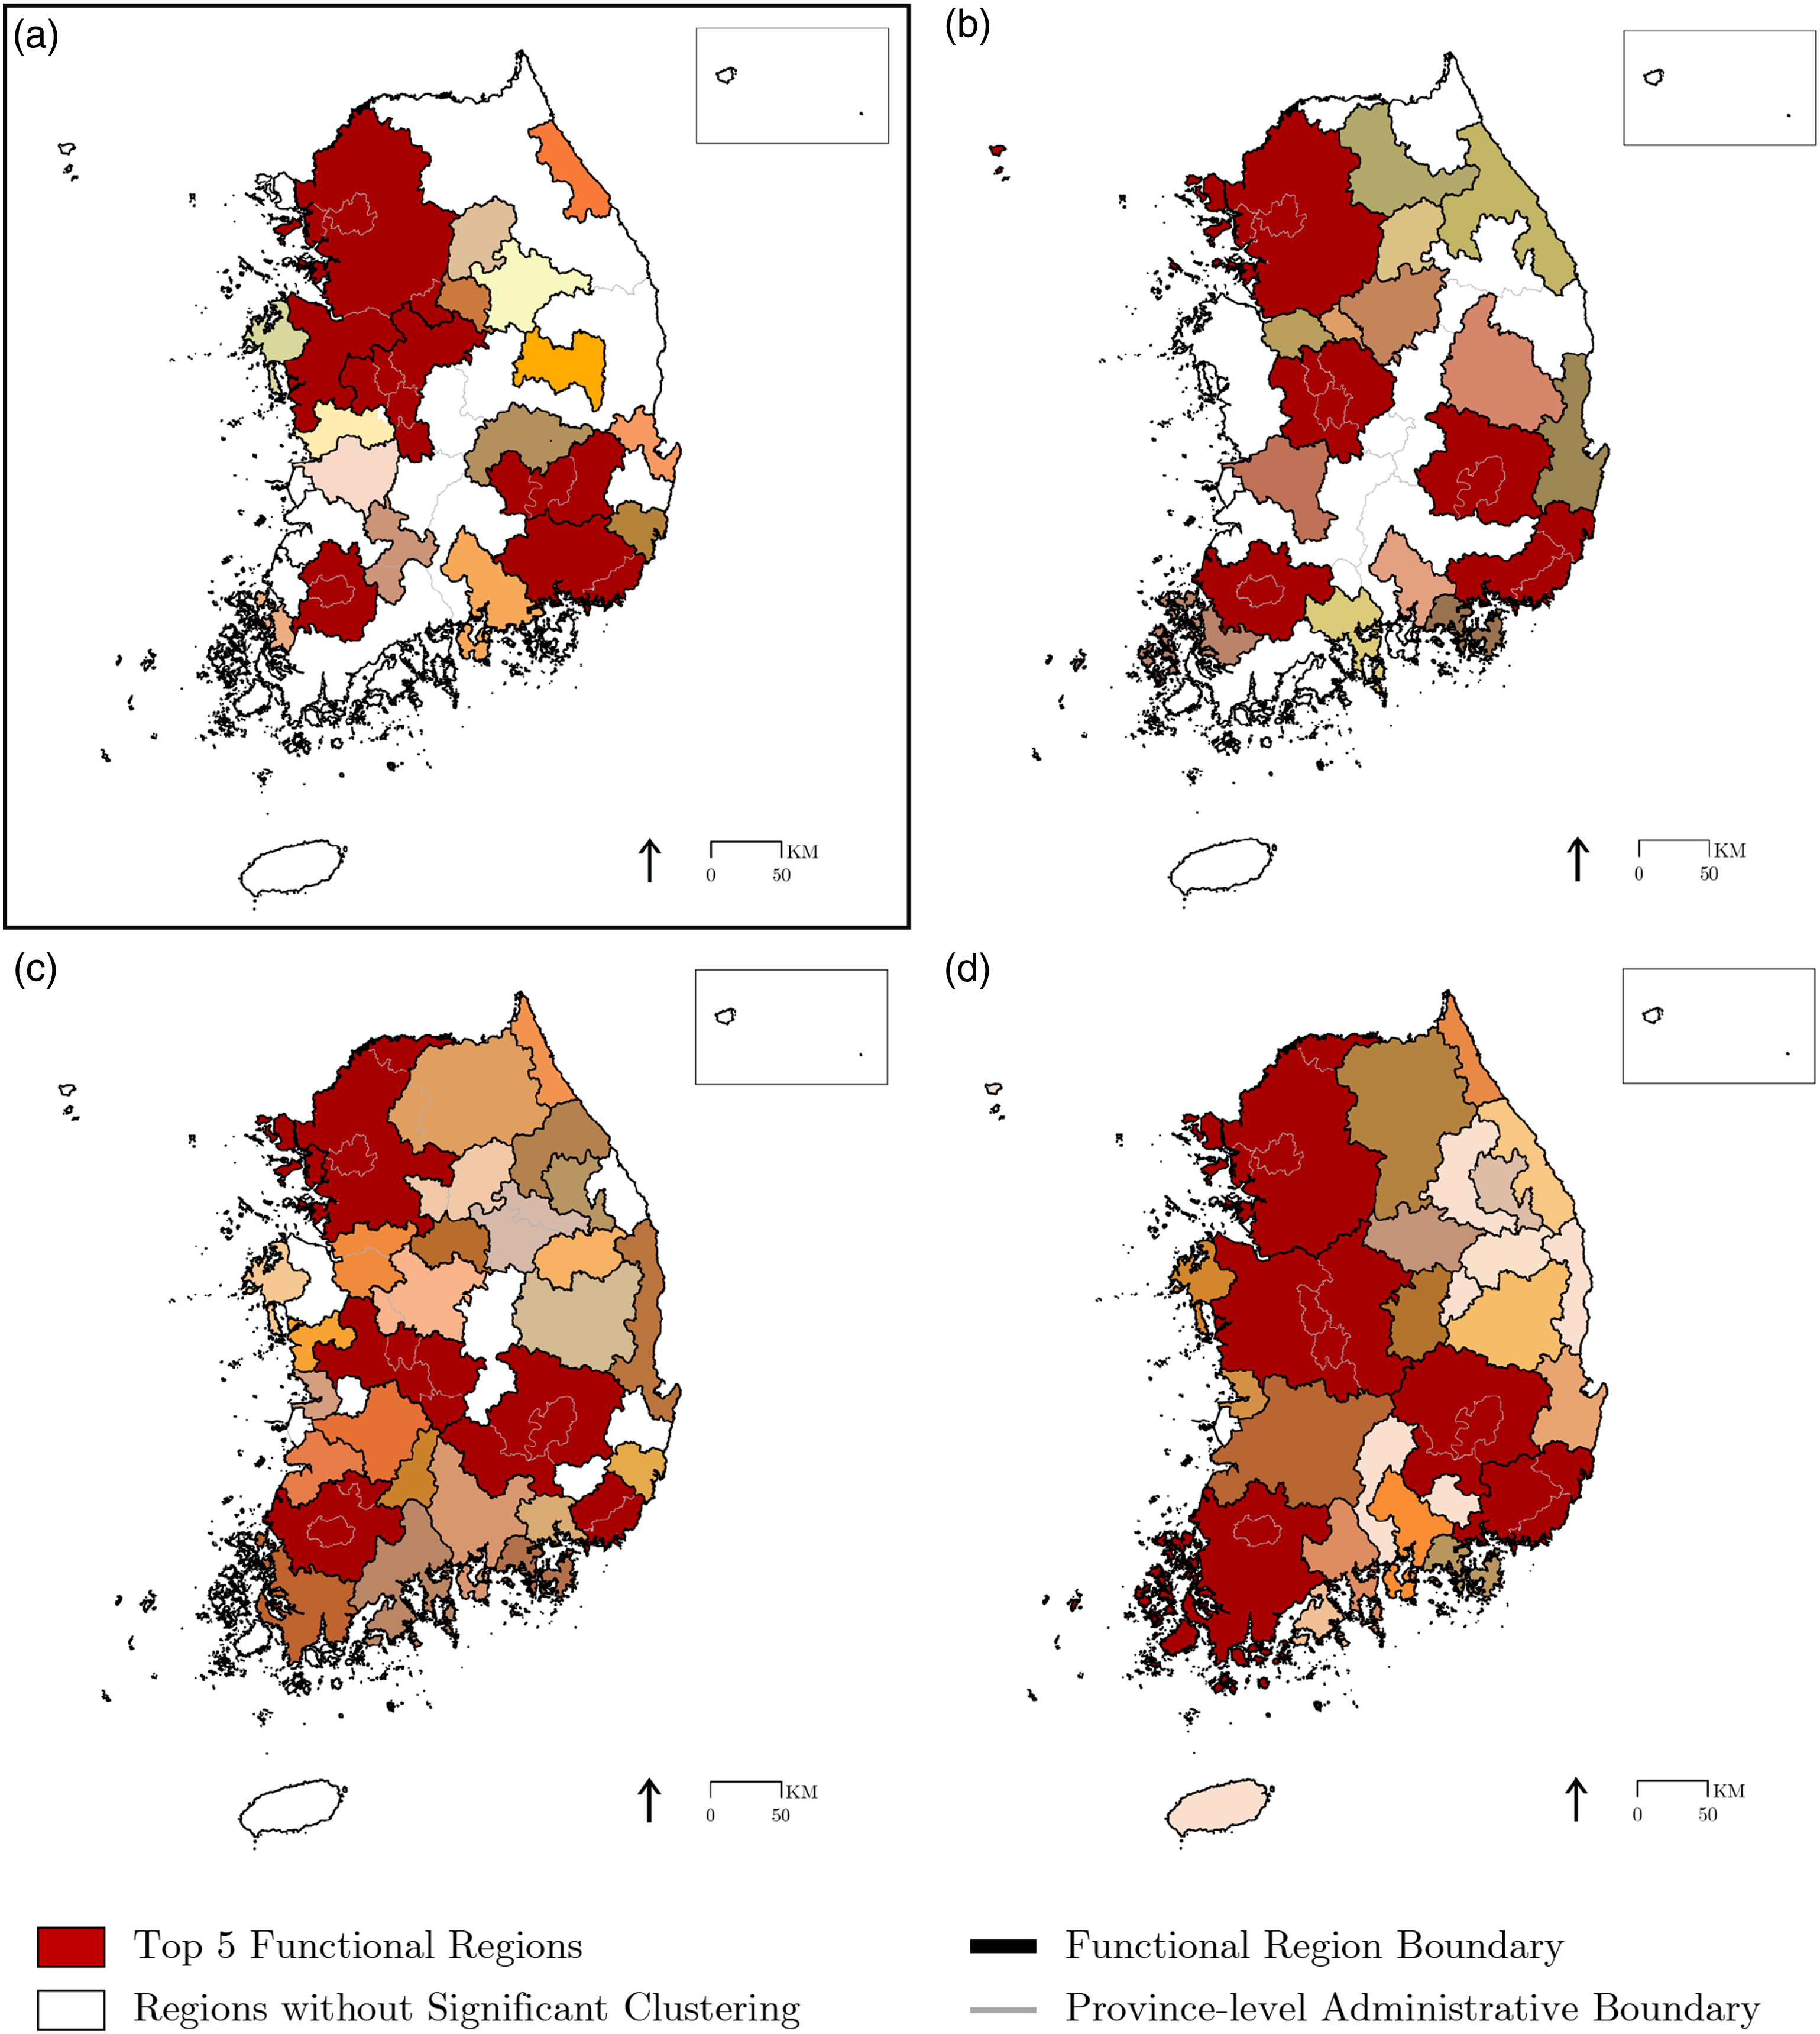
Jaccard coefficients between our estimates and three reference maps.
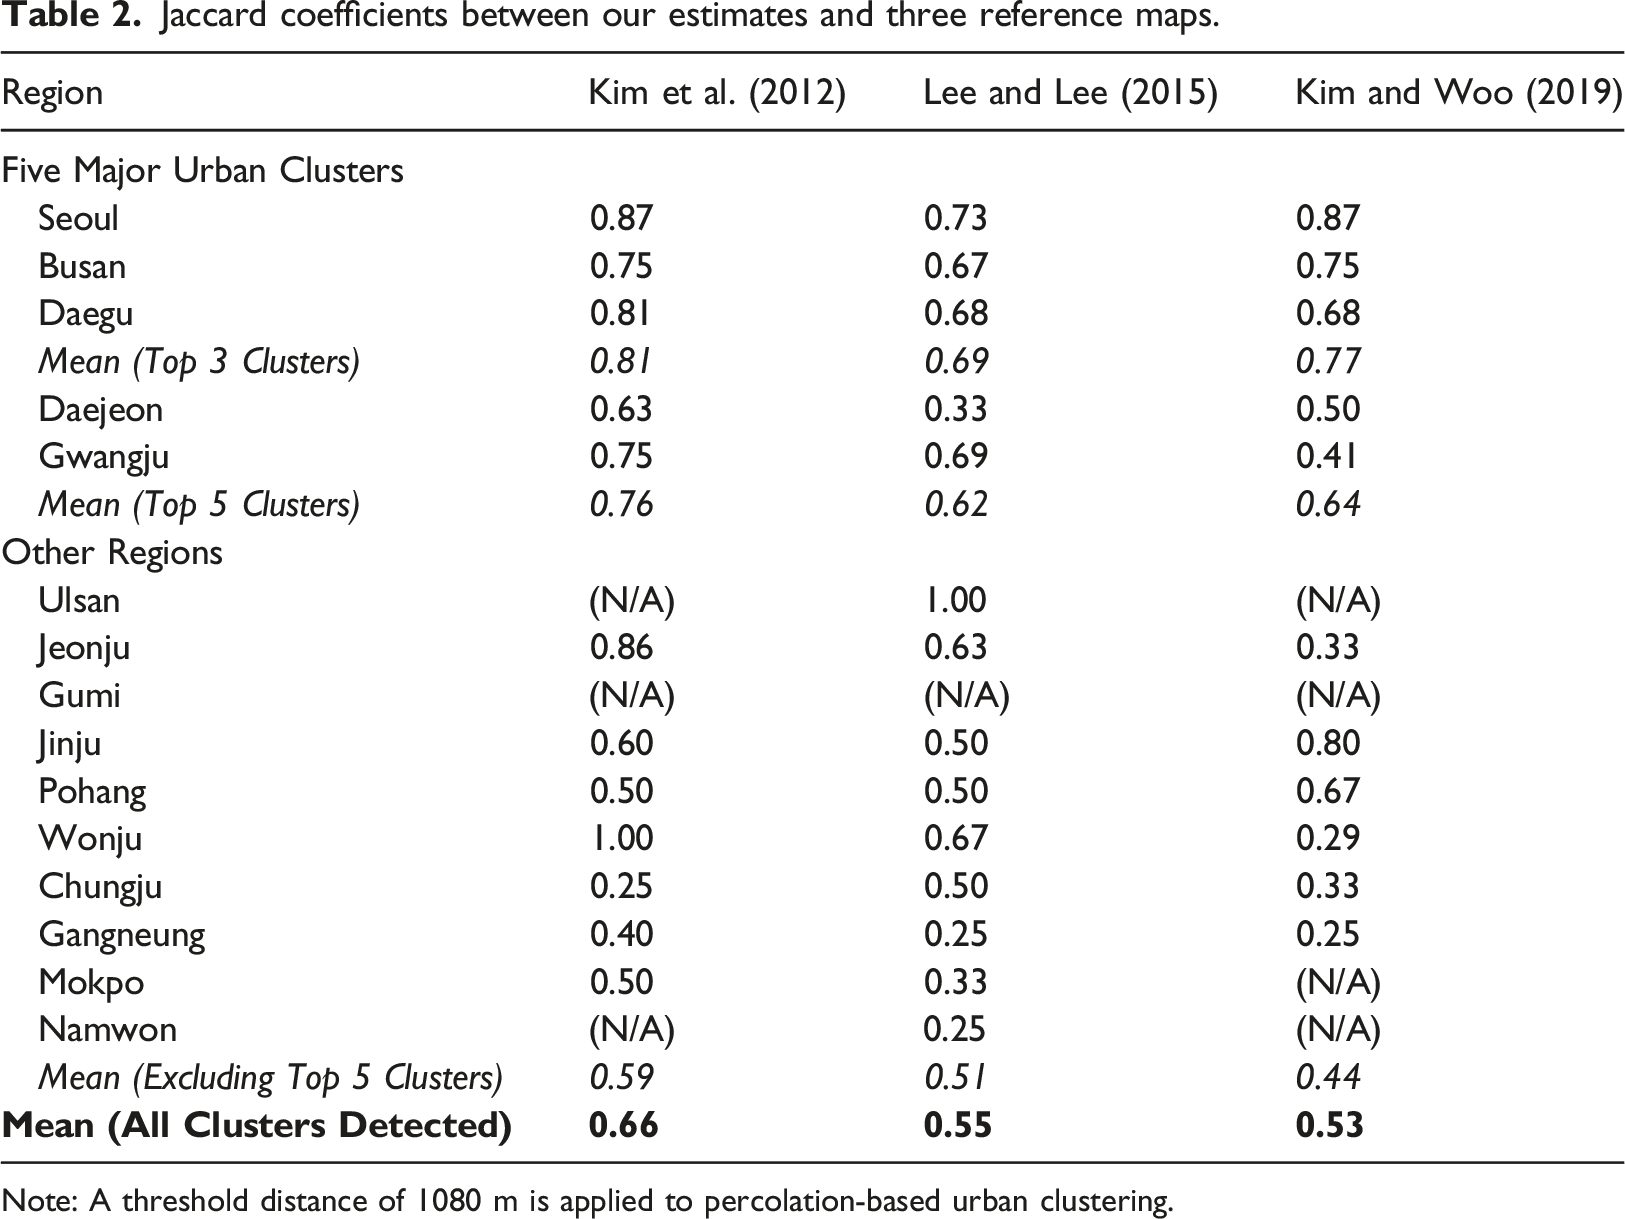
Note: A threshold distance of 1080 m is applied to percolation-based urban clustering.
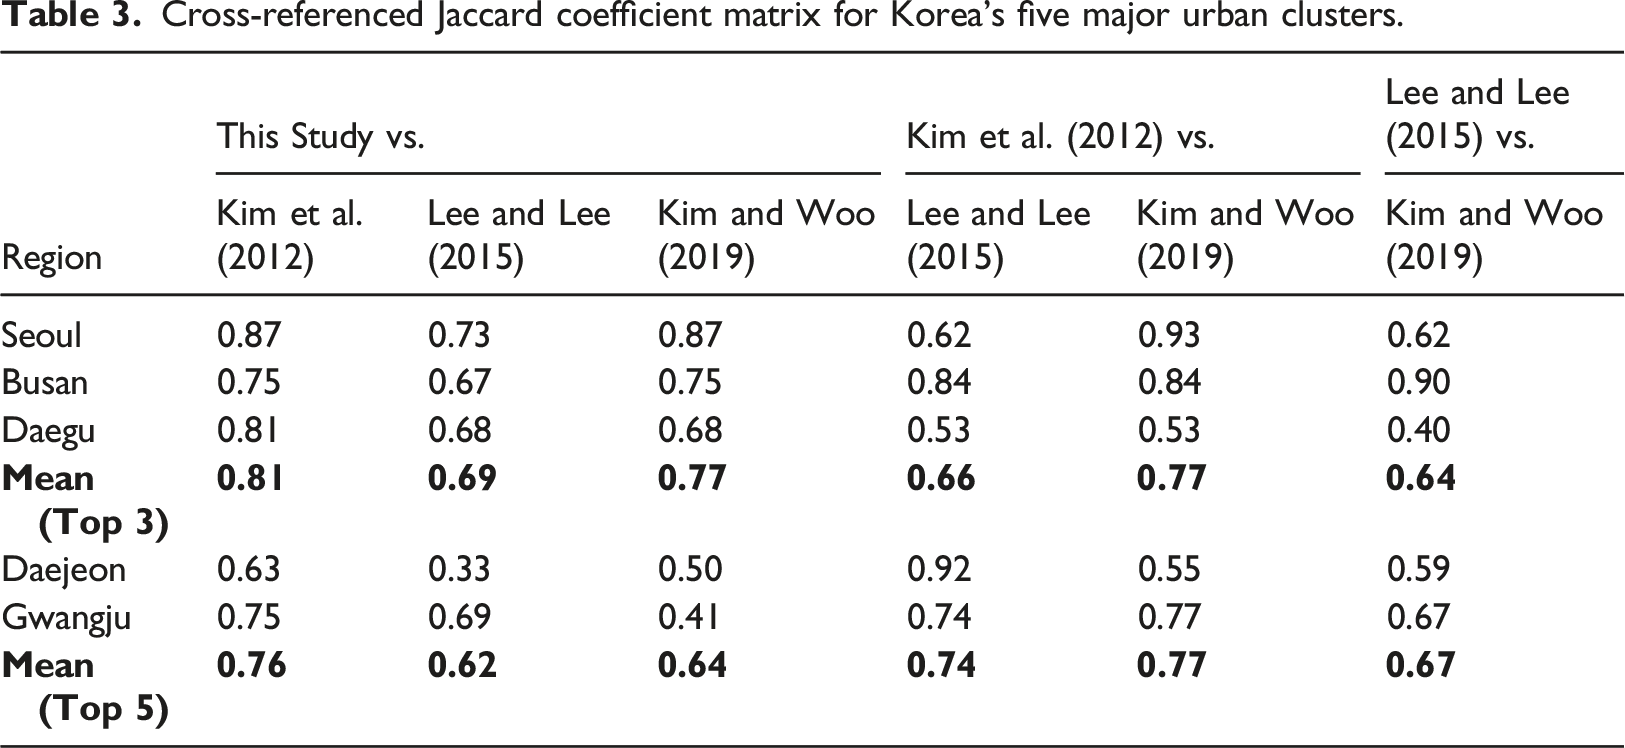
Cross-referenced Jaccard coefficient matrix for Korea’s five major urban clusters.
Lower Jaccard coefficients for even lower-tier urban clusters seem to support our reasoning. When the five largest clusters are excluded, the mean Jaccard index for the remaining cities drops to [0.44, 0.59]. The decreasing similarity reflects that the gap between supply of road infrastructure and actual demand for it is greater in lower-tier cities. As discussed earlier, lower-tier cities have a disadvantage in developing dense road networks under a size-biased national resource allocation system, and suffer from an undersupply of road infrastructure and weaker connectivity.
Road network centrality
The central cities in each functional region, displayed in Figure 5(a), may be identified from either population density or closeness centrality indices computed from the road network data. Those with high population density include all higher tier cities (province-level cities or provincial capitals), which are generally perceived by the public as central cities in each region (Figure 5). Overall, those with high closeness centrality indices overlap with those with high population density, suggesting that road network density can produce reasonably similar results in identifying central cities. The single exception is Busan, which is located in the southeast corner of its hinterland. Gimhae, a regional sub-center closer to the geographical center of the region, reveals higher centrality than Busan. One reason is that, by design, closeness centrality indices built on the shortest distance concept present a bias toward a geographical center (Mitchell and Griffin, 2021). Busan’s unique geographical condition—a port city embracing 41 islands where around half the land is mountainous and not suitable for development—is another factor that has pushed the center of the regional road network away from its city proper. Regional centers based on road network and population density: (a) Distribution of closeness centrality, 2018; (b) Distribution of population density, 2020. Source: Created by the authors based on data from the National Geographic Information Institute (2021) and the Oak Ridge National Laboratory (2022).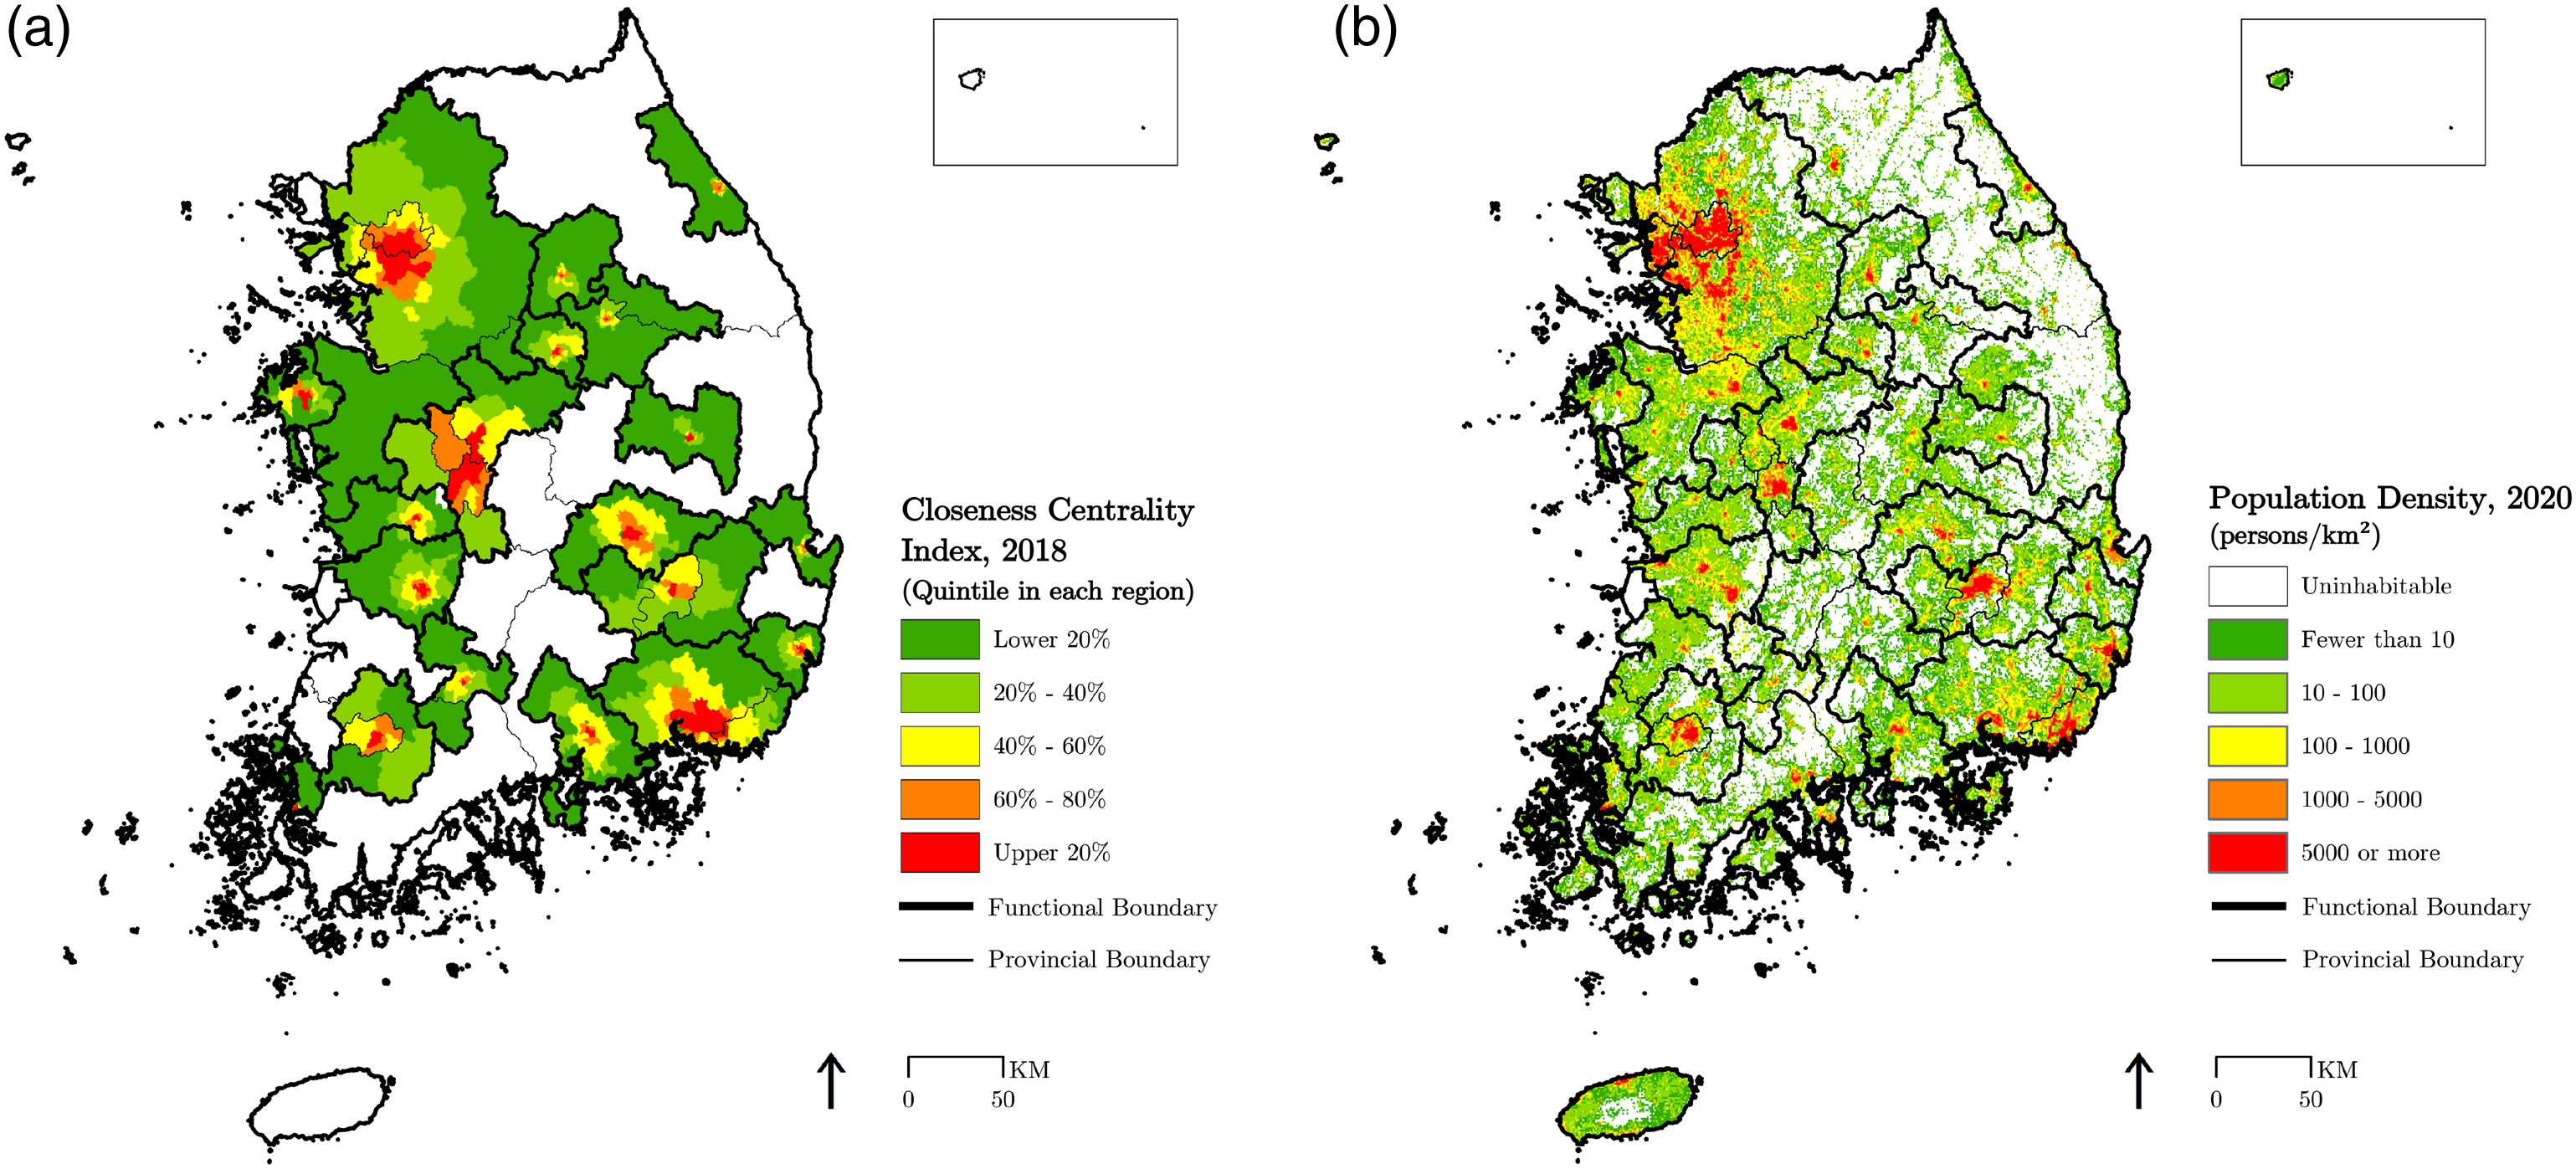
Correlation coefficients between centrality measures and socioeconomic attributes.
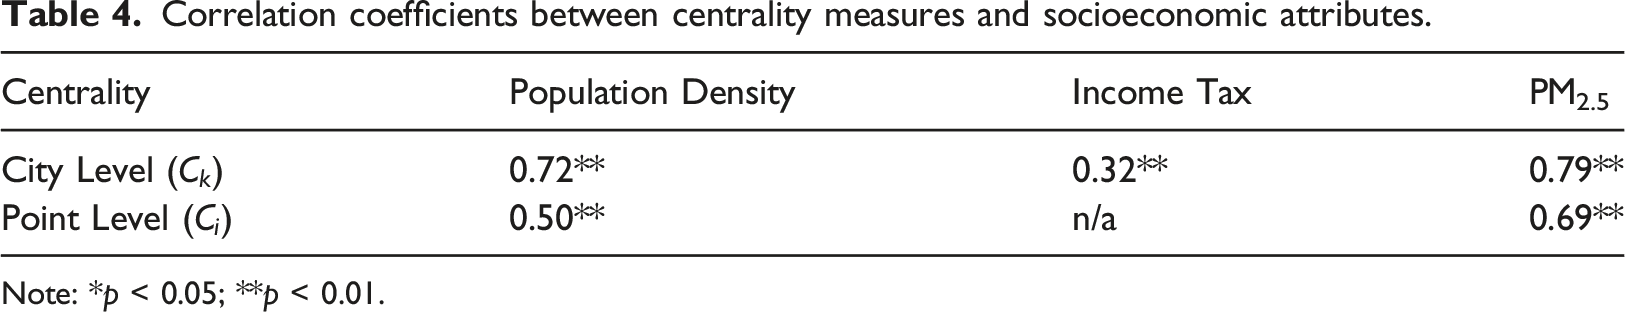
Note: *p < 0.05; **p < 0.01.
Further discussion
As discussed in earlier sections, our analysis of percolation in Korea’s road networks demonstrates that this approach is useful in understanding national urban hierarchies and well approximates the delineation of flow-based functional regions. In particular, a percolation approach has strength in its low data requirement and wide applicability as well as in its independence from subjective presumptions regarding regional boundary limits.
However, there are several caveats in the application of the approach. First, natural conditions can distort percolation-based delineation. For example, a single functional region may be detected as multiple isolated sub-regions under a reasonable percolation threshold, if rivers or mountain ranges passing through increase the physical distance among road junctions within the region. Second, inconsistent data quality can undermine the robustness of percolation application results (e.g., Boeing, 2020). It is not rare for open GIS data to be inconsistent in quality even within a single country, let alone across countries—detailed road segments are represented in only a few large cities while they are omitted or aggregated elsewhere. Finally, strong government interventions in public infrastructure investment may increase the gap between actual demand (e.g., traffic volume) and supply (e.g., roads) and thus weaken a key assumption of the percolation approach: that the latter reflects the former with a certain time lag. Then, this can be a source of divergence between flow- and percolation-based delineation results.
Conclusions
In this study, we apply a percolation approach to delineating functional regions and assess its predictive power relative to conventional flow-based approaches, using South Korea as a case example. Our results show that the percolation concept offers a useful tool for understanding urban hierarchies, and its application to widely available network stock data can well approximate the flow-delineated functional regions subject to high data requirements. The rationale for potential substitution of such stock data for flow data is the former’s predictive power for the latter—the configuration of existing networks reflects the actual demand revealed in flow data.
A percolation analysis of the Korean road networks demonstrates that South Korea has developed an extremely Seoul-centered mono-centric structure, and the spatial coverage of the SMA is much greater than conventionally assumed. At a reasonable percolation threshold defining Korea’s major urban clusters, the SMA—commonly defined as an aggregate of Seoul, Incheon and Gyeonggi—is stretched to the north of Chungnam Province, going beyond the southern limit set by Gyeonggi Province. The expansion of the SMA’s functional boundaries has significant implications for Korea’s regional policy and growth control over the Capital Region, but it can be overlooked by conventional flow-based methods. For example, all three flow-based reference maps chosen for comparison limit the maximum functional boundaries of the SMA to Gyeonggi Province borders before their analysis, positing the conventional view. Presumptions of this kind lack a rationale and can lead to an underestimation of the actual change in urban systems.
Overall, our percolation analysis results well approximate existing flow-based estimates, and their similarity tends to increase for larger clusters with some time lag. The mean Jaccard index for Korea’s 15 major urban clusters identified from percolation ranges in [0.53, 0.66], and comparable index values increase to [0.69, 0.81] for Korea’s top three clusters. In particular, the latter even exceed the coefficients computed from a pairwise comparison of the three flow-based reference maps themselves—[0.64, 0.77] for the top three clusters. This contrasts the mean Jaccard index for smaller cities, which decreases to [0.44, 0.59] if the top five clusters are excluded. This tendency is related to a size-biased pecking order in national resource allocation: the density of existing road networks well reflects the actual demand in big cities, while road infrastructure in smaller cities is relatively undersupplied. Also, the similarity tends to decrease when our results are compared with reference maps using more recent data. This seems be associated with a time lag involved in transport infrastructure investment. It takes time to respond to a demand shock, and existing road networks are likely concurrent with past demand with a lag of a few years.
The main contribution of this study is twofold. From a methodological perspective, we add further empirical evidence to support use of the percolation method and widely available stock data for identifying functional urban regions. The adopted percolation method can beget similar results to those based on flow data and is applicable to virtually all countries, including those developing countries where reliable subnational-level flow data is not available. Another strength of the approach is that it does not require strong presumptions on the total number or spatial limits of major clusters. This provides a great advantage in identifying crucial changes in urban networks that exceed a conventionally expected level, as exemplified by the spatial expansion of the SMA.
From a policy perspective, our results suggest the need for more balanced road infrastructure investment in South Korea. The SMA’s dominance in the national urban system and lower Jaccard coefficients for smaller cities suggest that Korea’s lower tier functional regions suffer weak connectivity to the main networks and an undersupply of road infrastructure. Improving these aspects seems to be a necessary condition to counterbalance a Seoul–centered mono-centric structure.
Supplemental Material
Supplemental Material - Delineating functional regions from road networks: The case of South Korea
Supplemental Material for Delineating functional regions from road networks: The case of South Korea by Yifu Ou, Euijune Kim, Xingjian Liu, Kyung-Min Nam in Environment and Planning B: Urban Analytics and City Science
Footnotes
Acknowledgments
We are thankful to the University of Hong Kong (Project Code: 201910159068), the National Research Foundation of Korea (Project Number: NRF-2021S1A5A2A03063693), and the Hong Kong Research Grant Council (Project Number: 17600918) for their financial support. We also acknowledge the financial support from the University of Hong Kong Research Committee and Faculty of Architecture for Prof. Euijune Kim’s visiting research professorship at the University. The publication of this article in an open access format is made possible, in part, by the support from the HKU Libraries Open Access Author Fund, which is sponsored by the HKU Libraries.
Declaration of conflicting interests
The author(s) declared no potential conflicts of interest with respect to the research, authorship, and/or publication of this article.
Funding
The author(s) disclosed receipt of the following financial support for the research, authorship, and/or publication of this article: This study was supported by the University of Hong Kong Seed Fund for Basic Research (Project Code: 201910159068), the National Research Foundation of Korea research grant (Project Number: NRF-2021S1A5A2A03063693), and the Hong Kong Research Grant Council (Project Number: 17600918), and the HKU Libraries Open Access Author Fund sponsored by the HKU Libraries.
Correction (May 2023):
Article has been updated for Acknowledgement and Funding since its original publication.
Supplemental Material
Supplemental material for this article is available online
Note
References
Supplementary Material
Please find the following supplemental material available below.
For Open Access articles published under a Creative Commons License, all supplemental material carries the same license as the article it is associated with.
For non-Open Access articles published, all supplemental material carries a non-exclusive license, and permission requests for re-use of supplemental material or any part of supplemental material shall be sent directly to the copyright owner as specified in the copyright notice associated with the article.