
Abstract
The unprecedented increase in population and urbanization dynamics, particularly without the requisite road infrastructure on the African continent, necessitates a more contextual understanding of the interaction between urban expansion and transportation in its cities. The study used Landsat and Google Earth, two readily available data in a resource-constrained context, and population data from 1999 to 2018 to estimate the interactions among roads stock, urban size and corresponding population changes in Akure, a mid-sized capital city in Nigeria, with substantial federal road connectivity. The results suggest strong positive relationships among all the variables of interest. At α = 10%, an increase in road stock causes a significant (p = 0.064) increase in population. The study reveals a heavier road density as the city expanded, slightly reduced from the core, with an increased stock of roads toward the periphery. These findings could significantly inform how cities evolve and can guide urban and transportation planners on complementary road infrastructure for growing cities. The study recommends that, irrespective of the political dispensation, the government could increase connective and motorable road stock toward the periphery each fiscal year, with promises of sustainability and resilience in the urban system despite the ever-increasing population.
Introduction
Urban growth is considerably associated with urban land use to the reduction of green spaces, resulting in the proliferation of urban sprawls, urban decay, and traffic congestion (Luthuli et al., 2021; Boori et al., 2015). The structure of built-up areas, including buildings, asphalt, and concrete, are inherently associated with its classes, such as residential, commercial, industrial, and transportation spaces (Chen et al., 2022; Li et al., 2022; Yin et al., 2011). The road network can be compared to the veins and arteries of a city's infrastructure, serving as vital connectors between different locations and playing a critical role in driving urban expansion (Nsikak, 2021; Zeng et al., 2019; Friedricha, 2017). With an increasing number of migrants into towns and cities, they expand, with new areas developing, leading to progressive transformation of urban structures and land use. These changes can occur rapidly and unexpectedly or they may be slow and pre-planned (Elsayed and Al-Sayed, 2021; Holscher and Frantzeskaki, 2021; Bloch et al., 2015). In addition to the other forms of migration, internal climate migration within Nigerian cities could hit 9.4 million people by 2050, according to a World Bank report (Tunji, 2021). The increasing number of migrants is a huge factor in population increase in cities, considering that the United Nations Department of Economic and Social Affairs (UNDESA) Population Division prospects that the World population, which is 7.942 billion in 2022, will increase by 570 million in 2030, and by a 1.175 billion in 2050. According to UNFPA (2014), Sub-Saharan Africa (SSA) had a population growth rate of 2.4%, the highest among all the regions, with Nigeria which stood at 2.8% was the highest in the region (Faiyetole, 2019), such that UNDESA (2022) prospects population increase for the SSA between 2022 and 2030 at 249 million, which is approximately half of the global difference for that period. Furthermore, between 2030 and 2050, Africa’s population is expected to increase by 693 million, which is more than half of the global increase projected for the same period. These figures are staggering and difficult to imagine. As noted by Shi et al. (2019), road network expansion and economic activities heightened by an increase in population are major factors influencing rapid urban growth in developing countries, creating a high demand for urban land use. In furtherance, urban locations with such comparative advantages are in areas where different transportation routes converge with a high degree of compactness, connectivity, density, length, and accessibility exhibited within intra- and inter-urban road networks (Wu et al., 2020; Zeng et al., 2019; Sreelekha et al., 2016). Thus, urban road networks interact with the locations for different urban land-use activities (Wang et al., 2019). Considering the sharp increase in population on the continent is a driver for the unprecedented urbanization being witnessed, with accompanying transportation situations (Echendu and Okafor, 2021; Faiyetole and Fulani, 2020); it necessitates a study that could shed light on an improved understanding of urban expansion and transportation interaction in an African context. This is a critical need since Guneralp et al. (2017) attributed the need for more requisite infrastructure, such as roads, for the population increase in African cities to unplanned and unregulated growth (OECD, 2020). Thus, the findings from this study will fill the vacuum of need for an informed context of the urban expansion and transportation interaction in an African city.
The duranton and turner hypothesis and the study objectives
The study location, Akure, a metropolitan area in the southwestern part of Nigeria, is the capital city of Ondo state, bordered by six other states and the Atlantic Ocean. It connects states in the southwest (Osun, Ekiti, and Ogun), south-south (Delta and Edo), and north-central (Kogi) regions. Thus, Akure has heavy interstate traffic with a significant Trunk “A,” a federal road connecting Lagos through Ibadan to Abuja and further north. Duranton and Turner (2012) revealed that a city’s initial stock of highways causes an increase in the growth of urban centers, especially in its employment over a certain period, in the United States. Coupled with the fact that Akure has an undeveloped expanse of land at its periphery, it is opined from Duranton and Turner (2012) that its interstate road connectivity could influence population increase and ultimately affect the urbanization of the area. With the increased population and urbanization, some specific urban and transportation problems in Akure include traffic deadlock, urban decay, sprawls, and extrication of vegetated surfaces, which are quite a common sight. However, adequate planning and development of road infrastructure could be assessed by understanding its relationship with urban expansion and population growth. Road infrastructure could be appropriately planned and developed for urban expansion and population increase while mitigating urban and transportation problems. To this end, this study aims to shed light on an improved understanding of urban expansion and transportation interaction in an African context, considering the sharp increase in population and unprecedented urbanization witnessed, accompanied by transportation situations. While the specific objectives of this study are 1, to delineate the land use and land cover (LULC) variations of the Akure metropolis to help situate the temporal road additions and 2, to analyze the road networks within the same timeframe as the LULC. 3, to examine the road density in line with the network analysis, and 4, to determine the population increase per Km-road addition and population density per hectare built-up expansion. Consequently, the study estimated the city’s road stock (RS) in the Akure metropolis, its corresponding spatial change in urban size, and its population change over the years to determine the relationships among them. Information from this study can help planners identify, plan for, develop, and protect vegetation and prevent sprawls, urban decay, and traffic congestion through well-planned road infrastructure in consonant with urban growth and population increase patterns.
Literature review
UNDESA (2022) Population Division prospects that the World population, which stood at 7.942 billion in 2022, will be 8.512 billion by 2030 and expected to be 9.687 billion by 2050. Sub-Saharan Africa (SSA) currently accounts for 1.152 billion of the World’s population, predicted to hit 1.401 billion and 2.094 billion in 2030 and 2050, respectively. UNFPA (2016) recorded that SSA has the population growth rate of all the regions of the World, and Nigeria is arguably the highest in the SSA region (UNFPA, 2014; Faiyetole, 2019). Similarly, according to an OECD (2020) study, Africa has the fastest urban growth rate in the world. By 2050, an additional 950 million people will live in African cities, evolving from the growth witnessed in small and medium-sized towns. Indeed, the UNDESA (2022) World Urbanization Prospect shows that populations in rural areas are declining as people migrate to urban areas for economic opportunities. Thus the urban population is increasing at an equal but opposite rate fashion. Guneralp et al. (2017) posit that despite the high rates of urban population growth, many African countries still have a high sequence of urban primacy; for example, no required infrastructure like good connective and motorable roads to meet the travel needs of the booming population, when available, are concentrated in one city, usually, the capital, which are several times greater than the next largest city. They further opine that most African cities are undergoing high urbanization rates, and the processes are characterized by unplanned and unregulated growth. Consequently, according to OECD (2020), this urban growth needs to be planned with the requisite infrastructural investments, for example, in road transport or policies to cater to this growth and attendant challenges. Considering that road transport accounts for about 90% of passenger movement and 80% of goods in Africa (Sabar and El Hammoumi, 2020), swift, unplanned, and unregulated urbanization will introduce and make a significant negative impact on traffic congestion, road accident and incident, increase pollution, and travel cost. Faiyetole and Fulani (2020), among others, recommend using smart or intelligent transportation technologies to help reduce the mentioned transportation problems that evolve due to unplanned urban population growth (Echendu and Okafor, 2021; Faiyetole, 2019, 2020). Other urbanization challenges that result from unplanned and unregulated population growth could include the development of sprawls, urban decay and slums. Thus, considering the sharp increase in population on the continent is a driver of the unprecedented urbanization being witnessed, with accompanying transportation situations, it necessitates a study that could shed light on an improved understanding of urban expansion and transportation interaction in an African context, towards an informed planning and regulation scenarios.
Road transport is the most widely used form of mobility, which provides high flexibility, requires low capital investments, and is suitable for short-distance journeys (Sorensen et al., 2021; Kurenkov et al., 2019; He et al., 2019). It offers a greener, more efficient, and safer future through the use of intelligent transport technologies (Faiyetole and Fulani, 2020; Faiyetole and Jegede, 2019; Skeete, 2018; Wang et al., 2022a) and channels the spread of infectious diseases through interstates, state-wide, and intra-community trips (Okeke et al., 2022; Faiyetole, 2022; Rojas-Rueda and Morales-Zamora, 2021; Gaskin et al., 2020; Carrington, 2020). Unique accessibility, such as door-to-door transportation services, includes various means of alternatives, such as cars, buses, trucks, motorcycles, bicycles, and others (Tchanche, 2019; Fremont and Franc, 2010). Road network expansion increases accessibility at the urban or regional level and alleviates traffic congestion, potentially generating additional travel (Afolabi et al., 2018). Humans, regions, nations, and the world would severely harshly limit development without ample motorable road transport networks (Maity et al., 2021; Gavanas, 2019; Oyesiku, 2002). The locations of different land-use activities and their need for interactions demand road transportation networks (Wang et al., 2019). Indeed, Yin et al. (2011) showed that various land uses could change from their natural uses; for example, forest land could change to other services, such as transport, residential, and commercial. However, LULC change is a slow process and is probably the most significant Earth challenge over the years.
Significant changes in land use, mainly through extensive agriculture and built-up areas, severely impact LULC patterns globally (Naikoo et al., 2020; Mishra et al., 2020). Costanza et al. (2014) categorized Nigeria LULC into eight classes: agricultural land, forest, grassland, shrubland, wetland, water bodies, built-up areas, and bare ground. Land-use types vary from one geographic region to another. The land-use pattern in rural areas is markedly different from that in urban areas. Thus, the LULC differs from location to location (Soteropoulos et al., 2019). Generally, the evolution of these built-up areas will continue in the coming decades, although there is uncertainty about the expansion rate. High population growth and rapid development have resulted in highly energetic land-use changes. Cities have changed from small, isolated population centers to more prominent, interconnected economic, physical, and environmental features (Avicedo, 2013). Transportation and communication land-use infrastructure and other factors such as public policies are drivers of urban growth (Fertner et al., 2016; Aljoufie et al., 2011; Carruthers, 2002; Hart, 2001), mounting pressure on the city’s sustainability (Liu et al., 2021).
Urban locations have a relative advantage where different transport routes converge with a high degree of compactness, connectivity, density, length, and accessibility exhibited within the intra- and inter-urban road networks (Wu et al., 2020; Zeng et al., 2019; Sreelekha et al., 2016); such transportation systems have reduced commuting costs and encouraged urban scattering (Shi et al., 2019; Jackson, 1985). Avoiding such improvements impacts housing prices and urban sprawl development (Luthuli et al., 2021; Fertner et al., 2016). Urbanization increases travel demand, and it causes pressure on transport infrastructure, hence, traffic congestion (Poku-Boansi, 2021). Consequently, causality and reciprocal effects are apparent characteristics of urban growth and transportation system relationships. Aljoufie et al. (2011) show the relationships among the four main inferred aspects of the common causes of urban growth: transportation infrastructure, travel demands, population, and land-use change, and adapted into Figure 1, which encompasses the objectives of this study as shown in the Introduction section. The reciprocal relationship between the city’s RS and land-use change. Source: Adapted from Aljoufie et al. (2011).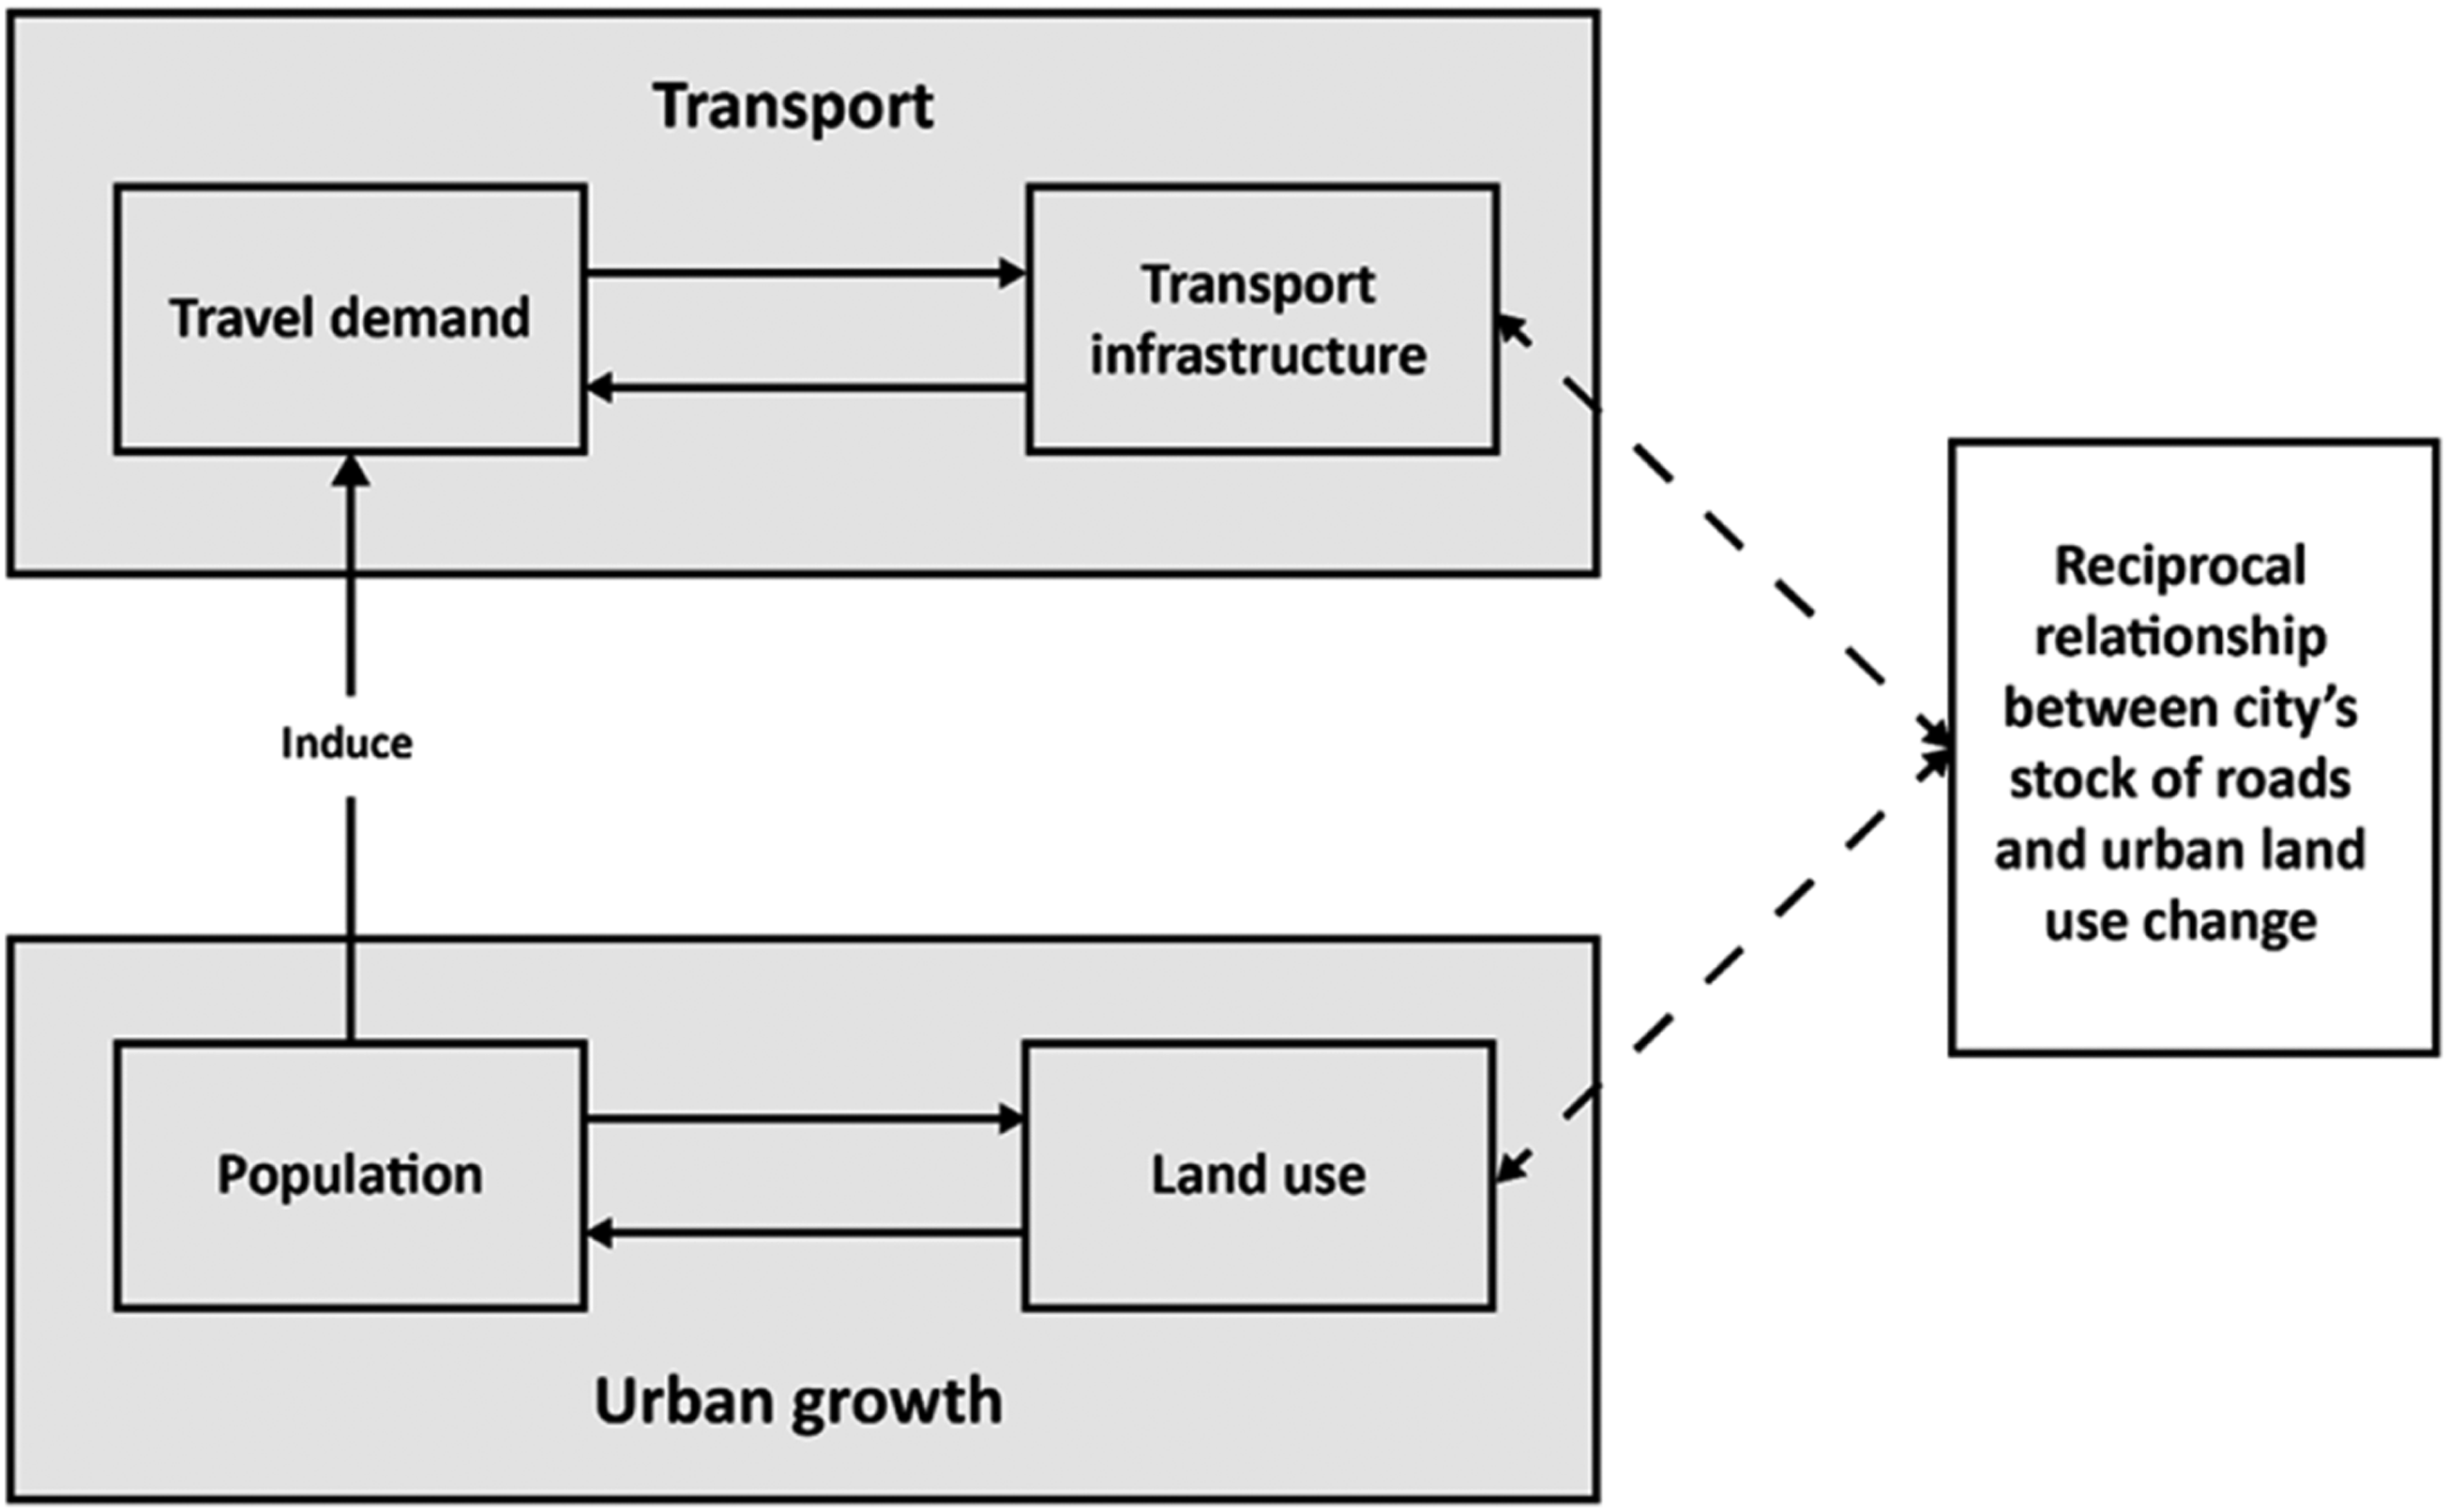
Materials and Methods
Following Colin Buchanan’s Traffic in Towns (MoT, 1963) seminal work that laid the basic principle for road classifications, road hierarchical structure has evolved, in geographical scale or functional distribution, that is, as land service access or traffic functions (Goto, 2016; Macbeth, 2007), such that road hierarchy differs from place to place (Marshall, 2004), and sometimes emerged rather than defined (Tsigdinos et al., 2022). Eppell’s et al. (2001) four-level road hierarchy is of interest to this study, where road purpose, function, management, and design are holistic. The road hierarchy based on functions is of particular interest, classified into four levels: the arterial and distributor roads, the collector, and the local streets (Wang et al., 2018). In Akure, the arterial road includes federal roads and arterials, which carry long distances through traffic external to specific regions, comprising movements between the city and other cities. The federal highways inclusively provide interstate and regionally and nationally significant movements. The main distributors, also called urban roads, carry the city’s most traffic volume, connecting collector streets and arterial roads. Local distributors collect and distribute traffic from the street to the main distributors.
In contrast, the local streets are generally smaller than urban roads and carry lower traffic volume. They provide direct access to properties, pedestrians, and local cycle movements (Paraphantakul, 2014; Eppell et al., 2001). Regarding the road design hierarchy, roads in the study area are made with different materials. Roads in the new areas, especially the collectors, are temporary earthen roads constructed from ordinary soil or laterites. Gravel roads are like earthen roads, but pavements with gravel mixed with soil. At the same time, bituminous roads, known as asphalt, are the study area’s most advanced type of road material. The road networks considered for this study are the totality of all the roads hierarchy observable by the satellite sensor of the data analyzed.
Secondary data from the United States Geological Survey (USGS) and Google Earth was used to analyze the spatial changes. The LULC data from the USGS’s site, while in contrast, satellite imagery data from Google Earth, were downloaded and analyzed to get the trend of the kilometer road expansion over time. The metropolis under study comprises two local government areas, Akure North and South. As a fast-growing metropolis, the urban area in 2018, the ending year of this study, was picked to know the Urban Growth Boundary (UGB). A spatial buffer zone of 100 m was mapped out around the UGB to capture the limit of urban expansion (Harig et al., 2021; Zheng et al., 2017). It is consistent with Li (2014), who applied a Geographic Information System (GIS) based buffer analysis to determine a 0–250 m buffer zone around a built-up area to monitor an urban growth process, and Wang et al. (2022b), who used a 20–100 m buffer zone to measure the UBG of 15 districts for a road network and urban population density analysis. Urban development trend analyses from urban simulation scenarios are often on selected years within the range of the starting and ending years (Aljoufie et al., 2011; Molugaram and Rao, 2017; Shi et al., 2018; Tennoy et al., 2019; Zhang et al., 2021; Zhao et al., 2017). Supplementary Table S1 shows that the ranges of years chosen in spatial data analysis were not necessarily equally spaced and could be as discrete as continuous. The starting date for this spatial trends analysis, 1999, was chosen to reflect the starting point of the Fourth Republic in Nigeria when there was a last change of power from the military regime to democratic governance. For subsection continuation, see the “Materials and Methods” section of the Supplementary Materials."
Sources of data, data extraction procedures, and data analytical techniques
Using the Landsat data from the USGS Web site, the study area falls under the path and rows 190 and 055, respectively. The other data details, including the years, sensor types and resolution, and date captured, are in Supplementary Table S2. The Google Earth satellite imagery details used for the Akure metropolis road map, including the satellite sensors, resolution, and time captured, are in Supplementary Table S3. The extracted Landsat data was quantified and projected using the GIS software’s geographic coordinate system of WGS-1984 (ArcGIS Resources, 2014; Hill, 2006; Molugaram and Rao, 2017).
Figure 2 shows the flow process chart for the urban expansion and transportation interaction (UETI) analysis. See the “Materials and Methods” section of the Supplementary Materials for continuation under the “Sources of data and data analytical techniques,” “Data extraction procedures for Landsat and the Google Earth Imageries,” and “Processes to generate the road density maps” subsections. The flow process chart for urban expansion and transportation interaction analysis.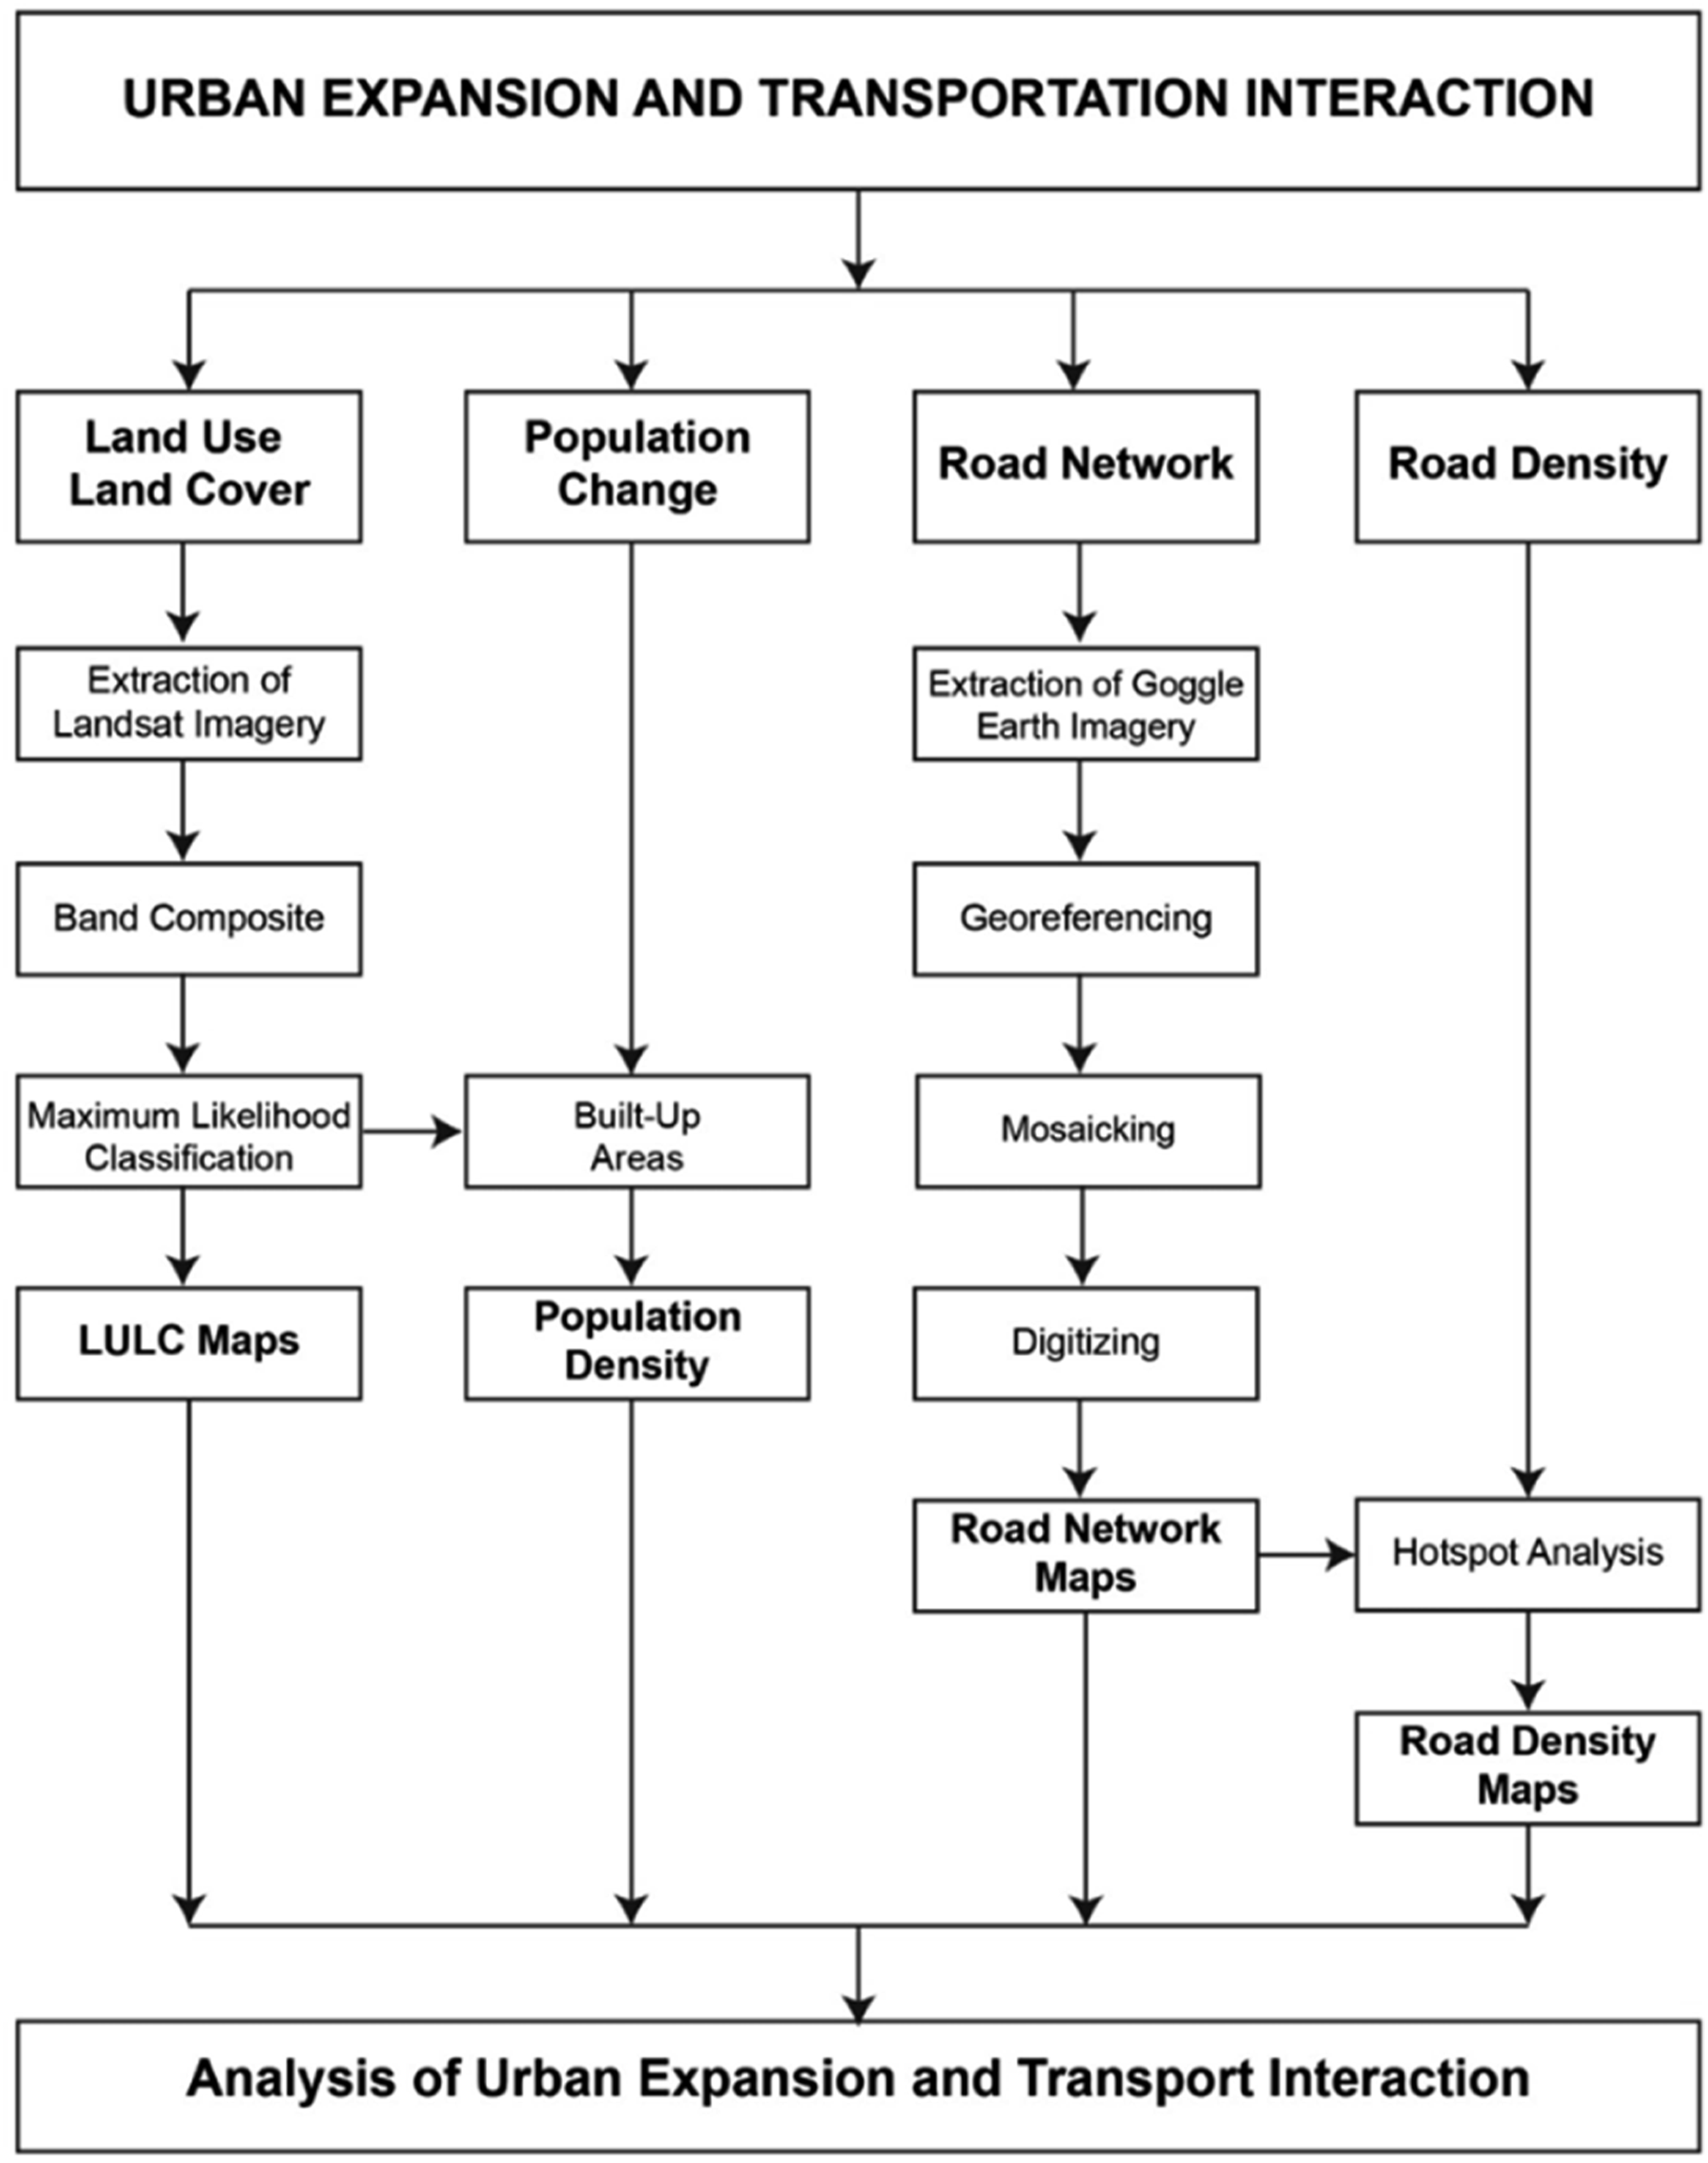
Results and discussion
This section shows and discusses the results of urban spatial change, the quantification of the road network expansions, and population change over time in Akure.
Spatial assessment of urban size in Akure metropolis
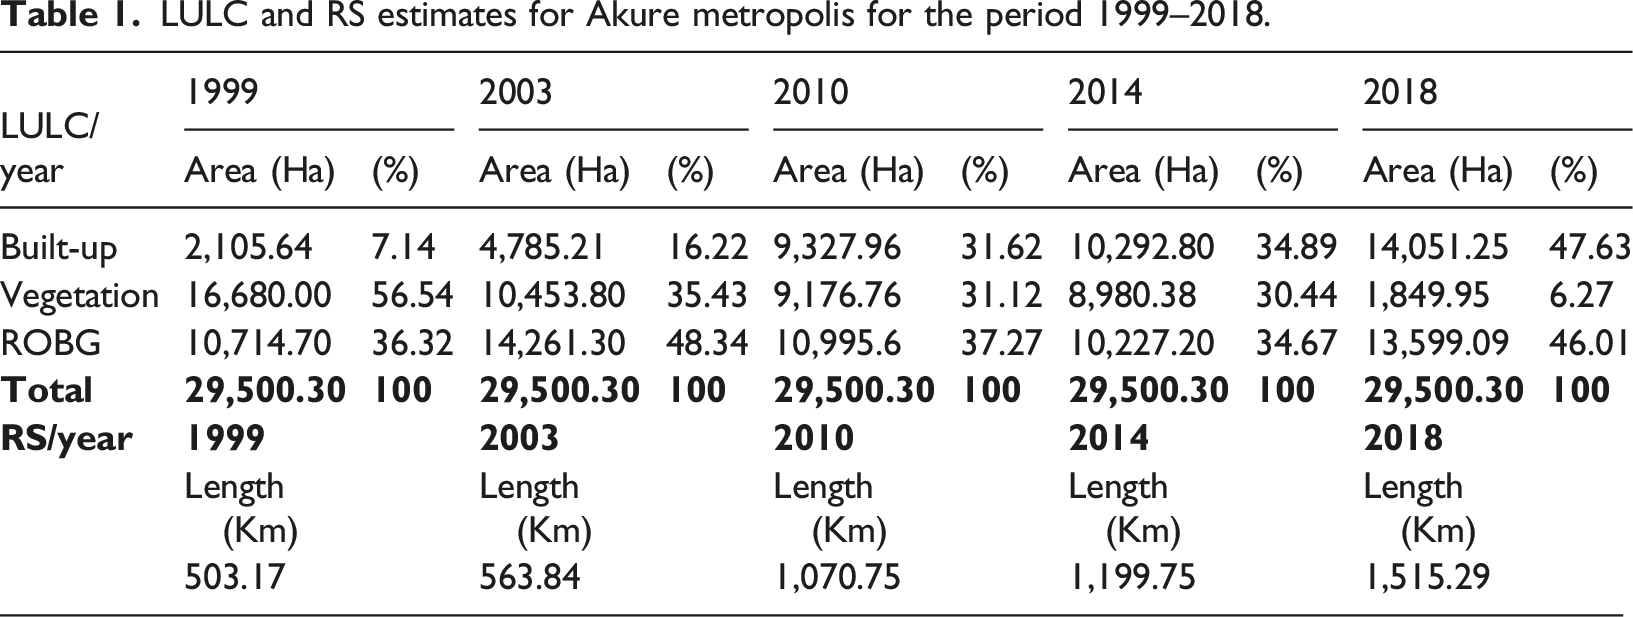
LULC and RS estimates for Akure metropolis for the period 1999–2018.
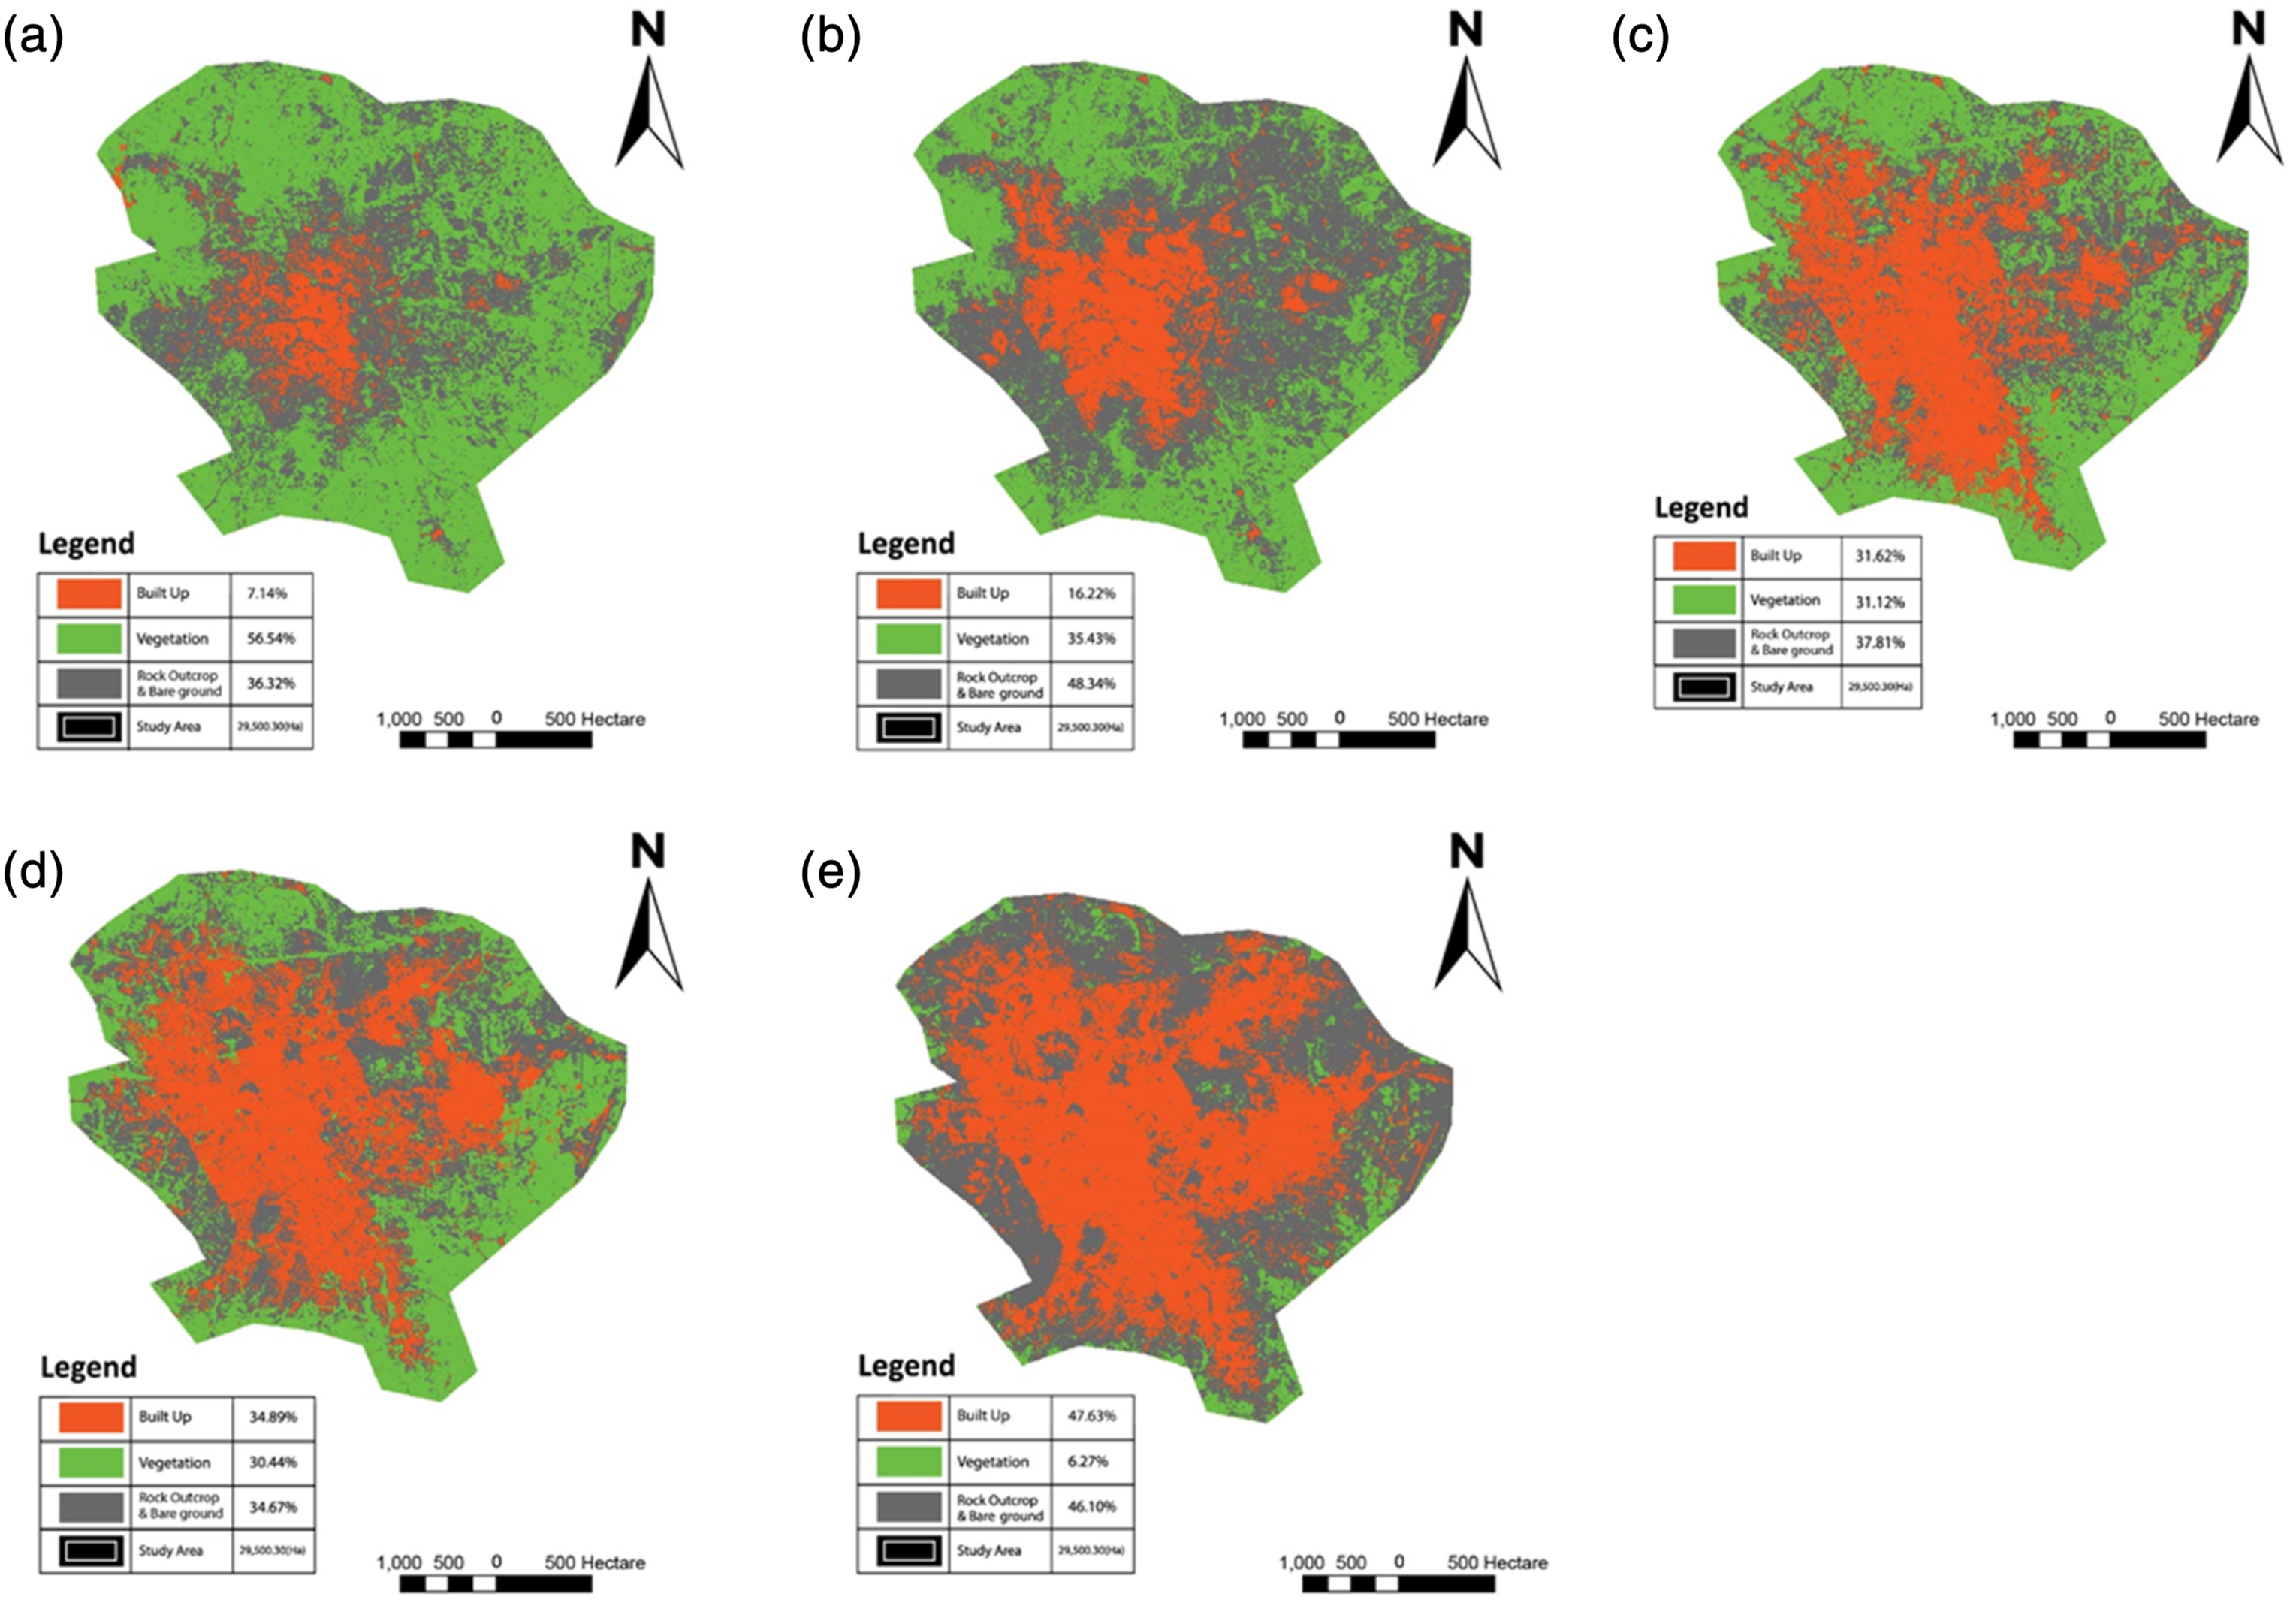
The LULC Maps of Akure for the year (a) 1999, (b) 2003, (c) 2010, (d) 2014, and (e) 2018.
The significant variations in the LULC types in this region are built-up areas (orange), vegetal cover (green), and ROBG in gray, as shown in Figure 3. In Table 1, in 1999, the dominant LULC type was a vegetal cover, taking (56.54%) of the total urban area, followed by ROBG (36.32%) and built-up (7.14%). Most of Akure’s commercial and administrative developments are concentrated at the city hub, but the recent residential developments are towards the periphery. Vegetation is a crucial element of the Earth’s biosphere and is reflected in the millennium development goals in MDG7 (United Nations, 2015), impacting humans’ activities with rippled effects on the LULC variations. The sustainable development goals (SDGs 11 and 13) deal with the impacts of sustainable cities and climate change (UNDP, 2022) on vegetation variation. Rock outcrop was also significant in 1999 because developments in the study area took a new turn, increasing the ROBG. In 2003, there was a considerable expansion in the built-up areas since the metropolis began to attract development and consequently fascinated the attention of investors, which in return led to a higher rate of immigration from the rural and suburban areas into the metropolis. The Fourth Republic had just had its first successful transitional democratic election, with confidence and enthusiasm for a sustainable Republic (The Carter Center, 2003). In 2010, built-up expanded by (31.62%). The built-up areas in 2014 increased to (34.89%), while in 2018 (47.63%), became the dominant land use.
Trend analysis of the LULC
The LULC change trend analysis shows in Figure 3 that the expansion in the built-up area is concentric, from the core towards its periphery. Moreover, consistent with Clarke et al. (1997), urbanization will likely occur more rapidly around the edges of the existing urban centers. The LULC trend analysis in the Akure metropolis spatial variation is shown in Supplementary Table S4, and the LULC change index was calculated using Supplementary Equation S1. The total built-up area more than doubled by (127.3%) from 1999 to 2003 because of the rapid conversion of surrounding vegetal cover for infrastructural development, whereas vegetation decreased by (37.3%), while the ROBG increased by (33.1%). The built-up growth rate from 2003 to 2010 was (94.93%); 2014 had a growth rate of (10.34%) in 2010, while the growth rate in 2018 from 2014 was (36.51%). These statistics are shown in Supplementary Table S4 and Figure S13. The Akure urban growth rate from 1999 to 2018 was (567.32%), vegetation cover declined by (88.91%), while the ROBG increased by (26.92%). Further showing that the expansion of the built-up areas is mainly because of the conversion of vegetation and ROBG into various urban land uses, consistent with Bloch et al. (2015) and Yin et al. (2011). So, as the population increases, there is a demand for urban development to meet anthropogenic needs. The built-up area expands, allowing more residential, industrial, mining, interior urban green zones, and transportation infrastructure.
Spatial distribution of the Akure metropolis’ stock of roads
This section quantifies and discusses the total observable road stock in the metropolis.
Change in cities’ stocks of road
As depicted in Figure 2, Google Earth maps data of Akure was extracted, georeferenced, mosaicked, and digitalized. The analysis shows an increase in the city’s road network over time in Akure, from 1999 to 2018, as shown in Table 1 and Figure 4. The total length of the road in 1999 was 503.17 Km and increased to 1,515.29 km in 2018. Consequently, the total increase in the city’s stock of roads from 1999 to 2018 was (201.15%). Road network Maps of Akure for the year (a) 1999, (b) 2003, (c) 2010, (d) 2014, and (e) 2018.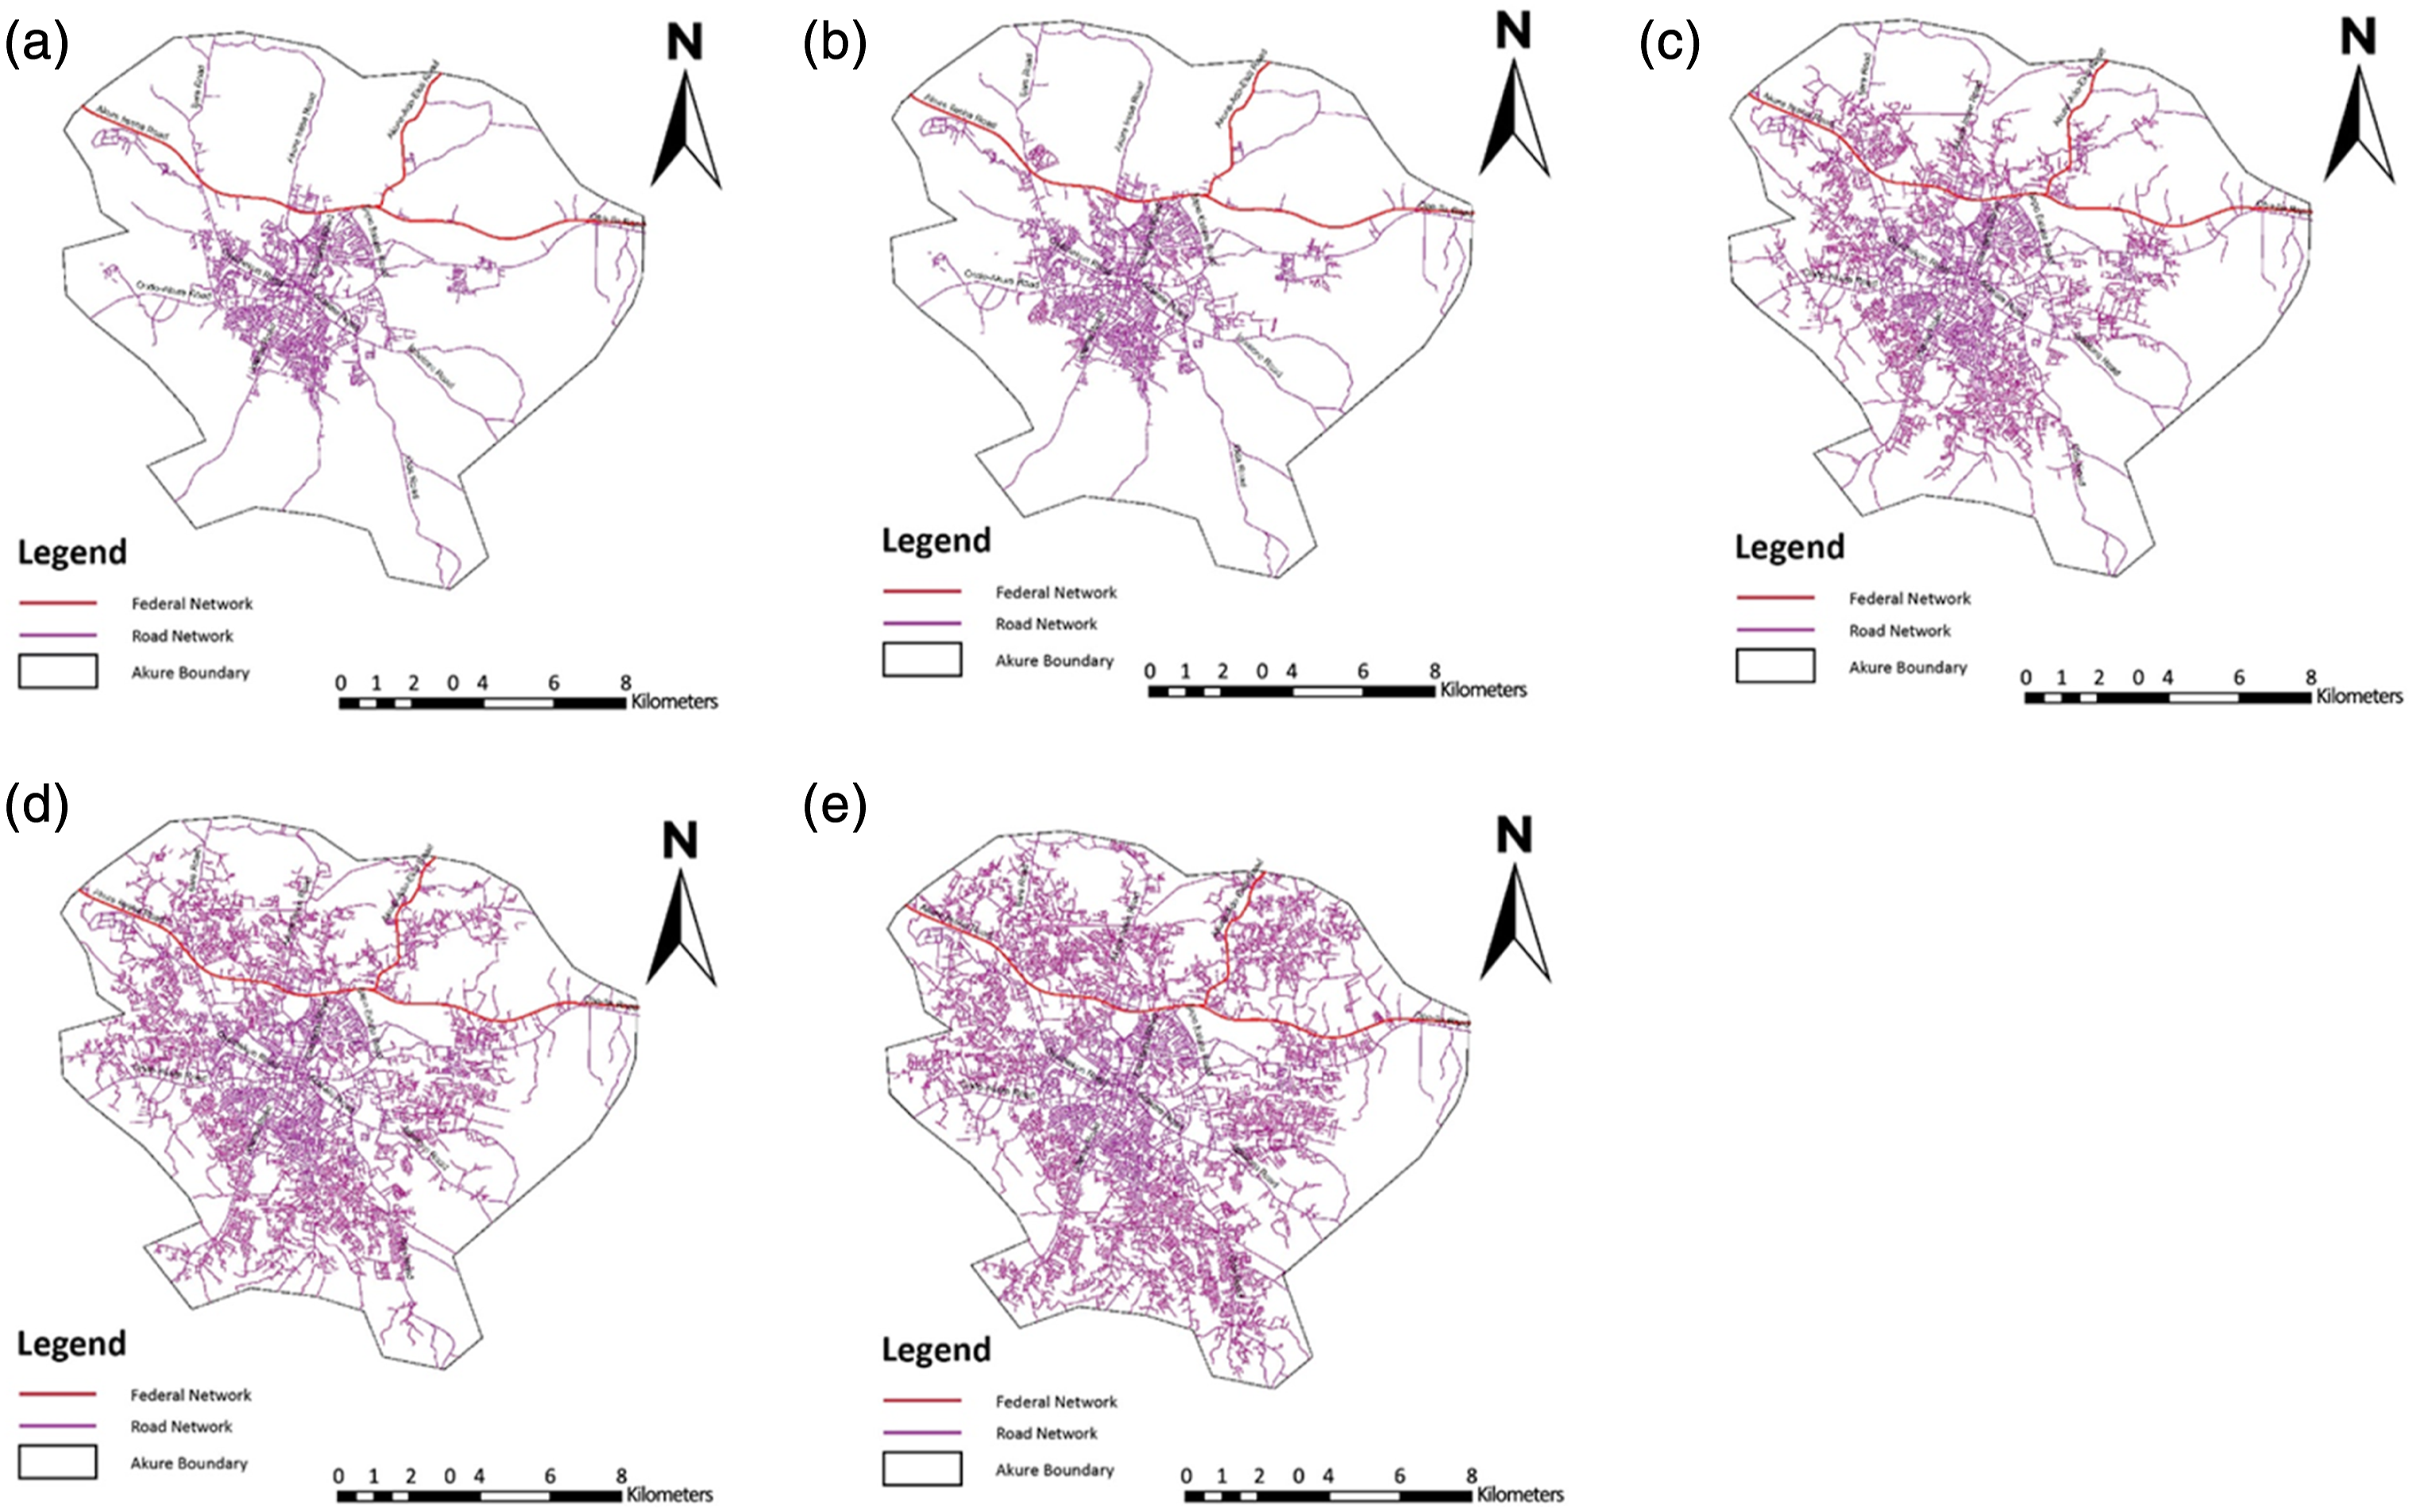
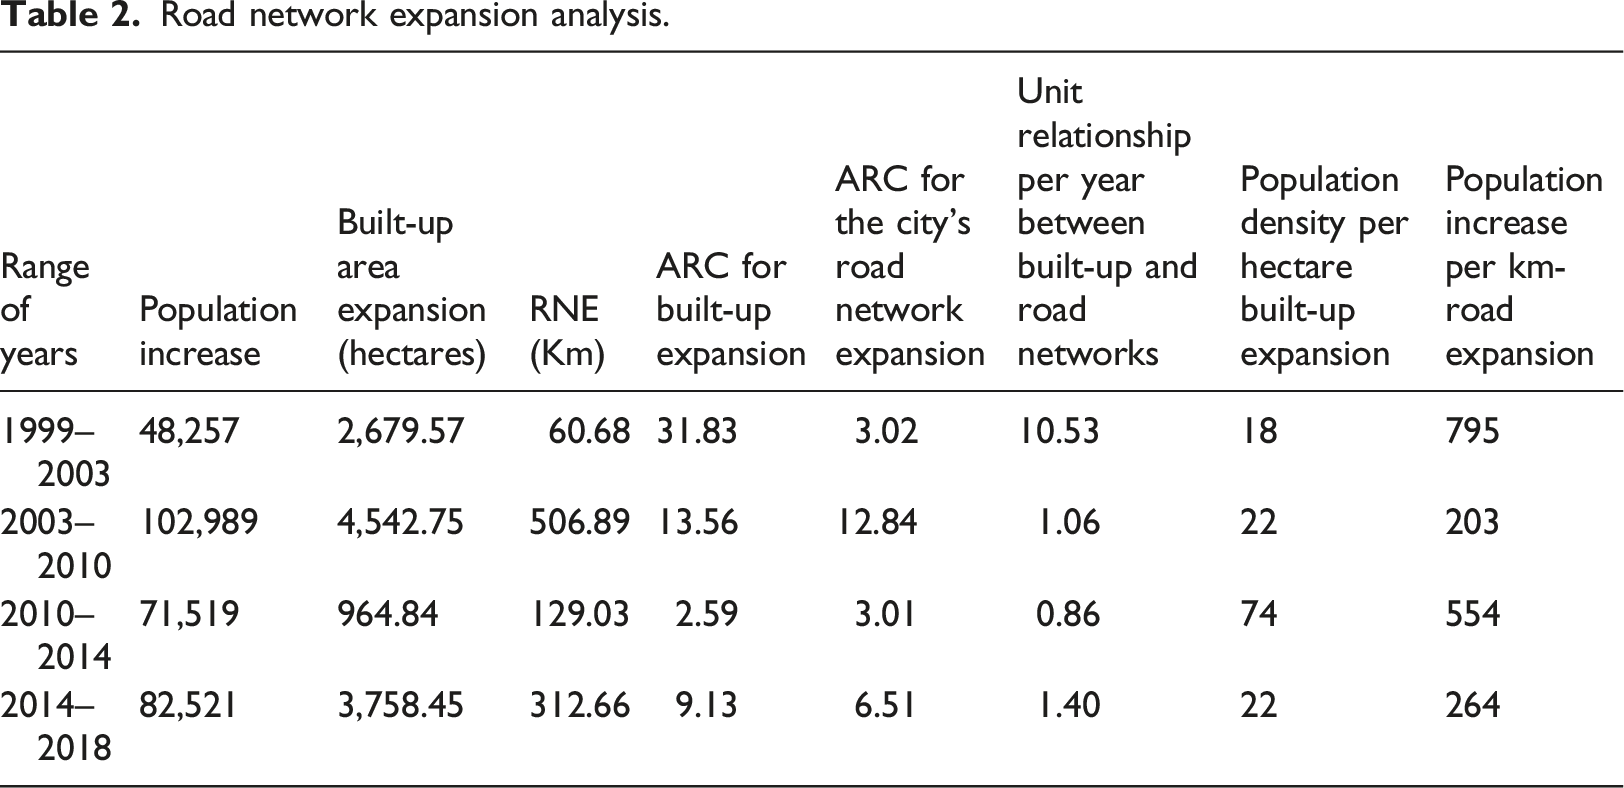
The road network expansion rates
Road network expansion analysis.
Spatial distribution of the road density in Akure
The visual interpretation of the maps illustrated in Figure 5 reveals the road density of Akure. They are either high-density road networks, medium or low, and are represented with Red, Orange, Yellow, and Green color gradients. Road density distribution in Akure metropolis (a) 1999, (b) 2003, (c) 2010, (d) 2014, and (e) 2018.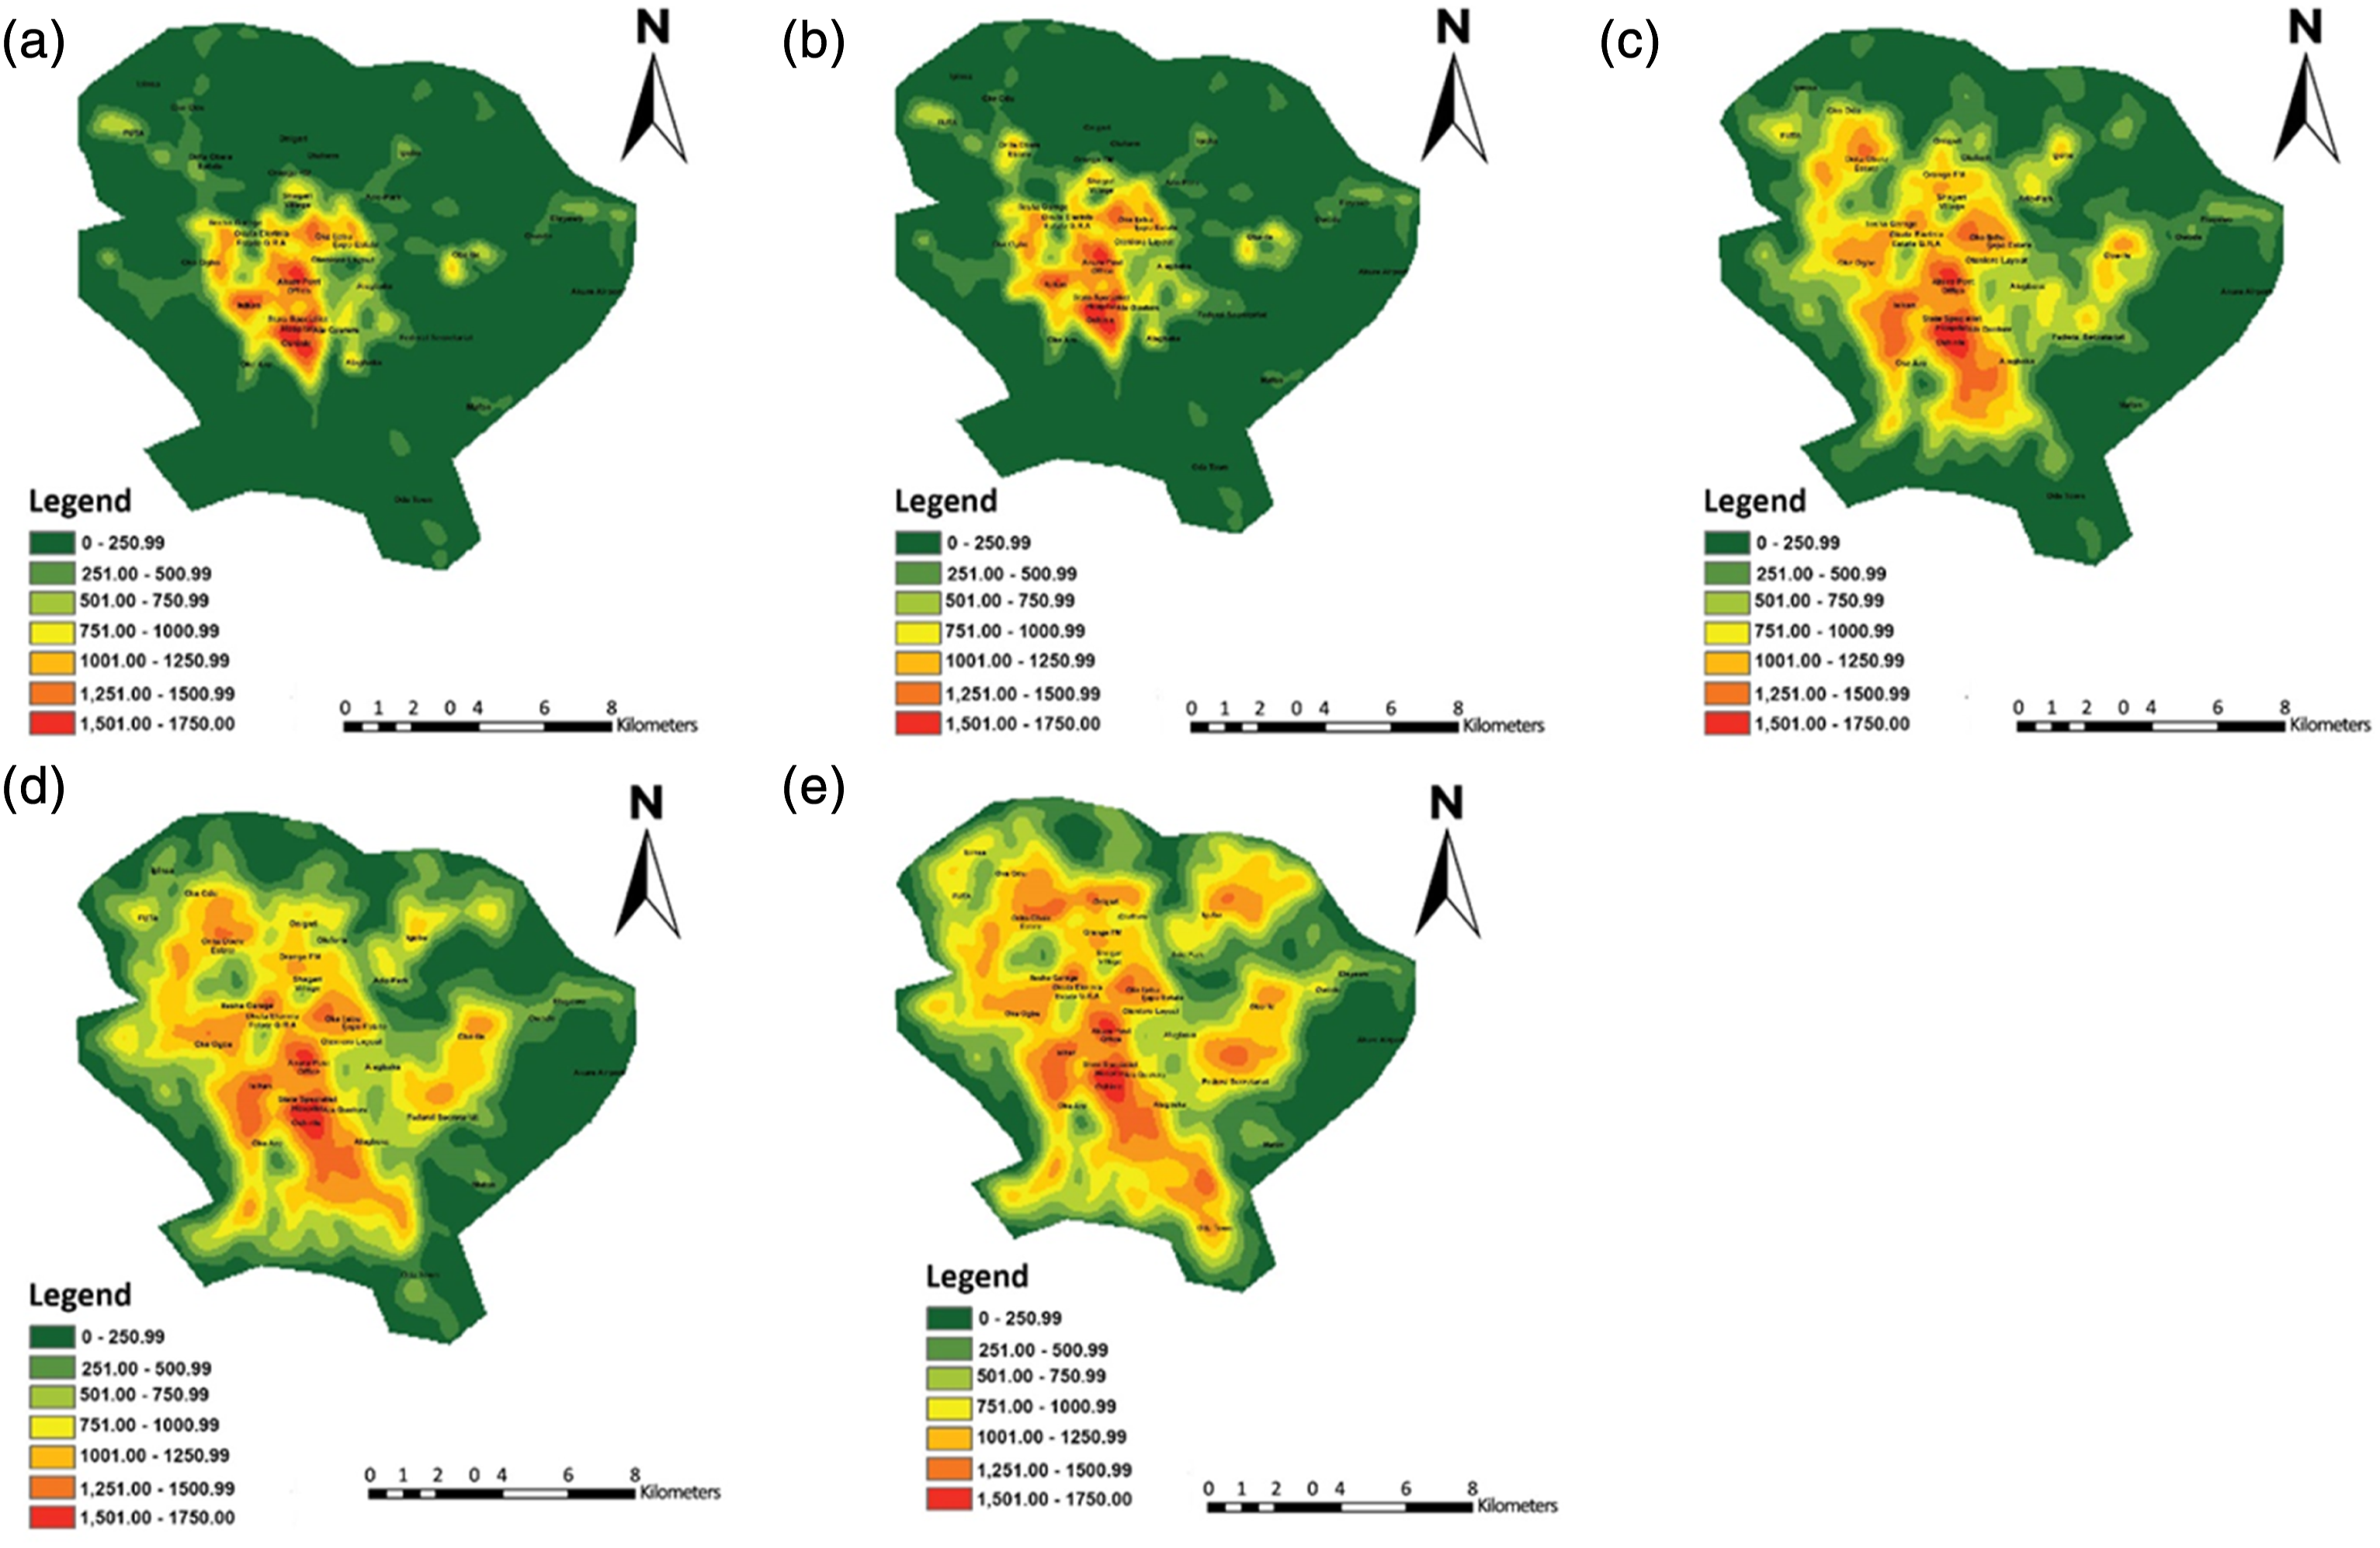
In 1999, roads were concentrated at the city core and continued to expand to its periphery. Just like in Figures 3 and 4, the more the urban area extends, the more expansion of the road networks is seen, consistent with Friedricha (2017) that urban areas and road networks as cause and effect. Figure S1 is the map of the Akure metropolis showing some of the areas within the study buffer. In 1999 it experienced a high concentration of urban development in some areas with high road density. That is Oja Oba, the King’s Palace market area, represented by the Post Office, the city hub with Isikan, and Oshinle, with hotspot density ranging from 1,251 to 1,750 km/km2.
Meanwhile, Ilesha Garage, Oke-Ogba, Oke-Ijebu, and Ijapo Estate fell in the second highest road density category, ranging from 1001 to 1,250 km/km2. Areas within the third highest road density coverage were scattered in the periphery of hotspots with densities between 501 and 1,000 km/km2 and were mainly distributed in suburban areas. These sparsely populated areas have low urban activities, including Alagbaka, Shagari Village, FUTA road, Oba-Ile, and Oke-Aro. See the “Results and Discussion” section of the Supplementary Materials for the continuation of “Spatial distribution of the road density in Akure.”
Population increase per km-road and density per hectare built-up expansion
Table 2 also shows the population increase per Km-road expansion (PIKRE) and population density per hectare built-up expansion (PDHBE). An increase of (60.68 Km) translates to a (795) population increase per Km-road expansion from 1999 to 2003. The population density per hectare built-up expansion for the same period is 18. A remarkable increase in the road expansion rate from 2003 to 2010 was observed, such that the PIKRE was (203) and PDHBE (22). Urban road expansions witnessed an increase of (129 Km) from 2010 to 2014, with an attendant (554) people in the one-km road addition, while for every hectare of expansion in the built-up area, (74) people were found occupying. The population density rate between 2014 and 2018 is similar to that observed from 2003 to 2010, while the population increase regarding a kilometer road expansion is 264.
Correlation strength of the urban expansion, the road network, and population increase variables
Output data for the built-up area and road networks, as shown in Table 1, and population data were quantitatively subjected to bivariate correlation analysis. The results are shown in. Supplementary Table S5 The three variables here show robust and positive correlations with equally solid significant values with each other. Consequently, the preceding inferences are well-informed. However, to determine if there are any causal effects among the variables, the correlation statistics will be inadequate; therefore, the variables data must be subjected to regression analysis.
Impact of road network addition on population increase and urban expansion in the Akure metropolis
Causal effects of road network addition on population increase and urban expansion.
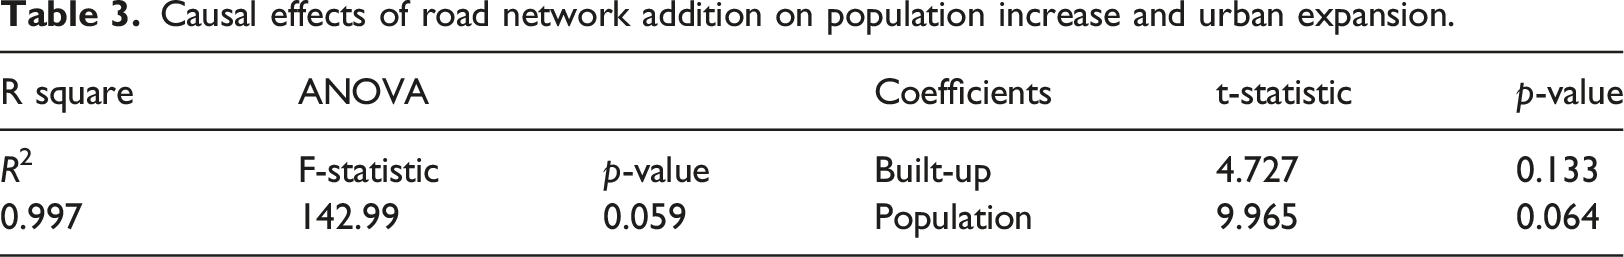
With an R square value of 99.7% and the significant p-value (0.059) at α = 0.1 of the analysis of variance (ANOVA), the model adequately fits the data. The result shows that at a 10% significant level, an expansion of the road network caused a significant increase in population at (p = 0.064), which supports the Duranton and Turner (2012) hypothesis on the causal relationship between interstate highway infrastructure and job creation, that is, employment, for instance, but in this case, population increase. However, no noticeable causation exists between road networks and urban expansion. This result is at variance with Aljoufie et al. (2011), suggesting that other factors beyond road infrastructural addition could potentially lead to urban expansion and population increase in the study area. According to Clark et al. (2002), pure economic growth and development of social infrastructural amenities are major drivers of urban growth, developing the economy and creating jobs, for example, while Glaeser (2000) stresses non-market measures like crime, education, beautification or provision of public goods for all the citizens like schools or parks (Myeong et al., 2018). Social infrastructural amenities and employment, like schools, security, and jobs, could contribute to urban expansion in the Akure metropolis.
The evolution of the city and its growth patterns: evidence from the study
From urban growth and the city’s RS to road density, all the parameters concentrically expanded sparsely to the periphery. For example, with every unit increase per year in the city’s stock of roads, the total built-up area has a consequent 2.82 unit times expansion to the periphery. Road infrastructure in the study area takes 40% of the total built-up area in the period under analysis. Thus, a 60% difference is plausibly captured in the remaining urban structure, such as residential, commercial, industrial, and urban green spaces.
From Table 2, the 1999–2003 range of years connotes that for a 10.53 unit expansion in the built-up area (the highest), only a unit expansion in roads was found and that fewer people (18) per hectare of urban expansion but with a greater number of people (795) per Km-road expansion was detected. The first phase of the new democratic dispensation, the Fourth Republic, had just started, with a new polity, persons, and policy (P 3 ). Most state governments, including Ondo State, had more political issues to grapple with than focusing on infrastructural development. Hence, a low rate of additional road infrastructure despite the urban expansion. See the “Results and Discussion” section of the Supplementary Materials for continuation under “The evolution of the city and its growth patterns.”
Sustainability, resiliency, and urban and transport planning
The findings are significant because they help inform us about how the city evolved and grew, with information to help guide policymakers and urban and transport planners to plan complementary road infrastructure for growing cities and expanding urban areas within the finite landscape. It is pertinent because built-up areas may extend toward the periphery, only to the point of the city limits, until the city becomes built and saturated. On the contrary, the population will continue to increase, considering that African countries’ population is the fastest growing. Nigeria has the continent’s highest growth rate (2.8) (UNFPA, 2016; Faiyetole, 2019). Thus, at some point, the city would be built and saturated. To slow this process and ensure cities grow without attendant problems such as traffic congestion, urban decay, or sprawls in the periphery, continual urban renewal, that is, conscious efforts on sustainability and city resilience, is imperative. It implies urban, and transport planning has to be deliberate about integrating and implementing resilience and sustainability parameters, such as extending connective, motorable RS and complementary road furniture outside the city centers in direct response to evidence-based projections every fiscal year to continuously attract people to the periphery, thereby helping to solve traffic congestion, urban decay and unplanned sprawls. Particularly in Akure, policymakers could develop an institutionalized urban and transport planning framework that works irrespective of any political dispensation, polity, person, or policy to ensure no external shocks to the urban and transport blueprint.
Conclusions
Even though there are higher quality satellite data than the readily available Landsat and Google Earth imageries used, the study still yields relevant results. For the approximately 20 years of evaluation, the estimates are reliably informative for the urban change in space and time. In 1999, Nigeria’s Fourth Republic began with promises for the citizens after a horrendous military era. Thus, the first 4 years until 2003, culminating in the first electioneering period afterward, witnessed urban growth with an inflow of new residents seeking opportunities in the state capital but a lower additional stock of roads. As the polity stabilized, the metropolis’ stock of roads increased. It increased almost as fast as the urban expansion, from 2003 to 2010, 2010 to 2014, and 2014 to 2018, however, with no evidence of noticeable significant causal effects.
On the contrary, road network expansion shows a causal effect on population increase. Thus, with additional roads, proof of causation of population increase in the Akure metropolis was detected. The results show that urban centers expand rapidly from the core with abundant land resources at the periphery. This study further indicates a heavier road density, slightly reduced from the core, as the city expanded. Considering that the population grows despite a slow pace in infrastructural development in a finite space, it is recommended that sustainability and resilience parameters are intentional with the urban and transport planning.
Limitations of the study: The study’s limitations include the inability to source sufficiently high-resolution satellite data optimized for constructed tarred or bituminous roads. The lack of funding was mostly an impediment.
Future research: The failure to access higher resolution satellite data leaves a gap in quantifying built bituminous roads, and so could not evaluate the impact of the government’s fiscal budgets on the road infrastructure.
Supplemental Material
Supplemental Material - Urban expansion and transportation interaction: Evidence from Akure, southwestern Nigeria
Supplemental Material for Urban expansion and transportation interaction: Evidence from Akure, southwestern Nigeria by Ayodele Adekunle Faiyetole and Victor Ayodeji Adewumi in Environment and Planning B: Urban Analytics and City Science
Footnotes
Acknowledgements
The authors express their gratitude towards the reviewers for their meticulous evaluation, which has undoubtedly enhanced the caliber of the paper.
Declaration of conflicting interests
The author(s) declared no potential conflicts of interest with respect to the research, authorship, and/or publication of this article.
Funding
The author(s) received no financial support for the research, authorship, and/or publication of this article.
Supplemental Material
Supplemental material for this article is available online.
![]() , and he was recognized as a recipient of the Todd B. Hawley Space Visionary Award.
, and he was recognized as a recipient of the Todd B. Hawley Space Visionary Award.
References
Supplementary Material
Please find the following supplemental material available below.
For Open Access articles published under a Creative Commons License, all supplemental material carries the same license as the article it is associated with.
For non-Open Access articles published, all supplemental material carries a non-exclusive license, and permission requests for re-use of supplemental material or any part of supplemental material shall be sent directly to the copyright owner as specified in the copyright notice associated with the article.