
Abstract
School choice programs have grown substantially over the past 30 years, enabling families to make school selections unbounded by their residential locations. While studies document families’ stated preferences for school safety, few quantitatively and comprehensively examine which safety components associate with families’ actual school choices. Leveraging New York City high school applications, I find that families factor multiple dimensions of safety into their school choices. Independent of schools’ academic, demographic, and geographic characteristics, families screen out schools with higher neighborhood and school violence and disorder; and metal detectors in the initial elimination phase of their decisions, and prefer schools in lower violence neighborhoods in the subsequent, more detailed decision-making phase. Families’ choices suggest variation in safety priorities by race and academic background. White, Asian, and higher-achieving students prioritize protection from neighborhood and school violence; Latine and Black students particularly prioritize lower school disorder; and White students ranked schools with metal detectors lower.
Keywords
School choice programs have expanded significantly over the past 30 years. These programs include open enrollment districts, magnet and charter schools, and vouchers to attend private schools (Lareau & Goyette, 2014). Some 50% of parents in urban cities indicate that their district allows them to select non-residentially assigned schools, and 16% attend non-neighborhood public schools (National Center for Education Statistics, 2020a). Most states have recently introduced or passed legislation further enabling families to access public and private schools of their choice (Dimarco, 2023). The school choice model presumes that (1) families choose the highest quality schools for their children; (2) in response to competition for students, schools improve their quality or risk closure; and (3) all students benefit by attending higher-quality schools and gaining better socioeconomic outcomes (Betts 2005; Chubb & Moe 1990). As such, the outcomes of the school choice marketplace depend on families’ school selections.
A large segment of research examines families’ evaluations, preferences, and choices for schools by their academic outcomes, demographics, and geography (Denice & Gross, 2016; Glazerman & Dotter, 2017; Hailey, 2022a; Harris & Larsen, 2023; Houston & Henig, 2023). Families, however, identify safety as a primary consideration for their educational decisions alongside or, in some cases, above academics and travel time (Billingham et al., 2020, 2024; National Center for Education Statistics, 2020b; Pattillo, 2015). Policymakers also promote school choice programs as a solution for students to access safe schools (U.S. House Committee on Education and The Workforce, 2022; US Department of Education, 2004). Yet, we are only beginning to understand how safety shapes families’ actual school selections.
In this study, I use New York City (NYC) students’ high school choices to examine the role of safety in families’ school selections. 1 Since families use varying definitions of school safety (Billingham et al., 2024; Hamlin, 2020; Posey-Maddox et al., 2021), I opt for a multidimensional framework of school safety. Building on evidence that neighborhood and school violence “push” students away from schools (Burdick-Will et al., 2023, 2021) and that low neighborhood violence “pulls” students toward schools (Denice & Gross, 2016), I operationalize safety not only as violence surrounding schools, but also include measures of school-based violence, disorder, socioemotional climate, and school security apparatuses. I specifically ask: How do neighborhood violence, and school violence, disorder, climate, and security measures relate to students’ school choices? How do these relationships vary across students’ race, class, and academic performance?
According to my findings, families factor multiple dimensions of safety into their school selections. Independent of schools’ academic, demographic, and geographic characteristics, when constructing their applications, families avoid schools where students may be exposed to higher levels of violence surrounding schools; higher rates of within-school violence, disorder, and bullying; lower socioemotional support; and metal detectors. Among schools included on their applications, families prefer schools located in lower violence neighborhoods. Families’ choices demonstrate variation in safety priorities across student backgrounds. Relative to their peers, White and Asian students place a higher priority on avoiding schools located in violent neighborhoods, and Asian and higher-achieving students place a higher priority on avoiding schools with higher school violence and that teachers perceive as disorderly. Black students’ school listings and Latine students’ school rankings reflect particular concern over school disorder. White students list schools with metal detectors notably lower on their applications.
These findings contribute to the school choice literature by illuminating how the landscape of violence, disorder, socioemotional climate, and security apparatuses across schools and neighborhoods shape both schooling decisions and the demographic distribution of students across schools. By demonstrating that families consider multiple levels of schools’ socioecological frames in their educational decision, results further emphasize the need for educational researchers to examine larger community contexts surrounding schools (Rich & Owens, 2023). As publicly funded options to choose non-neighborhood schools exponentiate, understanding that multiple components of safety factor into school selections provides insights into families’ expansive school quality conceptualizations as well as the current and future landscape of educational opportunities.
Background
When choosing schools for their children, families consider various school characteristics and personal factors (Lareau & Goyette, 2014; Posey-Maddox et al., 2021). Most families prioritize applying to schools with strong academic curricular and higher student achievement (Denice & Gross, 2016; Pattillo, 2015). They also value schools with extracurricular activities—like sports and music programs—that foster well-rounded development (Harris & Larsen, 2023). Proximity is another critical factor, with families favoring schools closer to home as they consider students’ longer commutes or obligations to work and care for younger siblings (Bell, 2007; Denice & Gross, 2016). Additionally, school demographics, admissions policies, and size often influence school choice decisions (Hailey, 2022a; National Center for Education Statistics, 2020a).
In surveys and interviews, families express that desires for safe environments also predominate their schooling decisions. Three-fourths of parents rate “safety” as very important in their considerations of potential schools—a notably larger proportion than those who rate academics and convenience as very important (53% and 25%; National Center for Education Statistics, 2020b). Families selecting schools often desire more information about safety (Billingham et al., 2024). Recent survey experiments also demonstrate that, accounting for school demographics and academics, families prefer to avoid schools that they deem to be unsafe (Billingham et al., 2020; Hailey, 2025). Although families consistently articulate safety as central to school selections, the concept of school safety is multidimensional and somewhat nebulous.
Multiple Dimensions of School Safety
There is no universally agreed upon definition of school safety in theory or practice. The Federal Commision on School Safety (2022) employs a comprehensive school safety definition that includes violence prevention, bullying, school climate, and school security, alongside other elements that influence student wellbeing. Researchers variably describe school safety as the prevention of crime and violence, student protection from bullying, socioemotional, and physical harm, and/or school members’ sense of school climate (i.e. safety, disorder, relationships; Cornell et al., 2021; Edwards, 2021; Thapa et al., 2013).
When discussing school safety in the context of choosing schools, families highlight at least five dimensions that align with theoretical conceptualizations of school safety: students’ protection from physical violence in the areas surrounding schools, violence in school walls, school disorder, promotion of students’ socioemotional wellbeing, and school security (see Table 1; Billingham et al., 2024; Hamlin, 2020; Lareau & Goyette, 2014; Thapa et al., 2013). Families frequently cite concerns with crime and violence in potential schools’ neighborhoods (Billingham et al., 2024; Pattillo, 2015). They emphasize that commuting to school through violent neighborhoods could expose students to heightened threats of victimization and exposure to detrimental peer influences (Butler & Quarles, 2024). Families also frequently use neighborhood violence as a signal for disorder within the school, and abysmal school quality (Bell, 2007; Phillippo & Griffin, 2016), completely eliminating schools with high neighborhood violence from their choice sets.
Mean Characteristics of New York City High School Safety by Student Preference Rank.

Note: Schools = 372, Student-School Observations = 11,322,581, Students = 6,7364, Average Schools in Student Choice Set = 168. Safety ratings are in standard-deviation units. Averages are means and standard deviations in parentheses. Data are from NYC Department of Education, the NYC Police Department, NY State Department of Education’s Violent and Disruptive Incidents Report (2011/12), and NYC Learning Environment Survey (2011/12). Data include the population of eighth grade students who submitted 2013 NYCDOE public school applications. VADIR = NY State Violent and Disruptive Incident Reporting; NYPD = New York Police; NYCDOE = NYC Department of Education.
Families’ concerns with in-school safety typically center on violence, disorder, and interactions between community members. Their fears about violence center on victimization and exposure to shootings, fights, and weapons within school buildings (Pattillo, 2015; Sattin-Bajaj & Jennings, 2021). Beyond school violence, families articulate desires for schools offering disciplined and orderly classrooms and infrequent bullying (Billingham et al., 2024; Hamlin, 2020). They further emphasize schools’ climate, focusing on whether students and teachers feel safe, supported, and welcomed (Hailey, 2022b; Posey-Maddox et al., 2021).
Families also often assess school safety based on visible security measures, such as metal detectors or security officers (Kimelberg, 2014; Pattillo, 2015). However, depending on the observer and social context, these security apparatuses variably affect families’ judgements of schools’ safety and their school selections (Bachman et al., 2011; Billingham et al., 2020; Hailey, 2025). For instance, metal detectors signal safety and security to some families but disorder and insecurity to others (Hailey, 2025; Shedd, 2015).
As families consider schools spaces where adolescents mature into adulthood, it is notable that students’ exposure to dangerous and disorderly environments within and outside of schools influences their academic and social outcomes (Thapa et al., 2013). Students commuting through violent neighborhoods have higher absenteeism rates (Burdick-Will et al., 2019). Exposure to school violence, disorder, and unsafe school climates links to lower academic achievement and mental well-being, especially among disadvantaged students (Burdick-Will, 2013; Hamlin, 2021; Lacoe, 2020; Thapa et al., 2013). Furthermore, harsh security measures, such as permanent metal detectors, further reduce students’ feelings of safety at school (Gastic, 2011; Perumean-Chaney & Sutton, 2013). Importantly, the effects of schools’ differential safety elements can exacerbate or offset each other. For example, a safe and orderly school climate can shield students from the negative influence of neighborhood violence, while unsafe and disorderly climates can amplify these harms (Crosby et al., 2019; Laurito et al., 2019).
School Safety in School Selections
While families express concerns about multiple dimensions of safety in surveys and interviews, quantitative studies on safety in school selection largely focus on violence. High levels of violence push families away from schools, with students systematically transferring from high-violence schools and avoiding assigned schools in violent neighborhoods (Burdick-Will et al., 2023, 2021). There is somewhat contradictory evidence on whether low levels of violence pull families toward schools. Families in Denver preferred schools with lower neighborhood violence (Denice & Gross, 2016), while some Washington, D.C. families favored schools in neighborhoods with higher violence and lower property crime (Glazerman & Dotter, 2017).
By mostly focusing on violence, these school choice studies conceptually and empirically confound violence as school safety. This conceptualization presupposes that neighborhood crime parallels families’ school safety perceptions. Indeed, families may assume that high-violence neighborhoods have unsafe schools (Billingham et al., 2024; Phillippo & Griffin, 2016). However, neighborhood violence and within-school violence, disorder, and security could represent different forms of conceivable danger. School violence and disorder considers disruptions inside controlled school buildings with known peers, while neighborhood violence measures threats in public spaces that anyone can traverse and that schools do not surveil (Burdick-Will et al., 2019; Cucchiara, 2013). Furthermore, perceptions of safety do not always align with observed violence rates. For example, accounting for actual crime and climate levels, individuals often have magnified perceptions of disorder, violence, and victimization in schools and neighborhoods with larger Black populations (Hailey, 2025; Quillian & Pager, 2010; Sampson & Raudenbush, 2004). Finally, by exclusively operationalizing safety as neighborhood violence, previous studies inherently assume strong association between school safety and neighborhood crime—but this may not be true. Schools could be safe havens in violent neighborhoods or nuclei where violence is concentrated (Crosby et al., 2019; Laurito et al., 2019; Patton et al., 2012). Due to the exclusive focus on violence in school selections, we have limited understanding of which other safety components shape families’ school choices (i.e. disorder, discipline, metal detectors); which environmental elements increase schools’ risk for low enrollment and closure in school choice marketplaces; and which policy levers are needed to attract families to schools.
This Study and Hypotheses
Families’ verbalized preferences provide important insights into their concerns with violence, disorder, socioemotional climate, and security measures within and surrounding potential schools; however, it is unclear whether these safety dimensions factor into families’ actual school selections. In interviews and surveys, families may have manipulated responses due to retrospective sensemaking or used concerns about safety as a socially desirable proxy for desire to avoid Black and Latine schools (Evans, 2021; Holme, 2002). Most importantly, families can decouple stated preferences from constraints in their local educational context. For instance, despite their preferences, schools with low levels of violence may be too far to commute, or families may be unaware of schools with supportive and orderly climates in their local area (Deluca & Rosenblatt, 2010). Unlike hypothetical or retrospective statements, in real choice processes, families must contend with constraints and, consequentially, may not actualize their stated preferences into selections of safe schools. By assessing safety in actual NYC high school choices, this study nuances our understanding of families’ revealed preferences for school safety in constrained environments.
Rather than narrowly defining school safety as violence, this study employs a multidimensional school safety construct as students’ protection from physical and socioemotional threats inside and around school buildings (see Table 1). This conceptualization corresponds with theoretical dimensions of school safety and the multiple elements that families emphasize as integral to their school choices (Billingham et al., 2024; Hamlin, 2020; Thapa et al., 2013). To assess violence, I include police-reported robberies, homicides, and assaults around school buildings and school-reported assaults, thefts, and weapons-based incidents within schools. To understand threats to students’ socioemotional wellbeing, I evaluate school-reported disruptive behaviors and minor altercations, as well as current students’ perceptions of school insecurity and relationships, and current teachers’ perceptions of school disorder and discipline. To examine school security measures, I use whether schools have permanent metal detectors. Utilizing multiple dimensions allows me to assess which safety components relate to families’ actual school choices. Given families’ school preferences in the expounded literature, I expect:
Hypothesis A: Controlling for schools’ demographics, academic outcomes, and geography, families will be less likely to choose schools with higher neighborhood and school violence, higher school disorder rates, lower socioemotional security, and metal detectors.
Although most families express concerns with school safety, it is not clear whether the emphasis put on particular school safety elements varies across students’ racial, socioeconomic, and academic backgrounds. Families’ racially and economically distinct schooling experiences, geographies of opportunity, and social networks shape their school safety perceptions and school choices (Evans, 2021; Holme, 2002; Krysan & Crowder, 2017). The extent to which unwelcoming, disorderly, or violent schools are clustered in or absent from families’ neighborhoods, networks, and experiences, might impact the relevance of safety in their decisions (Deluca & Rosenblatt, 2010; Pattillo, 2015). Given that Black, Latine, lower-income, and lower-achieving students express stronger feelings of school insecurity and exclusion than their peers and are more likely to live in neighborhoods with higher violence levels (Lacoe, 2015; Thapa et al., 2013), they may be more attuned to both neighborhood violence and school violence and climate in their school selections than their peers. Schools also disproportionately enact harsher discipline toward Black, Latine, lower-income, and lower-achieving students, even for similar behaviors as their peers, and install more invasive security measures in their schools, even when they have similar violence levels as others (Okonofua & Eberhardt, 2015; Owens, 2022; Payne & Welch, 2023). This hyper-discipline and surveillance may lead these students to avoid schools with higher violence, disorder, and metal detectors, as such measures may signal risks of over-policing and denigration (Billingham et al., 2020; Hailey, 2023, 2025).
It is also possible that White, Asian, higher-income, and higher-achieving students’ heightened sense of security in their current schools, coupled with their adherence to stereotypes about dangerous urban schools, may lead them to be particularly keen in ensuring protection from violence, disorder, and harsh security measures in new school environments (Evans, 2021; Lareau & Goyette, 2014; Phillippo, 2019). Neighborhood schemas—stigmatizing schools in higher violence communities as low-quality with disorderly minority populations—may also guide advantaged, higher-achieving, and White families’ school selections (Holme, 2002; Phillippo & Griffin, 2016). These students’ school choices may also especially align with high school teachers’ perceptions of safety, since they often use teachers as resources to inform their choices, and high schools’ reputations likely disseminate from high school teachers to their middle school colleagues (Corcoran & Jennings, 2019).
Evidence regarding differences in families’ priorities for school safety is inconclusive. On one hand, Black, Latine, and less advantaged parents are more likely to list safety and discipline as school choice motivations than White and more advantaged parents (National Center for Education Statistics, 2020a). Denver families’ school choices and NYC families’ stated preferences also suggest that, accounting for other school characteristics, neighborhood violence matters more to Black and Latine families than White and Asian families, and school safety matters more to Black and Asian families than White families (Denice & Gross, 2016; Hailey, 2025). Furthermore, Black and Latine NYC families view metal detector presence as a signal of school safety, whereas it does not influence White and Asian families’ perceptions (Hailey, 2025). Alternatively, in Baltimore, higher-income families were more likely to transfer from high-violence schools than lower-income families, with no differences across racial groups (Burdick-Will et al., 2021). Given potential heterogeneity in families’ priorities for avoiding neighborhood violence, school violence and disorder, schools that current students and teachers perceive as insecure and disorderly, and invasive school security measures, I also explore the following hypothesis:
Hypothesis B: Controlling for schools’ demographics, academic outcomes, and geography, Black, Latine, lower-income, and lower-achieving students will be less likely to choose schools with higher school and neighborhood violence, higher school disorder, lower socioemotional security, and metal detectors than White, Asian, higher-income, and higher-achieving students.
Data and Methodology
New York City High School Admissions
I use NYC High School Admissions as a case study to understand the relationship between multiple elements of school safety and school choices. New York City does not assign students to neighborhood high schools and, instead, requires all incoming public school, ninth-grade students to complete applications. 2 On applications, families rank up to 12 out of 700 possible programs in 400 schools. An algorithm matches students to schools, aligning school admission requirements, student ranked choices, and other factors.
The NYCDOE provides each eighth-grade family with a High School Directory to learn about potential schools. The 2013 Directory contained information about schools’ academic outcomes, programmatic and extracurricular offerings, and admissions policies. Families also gather school information through NYC high school fairs and school open houses (Corradini & Idoux, 2024).
NYC is an ideal case study to investigate the relationship between school choices and school safety dimensions due to its comprehensive administrative data on violence and socioemotional security within and outside school buildings. Families can visit schools, access district and non-profit websites, and use their social networks to assess multiple elements of potential schools’ safety. Since all students submit high school applications, the study includes a population of students from diverse socioeconomic and racial backgrounds. Furthermore, the variety of schools allows families to express nuanced preferences on their applications.
NYC high school selections are also less restricted by transportation than in other school choice landscapes. Unlike districts where students’ theoretical choice of non-neighborhood schools depends on long commutes in cars or inefficient public transportation, NYC students access vast, no-cost public transit to travel to preferred schools (Blagg et al., 2018; Denice & Gross, 2016). Like their peers in other choice-oriented cities with public transportation systems (Blagg et al., 2018), NYC students’ high school applications and enrollments are not residentially oriented. Students’ first-choice schools are about 30 minutes from their homes and less than 10% attend their most geographically proximate schools.
Data
To assess the relationship between families’ school choices and school safety, I leverage administrative data with NYC high school applications from 2013. These data include students’ ranked choices and demographics, and schools’ academic, demographic, geographic, and safety information. In 2013, 76,226 eighth-graders applied to 406 schools. The analytic population includes 67,364 students applying to 372 schools. 3 The population is 40% Latine, 29% Black, 15% Asian, and 14% White, and 74% received free or reduced-price lunch.
I assess school safety—threats of physical violence and disorder within and outside school buildings, schools’ socioemotional climate, and school security measures—using administrative data. I merge safety measures into the application dataset using NYC Police Department (NYPD) reported neighborhood crime, school-reported incidents in the New York State Department of Education Violent and Disruptive Incident Reporting (VADIR) system, current high school students’ and teachers’ perceptions as expressed in the NYCDOE Learning Environment Survey, and publicly available data on metal detector presence in schools. I link these safety data using census tract information, NYDOE and NY State identification codes, and school names. See Table 1.
School safety data are from the academic year preceding families’ application submissions, accounting for the most recent information families could have accessed. NYDOE did not actively market school safety information to school choosers in 2013. Families could be aware of schools’ general reputations for safety elements by consulting their networks, visiting schools, or passing through schools’ neighborhoods. Families could also search NYPD, NY State, NYDOE websites for publicly available information on neighborhood violence, school disorder and violence, and school climate information.
I focus this analysis on 2013 because NYCDOE began publishing information on students’ perceptions of insecurity in The School Directory in 2015. As such, using later academic years would conflate families’ preferences to avoid schools where students feel insecure with the salient availability of this data to families; see Crespin and Hailey (2025)for more details.
Outcomes of Interest
There are two main outcomes of interest. The first is the probability of a family including a high school on their application and the second is the rank order of schools on their applications. Families can include up to 12 schools on their applications, with their first choice representing their highest preference. Families, on average, rank about seven schools.
Independent Variables of Interest
I assess measures of neighborhood and school violence, disorder, climate, and security; see Table A1 in the online supplemental material. Using NYPD-geocoded incidents, I measure neighborhood violence as the number of robberies, homicides, and assaults within schools’ census tract. I accounted for all crimes during the academic year, summer, and fall months before families submitted their applications. 4 On average, there were 35 violent crimes surrounding schools (SD = 24.73).
Two school safety measures were constructed from the VADIR data. Schools are required to report incidents that result in students being referred to a counseling program; removed or suspended from class or school; transferred to an alternative education program; or referred to police in VADIR. 5 The school violence rate includes violent incidents within the school (i.e., weapon possession, incidents with weapons, assault, etc.). The school disorder rate includes more common incidents (i.e., bullying, minor altercations, and disruptive behaviors) that schools have discretion in punishing. On average, the school violence rate was 1.53 (SD = 1.31) and the school disorder rate was 8.62 (SD = 9.24). Table A2 includes further descriptions.
Current high school students’ and teachers’ perceptions of school climate are from the 2012 NYCDOE Learning Environment Survey. Each school year, NYCDOE conducts Learning Environment Surveys in every school to assesses current teachers’, students’, and parents’ perceptions of schools’ climate. In 2012, the average school response rate was 79% (SD = 15) and 85% (SD= 15) for students and teachers, respectively. 6 See Hamlin 2021 for more details on NYC Learning Environment Survey .
Given that the Learning Environment Survey questions closely relate to each other, I conducted orthogonal factor analysis with individual survey items. Two uncorrelated factors emerge: (1) current students’ perceptions of school insecurity and (2) current teachers’ perceptions of school disorder and discipline. These factors capture students’ and teachers’ beliefs that schools do not provide safety and supportive relationships, and have high levels of disorder. The factors likely relate to schools’ reputations and resources (Hamlin, 2021; Thapa et al., 2013). Scored factor loadings are in standard-deviation units. Table A3 further describes factors.
To account for school security apparatuses, I include an indicator for whether schools had a permanent metal detector, using data from InsideSchools.org and Mukherjee (2007). 7 In 2013, 43% of NYC high schools had permanent metal detectors where students and visitors had to walk through a magnetometer and put their belongings through an X-ray machine (NYC Department of Education, 2016). 8 Families could ascertain whether schools had metal detectors by visiting schools or consulting network members who visited or attended schools. Families may have interpreted metal detectors as a signal for safety (Hailey, 2025) or insecurity and danger (Billingham et al., 2020).
Control variables
I account for several variables that could simultaneously relate to school choices and school safety; see Table A1 (Denice & Gross, 2016; Hailey, 2022a; Harris & Larsen, 2023; National Center for Education Statistics, 2020a). I controlled for schools’ graduation rates, 9 current students’ average proficiency on their eighth-grade state assessment, demographics (the percent of students who identified as having disabilities and English language learners; received free or reduced-price lunches; and their race, specifically Black, Latine, and Asian); the number of sports and extracurricular programs offered; size, borough, and the commute time on public transportation from applicants’ residential census tract to the school. 10 Given that families’ may use low-income Black communities as a signal for neighborhood violence (Quillian & Pager, 2010), I controlled for the poverty rate and percentage of Black residents within schools’ census tracts. Families may apply to schools where they have higher chances of admissions (Sattin-Bajaj & Roda, 2020), so I also account for whether applicants had geographic- or middle school-admissions priority, and whether schools used tiered lottery admissions.
Multiple Components of School Safety
School violence, disorder, socioemotional climate, and security measures—in addition to neighborhood violence—conceptually and statistically represent distinct aspects of NYC school safety and potential victimization (see Table 1 and Appendix Figure A1). Conceptually, neighborhood violent crime captures victimization outside of a school building that has been reported by NYPD. School violence and disorder rates align with safety as within-school safety, but only include incidents that schools punish and report. As such, they capture both levels of disorder and schools’ propensity to punish behaviors (Owens, 2022). Current student perceptions of school insecurity represent students feeling insecure and unsupported in school, and also captures school disorder, bullying, and violence unknown to, not punished, nor officially reported by school personnel. Teacher perceptions of disorder represent schools’ willingness to address discipline; relationships among students, teachers, and parents; and disorder within schools. Permanent metal detector presence represents a controlling and exclusionary security measure that districts cite as necessary to prevent weapons from entering school buildings (Payne & Welch, 2023)
Correlations between these safety measures suggest that school safety measures are also distinct dimensions (see Appendix Figure A1). For the safety dimensions within school walls, student and teacher perceptions of insecurity and disorder have weak associations with school violence and disorder rates (all |r| < .33). The level of violence in schools’ neighborhoods also weakly related to elements of safety within school walls (all |r| < .20). Figure A1 demonstrates wide variation in school disorder and violence and perceptions of school climate among schools in high- and low-violence neighborhoods. As reflected in prior studies, in some violent neighborhoods, individual schools may be safe havens from violence and/or disorder and, in some low-violence neighborhoods, schools could harbor violence and/or insecurity (Laurito et al., 2019; Patton et al., 2012). T tests for differences between means also indicate that while schools with metal detectors report higher rates of violence and disorder (p < .05), there are no significant differences in student and teacher perceptions of safety and disorder, nor in neighborhood violence across school metal detector presence (p > .10).
Multiple NYC high schools are often in the same building, and schools co-located on the same campus even have vast variation in their school safety measures (see Table A5). In NYC, there are 70 comprehensive campus buildings that house 230 high schools. Within campus buildings, schools by definition have the same neighborhood violence levels and metal detector presence (SD = 0); however, within campuses, the across school standard deviation in school violence is 0.76, school disorder is 5.61, and student and teacher perceptions of school climate are .60 and .56. In one of the larger campuses with five schools located in the same building, the between-school standard deviation in school violence is 1.9, in school disorder is 15.1, students’ perceptions of insecurity is 1, and teachers’ perceptions of disorder is .67. Together these results suggest that neighborhood violence and within-school violence, disorder, climate, and security are not conceptually or empirically interchangeable.
The safety measures are also distinct from schools’ academic outcomes and demographics. Table A4 shows that they are not closely related to graduation rates (all |r| < .38, p < .05) or students’ background characteristics (all |r| < .46, p < .05; see Crespin, 2024 for similar finding in Chicago). These relationships suggest that the multiple elements of school safety, academics, and demographics should be measured as unique school attributes.
Analytic Approach
To explore the relationship between families’ school selections and school safety measures, I used two-step decision-making modeling. This modeling strategy aligns with decision-making theories suggesting that families first eliminate a large number of schools from their consideration sets and then more closely consider the characteristics of a smaller set of schools (Bell, 2007; Bruch & Feinberg, 2017; Saporito & Lareau, 1999). To understand whether families avoided unsafe schools when first deciding which schools to include on their applications, I use conditional logit regression models to predict how each school safety measure relates to whether families ranked a school on their application. This model measures the probability that family i ranks a high school (j) among all schools within a viable travel distance (Pij). To coincide with travel constraints, in this model I limited families’ choice sets to schools within 8 miles from the centroid of students’ residential census tract and the address for each school and to schools otherwise listed on their application. On average, students’ choice sets were within an hour on public transportation from their homes and had 168 schools. 11
To model the second step in families’ school choices, I use rank-order logistic regression models to predict how each school safety measure relates to families’ rank order of schools listed on their applications. This model measures the probability family i selects a school (j) above all other J-1 schools listed on their application (Pij).
In both models, these choices are a function of the school’s characteristics (j) and how the individual’s characteristics align with the school (ij). When modeling both steps in the decision process, I conduct a series of analyses: (1) I estimate families’ school choices as a function of each school safety measure separately and then (2) consider all the school safety measures in one model together. In the next set of models, I (3) include controls for a vector of previously described school- and individual-level covariates. Finally, I (4) estimate the conditional logit models and rank ordered logit models separately by student racial and socioeconomic background and their academic achievement levels to assess potential heterogeneity. Given that families may use their school-based social networks to make school choices (Lareau & Goyette, 2014), across all models standard errors are robust to account for students clustering within middle schools. All presented results are significant at the .05 level.
Findings
Families’ Preferences for Safe Schools
When selecting high schools, most NYC families avoid schools with violent, disorderly, and unsupportive environments; invasive security measures; and in neighborhoods with higher violence. Comparing all NYC high schools to families’ ranked schools and their preferred choice, on average, families prefer to attend schools in lower violence neighborhoods, with lower school violence and disorder, that current students and teachers perceive as secure and orderly, and without permanent metal detectors (see Table 1). Neighborhood violence levels and school violence and disorder rates are respectively .24, .42, and .33 standard deviations lower in schools ranked on families’ applications compared to the average NYC school. Student and teacher perception of school insecurity and disorder are also .12 and .32 standard deviations lower among ranked schools compared to the average school. Furthermore, 40% of schools have permanent metal detectors compared to only 28% of students’ ranked schools.
Although this descriptive analysis provides tentative evidence of families’ preferences for safe schools, I use conditional logit models to assess whether, among schools within a viable travel distance, families avoided including schools on their applications that had harsh security measures and dangerous, disorderly, and unsupportive environments inside and around schools. I also use rank ordered logit models to estimate whether, among schools ranked on families’ application, families’ school rankings related to these safety measures. Tables 2 and 3 include the log-odds coefficients from these models. The models in Panel B control for school admission priorities; academic outcomes; extracurriculars; student and neighborhood demographics; and the travel time from applicants’ residence to the school. To identify statistically significant differences between coefficients across models, I use χ2 tests and only report differences that are significant at p < .05.
Conditional Logit Model Predicting Likelihood of Listing School in Application.
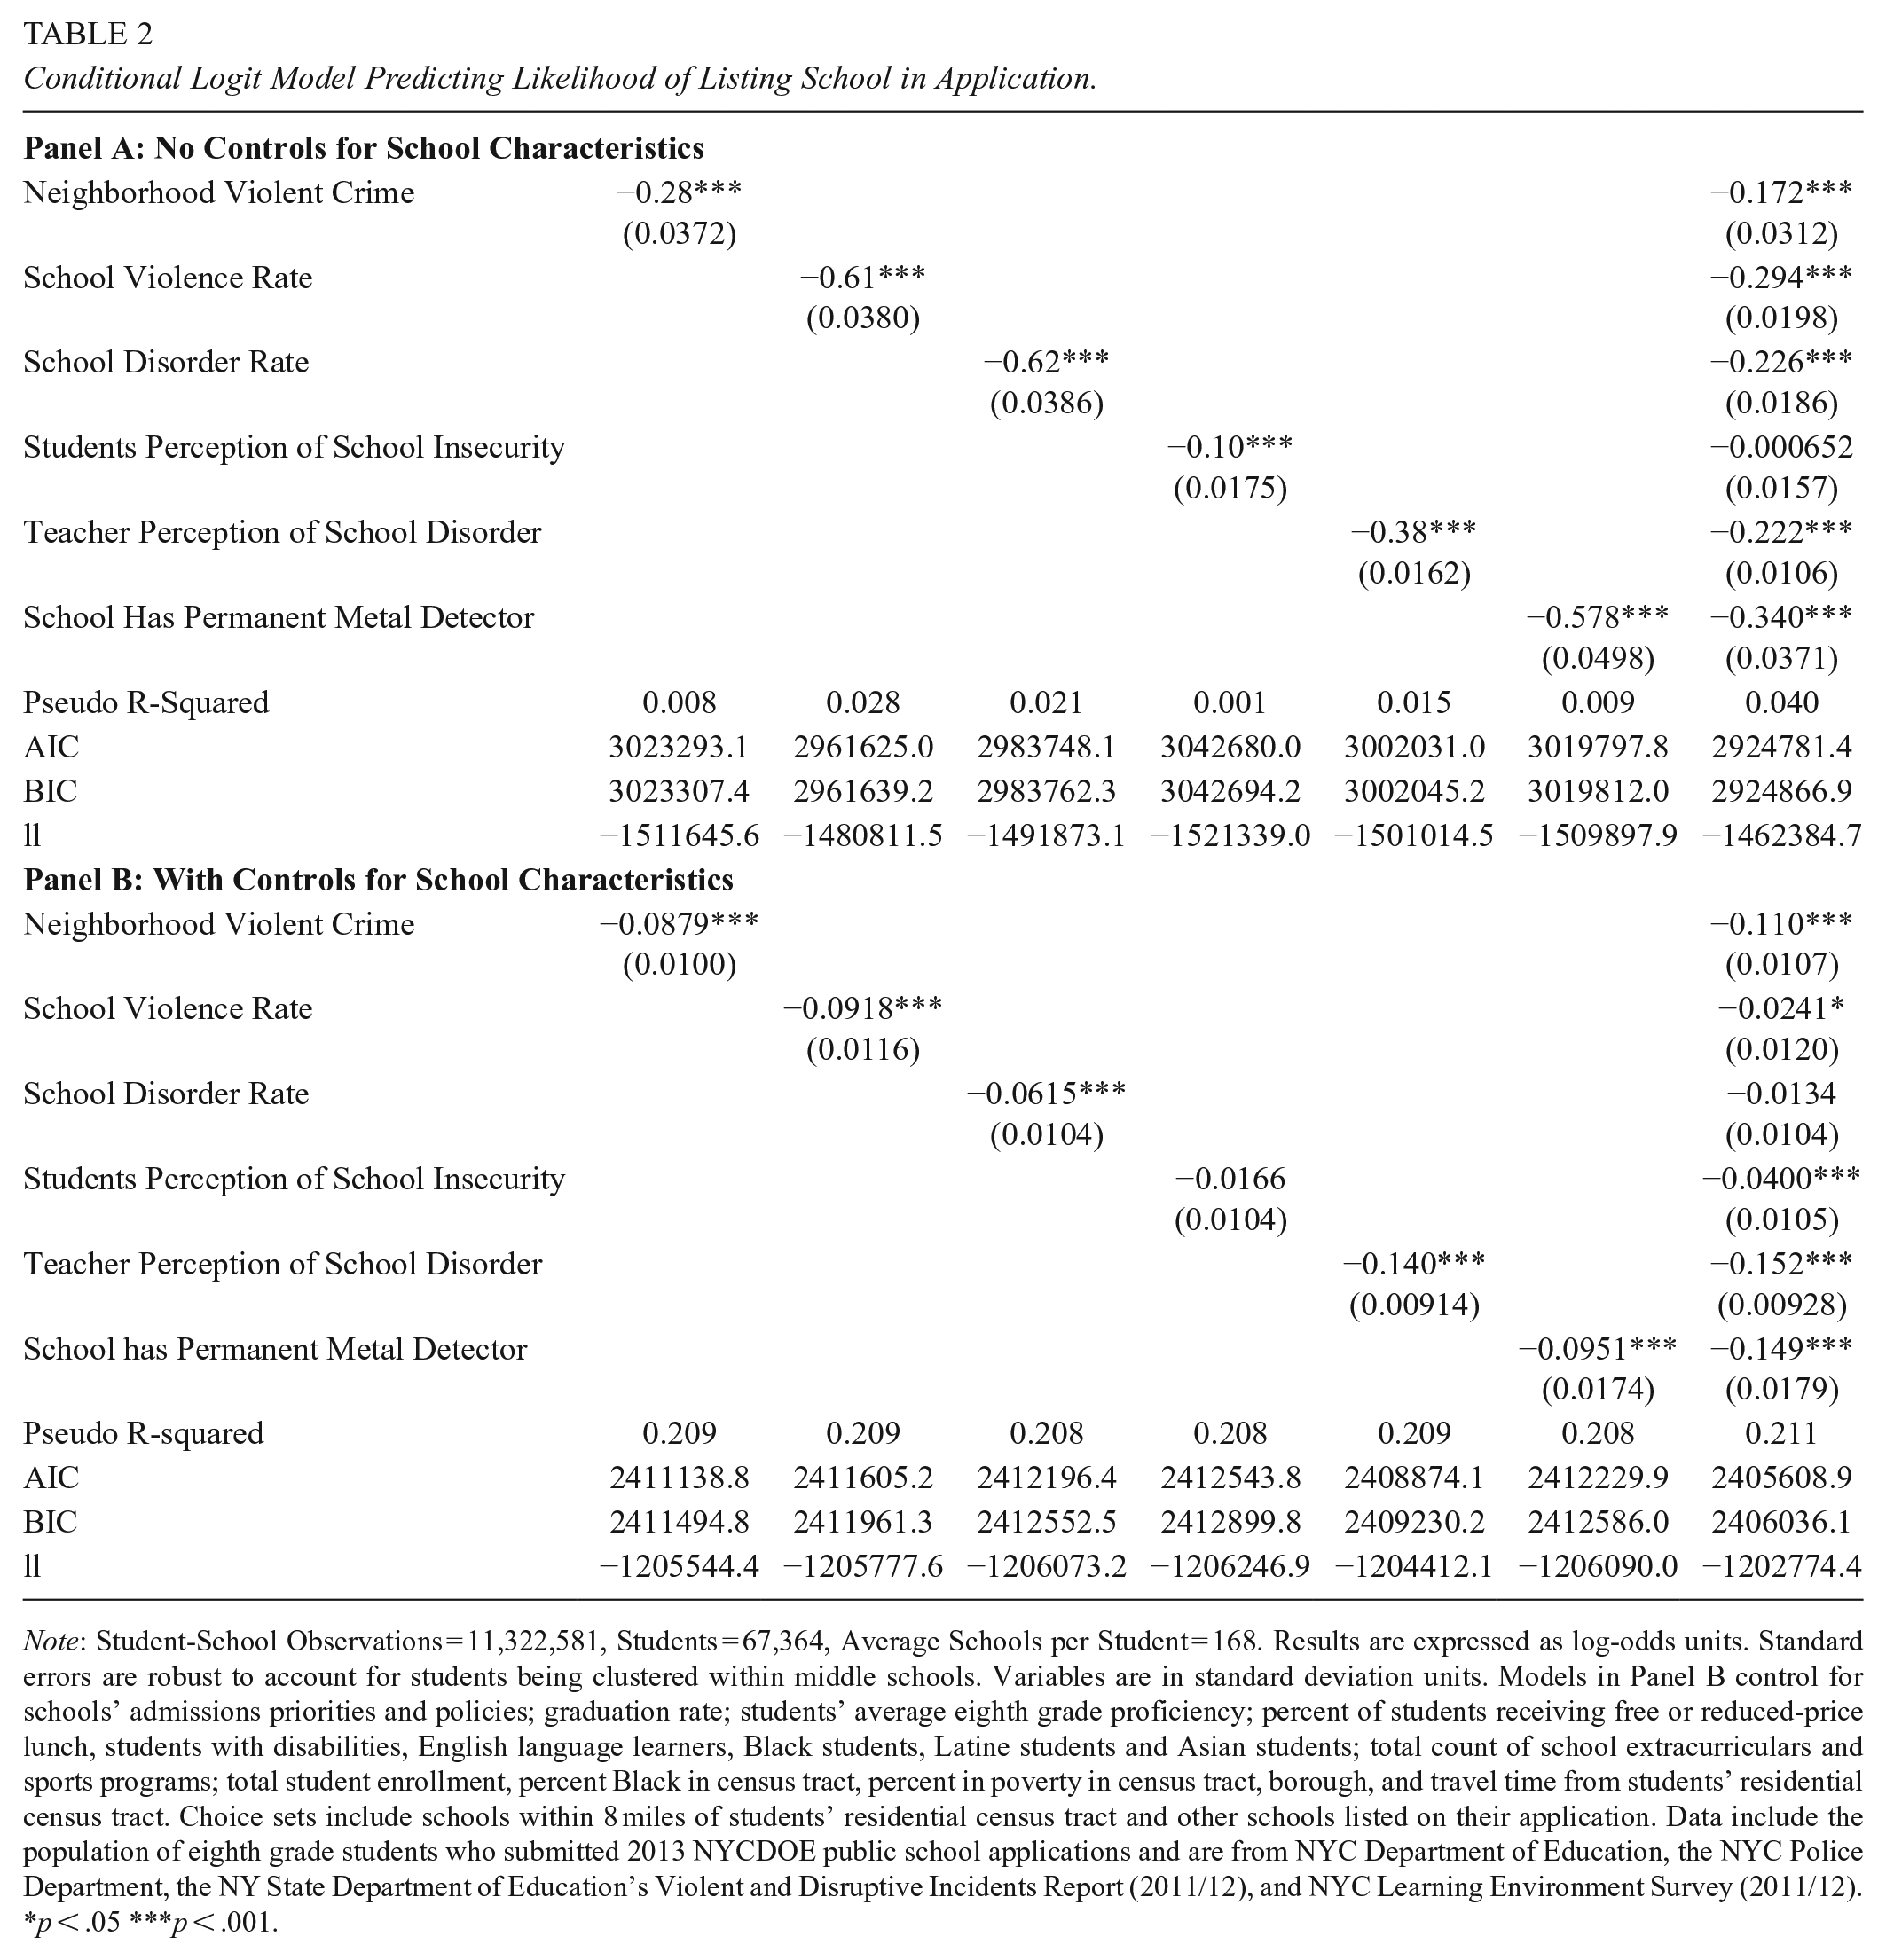
Note: Student-School Observations = 11,322,581, Students = 67,364, Average Schools per Student = 168. Results are expressed as log-odds units. Standard errors are robust to account for students being clustered within middle schools. Variables are in standard deviation units. Models in Panel B control for schools’ admissions priorities and policies; graduation rate; students’ average eighth grade proficiency; percent of students receiving free or reduced-price lunch, students with disabilities, English language learners, Black students, Latine students and Asian students; total count of school extracurriculars and sports programs; total student enrollment, percent Black in census tract, percent in poverty in census tract, borough, and travel time from students’ residential census tract. Choice sets include schools within 8 miles of students’ residential census tract and other schools listed on their application. Data include the population of eighth grade students who submitted 2013 NYCDOE public school applications and are from NYC Department of Education, the NYC Police Department, the NY State Department of Education’s Violent and Disruptive Incidents Report (2011/12), and NYC Learning Environment Survey (2011/12).
p < .05 ***p < .001.
Rank-Ordered Logit Model Predicting School Ranking, Among Schools on Application.

Note: Student-School Observations = 398,993, Students = 67,364, Average Schools per Student = six. Results are expressed as log-odds units. Standard errors are robust to account for students being clustered within middle schools. Variables are in standard deviation units. Models in Panel B control for schools’ admissions priorities and policies; graduation rate; students’ average eighth grade proficiency; percent students receiving free or reduced-price lunch, students with disabilities, English language learners, Black students, Latine students and Asian students; total count of school extracurriculars and sports programs; total student enrollment, percent Black in census tract, percent in poverty in census tract, borough, and travel time from students’ residential census tract. Models in Panel C control for schools’ graduation rate; students’ average eighth grade proficiency; percent students with disabilities. Choice sets include schools listed on their application. Data include the population of eighth grade students who submitted 2013 NYCDOE public school applications and are from NYC Department of Education, the NYC Police Department, the NY State Department of Education’s Violent and Disruptive Incidents Report (2011/12), and NYC Learning Environment Survey (2011/12).
p < .05 **p < .01 ***p < .001.
When determining which schools to include on their applications, NYC families, on average, avoid schools with higher school and neighborhood violence, higher school disorder, that current students and teachers perceive as disorderly and unsafe, and with permanent metal detectors. Results from the bivariate conditional logit models in Table 2, Panel A demonstrates that, as the number of neighborhood violent crimes and school violence rates increase by one standard deviation, the odds families include schools on applications decrease respectively by 24% and 45% (bneighborhood violence = −.28;bschool violence = −.61; see Table 2). Although school choice models often exclusively focus on how violence pushes or pulls students into particular schools (Burdick-Will et al., 2021, 2023), I also found that school disorder, climate, and security measures are important to most families’ school selections. As schools’ disorder rates increase, families have lower odds of listing schools on applications (b = −.62). Families are also less likely to list schools that current student and teachers perceive as lacking supportive relationships, discipline, and safety (b = −.10; b = −.38). They furthermore avoid applying to schools with metal detectors, with the odds that families list schools with this security measure being 44% lower than schools without a metal detector (bmetal detector = −.58). Notably, the magnitude of the associations for a standard deviation increase in the school violence and disorder rates, teacher perceptions of school disorder, and metal detector presence, are on par or larger than the association between neighborhood violence and families’ likelihood of ranking schools on their applications. Most of these associations decline but remain substantively significant in the model that accounts for all school safety and security components, which suggests that neighborhood violence, school disorder and violence, teacher beliefs about school disorder, and metal detector presence, have unique relationships with families’ decisions to list schools on their applications.
In the next set of models, I account for other school characteristics that families may consider when creating their school applications (i.e. academic outcomes, extracurriculars, demographics, and geography; see Table 2, Panel B). All the safety measures’ coefficient magnitudes substantively decline in these models. This suggest that the association between safety measures and other school characteristics partially underlie most families’ avoidance of schools with more violence, disorder, and invasive security. Importantly, models in Panel B demonstrate that, above and beyond the relationship between safety and other school characteristics, families’ odds of including a school on their application decreases for schools with more violence in the surrounding neighborhood (b = −.09), with higher rates of school violence and disorder (b = −.09;b = −.06), that teachers perceive as insecure and disorderly (b = −.14), and that have permanent metal detectors(b = −.10). Underscoring the importance of violence, disorder, and security apparatuses to school selections, these relationships are 12% to 30% the magnitude of the relationship between a standard deviation increase in schools’ graduation rates and families’ likelihood of listing schools on applications (bGraduation Rate = .50)
The models in Table 3, Panel A show how violence, disorder, climate, and security relate to families’ rank order of schools that they include on their applications. The bivariate models show that, among the schools on their applications, most families have lower odds of ranking schools higher that have higher school and neighborhood violence, more school disorder, that students and teachers perceive as insecure, and that have metal detectors. The magnitudes of coefficients in bivariate models suggest that within-school violence, disorder, and security measures matter more for school rankings than neighborhood violence and school climate.
Controlling for school geography, academics, and demographics in Table 3, Panel B, higher neighborhood violence still predicts lower rankings on families’ applications. 12 The relationship between families’ rank-order of schools and within-school safety measures are almost fully mediated by school academic characteristics. Schools with higher graduation rates, whose students have higher eighth grade achievement, and with fewer students with disabilities, typically have lower school violence and disorder; students and teachers perceive them as more safe and orderly; and they are less likely to have metal detectors (see Table A4). When only accounting for these school academic characteristics in the models in Table 3, Panel C, the magnitude of the coefficients for each in-school safety measure decline by 90% to 140%.
Overall, these results partially support Safety Hypothesis A. Accounting for school characteristics often deemed paramount to school choices—geography, academics, extracurricular programs, and demographics— neighborhood violence, school violence and disorder, teachers’ perceptions of school disorder, and metal detector presence predict most families’ likelihood of including schools on their applications, while neighborhood violence predicts how families rank schools on their applications. In other words, families typically screen out schools with higher neighborhood and school violence, disorderly school environments, and disruptive security measures in the initial elimination phase of their schooling decisions, and prefer schools located in lower violence neighborhoods in the subsequent and more detailed decision-making phase.
Heterogeneity Across Student Background
Families’ school choices are shaped differently by school safety and security depending on students’ racial and socioeconomic background and academic achievement levels. Figure 1A and B include conditional logit coefficients measuring the relationship between families’ likelihood of listing schools on applications and each safety measure stratified by Latine, Black, White, and Asian students; students’ eligibility for free- or reduced-price lunch (FRPL); and students’ achievement on their seventh grade English standardized test. Figure 1C and D include rank ordered logit coefficient measuring the relationship between families’ rank order of schools listed on applications and each safety measure stratified across students’ backgrounds. Figure 1B and D include controls for school academics, demographics, and geography. To identify statistically significant differences between groups, I conducted fully interacted models by demographic groups and report only those differences that are significant at p < .05.

How School Safety Matters in Families’ School Choices by Student Characteristics: (A) Likelihood of Ranking on Application, (B) Likelihood of Ranking on Application, (C) Rank-Order on Application, and (D) Rank-Order on Application.
Figure 1A demonstrates that, although almost all demographic groups avoid listing schools with violent, disorderly, and unsafe environments and harsh security measures on applications, most Asian, White, higher-income, and higher-achieving students place greater emphasis on all school safety and security measures in their school choices compared to their peers. These differences decrease when controlling for other school characteristics (see Figure 1B), suggesting that demographic groups’ differential preferences for school academic outcomes, demographics, and geography may somewhat underlie their differential priorities for school safety measures (Denice & Gross, 2016; Hailey, 2022a).
Accounting for school academics, demographics, and geography, most White and Asian students are more avoidant of including schools on their applications that are in higher violence communities than Black students. The magnitude of the relationships between a standard deviation increase in neighborhood violence and White and Asian families’ likelihood of including a school on their application (b = −0.16;b = −0.15, respectively) are about 25% the relationship between their choice and a standard deviation increase in graduation rate (b = 0.68; b = 0.63).
Figure 1B also highlights significant differences across demographic groups in families’ avoidance of within-school safety dimensions. Asian and higher-achieving students are generally more avoidant of schools with higher violence rates and that current teachers perceive as disorderly, relative to other racial groups and lower-achieving students. Further emphasizing the need to consider multiple components of school safety in choice models, teacher perceptions of disorder have a larger magnitude of association with Asian families’ likelihood of including a school on their applications than neighborhood violence: χ2(1) = 4.35; p < .05. Results also demonstrate that most Black students are more avoidant of schools with higher disorder rates than Latine and White students. Finally, Figure 1B shows that Latine and lower-achieving students are less avoidant of schools with metal detectors than Black, Asian, and White students and higher- and middle-achieving students.
Among schools listed on families’ applications, there are notable differences in how families prioritize in-school safety dimensions. While Asian, White, and higher-income families placed heightened priority on avoiding schools in violent neighborhoods in their school listings (Figure 1A), Figure 1C shows fewer differences across groups in the rank-ordering schools on applications. However, demographic differences emerge in how families respond to other safety measures. Compared to their peers, Asian, White, higher-income, and higher-achieving students’ rank order of schools had a stronger negative association with school violence and disorder rates, student perceptions of insecurity, and metal detector presence (Figure 1C).
The patterns in the associations between families’ rank order of schools and teacher perceptions of school insecurity are somewhat incongruent with expectations. While most Black, Latine, and middle- and lower-achieving students give schools that teachers perceive as disorderly a lower ranking, White and higher-achieving students rated schools that teachers perceived as disorderly higher on their applications. This positive association for White and higher-achieving students was particularly driven by schools with larger White student populations. Alternative regressions show a negative association between these families’ school rankings and teachers’ perceptions of disorder for schools with below average proportions of White students and a positive association for schools with above average White student populations. As such, it may be that despite current teachers believing that schools are disorderly, these schools may have positive reputations that impel most White and higher-achieving students to rank them higher on their applications.
Figure 1D includes results from models measuring the association between each safety dimension and the rank order of schools on families’ applications, including school-level control variables. The associations between families rank order of schools and neighborhood violence and teachers’ perceptions of safety remain relatively stable when accounting for school academics, demographics, and geography (see Figure 1D). However, the coefficients between all demographic groups’ rank order of schools and the other school safety measures decrease or reverse in sign; the differences between demographic groups become substantively small as well. This pattern suggests that school geography, academics, and demographics partially or fully underlie differences in families’ priorities for these within-school safety elements across demographic backgrounds and achievement levels.
Importantly, accounting for other school characteristics, some demographic groups’ school rankings still associate with elements of school safety. Figure 1D demonstrates that all demographic groups, on average, prefer schools located in lower violence neighborhoods. Most Latine students also prefer schools with lower school disorder rates and that teachers believe are orderly, with the magnitude of the associations greater than White and Asian students and White and Black students, respectively. The associations are also about 22% of the association between a standard deviation increase in schools’ graduation rate and their likelihood of ranking a school higher. Furthermore, White students, on average, rank schools with permanent metal detectors lower on applications than their peers.
Robustness Checks
To examine the relationship between school safety and families’ school choices, this analysis focuses on how school disorder, violence, socioemotional insecurity, and security measures in addition to neighborhood violence, relates to the likelihood that NYC families listed schools on applications (relative to other high schools within a viable travel distance from students’ neighborhoods) and the order in which they rank schools on applications. Three factors motivate this decision: (1) NYCDOE does not assign students to attend a default neighborhood school and requires all students to submit applications; (2) families can use free public transportation to access schools throughout the city; and (3) families likely systematically assess their rank order of schools since NYC matches 75% of students to their top three choices. It is possible, however, that results may diverge by the choice decision model or safety measurement specifications. Robustness checks (Tables A6–A10) examine alternative safety measures and choice models, including inverse hyperbolic sine and logarithmic transformations of violence and disorder measures. They also include models predicting whether families list schools closest to their residence on applications and their likelihood of listing and the rank order of schools on applications with fixed effects at the student and middle-school levels.
Since the neighborhood violence and school violence and disorder measures are all positively skewed, I estimate alternative models using inverse hyperbolic sine and logarithmic transformations of these variables. Results from these alternative models are substantively similar to main reported results (see Table A6, A7). One notable exception is the rank-ordered logit model demonstrating that, accounting for other school characteristics, most students have lower odds of ranking schools higher on application as the school disorder rate increases (bLogged-School Disorder Rate = −0.01; bIHS-School Disorder Rate = −0.01; Table A7, Panel B).
Consistent with the main results, most families are less likely to apply to geographically proximate schools with higher neighborhood and school violence and disorder, lower socioemotional security, or metal detectors (Table A8). However, when controlling for other school characteristics, only school violence and teacher perceptions of disorder remain significant predictors of families’ likelihood of applying to their nearest schools.
To address sorting patterns between middle and high schools (Chin, 2022), I estimate mixed-effects models with fixed effects for students and their middle schools. Logit model results predicting whether families list schools on applications primarily align with the main findings, except that metal detector presence does not associate with school listing when controlling for other school characteristics (Table A9). 13 Regression results predicting school rank on applications are also similar, with some exceptions (Table A10). In models controlling for other school characteristics, students rank schools higher if they have lower school disorder rates (b = −0.02), higher school violence rates (b = 0.02), are perceived as more disorderly by teachers (b = 0.01), and have metal detectors (b = 0.05). These positive associations between school rankings and safety measures are largely explained by the relationship between these measures and school academic characteristics.
Limitations
Although this study demonstrates the role of multiple components of school safety in families’ school choices, it is not without limitations. As with any regression analysis, unobserved variables may drive the observed relationships between safety and school selections. To mitigate this limitation, I accounted for factors that prior studies show influence school choice (i.e., geography, academic outcomes, extracurriculars, demographics; Denice & Gross, 2016; Hailey, 2022a; Harris & Larsen, 2023). I also controlled for schools’ admissions policies, given that families may strategically choose schools to maximize their likelihood of admissions.
Second, while I conclude that multiple dimensions of school safety relate to families’ choices, I cannot determine whether families had enough information to distinguish between neighborhood violence and within-school safety. This is notable since NYC families could not easily access information on school safety in digital and print formats in 2013 (Crespin & Hailey, 2025). Recent experimental evidence, however, suggest that school and neighborhood safety ratings independently influence NYC families’ beliefs about school safety and school preferences (Hailey, 2025). Future qualitative and quantitative research could continue to build our understanding by explicitly illuminating how families conceptualize potential schools’ safety, and how social networks, school visits, and district-provided information inform their assessments (Billingham et al., 2024; Hamlin, 2020).
Finally, NYC’s educational landscape has unique features that may limit the study’s generalizability to other contexts. New York City offers families 400 public high school options and has a robust public transportation system, potentially allowing families to make more nuanced choices and consider school safety more closely. As such, we may see similar patterns in other choice-rich cities with public- or district-provided transportation (Blagg et al., 2018), but families may not be able to actualize their preferences for safe schools in cities that rely on private transportation to access non-neighborhood schools. Furthermore, given that the study population excludes families who may have opted into private and charter schools due to safety concerns (Hamlin, 2020), results may be conservative estimations of the role of the safety in NYC residents’ school selections. New York City also had fairly low violent crime rate compared to other large cities in 2013, which could have made this school characteristic less pertinent to NYC families selecting schools (FBI, 2014). Future analysis should explore the relationship between school choice and multiple school safety dimensions in other locales and school choice sectors.
Discussion and Implications
Families indicate that concerns with safety compel their schooling decisions. Policymakers and advocates often encourage families to leverage school choice policies to access schools that protect students from violence and socioemotional harm (DeAngelis, 2018; U.S. House Committee on Education and The Workforce, 2022). It is unclear, however, whether and which school safety dimensions factor into families’ actual school selections. Leveraging administrative data from the NYC High School Admissions process, this study finds that families’ safety concerns and school selections expand beyond avoidance of violent schools and schools located in high-violence communities (Burdick-Will et al., 2021, 2023; Denice & Gross, 2016). Consistent with theoretical conceptualizations and holistic delineations of safety in school choice surveys and interviews (Billingham et al., 2020, 2024; Hamlin, 2020; Pattillo, 2015; Thapa et al., 2013), NYC families’ school choices simultaneously associate with neighborhood violence and school violence, disorder, and security measures. Accounting for academic, demographic, and geographic school attributes typically regarded as central to school choices, most families are less likely to list schools on applications with higher violence outside and within school buildings; higher rates of school altercations, bullying, and disruptive behaviors; that are perceived by teachers as disorderly, undisciplined, and lacking respectful relationships; and with permanent metal detectors. Families are also, on average, more likely to rank schools located in higher violence neighborhoods lower on their applications.
This study reinforces that, in larger cities where violence shapes spatial imaginations, higher neighborhood violence pushes students away from schools (Burdick-Will et al., 2021, 2023; Phillippo & Griffin, 2016) and lower neighborhood violence pulls families toward schools (Denice & Gross, 2016). By considering other components of school safety, however, I also illustrate that in-school violence, disorder, socioemotional climate, and security measures also shape schooling decisions—a finding that could help illuminate the logic in families’ educational decisions in cities, suburbs, and rural areas not plagued by violence.
These overall results mask important heterogeneity in families’ priorities for particular school safety measures. Aligning with findings from Baltimore (Burdick-Will et al., 2021), most White and Asian students’ school selections are more avoidant of schools with higher neighborhood violence than their peers. These families’ adherence to cultural schemas that stigmatize violent neighborhoods as having majority Black, low-quality schools and a particularly heightened risk of victimization could underlie these results (Phillippo & Griffin, 2016; Quillian & Pager, 2010). It could also be that these families believe they can leverage their capital to protect their students from threats within school buildings, but are concerned with victimization commuting to school in spaces that school personnel do not directly surveil (Burdick-Will et al., 2019; Cucchiara, 2013).
Results also suggest that most Asian and higher-achieving families’ school choices are more closely related to school violence and teachers’ perceptions of disorder than their peers. This result could reflect the alignment of these safety elements with schools’ reputations among NYC teachers and with Asian and higher-achieving students relying on their current teachers’ opinions as a primary resource for school selections (Corcoran & Jennings, 2019). Black and Latine students’ school rank decisions are, on average, more closely related to school disorder than White families. Since school disorder rates primarily encompass disruptive incidents that schools subjectively punish, Black and Latine students’ personal and vicarious experiences of racially-biased school discipline could have guided their heightened priority to avoid disorderly schools (Hailey, 2023; Owens, 2022; Posey-Maddox et al., 2021).
Preferences for school security measures also differ across groups. When listing schools on applications, Black, Asian, White, and higher achieving students are typically more avoidant of schools with metal detectors. However, White students particularly ranked schools with metal detectors lower on their school applications, aligning with studies showing that White families tend to stigmatize schools with harsh security measures as unsafe (Billingham et al., 2020).
Implications
Several implications emerge from this analysis. First, researchers and school districts must account for safety’s multidimensionality when studying and implementing school choice policies. The simultaneous association between NYC families’ school selections and neighborhood violence and school violence, socioemotional climate, and security measures suggests that families respond to these dimensions as separate components of safety. As such, future studies should operationalize safety, not only using neighborhood violence measures (Denice & Gross, 2016; Glazerman & Dotter, 2017), but also using the school violence, disorder, climate measures, security apparatuses, and other safety factors such as violent incidents on students’ routes to schools, race-based violence, and the presence of armed police officers (Burdick-Will et al., 2019; Edwards, 2021). The incorporation of more comprehensive school safety conceptualizations could alter conclusions and provide clarity when assessing school choices. For instance, if Glazerman and Dotter (2017) included school climate measures in their study, they may have found that Washington, D.C. families’ choices aligned with desires for socioemotionally secure school spaces.
To attract, retain, and holistically support students, policymakers must also address violence, disorder, and supportive relationships within their school building and community violence outside of their school walls. Improving these school safety elements not only has implications for current students’ achievement and socio-emotional wellbeing (Lacoe, 2020; Thapa et al., 2013), but districts’ decisions to emphasize improving particular school safety components could also shape which students are attracted to their schools. Districts must, nevertheless, consider that school practices traditionally used to prevent and protect students from violence (i.e., punitive discipline, metal detectors, and armed police officers) often negatively influence students’ academic and socioemotional wellbeing (Pearman et al., 2019; Shedd, 2015), may inadvertently signal insecurity to potential families (Billingham et al., 2020; Hailey, 2025; Pattillo, 2015), and could deter the very students that schools hope to attract (Hailey, 2023; Posey-Maddox et al., 2021). Policy decisions to improve school safety must also mitigate pernicious effects on students’ mental health and experiences of school exclusion, especially as these negative consequences disproportionately accumulate on marginalized students (Edwards, 2021).
This study’s results further suggest that schools are not isolated from larger city dynamics, but are instead interconnected with surrounding communities (Rich & Owens, 2023). I build on evidence that, even in school choice contexts that attempt to delink schools from their local neighborhoods, neighborhood-school structures simultaneously shape the sorting of families across schools (Burdick-Will et al., 2023; Denice & Gross, 2016). Multiple levels of schools’ socioecology shape educational decision-making, as families’ conceptions of school quality and their school choices link in tandem with social processes within and outside of school buildings (Billingham et al., 2024; Hamlin, 2020). This study’s findings—that neighborhood violence detracts students from enrolling in schools, with evidence that violence pushes local students away from their neighborhood schools (Burdick-Will et al., 2023)—paints a clearer picture of the mechanisms by which urban violence leads to schools being at higher risk of lower enrollments and closure (Brazil, 2020) and neighborhoods loosing key institutions (Burdick-Will, 2018).
To better support families in choosing schools, districts could publish data that enumerate the multiple safety dimensions that families prioritize in their educational decisions. Following guidelines from the Every Student Succeeds Act (ESSA, 2015), many districts have begun to publicize school suspension rates or students’ perceptions of safety in school report cards and choice directories. Educational agencies could extend this information to include crime and disorder incidents within and surrounding schools or metal detector presence (see Billingham et al, 2024). However, the implications for publishing school safety data are unclear. Providing data on safety and security may attract families to lower-violence, less disorderly schools that they may not have otherwise considered, but it could also reify preconceived school stigmas and lead to further marginalization of students in those schools (Hailey, 2025). For example, published safety data could motivate public advocacy for increased police presence and surveillance in schools. However, heightened security might make current students feel more unsafe (Gastic, 2011; Perumean-Chaney & Sutton, 2013) and, as suggested by this study’s findings, deter future students from applying to those schools. Given pervasive racial stereotypes about school danger that underlie educational decisions (Billingham et al., 2020; Evans, 2021), safety data provision may do little to alter families’ perceptions of schools and school selections. For example, a recent survey experiment shows that, despite having explicit school safety information, non-Black NYC families still believed majority Black schools were less safe than other schools, and systematically avoided Black schools (Hailey, 2025). Future observational and experimental studies should explore whether (and which) families incorporate salient information on neighborhood crime, school violence, disorder, and climate into their school choices (see Crespin, 2024). In an era of increasing school choice, we must continue interrogating how multilayered social processes within and outside of school walls shape the distribution of students across the landscape of educational opportunities.
Supplemental Material
sj-docx-1-ero-10.1177_23328584251329899 – Supplemental material for Choosing Schools, Choosing Safety: How Multiple Dimensions of Safety Shape School Choices
Supplemental material, sj-docx-1-ero-10.1177_23328584251329899 for Choosing Schools, Choosing Safety: How Multiple Dimensions of Safety Shape School Choices by Chantal A. Hailey in AERA Open
Footnotes
Acknowledgements
Thank you to Jennifer Jennings, Mike Hout, Pat Sharkey, Sean Corcoran, Carla Shedd, NYU Sociology Department, NYU IES-PIRT Seminar, and UT Education and Society workshop for comments on earlier drafts of this paper. A preliminary draft of this article was presented in Montreal at the annual meeting of the Society for the Study of Social Problems. Data are provided by the New York City Department of Education through the Research Alliance for New York City Schools.
Declaration of Conflicting Interests
The author declared no potential conflicts of interest with respect to the research, authorship, and/or publication of this article.
Funding
The author disclosed receipt of the following financial support for the research, authorship, and/or publication of this article: This material is based upon work supported by the Population Research Center, awarded to the Population Research Center at The University of Texas at Austin by the Eunice Kennedy Shriver National Institute of Child Health and Human Development (P2CHD042849), the National Science Foundation Graduate Research Fellowship Program under Grant No. DGE1342536, the Institute of Education Sciences-funded Pre-doctoral Interdisciplinary Research Training (IES-PIRT) Program at New York University, the Ford Foundation Dissertation Grant, and the Spencer/NAED Postdoctoral Fellowship.
Notes
Author
CHANTAL A. HAILEY is an assistant professor in the Department of Sociology at the University of Texas at Austin and a 2024–2025 National Academies of Education/Spencer post-doctoral fellow. She is particularly interested in how micro decision-making contributes to larger macro segregation and stratification patterns and how racism creates, sustains, and exacerbates racial, educational, and socioeconomic inequality.
References
Supplementary Material
Please find the following supplemental material available below.
For Open Access articles published under a Creative Commons License, all supplemental material carries the same license as the article it is associated with.
For non-Open Access articles published, all supplemental material carries a non-exclusive license, and permission requests for re-use of supplemental material or any part of supplemental material shall be sent directly to the copyright owner as specified in the copyright notice associated with the article.