
Abstract
This article examines the impact of Teach for America (TFA) on following-year student test and nontest outcomes in Miami-Dade County Public Schools. Using data from 2010 through 2021, this article measures the extent to which student exposure to TFA is followed by improved outcomes in the future, relative to students with other early-career teachers in the same school. In particular, this article measures days missed due to absences or suspensions, course grades in each core subject, and progression in math courses. We find that students taught by TFA math teachers go on to have higher grades in math courses in the following year and are less likely to miss school due to being absent or suspended. However, while students in TFA classrooms score higher on math and ELA assessments in a given year, these test score gains fade out by the following year.
Keywords
Introduction
Teach for America (TFA) is a nonprofit organization that places teachers into classrooms in high-need settings across the United States. TFA operates by recruiting and selecting recent college graduates and midcareer professionals for teaching positions, training them to fill hard-to-staff vacancies as corps members in public schools, and supporting them for the duration of their 2-year commitment. As described in more detail below, prior evidence on TFA has found that corps members perform at least as well as similarly experienced non-TFA teachers in the same schools, on average (e.g., Backes et al., 2019; Decker et al., 2004), though the large majority of TFA corps members leave teaching at the conclusion of their commitment or shortly after (Donaldson & Johnson, 2011). Over the organization’s history spanning more than 30 years, TFA has attracted both praise for providing the talent to fill critical gaps in teacher staffing and criticism for contributing to higher turnover and de-professionalizing teaching.
The existing body of evidence on TFA, however, may be missing important ways in which TFA corps members influence their students. A growing body of work, largely separate from TFA, has found that teacher effects on contemporaneous test scores only capture a fraction of the ways in which teachers impact their students (e.g., Gershenson, 2016; Jackson, 2018), and that there is meaningful differentiation across teachers in affecting the outcomes of their students along dimensions such as student absences, suspensions, and course grades. Further, both test and nontest impact estimates for teachers have been shown to be influential on a range of future student outcomes (e.g., Backes et al., 2023; Chetty et al., 2014b).
This article uses data from 2010 through 2021 to extend the existing body of evidence on TFA by examining the relationship between being in a TFA classroom in a given year on both tested and nontested outcomes in that year as well as in the following year. These analyses offer a more comprehensive picture of TFA’s estimated impacts on students, which is critical in helping to evaluate the overall costs and benefits of staffing through TFA versus other sources.
In the following section, we review the prior literature on TFA and discuss the context in Miami-Dade County Public Schools (M-DCPS). The third and fourth sections describe the data and analytical strategy. In the fifth section, we present our findings, which suggest a positive impact of TFA exposure on multiple student outcomes test and nontest outcomes, both in the year of exposure and in the year following. Finally, we conclude with a discussion of findings and how they inform perspectives on the costs versus benefits of staffing with TFA.
Background on TFA and Its Impacts in Miami
The evidentiary base of TFA impacts on students spans nearly two decades. Multiple randomized control trials have been conducted on the efficacy of TFA corps members across multiple sites, consistently finding positive effects in math and small or null effects in English/language arts (ELA) (e.g., Antecol et al., 2013; Clark et al., 2013; Decker et al., 2004; Penner, 2016). Other studies have used administrative records to identify TFA’s impacts on students (e.g., Backes et al., 2019; Boyd et al., 2006; Kane et al., 2008) and produce estimates in similar ranges to experimental studies. When other, less commonly tested subjects are evaluated, including science (Xu et al., 2011) and history (Hansen & Sass, 2015), TFA has demonstrated a modest advantage in these outcomes as well. A prior evaluation of TFA in M-DCPS, the site of this study, shows corps members outperform novice peer teachers in both math and—notably—ELA, which is not commonly found in the TFA evaluation literature (Backes et al., 2019).
However, the narrow focus of the prior literature on TFA corps members’ impacts on test scores in the short run may overlook other ways TFA may influence students. Other potential avenues for broader TFA impacts could be either through nontested student outcomes or through influencing student outcomes over time beyond the year of exposure. Indeed, these two issues are intertwined in the broader, growing literature on teacher impacts. It is now well established that teachers influence both test and nontest student outcomes (e.g., Chetty et al., 2014a; Jackson, 2018). Several studies have also found that teacher effects on test scores persist, to some extent, to test scores in future grades (Jacob et al., 2010; Kinsler, 2012), and similar patterns appear to hold for nontest teacher effects on nontested outcomes (Jackson, 2018). In addition, estimates of teacher impacts on these nontest outcomes tend to predict future student outcomes at least as well as test-based estimated impacts (Backes et al., 2023; Jackson, 2018; Gilraine & Pope, 2021; Liu & Loeb, 2021). In addition, the extent to which these effects persist may vary across teachers (Candelaria & Bartanen, 2019), and measures of teacher effectiveness taken from test-based value added versus nontest value added are only weakly correlated, suggesting that they measure distinct components of teaching skill (e.g., Jackson, 2018).
Building on this literature among teachers broadly, this article investigates whether and how TFA corps members influence both test and nontest student outcomes over time. The M-DCPS setting lends itself well to this inquiry, based on the long presence and relatively high concentration of TFA corps members in the region. TFA began placing corps members in M-DCPS in 2003, with 35 initial placements, and has continued to place corps members in the district every year since. During the early period of TFA’s presence in the district, the placement of corps members in schools did not adhere to an overarching strategy, except for TFA’s requirement of placing corps members in schools where 70% or more of students are eligible for free or reduced-price lunch (FRL), a common proxy for student poverty. Beginning with the 2009–2010 school year, TFA rolled out a new staffing strategy (hereafter referred to as the cluster placement strategy) in partnership with M-DCPS; new TFA corps members recruited to the region were eligible for hire only in specific schools within targeted high-need communities. The coincidence of this narrow targeting of corps member placements with a roughly simultaneous surge in the quantity of corps members placed into the region resulted in high concentrations of TFA teachers in targeted schools.
This study constitutes the third round of evaluation of TFA’s work in the district. Prior work found that the new placement strategy provided students in targeted schools with significantly greater access to quality teachers, as measured by impacts on students’ test scores in both tested subjects, especially in math (Backes & Hansen, 2019). 1 The presence of TFA corps members in M-DCPS was also associated with a small reduction in students’ unexcused absences and suspensions (Backes & Hansen, 2018). Further, though the cluster placement strategy was found to be associated with lower shares of TFA teachers moving between schools between the 1st and 2nd years of their commitment, it showed no evidence of changing corps members’ retention after fulfilling their commitment (Hansen et al., 2016). Neither were there any detectable productivity spillovers from TFA onto peer teachers (Backes et al., 2019). Overall, although TFA corps members had an apparently positive influence on students while in the classroom, some school leaders and stakeholders in the region question whether TFA’s presence made an enduring difference to students, or whether its impact was more ephemeral. School leaders in other locations may also question the long-term value of staffing through TFA. Understanding the durability of TFA impacts over time, as we explore here, can help inform these assessments and provide a more comprehensive view of TFA’s impact at scale.
Our primary research question is thus as follows: To what extent is being in a TFA classroom associated with gains in outcomes not captured by short-term gains in standardized tests, such as grade point average (GPA), above-grade course taking, and absences, both in the year of exposure and in the following year? Prior research of TFA has touched on similar elements. For example, as noted above, Backes and Hansen (2018) explore some of these nontest outcomes, but only in the years of exposure to a TFA corps member and only in a limited subset of the data used here (2010 through 2014, compared to 2010 through 2021 in this article). In addition, Decker et al. (2004) and Clark et al. (2013) examine the number of days absent and suspended for students randomly assigned to TFA classrooms relative to those assigned to control classrooms, with the former study conducted in elementary schools and the latter in secondary schools. Neither study found a statistically significant relationship between TFA assignment and days absent or suspended, although their samples are substantially smaller than what is available in the data from M-DCPS utilized for this study. In addition, our data provide information on a broader set of student nontest academic outcomes across a larger span of grade levels. To our knowledge, this is the first study to look specifically at these outcomes in years after students are exposed to TFA corps members.
Data
We use detailed student-level administrative data that cover M-DCPS students linked to their teachers for 13 academic years (2008–2009 through 2020–2021). 2 Because our empirical approach entails controlling for prior-year student outcomes, our primary analysis sample thus consists of the 2009–2010 through 2020–2021 school years. With student enrollment exceeding 300,000 students, M-DCPS is the largest school district in Florida and the fourth largest in the United States. The district has large populations of non-White and disadvantaged students, typical of regions TFA has historically targeted. About 60% of M-DCPS students are Hispanic, 30% Black, and 10% White; and more than 60% of students qualify for FRL service.
Test Scores
The student-level longitudinal data contain ELA and mathematics scores on the Florida Comprehensive Achievement Test (FCAT) through the 2013–2014 school year. 3 Beginning in 2014–2015, the state introduced the Florida Standards Assessment (FSA), with end-of-grade (EOG) exams administered in math in Grades 3 through 8 and in ELA in Grades 3 through 10. All scale scores are standardized within the district data to have mean 0, standard deviation 1 in each subject-test-grade-year cell. In addition, the state offers FSA end-of-course (EOC) exams in Algebra 1 and geometry; these exams are considered as math outcomes in the year these courses are taken, typically in Grades 9 and 10 if no EOG exam is available for the student. Algebra 1 and geometry grades are standardized within the district to have a mean of 0, standard deviation 1 in each subject-test-grade-year cell.
Student Demographics
In addition to test scores, we observe a variety of student characteristics that are utilized as explanatory variables in the analysis: race/ethnicity; gender; eligibility for participation in the federal reduced-price lunch program; limited English proficiency status; and whether a student is flagged as having a mental, physical, or emotional disability.
Nontest Outcomes
The administrative data contain days missed due to absences and school suspensions in a school year. In addition, transcript data allow for the creation of flags for being assigned to a gifted or honors class, taking above-grade work (e.g., taking Grade 7 math in sixth grade or Algebra 1 in eighth grade), failing a course, and final course grades. We construct several additional variables to capture how students move through the progression of math courses to measure whether students take the next level of math in the following year, which are documented in Appendix Table A1. Finally, following prior work (Jackson, 2018), we use factor analysis to construct a composite measure of nontest outcomes consisting of absences, suspensions, and grade repetition (hereafter referred to as the nontest factor). We also construct an additional composite factor that includes GPA in core courses in the following year in addition to the other three nontest outcomes. 4 Unless otherwise noted, nontest outcomes are measured from grades 4-11 and use linked teachers of all four core academic subjects across this grade range.
Teacher-Level Variables
Students are linked to teachers through data files that contain information on course membership, and teacher personnel files contain information on teachers’ backgrounds, including experience and TFA indicators. These TFA flags were generated by using TFA member lists from the regional TFA office on placements during the analysis years. 5 Note that TFA in the data refers to all TFA-affiliated teachers, including both active corps members and alumni who continue to teach in M-DCPS beyond their 2-year commitment (although the large majority of TFA who are linked to students in a classroom are active corps members). We display the most commonly-taught courses by subject for TFA teachers in Table A1. Substantial numbers of corps members teach intensive math or intensive reading, which are courses designed for students who had previously failed tests required for graduation (i.e., Algebra 1 or Grade 10 ELA).
Three analysis samples are used for the study: one in which students are linked to their math teachers, one in which they are linked to their ELA teachers, and one where students are linked to their science and social studies teachers. In elementary school, where students are typically taught by the same teacher throughout the school day, these samples largely coincide. In these samples, the TFA flag refers to teachers who taught the students in that subject, not teachers of other subjects (e.g., in the case of a middle school student linked to four different teachers for these subjects, and only their math teacher is TFA, the TFA variable will be flagged only in the math sample and not in the other samples where the student appears). Table 1 presents descriptive statistics of key variables for students in the analysis sample broken up into TFA versus non-TFA across the three sample definitions.
TFA Counts by Subject, Grade, and Year

Note. TFA in subject (grade or year) cells. Lists number of unique TFA teachers in each cell. A teacher can be present in more than one cell in a panel if they are linked to students across multiple subjects (common in elementary school) or grades (common in secondary school). sci + ss = science and social studies.
Comparing the first two columns of Table 2, it is clear that TFA teachers are much more likely to serve students from high-need backgrounds as measured by FRL eligibility, exhibit lower prior test scores and course grades, and miss more days of school due to absences and suspensions. In addition, given the structure of the TFA 2-year commitment, it is no surprise that students in TFA classrooms are exposed to, on average, teachers with far fewer years of experience. Patterns are similar for ELA classrooms (columns 3 and 4) and science/social studies classrooms (columns 5 and 6). The results in Table 2 are all consistent with TFA placement patterns of choosing high-need schools in which to place its corps members. Finally, we note that the concentrations of TFA corps members in the district has varied over time, with the highest concentrations observed during the 2013–2014 and 2014–2015 school years, as documented in Backes and Hansen (2019).
Summary Statistics

Note. Unit of observation is student-year. Compares students in TFA classrooms to non-TFA classrooms. ELL = English language learner.
During the period of this study, TFA’s recruiting strategy shifted from one that was highly centralized nationally and focused on selective higher education institutions to one that was more localized and focused on recruiting individuals closer to the communities TFA serves. Though we cannot observe teachers’ institutions of origin, we can see some evidence of this shift in the demographics of the TFA corps in M-DCPS. To illustrate these changes, we plot the racial makeup of TFA and non-TFA teachers over time in Figure 1. Unfortunately, the yearly staffing files received from the district are missing teacher race from 2011 through 2014. This is a problem for TFA in particular due to the nature of the 2-year commitment. In 2012, for example, we do not know the race of the 2011 cohort in their 2nd year or the 2012 cohort in their 1st year, which is the vast majority of TFA in the district that year. A similar problem exists in 2013. We thus omit the TFA data points in 2012 and 2013. 6 Figure 1A displays the entire district. Despite this missing data issue, two notable patterns emerge. First, at the beginning of the sample period, the composition of TFA was much more White than other teachers in the district. Second, the share of White teachers has steadily fallen over time, with a steeper decline for TFA. The increase in the share of Black and Hispanic TFA teachers in the district in consistent with TFA’s nationwide strategy of increasing the diversity of their corps members; since 2014, about half of TFA placements have been teachers of color. 7 Figure 1B displays results for cluster placement schools only, defined as a school that ever received two new TFA corps members in the same year. While the patterns for TFA look very similar, there is a stark shift in the composition of non-TFA teachers. Comparing Figures 1A and 1B, non-TFA teachers in cluster placement schools are substantially less likely to be White or Hispanic and much more likely to be Black. This mirrors the student population in these schools. As shown in Table 2, about 70% of students taught by TFA are Black.

Teacher race by TFA status over time, entire district.
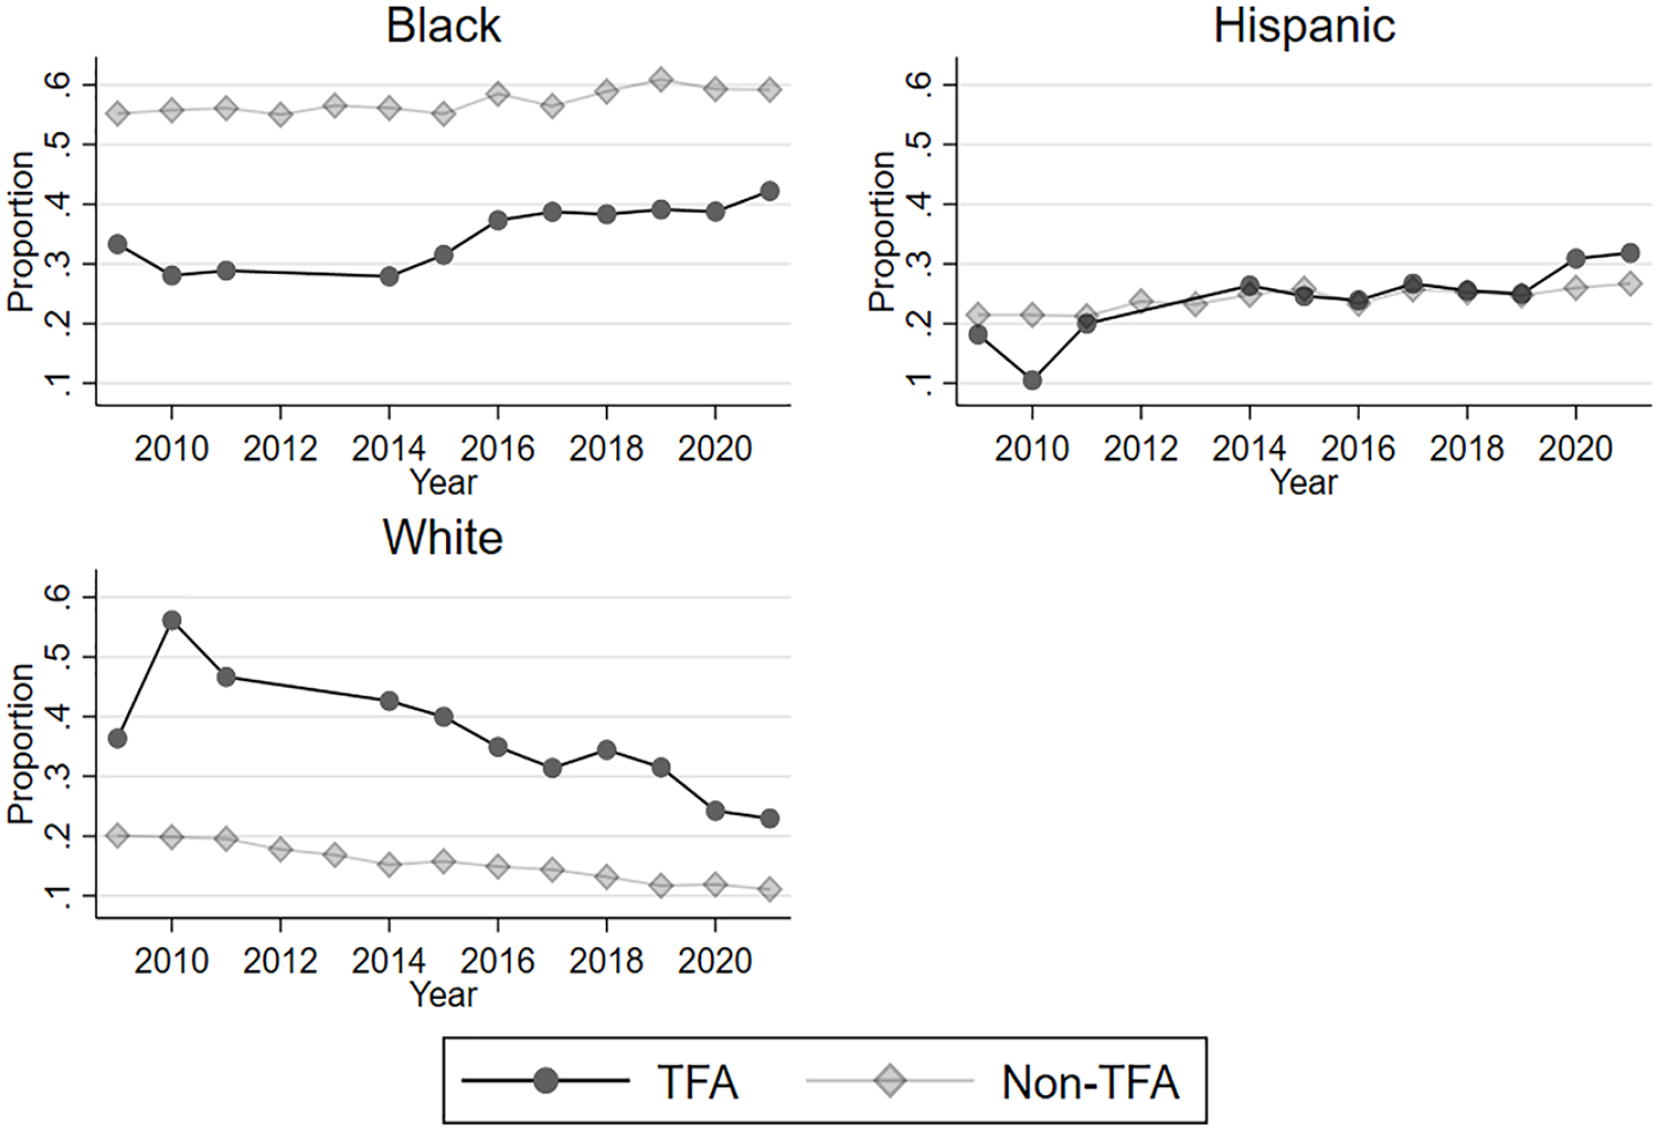
Teacher race by TFA status over time, cluster placement schools only.
Empirical Strategy
We estimate several variations of value-added-type models to address our research question. We begin with the standard model used in the TFA literature used to estimate the impacts of TFA relative to other early-career teachers in the same school (Backes et al., 2019):

In Equation (1), current student achievement for student i in subject s in Year t (
Chetty et al. (2014a) present evidence that accounting for prior test scores in Equation (1) is sufficient to remove potential biases associated with the sorting of students to teachers in another large urban district (validated using family income). Similar models have become widespread in estimating teachers' impacts on student test scores (Bacher-Hicks & Koedel, 2023). Nevertheless, due to the unique nature of TFA in that they are present in a select set of high-need schools, are disproportionately novice teachers, and often teach in high schools (where there is less evidence about the efficacy of prior-year controls for removing bias), we cannot rule out some degree of bias due to the sorting of students to teachers in this setting. Any bias, however, would have to be induced by factors unexplained by school attended, prior test scores, nontest outcomes, race, receipt of special services, and so forth.
We estimate Equation (1) across the full sample of students in M-DCPS by tested subject. Since these models generally pool students across multiple grades, grade-specific indicators are interacted with all explanatory variables in Equation (1) except the TFA flag to allow for the explanatory variables to be flexible across different grades. In addition, note that some students will be assigned to multiple teachers of record in the same subject and year. To accommodate for multiple teachers, we use the Full Roster Method described in Hock and Isenberg (2012), where observations in the regression are at the student–teacher link level and are weighted differently by teacher dosage. For example, a student with two math teachers in a given year—one of which is TFA and one is not—would have a 0.5 dosage for each teacher and thus an effective TFA dosage of 0.5. We display the share of students taught by TFA and not taught by TFA exposed to one teacher per subject in cluster placement schools in Table A3. Because students in these schools disproportionately take intensive math and intensive reading (Table A2), it is common for students in secondary schools to be linked to multiple teachers in these subjects. 9
The baseline model presented in Equation (1) can be readily extended for outcomes beyond student test scores. For example, for the examination of nontest outcomes such as student absences, above-grade course taking, and GPA, we simply substitute these outcomes into the dependent variable of Equation (1) and otherwise run the same models, with additional controls for prior-year values of absences, suspensions, and cubic functions of GPA in each of the subject buckets (math, ELA, and science/social studies).
Our research question concerns whether current TFA exposures continue to influence student outcomes into the future. When estimating future-year outcomes, we also replace test scores on the left-hand side with some future outcome (e.g., grades in math courses in the following year) as the dependent variable on the same set of explanatory variables (i.e., regressing a student outcome in time t + 1 on a TFA indicator in time t and a set of baseline controls from time t – 1). A potential complication of interpreting these following-year estimates is that they could be capturing, to some degree, conditional sorting in t + 1 based on TFA exposure in year t. For example, students assigned to TFA in t are somewhat more likely to be assigned to TFA in t + 1, conditional on the observables in Equation (1) and school fixed effects. 10 These estimates may thus be best framed as the combined effect of TFA exposure in t inclusive of different course assignments in t + 1 (including differential exposure to TFA in t + 1). These estimates still plausibly represent a causal effect of TFA exposure in t on outcomes in t + 1, but the effect combines both direct impacts in t and indirect impacts through course assignments in t + 1.
Results
Contemporaneous Test Scores
Impacts on test scores in math and ELA are presented in Table 3. Relative to prior work in M-DCPS (Backes & Hansen, 2019), the results in Table 3 include three additional school years: 2017–2018, 2018–2019, and 2020–2021 (with testing in 2019–2020 canceled due to the pandemic). The top panel combines observations from all school years and finds coefficients in the same ballpark as prior published studies examining TFA relative to other early-career teachers (see discussion in Backes et al., 2019), with an estimate of 0.092 standard deviations in math and 0.034 in ELA, both statistically significant. As in prior work, models with school fixed effects tend to find a more positive view of TFA, as the set of comparison teachers is restricted to other teachers in the schools that TFA is placed into rather than all teachers in the district. As noted above, the school fixed effects models are preferred as they likely serve as a better counterfactual for who would be hired if not for TFA’s presence in these schools.
Effect of TFA on Contemporaneous Test Scores
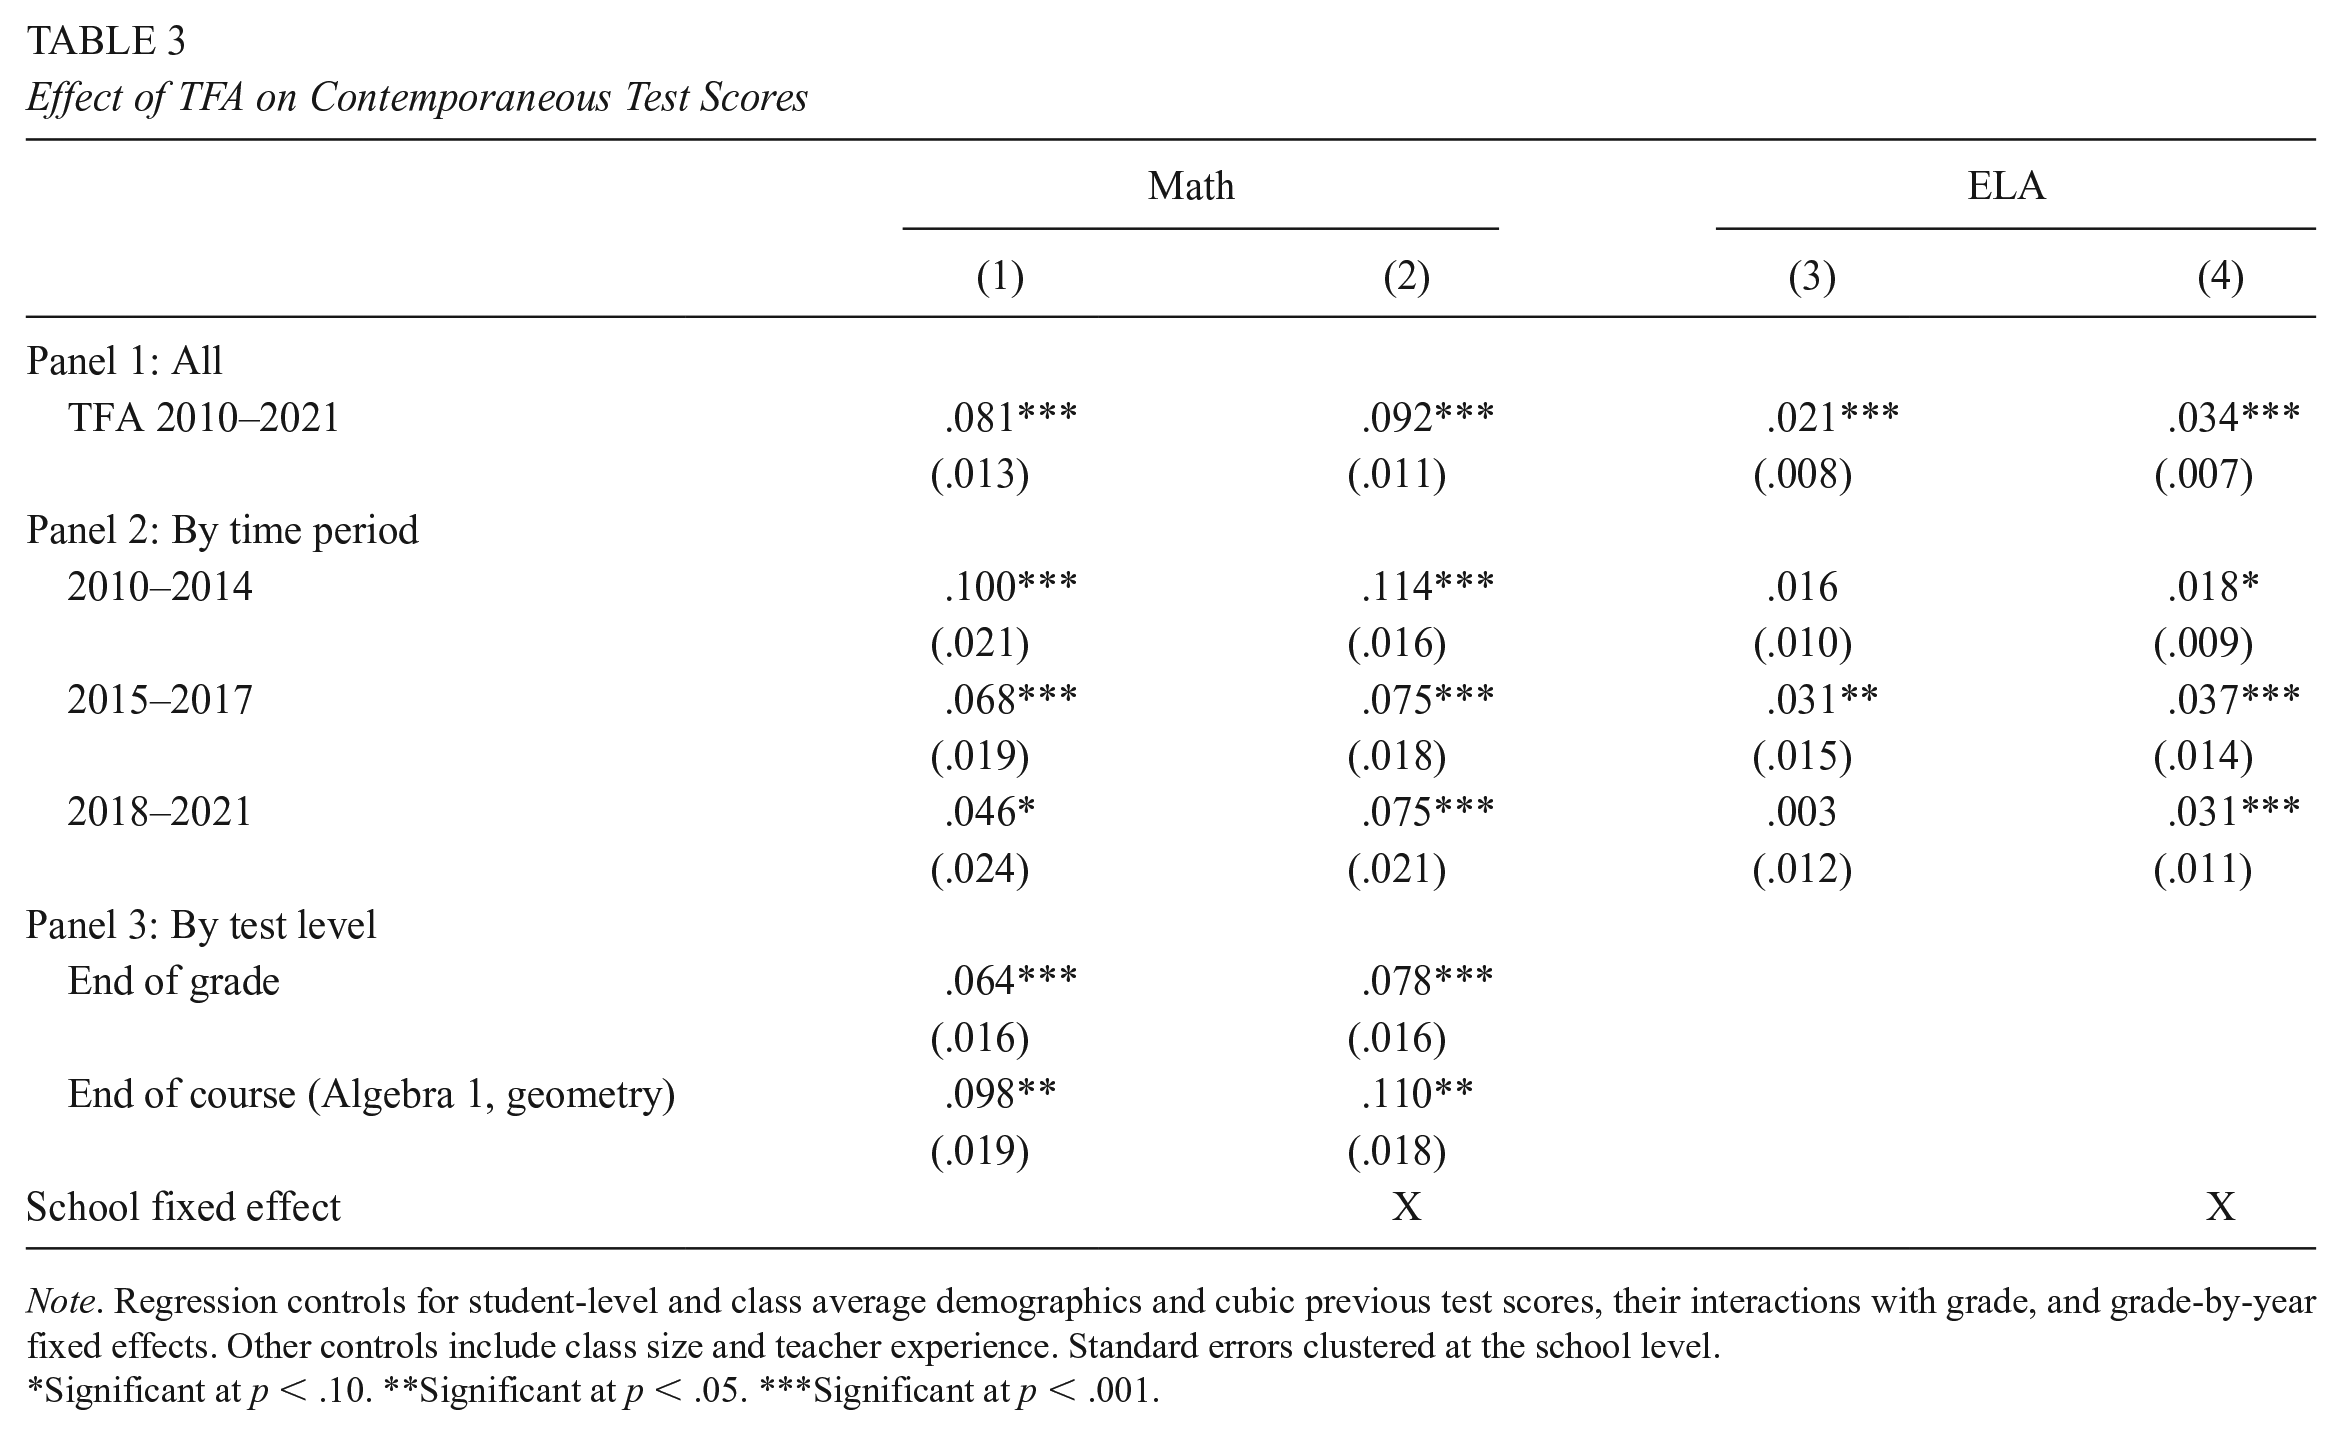
Note. Regression controls for student-level and class average demographics and cubic previous test scores, their interactions with grade, and grade-by-year fixed effects. Other controls include class size and teacher experience. Standard errors clustered at the school level.
Significant at p < .10. **Significant at p < .05. ***Significant at p < .001.
As described above, this article is the third wave of an ongoing evaluation of TFA in the district. Panel 2 of Table 3 breaks down results separately by each of the evaluation’s three study periods, with the prior two covered by Backes et al. (2019) for 2009–2014 and by Backes and Hansen (2019) for 2015–2017. The results for the school fixed effects models for 2018–2021 (column 2 for math and 4 for ELA) are similar to the results from the data obtained in the prior study period, 2015–2017. Overall, there is now evidence spanning more than a decade that, relative to other teachers in the schools in which they are placed, TFA teachers in M-DCPS have been effective at raising the test scores of their students in math and ELA.
The effectiveness of TFA in math declining in the district over time after the high point of 2009–2014 stands in contrast to Penner’s (2021) recent evaluation of TFA in North Carolina. That study finds that TFA effectiveness in math improved over time when examining 2000–2011 and that these differences cannot be attributed to observable characteristics such as certification status or master’s degree status. While our sparse set of teacher background characteristics limits our ability to investigate mechanisms in detail, the changes in the racial makeup of TFA teachers over time is suggestive of the composition of corps members changing in recent years. For example, Xu et al. (2011) find that most of the TFA advantage in math is explained by teacher certification scores and college selectivity. If TFA shifted some resources away from recruiting at selective colleges towards those closer to the intended placement regions that would result in improvements in corps member diversity, we may expect some downstream impact on student outcomes. 11 Nevertheless, the impacts on math test scores remain large and positive in recent years.
Panel 3 of Table 3 splits the math test score results by end-of-grade versus end-of-course exams (all ELA results are from end-of-grade tests, so no corresponding ELA results are shown). 12 Available EOC tests in math include Algebra 1 and geometry. While there are positive results for both math test types, TFA effects are largest for EOC exams. This is consistent with other evidence from TFA studies; for example, Xu et al. (2011) find very large TFA effects in math and science using EOC exams in high school and a student fixed effects model.
Contemporaneous Nontest Outcomes
Table 4 shows the relationship between TFA exposure and nontest outcomes in a given year. Because some outcomes are no longer specific to a given subject (e.g., math test scores for math teachers), we extend the math and ELA view from Table 3 to include the other core academic subjects: science and social studies. Note that each row in this table corresponds to a regression model using the listed measure as the dependent variable in our analysis and with the analysis sample defined by the column headings. The point estimates reported in the table are those corresponding to that for TFA teachers in the model specification defined by the row and column position. In the combined sample (labeled “All” in columns 1 and 2), the TFA point estimates correspond to TFA exposure in any subject.
Effect of TFA on Contemporaneous Nontest Outcomes

Note. Regression controls for student-level and class average demographics and cubic previous test scores and grades in each subject, prior absences and suspensions, their interactions with grade, and grade-by-year fixed effects. Other controls include class size and teacher experience. Nontest factor contains absences, suspensions, and whether a student repeated a grade. Standard errors clustered at the school level.
Significant at p < .10. **Significant at p < .05.
The first two sets of outcomes, chronic absence (at least 10 days absent) and whether a student was suspended, are an update of Backes and Hansen (2018), which measured TFA effects on absences and suspensions from 2010–2014, although not broken down by subject. Adding 7 additional school years (2015–2021; 2020 nontest measures were recorded despite the pandemic closures) and splitting results by math, ELA, and social studies/science, we largely recover the same pattern. Namely, students in TFA classrooms are less likely to be chronically absent or suspended in the school fixed effects models, although these effects are very small and generally not statistically significant. 13 Interestingly, these effects are not largest in math classrooms, which have large and positive test score effects. This pattern of teachers who raise test scores not necessarily being the same as those who improve other student outcomes is consistent with a growing literature documenting multiple domains of teacher effectiveness (e.g., Gershenson, 2016; Gilraine & Pope, 2021; Jackson, 2018; Kraft, 2019; Liu & Loeb, 2021; Petek & Pope, 2023), including in M-DCPS (Backes & Hansen, 2018). When examining the nontest factor that combines absences, suspensions, and grade repetition, students in TFA classrooms in a given year are about 0.01 standard deviations higher in this nontest factor in each subject, although none is statistically significant.
Table 4 also displays the relationship between TFA and course grades in a given year, which is in effect a measure of grading standards and not necessarily an outcome of interest (the next section contains measurements of course grades in the following year). The only notable pattern from this investigation is that it appears TFA teachers in ELA have harder grading standards than other teachers in the school.
Future Nontest Outcomes
Table 5 turns to the relationship between being in a TFA classroom in a given year and nontest outcomes in the following year. Because each outcome is conditional on being observed in the district in the following year, the first row shows the change in likelihood of being in the district in the following year for students in TFA classrooms relative to other classrooms as a check for differential sample attrition. Results in the fixed effects models contain very precisely estimated zeroes.
Effect of TFA on Following-Year Nontest Outcomes

Note. Regression controls for student-level and class average demographics and cubic previous test scores and grades in each subject, their interactions with grade, and grade-by-year fixed effects. Other controls include class size and teacher experience. Standard errors clustered at the school level.
Significant at p < .10. **Significant at p < .05. ***Significant at p < .001.
Student absences and suspensions in the year after TFA exposure generally follow the same pattern as in the year of exposure. In the school fixed effects models, six out of eight coefficients on days missed due to absences or suspensions are negative (with the positive ones being .001)—that is, less likely to miss school—and three of eight are significant at the 5% level, mostly driven by suspension in the following year. 14 In addition, the nontest factor consisting of absences, suspensions, and grade repetition is higher by 0.029 standard deviations and statistically significant. Examining the subject-specific columns, this again is due to the non-math TFA teachers. Thus, students exposed to TFA in a given year tend to have improved nontest outcomes in the following year.
For course grades, students taught by math TFA teachers tend to have better math grades in the following year, although this is only significant at the 10% level in both models (columns 3 and 4). This offers some evidence that the gains in math test scores for students in TFA classrooms represent actual student learning rather than some alternative explanation like teaching to the test. However, these gains in course grades in the following year are not seen in other subjects (recall that test score point estimates in ELA are roughly one-third the size of those in math).
More Future Math Outcomes
This section contains a deeper investigation into the ways in which math TFA teachers may influence the future outcomes of their students. We focus on math in particular for two reasons. First, the test score results and future course grade results indicate that this is the subject in which TFA teachers most influence student learning outcomes, both in the present year and in the future (in the case of course grades). And second, math follows a more linear progression than other studies—for example, progressing from Algebra I to geometry to Algebra 2—making it natural to examine whether students in TFA classrooms are more likely to advance to the next course in a sequence.
Results are displayed in Table 6, which examines the relationship between being in a TFA math classroom in Year t versus math outcomes in Year t + 1. Because the outcomes concern math courses and test scores in the following year, we first display the likelihood of taking a math course in the following year (conditional on being observed in the district). The format of Table 6 contains three columns. The first two are identical to Tables 2 through 4, with the first column including the base set of controls and the second column adding school fixed effects. In Table 6, we add an additional column that adds controls for whether a student took an advanced (honors, Advanced Placement [AP], International Baccalaureate [IB], gifted) or above-grade (e.g., Grade 7 math in Grade 6 or geometry in Grade 9) course in Year t. These controls may be important if, for example, being assigned to an advanced course in t is associated with both (a) outcomes in t + 1 and (b) being in a TFA classroom in t. Because the TFA assignment itself is unlikely to have caused the advanced course assignment in t, these controls may help avoid conflating course taking with TFA effects. Returning to the discussion of taking math in the following year, all three specifications are very close to zero.
Effect of TFA on Future Math Outcomes
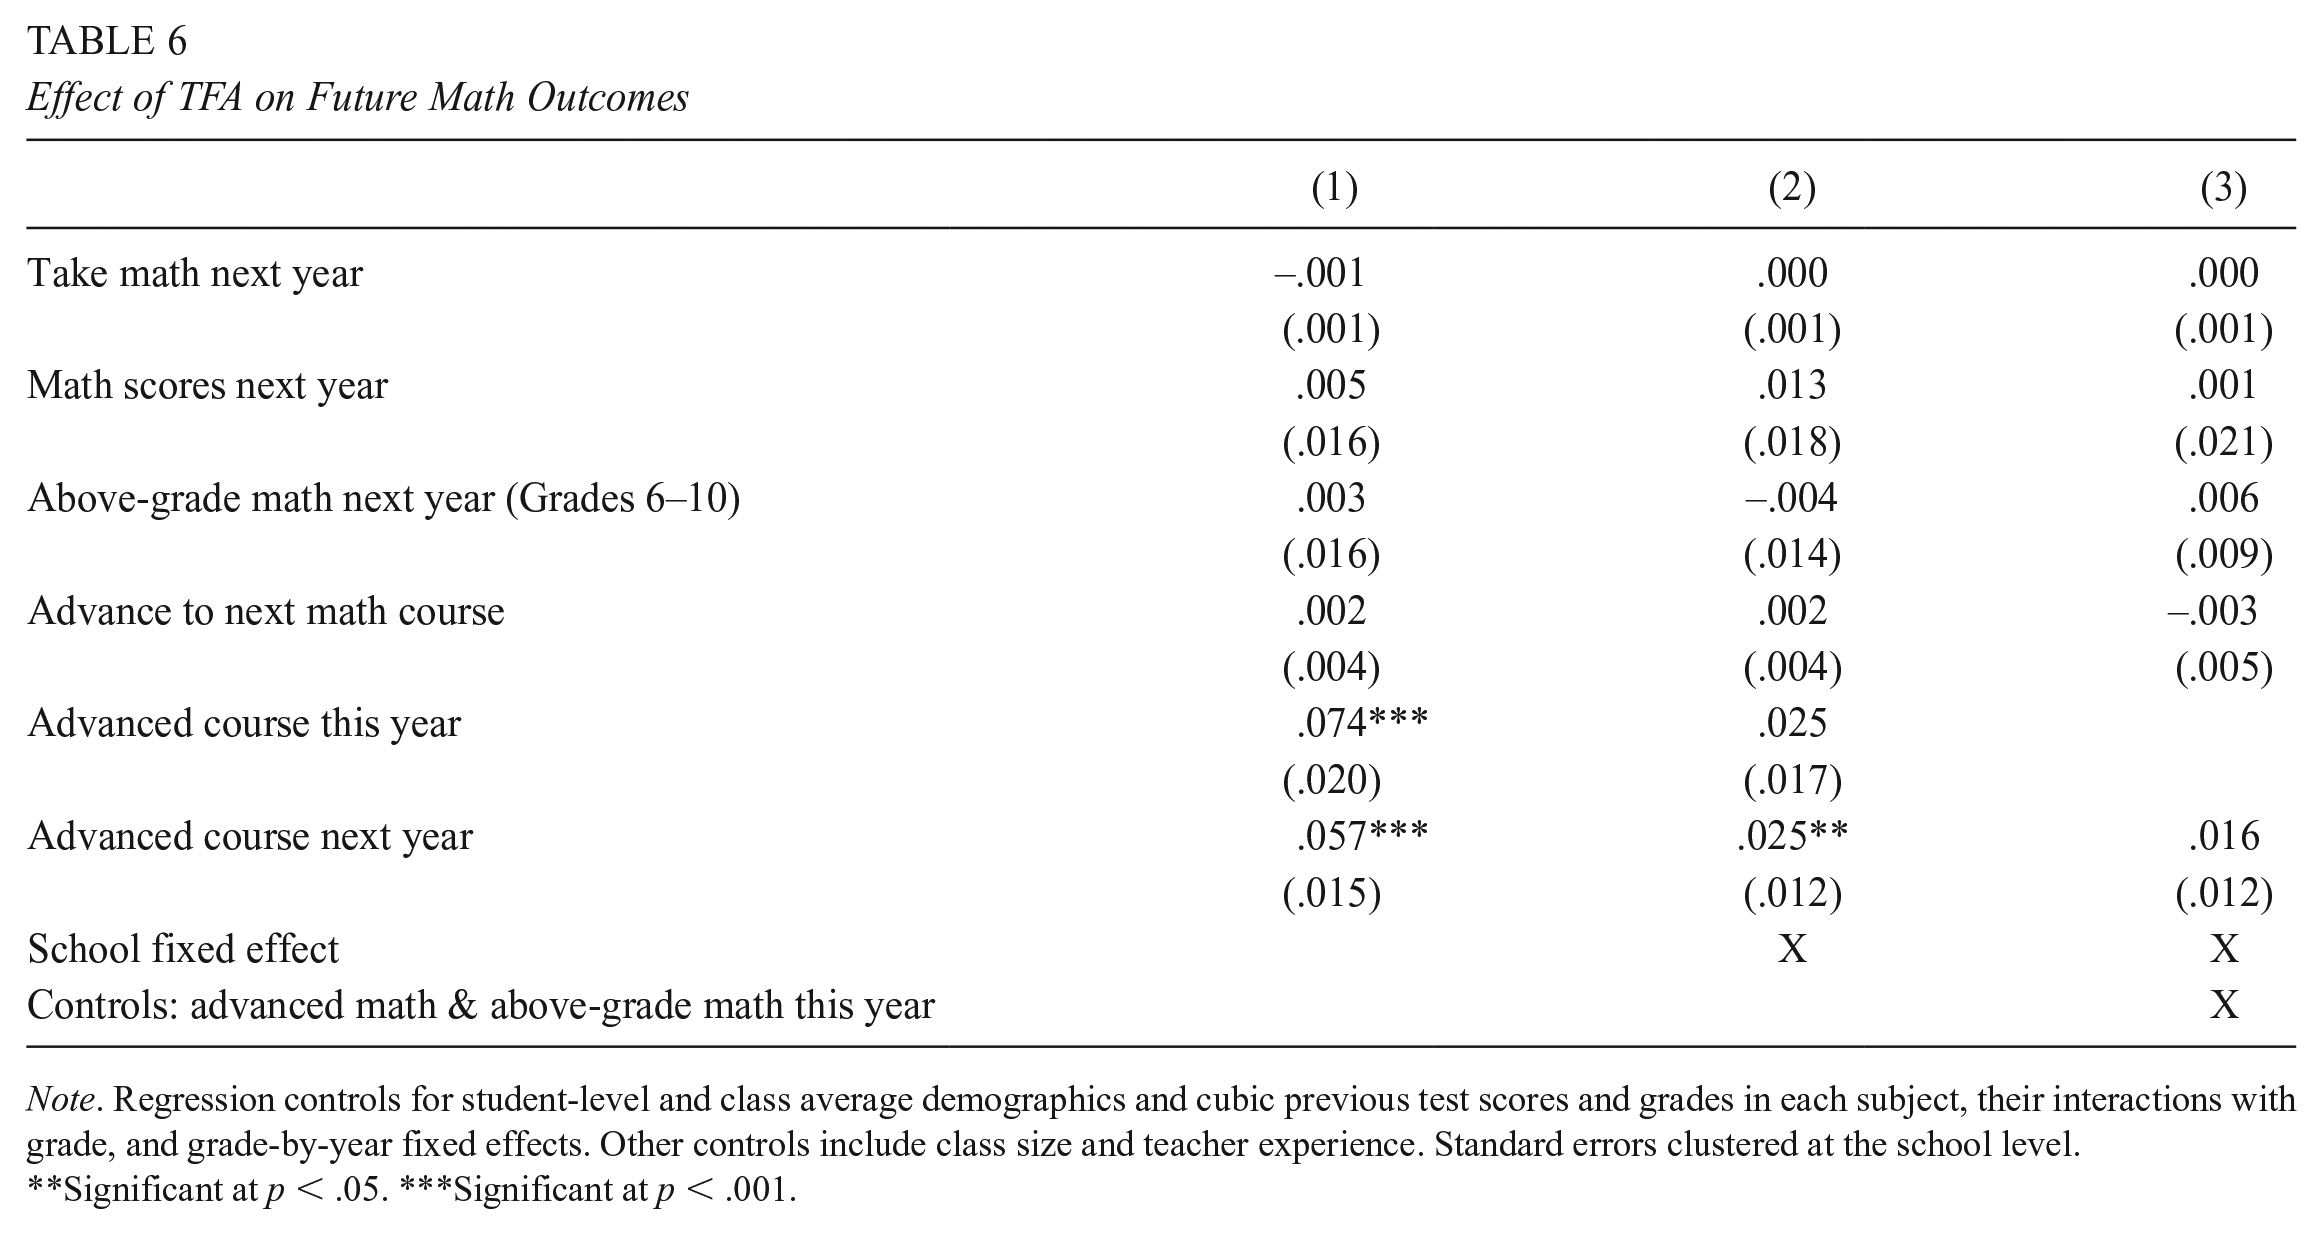
Note. Regression controls for student-level and class average demographics and cubic previous test scores and grades in each subject, their interactions with grade, and grade-by-year fixed effects. Other controls include class size and teacher experience. Standard errors clustered at the school level.
Significant at p < .05. ***Significant at p < .001.
The following row shows math scores in the year following exposure to TFA in math. Despite large gains in math test scores in the TFA exposure year, there do not appear to be any gains that persist to the following year (in results available from the authors, there is also no change in ELA scores in the following year). Given the large literature on the fadeout of test score gains (e.g., Chetty et al., 2014a), this does not come as a surprise. For example, if one used a fadeout value of .3 (Cascio & Staiger, 2012), we might expect the coefficient on math scores in following year math to be .092 × .3 = .028.
The final three rows examine future course taking in math. There is no TFA effect on whether a student advances to the next math course in the sequence (e.g., from Algebra I to geometry), which is consistent with the summary statistics in Table 1, where 96% (non-TFA) and 95% (TFA) of students advance, on average, to the next math course. TFA exposure also does not appear to affect whether or not a student goes into an above-grade math course the following year (defined for Grades 6–10). Turning to taking an advanced math course (AP, IB, gifted, honors) in the following year, results are sensitive to specification. There is a large association in the column 1 model with no school fixed effects. However, this coefficient is substantially attenuated when adding school fixed effects. This is likely because the typical student in schools where TFA is placed is low in the achievement distribution of the district and would be unlikely to take advanced math courses if in another school. However, these students are higher in the achievement distribution of their own schools and thus more likely to enroll in advanced courses. When adding controls for advanced and above-grade course taking in Year t in column 3, the results again attenuate and are no longer significant. Thus, the association between TFA and advanced course taking in the following year shown in column 1 are likely the result of school selection and TFA teachers being more likely to teach advanced courses in t, and not actually a causal TFA impact.
Summing up the results from Table 6, there does not appear to be a persistent impact of TFA on math test scores or the math courses that students take in the future. However, there is some evidence that students earn better grades in their next math course in the year after TFA exposure (Table 5).
Discussion
Prior evidence spanning several locales and including randomized control trials has found that students in TFA classrooms score higher on math assessments in the short term than otherwise similar students taught by early-career teachers in the same schools (Clark et al., 2013; Decker et al., 2004; Xu et al., 2011). In a study spanning more than a decade of data, we find the same to be true in Miami. In addition, we find small, but statistically significant, effects of TFA teachers on reading test scores. While prior research has found that teachers who raise student test scores also improve the long-run outcomes of their students, including college-going and labor-market earnings (Chetty et al., 2014b; Backes et al., 2023), prior to this study, there has been no direct evidence on the question of whether exposure to TFA improves student outcomes in ways that extend beyond the short term.
The results presented here suggest that exposure to TFA may also lead students to miss fewer days of school, both in the year of exposure and the year following. Further, TFA teachers that had the greatest association with reduced absences and suspensions were not the same who had the greatest impact on test scores, suggesting that TFA teachers are impacting students in varied ways, and focusing on test scores alone misses important dimensions of TFA effects. Prior work has found that students see gains in longer-term outcomes when they are taught by teachers who improve the nontest outcomes of their students in the short term (Backes et al., 2023; Jackson, 2018). These gains in nontest outcomes—along with marginally better course grades in math in the year following TFA exposure—suggest that short-run improvements in test scores following TFA exposure are not solely driven by teaching to the test or some other explanation that does not benefit students to the extent that the test score gains would suggest. Together, these results add to a growing body of literature showing that a narrow focus on test scores alone misses some of the ways in which teachers impact the outcomes of their students.
Returning to the motivating question from the district leaders and stakeholders, does the presence of TFA in the district make an enduring impact on students, or is their impact mostly ephemeral? And what does this say of the relative value of staffing with TFA versus alternate sources of labor? As discussed above, prior evaluation work on TFA in the district has shown that TFA corps members are associated with improved test and nontest outcomes in the year of TFA exposure. This study, using a longer panel of student data, supports these earlier results and adds new evidence suggesting that TFA teachers influence student outcomes at least one year following the year of exposure as well. Since improvements in nontest outcomes are predictive of long-term student outcomes such as college enrollment (Backes et al., 2023), we expect that students exposed to TFA will thus have improved future outcomes, though we cannot directly test them with our data. Additionally, since those TFA corps members associated with the greatest improvement in test scores apparently have little overlap with those that have the greatest improvement in nontest outcomes, the results suggest that the benefits of staffing with TFA may be more broad than the subset of corps members who teach math.
A common critique of the TFA program is that TFA corps members exit the high-need schools into which they are placed (and, frequently, the teaching profession as well) at high rates. Thus, low retention of these relatively effective teachers potentially neutralizes any short-term positive learning impacts. An analysis from Kane et al. (2008) of New York City teachers by different pathways into the profession shows that TFA teachers demonstrated the lowest retention among all types. However, the authors conduct a cost–benefit calculation that considers the short-lived benefits of high-performing TFA teachers and lower-performing (often underqualified) novice teachers that typically staff the same schools and conclude that the performance advantage of TFA in the classroom is strong enough to justify continuing to hire them even if they turn over at higher rates. This result has since been replicated using updated data from the same setting (Lovison, 2022) and in M-DCPS (Hansen et al., 2016), even though corps member retention in the district is notably lower than national TFA averages. TFA impacting nontest student outcomes would further tip the balance of these calculations in favor of TFA.
Finally, we should also consider the alternative hiring sources for these positions beyond TFA. The robust presence of TFA in high-need settings spanning more than a decade is a signal that the supply of teacher talent to these schools (outside of TFA) is weak. Viable alternatives to teacher hiring could be either developing a teacher pipeline internally within districts through establishing a Grow-Your-Own (GYO) or teacher residency program. 15 GYO and teacher residency programs are becoming an increasingly common strategy in urban areas, and available evidence suggests they perform roughly as well as traditionally sourced teachers (see a recent review in Worley & Zerbino, 2023). In comparison to TFA, the primary advantage they offer is a more diverse and stable workforce, though the cost point to districts on a per-placement basis is greater by about a factor of five. Factoring in search and replacement costs, however, GYO and, especially, teacher residency programs, could be worthwhile staffing strategies in the long run. In the absence of such programs, however, TFA offers a vetted option with benefits for students across a range of outcomes, even if it comes at the expense of high turnover.
Footnotes
Appendix A: Variable Definitions and Sample Construction
Repetitive TFA Exposure Given TFA Exposure in Prior Year

| TFA in Math | TFA in ELA | Any TFA | ||||
|---|---|---|---|---|---|---|
| Grade | No | Yes | No | Yes | No | Yes |
| (1) | (2) | (3) | (4) | (5) | (6) | |
| 5 | 1,799 | 593 | 1,999 | 841 | 3,017 | 1,900 |
| 6 | 1,898 | 459 | 1,658 | 553 | 2,544 | 1,735 |
| 7 | 3,624 | 3,243 | 4,452 | 2,570 | 5,986 | 8,929 |
| 8 | 4,717 | 3,080 | 3,547 | 2,438 | 6,718 | 9,164 |
| 9 | 5,142 | 1,847 | 4,146 | 2,862 | 8,365 | 7,057 |
| 10 | 8,708 | 3,402 | 7,002 | 8,370 | 9,440 | 16,078 |
| 11 | 9,187 | 1,337 | 11,656 | 6,670 | 12,466 | 13,664 |
Note. The table shows rate of TFA exposure in math given TFA exposure in math the prior year (columns 1 and 2), rate of TFA exposure given TFA exposure in ELA the prior year (columns 3 and 4), and rate of TFA exposure in any subject given TFA exposure in any subject the prior year (columns 5 and 6).
Acknowledgements
We acknowledge the cooperation of TFA in helping to accommodate this research effort with the district and provide TFA corps member lists, especially LaKeisha Wells-Palmer and Ryan Kryola. We thank James Cowan for providing helpful feedback. All errors are our own.
Declaration of Conflicting Interests
The author(s) declared no potential conflicts of interest with respect to the research, authorship, and/or publication of this article.
Funding
The author(s) disclosed receipt of the following financial support for the research, authorship, and/or publication of this article: This work was produced under financial support from the John S. and James L. Knight Foundation, including helpful feedback and input from Evette Alexander and Ashley Zohn. We gratefully acknowledge the cooperation of Miami-Dade County Public Schools, and especially Gisela Field and Angela Luzon, in providing data access and research support.
Notes
Authors
BEN BACKES is a principal economist at the American Institutes for Research, 1400 Crystal Drive, 10th Floor Arlington, VA 22202-3289; e-mail:
MICHAEL HANSEN is a senior fellow in the Brown Center on Education Policy at the Brookings Institution, 1775 Massachusetts Ave NW, Washington, DC 20036; e-mail: