
Abstract
Public preschool boosts academic skills in kindergarten, but little is known about whether that boost lasts to third grade because many studies stop directly assessing children after kindergarten. The current study tests for sustained associations between preschool attendance and an array of repeatedly measured, directly assessed language and math skills; we do this separately for public pre-K and Head Start, the two major publicly funded preschool programs. We draw on a large, racially diverse sample of children from families with low incomes in Tulsa, OK (N = 689, Mage at 3rd = 8.5 years). Using propensity score weighting, we compare children who attended school-based pre-K or Head Start to those who did not attend preschool. Both school-based pre-K and Head Start attenders outperformed preschool nonattenders on numeracy in third grade. There was weaker evidence of a sustained preschool advantage on language and literacy skills, and no evidence that associations differed by preschool program.
Keywords
There is wide agreement that public preschool attendance has an immediate positive effect—measured at the end of preschool or the start of kindergarten—on children’s language, literacy, and math skills (Phillips et al., 2017). This consensus is based on a wealth of studies of scaled-up contemporary public preschool programs in Boston, MA; Tulsa, OK; Tennessee; New Mexico; New Jersey; Georgia; North Carolina; and Virginia (e.g., Ansari et al., 2020; Gormley et al., 2008; Henry et al., 2006; Hustedt et al., 2021; Jenkins et al., 2016; Johnson et al., 2023; Lipsey et al., 2018; McCormick et al., 2021; Peisner-Feinberg & Schaaf, 2011; Weiland & Yoshikawa, 2013), as well as several multistate pre-K studies (Barnett et al., 2018; Wong et al., 2008) and the national evaluation of Head Start (Puma et al., 2012).
Where debate continues, however, is around whether preschool benefits to academic skills are sustained after children leave kindergarten and progress through elementary school. This is in part because the evidence on longer-term outcomes has been—and continues to be—sparser (Phillips et al., 2017). The majority of the studies listed that found immediate positive effects of preschool stopped following children after kindergarten. Several of these picked up again with state standardized test scores in third grade—the first time such tests are administered—and documented significant positive effects of preschool on language (Barnett et al., 2013; Dodge et al., 2016) and math (Barnett et al., 2013; Dodge et al., 2016; Gormley et al., 2018; Hill et al., 2015) test scores. However, this approach is limited because it provides no data on the period between kindergarten and third grade and makes the questionable assumption that measures directly assessed in kindergarten and those drawn from standardized tests in third grade are comparable (Hummel-Price et al., 2023).
A more complete test for sustained benefits would repeatedly measure the same skills from kindergarten through third grade. To date, only four studies have done so, all of which used experimental or quasi-experimental designs: the national Head Start Impact Study (HSIS) and evaluations of state or local public pre-K programs in Boston, New Jersey, and Tennessee. Two of these studies (Boston and New Jersey) found sustained benefits of pre-K on the same repeatedly measured academic skills but only continued to measure those same skills as far as second grade (Frede et al., 2009; Weiland et al., 2021). The other two studies (HSIS and Tennessee), which notably used experimental designs, repeatedly measured the same academic skills through third grade but found no sustained preschool advantage at that time point (Lipsey et al., 2018; Puma et al., 2012). There is thus a pressing need to continue to explore sustained pre-K impacts using repeated direct assessments through the early elementary grades.
The current study addresses this need. It builds on this small evidence base by examining language, literacy, and math skills in third grade, using the same measures assessed in kindergarten and first grade (no data were collected in second grade due to COVID-induced, districtwide school closures). We conducted this test using a large and highly diverse sample of children from low-income households who attended public preschool in Tulsa, OK in 2017. Importantly, we separately examine the two primary public preschool programs serving children from families with low incomes in the year before kindergarten—the federal Head Start program and local school-based public pre-K provided in the Tulsa Public Schools (TPS). This is significant because a majority of preschoolers from families with low incomes in the United States attend Head Start or state pre-K (Friedman-Krauss et al., 2022; Office of Head Start, 2019), but the programs differ in ways that may influence their potential to produce lasting academic benefits. For instance, Head Start has a long history of being a “whole-child”-focused program that emphasizes supports for academic as well as nonacademic skills in the social, emotional, and health domains (Phillips et al., 2009). Head Start is also targeted to, and provides more comprehensive supports for, families in poverty. School-based pre-K, on the other hand, is generally more academically focused (Desimone et al., 2004; Johnson et al., 2022) and, in Tulsa, is universally available, thus offering a more income-diverse peer group than children enrolled in Head Start experience. Ours is the first study to test whether, among children from families with low incomes, the benefits of attending Head Start and school-based pre-K in the year before kindergarten are sustained in subsequent elementary grades—including third grade, which is this paper’s focus. Results will inform ongoing local and national early education policy debates about allocating funds for historic preschool expansion efforts.
Prior Studies
Prior studies seeking to test whether public preschool (pre-K or Head Start) benefits endure beyond kindergarten fall into two sparsely populated categories: (1) five studies that directly assessed children in kindergarten but then stopped and switched to state administrative data via third-grade standardized test scores, and (2) four studies that continued directly assessing children in the years between kindergarten and third grade.
Of the five studies that assessed children in kindergarten and then switched to third-grade state standardized test scores, all but the Tennessee study (Durkin et al., 2022; Lipsey et al., 2018) found evidence of lasting benefits of preschool attendance on language or math (Barnett & Jung, 2021; Barnett et al., 2013; Dodge et al., 2016; Hill et al., 2015). Yet, this approach has several limitations. While state tests are reasonable low-cost alternatives to research-based direct assessments, they do not provide insight into the specific skills on which preschool attenders’ significant advantages are sustained (or dissipate). This is important, as scholars have recently found more durable pre-K impacts—at least as of the spring of kindergarten or fall of first grade—on specific skills not well-captured by state standardized tests (Ansari et al., 2020; Hummel-Price et al., 2023; Johnson et al., 2023; McCormick et al., 2021). Additionally, as other scholars have recently noted (Weiland et al., 2021), reliance on third-grade state test data leaves a “black box” around patterns of sustained preschool benefits in the years immediately after kindergarten, thus challenging efforts to focus early elementary classroom instruction on skills that require the greatest support. Hence, there is a need for preschool evaluation research administering the same measures repeatedly from kindergarten to third grade.
Only four studies of contemporary public preschool programs have repeatedly measured the same outcomes from kindergarten onward. Two of these, in Boston and New Jersey, used quasi-experimental designs and found sustained positive associations between preschool attendance and the same academic skills measured repeatedly. However, their repeated measurements only lasted until second grade, even though third grade is a critical pivot point when many states, including Oklahoma, make consequential grade-retention decisions. Moreover, both prior studies only evaluated pre-K and not Head Start. Their findings were positive: the study of Boston’s universal pre-K program found benefits of school-based pre-K attendance on literacy that persisted across kindergarten, first, and second grades (Weiland et al., 2021). This study did not assess math skills. The evaluation of New Jersey’s public Abbott Preschool Program found positive effects on children’s literacy, language, and math skills in kindergarten, first, and second grade (Frede et al., 2009).
Two other studies that used experimental designs repeatedly measured the same academic outcomes through third grade but yielded mixed findings. An evaluation of Tennessee’s public Voluntary Pre-K (VPK) program found that initial positive associations between pre-K attendance and language skills either faded or became negative after first grade; positive associations with math either faded or became negative by the end of kindergarten (Lipsey et al., 2018). The national Head Start Impact Study (HSIS) found that positive associations with language faded after first grade, and there were no associations with math after preschool ended (Puma et al., 2012).
It is difficult to interpret the contradictory findings produced by this suite of studies. Notably, those using experimental designs did not find enduring impacts, though the HSIS suffered from documented crossover, whereby children in the no Head Start group received Head Start and vice versa, which may have diluted potentially significant findings (Morris et al., 2018). The HSIS also occurred approximately two decades ago, before a multitude of legislative changes designed to improve Head Start’s quality were implemented; this limits its current applicability. The other two more recent studies in Boston and New Jersey relied on quasi-experimental designs and, like the Tennessee study, focused exclusively on state pre-K classrooms. Of course, there are also numerous site-specific differences across these state contexts that could account for differing results, including universal (Boston) vs. targeted (Tennessee) vs. targeted-by-district (New Jersey) access to pre-K. Clearly, more evidence is needed on both Head Start and public pre-K using contemporary data from additional regions.
Current Study
The current study expands the evidence base on sustained preschool benefits by pursuing answers to two questions. First, we ask whether positive associations between TPS pre-K and Head Start attendance in Tulsa, OK, and academic outcomes previously detected in kindergarten and first grade are still evident in third grade. There are several reasons to suspect this will be the case. As discussed previously, two of the four studies that have repeatedly assessed the same outcomes between kindergarten and later elementary school have found benefits that were sustained through second grade (Frede et al., 2009; Weiland et al., 2021). Perhaps more compelling is prior research with the current study’s sample that found that the differences between preschool attenders and nonattenders first evident in kindergarten not only remained significant in first grade but with effect sizes of similar magnitude, thus demonstrating minimal fade-out (Johnson et al., 2023). In this sample, as of first grade, children who attended TPS pre-K outperformed nonattenders on measures of literacy, language, and math. Children who attended Head Start also outperformed nonattenders on measures of literacy and math.
Our second research question asks whether there are differences in sustained associations according to the type of public preschool program—TPS pre-K or Head Start—children attended. This is a novel contribution, as prior studies of sustained effects beyond kindergarten have not separately analyzed the benefits of Head Start and school-based pre-K attendance relative to each other and to no preschool attendance (Frede et al., 2009; Lipsey et al., 2018; Puma et al., 2012; Weiland et al., 2021). For policymakers seeking to deploy public funding for preschool most efficiently, it is critical to examine the relative long-term benefits of attending one program or the other for children from families with low incomes.
We tentatively hypothesize that positive effects of public preschool attendance are more likely to be sustained in third grade for TPS pre-K attenders than for Head Start attenders. This hypothesis relies on documented program differences—namely, the more academic focus of school-based pre-K relative to Head Start. In Tulsa, TPS pre-K programs are located in elementary schools, where expectations for pre-K students may be influenced by the larger K–5th grade context. Indeed, school-based pre-K programs are increasingly focused on teaching the early reading and math skills that are expected by kindergarten teachers and measured by state tests (Daily et al., 2010; Desimone et al., 2004; Weisenfeld et al., 2020). In research on an earlier cohort of Tulsa students, pre-K teachers were observed to spend more time on academic content relative to Head Start teachers (Phillips et al., 2009), which has been associated with greater learning growth (Claessens et al., 2014; Fuller et al., 2017). This could explain why studies generally find that the kindergarten academic skills of children who attended public pre-K are more advanced than those who attended Head Start as 4-year-olds (Gormley et al., 2010; Henry et al., 2006; Lee et al., 2014; Magnuson et al., 2007).
Methods
Setting and Preschool Program Information
Data are drawn from the Tulsa School Experiences and Early Development (SEED) Study, which has been following a cohort of children from families with low incomes in Tulsa, OK, since preschool, comparing those who attended publicly funded programs (TPS school-based pre-K or Head Start) to those who stayed home with a parent or relative. We have previously reported on the associations between preschool attendance and outcomes as of the fall of kindergarten and the fall of first grade (Johnson et al., 2022, 2023). The present report extends these analyses through the fall of third grade (no data were collected in second grade due to COVID-induced districtwide school closures).
In Tulsa, approximately 82% of 4-year-olds from families with low incomes attend public preschool. The bulk of public preschool for 4-year-olds is administered in classrooms in TPS (TPS pre-K) and in Community Action Program (CAP) of Tulsa Head Start (Head Start). TPS pre-K and Head Start differ insofar as TPS pre-K is universal, and Head Start limits eligibility to families with incomes at or below 100% of the federal poverty line. TPS pre-K classrooms are located in public elementary school buildings, while Head Start classrooms are located in free-standing centers. Despite these differences, the two programs have similar quality standards. CAP Tulsa and TPS both require lead teachers to have a BA and specialized training in early education, and both programs pay preschool teachers on the same pay scale as K–12 teachers in TPS. Given that CAP Tulsa Head Start has a more collaborative relationship with the TPS school district than do Head Start programs in other cities, any differences found between the two programs in our data may underestimate what exists in other localities.
Sample
Children in the TPS district from households with low incomes (family income below 185% of the federal poverty level or received public benefits [e.g., WIC; TANF] in the last year) were enrolled in Tulsa SEED at age 3 (2016), at age 4 (academic year 2017–2018), or in kindergarten (academic year 2018–2019). Recruitment strategies differed slightly across waves to capture a range of preschool experiences (Johnson et al., 2022, 2023).
At age 4, the preschool year, children in our study attended public preschool in one of two setting types: school-based pre-K in a TPS public or affiliated public charter school or Head Start at a CAP Tulsa Head Start center (an additional 34 4-year-olds attended an Educare Early Childhood School program; given Educare’s programmatic alignment with Head Start, we include those children in our Head Start group). Consent rates among preschool attenders were high (approximately 95%).
The following year, in kindergarten, we recruited preschool nonattenders: children who had not attended TPS pre-K, CAP Head Start, Educare, or another center-based preschool the previous year. Preschool nonattenders were recruited from the same schools serving preschool attenders. Candidate families were identified based on school records, and research staff sent recruitment materials home in backpacks and went to school events to meet parents in person. A parent-reported screener questionnaire captured family income and whether children had enrolled in any center-based preschool programs the previous year. Of the kindergarten entrants deemed eligible for study enrollment (parental care and low family income), approximately 43% consented. The University of Oklahoma-TulsaInstitutional Review Board approved all study protocols.
In the fall of kindergarten (2018), the sample included 1,093 children. By the fall of third grade, 815 study participants remained in the TPS district. Children who remained in the study at third grade were more likely to be Hispanic/Latinx and/or dual language learners (the two groups overlap substantially in our data) than children who left, and their mothers were less likely to have more than a high school degree and more likely to be married at the time of the child’s birth (Appendix Table A1). They were also slightly more likely to have been preschool attenders. They did not differ on maternal employment, household income, and household size.
Because the current analysis compares children who attended preschool in TPS pre-K or Head Start to those who did not attend any center-based preschool in the preschool year, we excluded 55 children who were not in one of these arrangements within the TPS district at that age (i.e., they attended another center-based preschool inside or outside of Tulsa, or they were in family child care), as well as three children who moved between these arrangements during the preschool year. We excluded another 30 children who had entered the study at age three but by the preschool year had a family income that exceeded 185% of the federal poverty line, and another 41 children because they were not assessed in third grade. The final analytic sample for the current study thus included 686 children. Of these, 522 (76%) attended TPS pre-K, 113 (17%) attended Head Start (or Educare), and 51 (7%) were preschool nonattenders. We note that the group of preschool nonattenders is small because public preschool is universal in Tulsa, and approximately 80% of 4-year-olds from families with low incomes attend TPS pre-K, CAP Head Start, or Educare in the year before kindergarten (Kathy Siebold, personal communication, May 18, 2017).
Children in the analytic sample were racially and ethnically diverse (Table 1): 54% were Hispanic/Latinx, 20% were Black, 6% were Native American, 10% were White, 9% were multiracial, and 1% belonged to another racial/ethnic group. About half (51%) were dual-language learners (DLLs), defined as living in a household where a language besides English was spoken. Half (50%) of mothers were married at the time of the child’s birth, and households had 4–5 members on average (additional sample descriptives appear in Table 1).
Sample Descriptive Statistics

We do not have data on all four-year-olds in Tulsa but can compare the characteristics of our sample to the population of children enrolled in TPS during the 2017–2018 year. Demographics of children in our sample generally reflected the demographics of students in TPS, with several exceptions: our sample included greater proportions of Hispanic/Latinx children (54% versus 37%), which overlaps with DLL status, who were also overrepresented in our sample relative to TPS at large (52% versus 35%). White children were underrepresented in our sample compared to TPS (10% in our sample versus 23% in TPS overall). Note, however, that our sample was designed to represent children from families with low incomes, not all children in the TPS district.
Measures
Preschool Attender Status
School and program administrative records, cross-referenced with parent reports, were used to identify preschool attenders and nonattenders. Children were coded as TPS pre-K attenders if they attended a TPS public school or TPS-affiliated charter school–based pre-K program for more than 50% of the offered days that school year. Children were coded as Head Start attenders if they attended a CAP-Tulsa Head Start or Tulsa Educare program for more than 50% of the offered days that school year. Children were coded as preschool nonattenders if they stayed home with a parent or relative.
English Literacy and Language Skills
In the fall of kindergarten, first grade, and third grade, we collected measures of children’s English literacy and language skills—letter-word identification, phonological awareness, expressive vocabulary, and language comprehension. Only English answers were accepted, but bilingual children (assessed by trained bilingual assessors) were prompted once per item if they responded in Spanish. Raw scores were used for all measures.
Letter-Word Identification
Letter-word identification skills—a measure of print recognition and letter-sound correspondence—were assessed using the Woodcock-Johnson-III (WJ) Letter-Word Identification subtest (Woodcock et al., 2001). This measure asks children to identify letters and pronounce sight words.
Phonological Awareness
Phonological awareness was assessed using the Clinical Evaluation of Language Fundamentals (CELF) Phonological Awareness supplement (Semel et al., 2003), which measures five phonological skills: syllable blending, syllable segmentation, rhyme detection, phoneme identification, and phoneme blending. Each skill test included a trial and five items; children received a point for each correct item. Within each skill score, children who failed trials were assigned a score of two standard deviations (SD) below the mean on that skill or, if two SD was less than zero, a score of zero. For analyses, a raw total score was created that summed scores across all five skills (α = .71).
Expressive Vocabulary
Expressive vocabulary was assessed using the CELF Expressive Vocabulary subtest, which asked children to label pictures (e.g., a tree branch, with target responses of branch, tree limb, or limb). For children who failed trial items, we assigned a score of two SD below the mean.
Language Comprehension
In kindergarten and first grade, comprehension was assessed using the CELF Sentence Structure subtest, which gauges children’s understanding of both syntax (grammar) and semantics (meaning). Here, the assessor reads a sentence, and the child is asked to point to an image that corresponds to the sentence (e.g., “Choose the picture where the girl who is standing in the front of the line is wearing a backpack”). Bilingual children were prompted once per item if they responded in Spanish. Raw scores were used; for children who failed trial items, we assigned a score of 2 SD below the mean. In third grade, comprehension was assessed with the WJ-III Passage Comprehension subtest (Woodcock et al., 2001), which asks children to read a written passage and identify a missing key word.
Math Skills
In the fall of kindergarten, first grade, and third grade, we assessed children’s generalized math skills using the WJ-III Applied Problems subtest, the measure of math conventionally used in preschool evaluation research, and a specific math skill: numerical fluency. Both were administered in English, but correct answers were accepted in Spanish.
Applied Problems
The WJ Applied Problems subtest (Woodcock et al., 2001) measured children’s mathematical problem-solving ability by asking them to solve computational word problems (e.g., “How many dogs are in this picture?”) and to perform basic math operations.
Numerical Fluency
Numerical fluency was measured with the Symbolic Numeral Comparison subtest from the Numeracy Screener, a paper-pencil task designed by Lyons et al. (2018). This task measures how efficiently children recognize the underlying meaning of number symbols. Each item in this task consisted of two symbolic numerals (1–9) presented side-by-side; 48 items (12 per page) were presented. Children were instructed to select the larger quantity and complete as many items as they could within one minute. Scores were calculated as the number of correct responses minus the number of incorrect responses to adjust for guessing.
Covariates
Drawing on a mix of parent-report and school or program administrative data, we included the following covariates measured as of preschool (reported retrospectively in kindergarten for preschool non-attenders): child race/ethnicity (Hispanic/Latinx, Black, White, or multiracial/another race, which, due to small sizes, combined children who were Asian American, Native American, Native Hawaiian, or Pacific Islander); child gender (female = 1); child DLL status; maternal education (any postsecondary education = 1); maternal employment status (full- or part-time = 1); mother’s marital status at child’s birth (unmarried = 1); mother’s age at child’s birth; and household size, log of household income, and child age at the start of preschool. Missing covariate data ranged from 6% (household size) to 37% (maternal employment). We imputed missing covariate data using imputation with chained equations via the mi estimate suite of commands in Stata v. 17; 25 imputed data sets were created and estimates and standard errors were combined across imputed data sets using Rubin’s rules.
Analytic Approach
We compare TPS pre-K and Head Start attenders to nonattenders in kindergarten, first grade, and third grade using a propensity score weighting approach. Although results for kindergarten and first grade have been previously reported (Johnson et al., 2023), they are recomputed here on the sample of children who were followed through third grade for the sake of comparison to third-grade results. We capitalized on nonparametric machine learning techniques via the TWANG routine (Griffin et al., 2014) to estimate propensity scores, defined as the likelihood of a given child attending versus not attending preschool, conditioned on observed covariates. TWANG’s algorithms provide optimal specification of the propensity score based on available covariates because they automatically account for interactions and nonlinearities in its prediction (Lee et al., 2010; Westreich et al., 2011). Hyperparameters were tuned in pursuit of balance rather than model fit following Griffin et al. (2017). We estimated iterative models, after which balance statistics and graphs were reviewed and hyperparameters were tuned to achieve better balance; this process was guided by the Stata TWANG tutorial by Cefalu et al. (2015). The final model allowed for 5,000 maximum iterations (ntrees = 5,000), two-level interactions (intdepth = 2), and a shrinkage value of 0.01 (shrinkage = 0.01). The two sets of propensity scores (one for children who attended TPS pre-K and one for children who attended Head Start) were calculated separately in TWANG, following McCaffrey et al. (2013).
The resulting propensity scores were used to create weights, referred to as inverse probability of treatment (IPT) weights. As with the propensity scores, weights were created separately for the two preschool attender groups. Preschool attenders were weighted to resemble the comparison group of preschool nonattenders. For children who attended TPS pre-K, the IPT weight was calculated as follows:

where
The TWANG package compares the distribution of covariates across the three groups (TPS pre-K, Head Start, and nonattenders) before and after applying IPT weights. To the degree that these characteristics are similar, post-weighting, between the TPS pre-K attender and comparison nonattender group, and between the Head Start attender and comparison nonattender group, balance is achieved (Austin & Stuart, 2015). Table 2 presents descriptive data on covariates by preschool attender status before and after IPT weighting. Covariate differences between attenders and nonattenders were dramatically reduced after weighting. The standardized difference in weighted means for all covariates across the TPS pre-K vs. nonattender groups was less than .25, an accepted threshold for sufficient balance (Stuart et al., 2013). Across the Head Start vs. nonattender groups, the standardized difference in weighted covariate means exceeded .25 for 3 of the 10 covariates: child race/ethnicity, child age at start of preschool, and mother’s age at child’s birth.
Characteristics of Preschool Attenders and Nonattenders, Before and After Weighting

Note. Characteristics of preschool nonattenders (control group) do not change after weighting using the average treatment on the control (ATC) approach.
To minimize the threat of bias introduced by this remaining imbalance, our final results were generated from “doubly robust” regressions (Funk et al., 2011). That is, regression models included IPT weights and also adjusted for all covariates used in the prediction of the propensity scores, an approach commonly used in recent preschool evaluations (Ansari et al., 2021; Hill et al., 2015; Weiland et al., 2021). This is particularly useful given the residual imbalances between Head Start and the nonattender groups (Table 2). At all waves, separate models were run for each outcome comparing each preschool attender group (TPS pre-K; Head Start) to nonattenders. All coefficients were standardized so that results may be interpreted as effect sizes. Robust standard errors accounted for the clustering of children in schools and classrooms.
Results
Figures 1 and 2 present standardized effect sizes banded by 90% confidence intervals for language and literacy (Figure 1) and math (Figure 2) outcomes for both preschool groups (TPS pre-K and Head Start) at each timepoint: kindergarten, first grade, and third grade. Given the small size of the comparison group, we interpret coefficients that are statistically significant at p < .10; exact p values are provided in Table 3.

Effect sizes of public preschool attendance on language and literacy skills in kindergarten, first, and third grades.

Effects of public preschool attendance on math skills in kindergarten, first, and third grades.
Results of IPT-Weighted Analyses Predicting Third-Grade Outcomes From Preschool Attendance

Note. Betas are reported as effect sizes. IPT weights are applied to all models, and all models control for child race/ethnicity, child gender, child age at the start of the preschool year, maternal education, maternal employment, whether the mother was married at child’s birth, mother’s age at child’s birth, dual-language learner status, household size, and log of household income.
As shown in Figure 1, TPS pre-K attenders did not outperform preschool nonattenders on letter-word identification in third grade. This was consistent with results from first grade, when the advantage found in kindergarten had already faded. They also did not outperform nonattenders on phonological awareness in third grade although they had in both kindergarten and first grade. On the other hand, TPS pre-K attenders maintained their kindergarten and first-grade advantage over nonattenders on expressive vocabulary, scoring approximately one-third of a standard deviation (SD) higher in third grade (β =.32, SE =.16, p =.06), as they had in first grade. TPS pre-K attenders also outscored nonattenders on language comprehension in third grade as they had in kindergarten and first grade, by approximately one-third of an SD, although this advantage was smaller than it had been in first grade (β = .29, SE = .17, p = .08).
Patterns were similar for Head Start attenders. They did not outscore nonattenders on letter-word identification in third grade, and their prior advantage on phonological awareness, evident in kindergarten and first grade, disappeared by third grade. Unlike TPS pre-K attenders, Head Start attenders no longer outperformed nonattenders on expressive vocabulary in third grade, as they had stopped doing so between kindergarten and first grade. However, similar to the TPS pre-K attenders, although the size of the coefficient was reduced, Head Start attenders continued to outperform nonattenders on language comprehension in third grade—as they had in first grade—scoring approximately one-third of an SD higher (β = .35, SE = .21, p = .09).
Figure 2 displays associations between preschool attendance and math outcomes. On applied problems, TPS pre-K attenders’ earlier advantage over nonattenders in kindergarten and first grade became nonsignificant by third grade (p = .11). However, TPS pre-K attenders maintained their kindergarten and first-grade advantage over nonattenders on numerical fluency, scoring approximately half a SD higher than nonattenders in third grade (β = .47, SE = .19, p = .01), just as they had in first grade. Similarly, Head Start attenders’ earlier advantage over nonattenders on applied problems was not statistically significant in third grade (p = .13), but their advantage over nonattenders on numerical fluency remained significant and actually increased in size from first to third grades (β = .68, SE = .24, p = .01), as it had done from kindergarten to first grade.
Post-hoc Wald tests revealed no statistically significant differences between the coefficients for TPS pre-K and those for Head Start for any outcome at any time point.
Sensitivity Tests and Supplemental Analyses
Several sets of alternative analyses were conducted to test the sensitivity of results to our main specification, IPT-weighted regression models with covariate adjustment. First, because Head Start is available to three-year-old children, it is possible that any Head Start benefit detected is due to those children having received two years of preschool (nearly all of our sample’s Head Start attenders, compared to approximately 12% of pre-K attenders, attended Head Start at age three). To account for this, we experimented with adding a control for whether preschool attenders attended Head Start at age three. The results were unchanged.
Second, because attrition between kindergarten and third grade differed by preschool attender status and some demographic characteristics (Appendix Table A1), we reestimated our models on our kindergarten sample but with imputed dependent variables in third grade. The overall pattern of results was the same for both preschool attender groups, but statistical significance faded for the language outcomes and remained only for numerical fluency.
Next, although it is unadvisable to include post-treatment covariates in propensity score models (D’Agostino, 1998), we tested the sensitivity of our results to reestimation of our primary models with third-grade school fixed effects; theoretically, this should control for unobserved differences related to differential selection into elementary schools, as well as differences in school type (Head Start attenders were more likely than TPS pre-K attenders or nonattenders to attend charter schools). The inclusion of school fixed effects reduced the strength of the association between TPS pre-K attendance and expressive vocabulary to nonsignificance; associations with passage comprehension and numerical fluency were unchanged. For the Head Start attenders, the inclusion of school fixed effects reduced the coefficient on passage comprehension to nonsignificance; although the magnitude of the effect on numerical fluency shrunk, the coefficient remained statistically significant (Appendix Table A2).
Next, because prior pre-K evaluation studies using Woodcock-Johnson outcomes have varied in whether they have used raw versus W scores, we tested the sensitivity of our results to the substitution of W scores for raw scores. Results were nearly identical for the three Woodcock-Johnson tests (letter-word identification, passage comprehension, and applied problems; see Appendix Table A3).
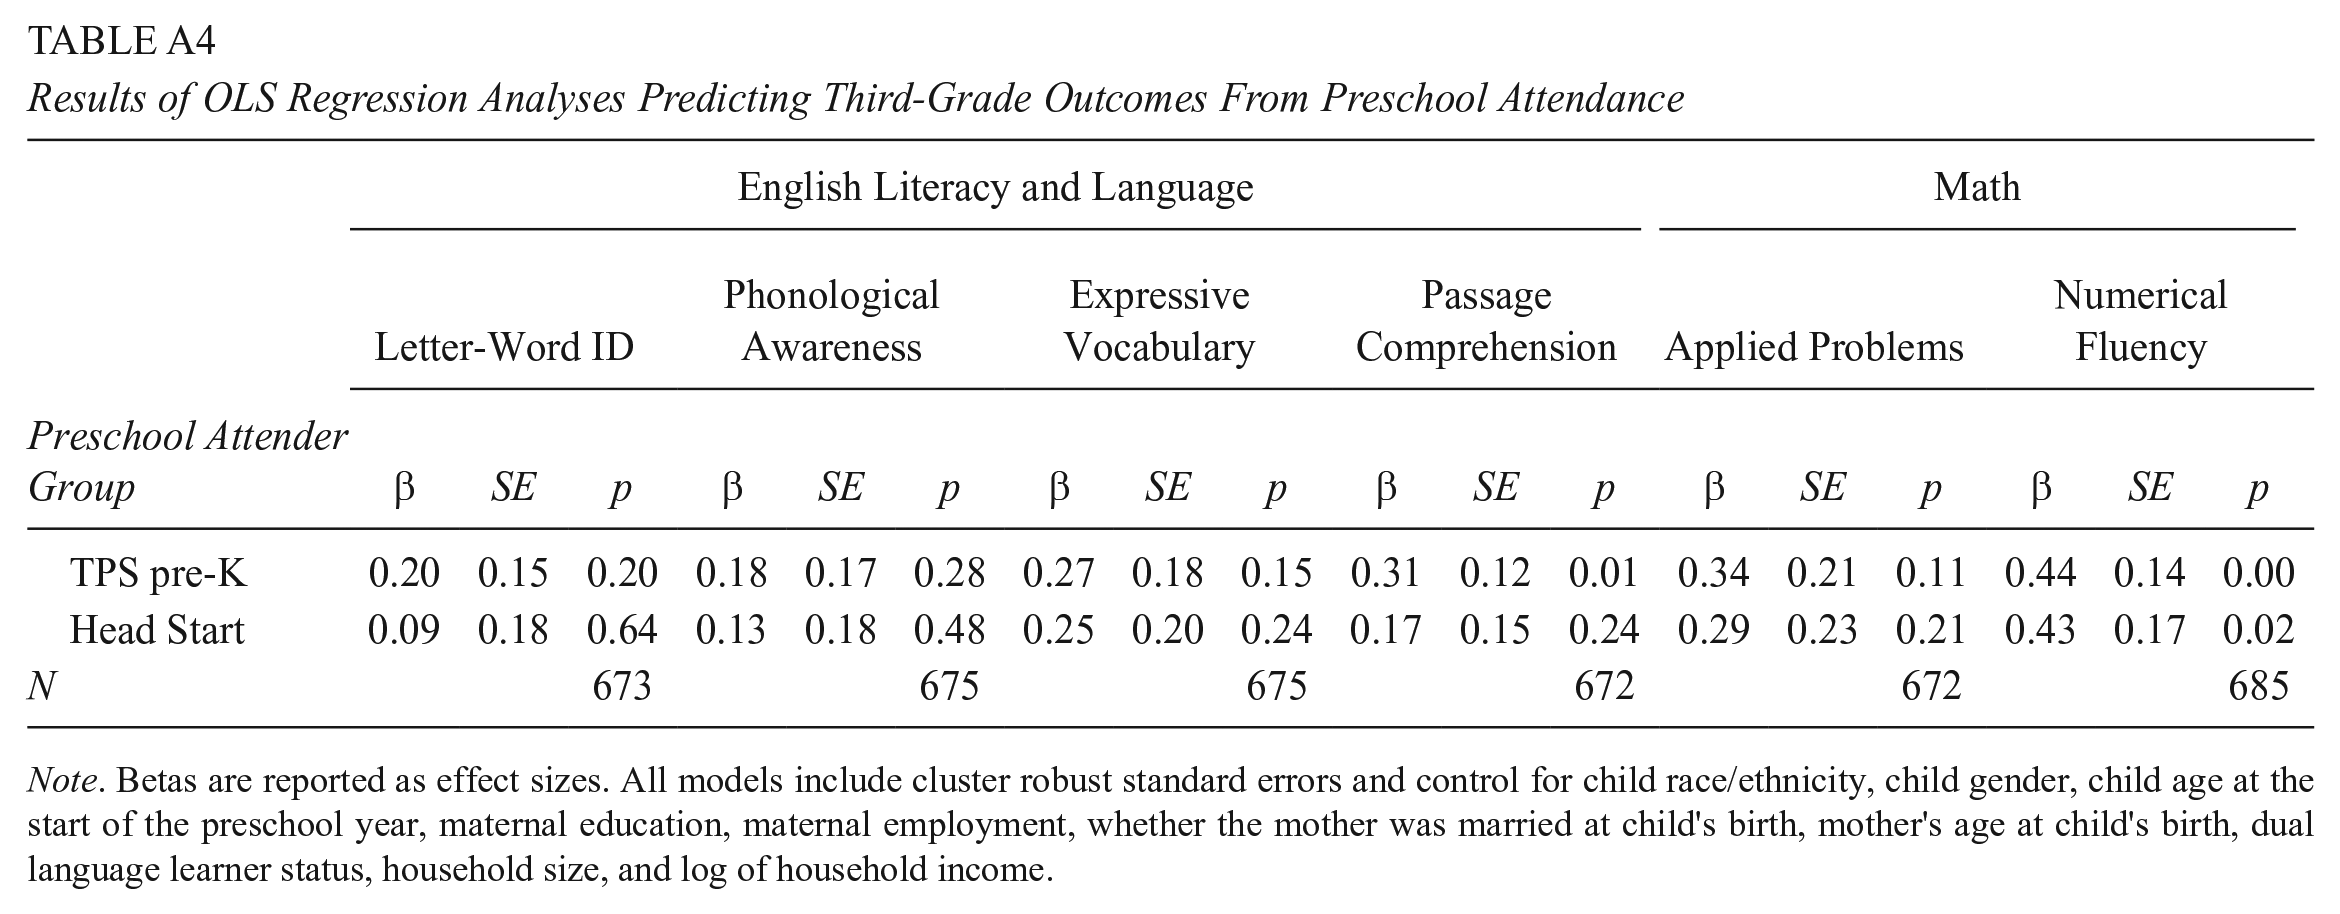
Finally, to test the sensitivity of results to an unweighted OLS regression approach, we reestimated our models in a traditional OLS framework with covariate adjustment (Appendix Table A4). For TPS pre-K attenders, the coefficient on expressive vocabulary became nonsignificant but the coefficient on passage comprehension became more significant; the coefficient on numerical fluency did not change. For Head Start attenders, the coefficient on passage comprehension became nonsignificant but the coefficient on numerical fluency—while smaller in size—did not lose statistical significance.
Discussion
Sustained Benefits of Preschool in Third Grade
Our study was designed to test for associations between public preschool attendance and third-grade academic outcomes among children from families with low incomes attending TPS pre-K or Head Start in Tulsa, OK. The pattern of findings across outcomes indicates that, overall, the benefits of public preschool attendance were sustained into third grade in this sample. Nevertheless, there is stronger evidence for some outcomes than others.
With respect to literacy and language skills, TPS pre-K attenders scored marginally higher than children who did not attend public preschool on expressive vocabulary, and both TPS pre-K and Head Start attenders scored marginally higher than nonattenders on passage comprehension. Yet even letter-word identification and phonological awareness seem to demonstrate enduring positive—albeit not statistically significant—associations at third grade. Taken together, effect sizes on all four language/literacy outcomes appear to be declining slowly over time across the kindergarten, first-, and third-grade years (e.g., among TPS pre-K attenders, on expressive vocabulary, from .49 in kindergarten, to .33 in first grade, to .32 in third grade). Perhaps with a larger comparison group, confidence intervals would be smaller, allowing for conventional levels of statistical significance at third grade.
Notably, the strongest sustained benefits of preschool attendance at third grade in the current study emerged for numerical fluency. Both TPS pre-K and Head Start attenders scored significantly higher than preschool nonattenders on numerical fluency. Surprisingly, pre-K attenders maintained the size of their earlier advantage over nonattenders, and Head Start attenders’ advantage over nonattenders actually increased in size at third grade. Why might this be? Numerical fluency is a specific math competency independent of language skills that is especially predictive of later math achievement insofar as it assesses foundational symbolic number knowledge upon which subsequent math lessons build (Merkley & Ansari, 2016; Nguyen et al., 2016). It benefits from explicit teaching and continues to improve with practice across the lifespan (Lyons et al., 2018), suggesting that early differences between preschool attenders and nonattenders may resist convergence longer than other math skills mastered earlier in elementary school.
Earlier positive associations of pre-K and Head Start with WJ applied problems at kindergarten and first grade were no longer statistically significant at third grade. However, as with language/literacy, effect sizes for WJ applied problems appeared to decrease slowly over time (e.g., among TPS pre-K attenders, from .70 in kindergarten to .58 in first grade to .33 in third grade) and with smaller confidence intervals, might have achieved statistical significance at third grade.
Our study, along with the Boston and New Jersey studies, provide a much more positive portrayal of enduring preschool impacts as compared to the null and negative results of the HSIS and the Tennessee state pre-K study. Despite problems of the HSIS noted earlier, re-analyses of the data have identified significant subgroup impacts in the short-term (Bloom & Weiland, 2015; Morris et al., 2018). In the long-term, other studies have found lasting impacts of Head Start on adult economic and health outcomes (e.g., Carneiro & Ginja, 2014; Deming, 2009). Our study, as well, supports the enduring value of Head Start enrollment for the school performance of children from families with low incomes. The findings of the Tennessee study, while experimental in design, stand in stark contrast to virtually all other studies of long-term pre-K effects on achievement, including state standardized test outcomes (e.g., Barnett & Jung, 2021; Gormley et al., 2018; Hill et al., 2015); other school-related outcomes such as attendance, special education placements, and disciplinary actions (Barnett & Jung, 2021; Gray-Lobe et al., 2023); and consequential adult outcomes such as civic participation and college attendance (Amadon et al., 2022; Gray-Lobe et al., 2023; Kitchens & Gormley, 2023). Replication of results is a guiding standard to enable conclusions to be drawn across studies in developmental science. Yet, anomalous findings, especially from strong research projects such as the Tennessee pre-K study, need to be taken seriously and require explanation. Unfortunately, there are so many conditions that vary from state to state beyond the research design used that such explanation has proven to be elusive. One conclusion is irrefutable: there is clearly an urgent need for additional longitudinal studies in diverse locales to solidify the evidence base surrounding preschool impacts in third grade and, ideally, beyond.
Type of Preschool Program
We had tentatively hypothesized that sustained preschool impacts may be more likely among children who attended TPS pre-K than those who attended Head Start. This hypothesis rested in part on past research showing that pre-K programs tend to place more emphasis on academics than Head Start programs in general (Phillips et al., 2009) and that pre-K graduates tend to outperform Head Start graduates in the short-term on the academic skills we assessed (Gormley et al., 2010; Henry et al., 2006; Magnuson et al., 2007). The results did not support this hypothesis. Children who attended both programs demonstrated some sustained associations with outcomes into third grade with surprisingly minimal fade-out. One reason that TPS pre-K and Head Start may confer similar advantages is that these two programs are more alike than they used to be, as Head Start programs have attempted to increase the rigor of their academic instruction in the last decade (e.g., Markowitz & Ansari, 2020). This may be especially true in Tulsa, where the CAP Tulsa Head Start program is intentionally aligned with the TPS pre-K program in many respects, such as quality standards, teacher requirements, and teacher pay. To the extent that the programs do in fact differ, this difference may serve as an advantage to our study population, which is exclusively children from families with low incomes. Head Start emphasizes the “whole child,” providing wrap-around supports for preschoolers from families with low incomes that are not typically provided in schools. This may afford this population of young students with precisely the added scaffolding and resources they need to acquire strong academic skills in a society that has relatively meager antipoverty policies.
Limitations
Our study has several limitations. First, although we employ a strong quasi-experimental approach adopted by other recent preschool evaluation studies (e.g., Ansari et al., 2021; Hill et al., 2015; Weiland et al., 2021), we cannot be certain that differential selection of children into preschool on unobserved variables is not confounding estimates of preschool benefits. Indeed, residual imbalance in covariate distributions on race, DLL status, and mother age, particularly across the Head Start and nonattender groups, remained even after IPT weighting. Our inclusion of covariates in the IPT-weighted regression is expected to have resolved this observable imbalance (Funk et al., 2011; Elizabeth Stuart, personal communication, May 11, 2022), but differential selection into preschool on unobserved covariates is still a concern. The extent to which our results replicate those reported by some prior studies that used the same measures also adds to the confidence that can be placed in our findings.
Second, our comparison group of preschool nonattenders is much smaller than the preschool attender groups. While this is a methodological weakness because it underpowered our analyses and made it difficult to achieve sufficient covariate balance, it reflects the reality of preschool in Tulsa where a majority of four-year-olds enroll in preschool. Not only are preschool nonattenders less represented in the population than preschool attenders, but nonattenders were less likely—by about half—to consent to our study than were attenders, similar to recent studies of public pre-K (see Ansari et al., 2021). Other unique aspects of preschool in Tulsa have implications for the generalizability of results. The TPS pre-K program—like other contemporary pre-K programs demonstrating sustained benefits (e.g., Boston)—is universal, meaning it is available to all families regardless of household income. Some evidence suggests that universal preschool programs produce stronger benefits than programs that concentrate children from low-resourced families in income-segregated classrooms (Cascio, 2019), like the program in Tennessee.
Public preschool in Tulsa is also higher on spending and quality than preschool in most other states. For instance, the National Institute of Early Education Research (NIEER) ranks Oklahoma seventh in the nation for total spending on public preschool and as one of only a handful of states that meet all (10/10) or nearly all (9/10) of NIEER’s program quality benchmarks (Friedman-Krauss et al., 2022). CAP-Tulsa’s Head Start and Tulsa Educare programs have also been documented as relatively high quality (see Choi et al., 2016; Phillips et al., 2009; Yazejian et al., 2015). To the extent that enduring impacts vary with program quality, Tulsa’s program would be expected to yield stronger long-term impacts than others that are lower in quality. Finally, preschool in Tulsa may also generate longer-lasting impacts because of its relatively high enrollments of Hispanic/Latinx and DLL students. Past research indicates that immediate preschool benefits tend to be larger for Hispanic/Latinx and DLL students (e.g., Bloom & Weiland, 2015; Weiland & Yoshikawa, 2013), including in Tulsa (Gormley, 2008). Whether this DLL advantage continues over time remains to be seen.
The historical context of the study also warrants consideration. Third-grade outcomes were collected in the fall of 2021, as children returned from a year of remote learning due to districtwide COVID-19-induced school closures. It is well-documented that remote learning stymied academic growth among elementary school–aged children, especially those from low-income and minoritized backgrounds (Engzell et al., 2021; Skar et al., 2021; Tulsa SEED Study Team, 2022). The implications of this massive educational disruption for sustained preschool impacts are not yet known (see Weiland & Morris, 2022), but it is possible that the diminished quantity (and possibly quality) of instruction during remote learning attenuated the strength of program impacts. If that is true, the associations reported here may constitute underestimates of the true potential of public preschool. Research projects, including our own, that have followed preschool cohorts through COVID-related educational (and other) disruptions will offer a rich source of lessons regarding which children succumb, survive, and thrive as they return to school, including examination of the role that preschool exposure may play in these patterns over time.
Conclusion
Our results provide evidence that public preschool attendance is associated with enhanced academic outcomes in the pivotal third-grade year. We find the strongest evidence for sustained preschool benefits on numerical fluency but encouraging patterns for measures of language as well. Indeed, the overall pattern of results—both significant and nonsignificant—suggests overarching academic benefits. Importantly, TPS pre-K and Head Start programs appear to do an equally good job supporting the academic skills of children from families with low incomes, well into elementary school.
Additional research replicating these findings in other regions is essential, but inconsistency in results across studies should be expected given diversity in the preschool programs studied, the populations served, the outcomes assessed, and other aspects of study design. In this context, replication of results across these many dimensions of variation may be the most appropriate guide to firm conclusions that can inform policy decisions. In the meantime, the preponderance of evidence from available studies, including this one, supports increased investments in preschool education, especially for children from families with low incomes (though not necessarily in targeted programs). Such investments carry the promise of keeping young children on successful academic paths though elementary school and beyond—a goal that is embraced by the U.S. public and is of paramount importance in this post-COVID era.
Footnotes
Appendix
Results of OLS Regression Analyses Predicting Third-Grade Outcomes From Preschool Attendance
| English Literacy and Language | Math | |||||||||||||||||
|---|---|---|---|---|---|---|---|---|---|---|---|---|---|---|---|---|---|---|
| Letter-Word ID | Phonological Awareness | Expressive Vocabulary | Passage Comprehension | Applied Problems | Numerical Fluency | |||||||||||||
| Preschool Attender Group | β | SE | p | β | SE | p | β | SE | p | β | SE | p | β | SE | p | β | SE | p |
| TPS pre-K | 0.20 | 0.15 | 0.20 | 0.18 | 0.17 | 0.28 | 0.27 | 0.18 | 0.15 | 0.31 | 0.12 | 0.01 | 0.34 | 0.21 | 0.11 | 0.44 | 0.14 | 0.00 |
| Head Start | 0.09 | 0.18 | 0.64 | 0.13 | 0.18 | 0.48 | 0.25 | 0.20 | 0.24 | 0.17 | 0.15 | 0.24 | 0.29 | 0.23 | 0.21 | 0.43 | 0.17 | 0.02 |
| N | 673 | 675 | 675 | 672 | 672 | 685 | ||||||||||||
Note. Betas are reported as effect sizes. All models include cluster robust standard errors and control for child race/ethnicity, child gender, child age at the start of the preschool year, maternal education, maternal employment, whether the mother was married at child’s birth, mother’s age at child’s birth, dual language learner status, household size, and log of household income.
Acknowledgements
We are deeply grateful to the Tulsa Public School district, CAP-Tulsa Head Start, Tulsa Educare, charter school officials, and the many teachers, parents, and children who participated in this study.
Declaration of Conflicting Interests
The author(s) declared no potential conflicts of interest with respect to the research, authorship, and/or publication of this article.
Funding
The author(s) disclosed receipt of the following financial support for the research, authorship, and/or publication of this article: This study was supported by grants from the Heising-Simons Foundation (Grant #s 2016-107 and 2017-329), the Foundation for Child Development (Grant #GU-03-2017), the Spencer Foundation (Grant # 201800034), and the National Institutes of Health NICHD (Grant #1R01HD092324-01A1). Data collection was also supported by the George Kaiser Family Foundation and the University Strategic Organization Initiative at the University of Oklahoma. Thanks to Arya Ansari, Erica Greenberg, Meghan McCormick, Taryn Morrissey, Tyler Watts, Christina Weiland, and the many participants at the Fall 2022 APPAM and SREE conferences for valuable feedback on earlier versions of this work, and to Elizabeth Stuart for her guidance on propensity score matching. All errors are the responsibility of the authors.