
Abstract
Teachers in early childhood education (ECE) settings are central to providing children with high-quality experiences that promote both early development and long-term well-being; unfortunately, rates of teacher turnover are high in ECE settings. There are strong theoretical reasons to assume turnover is negatively linked with children’s academic and socioemotional development, but few empirical studies test this hypothesis. Using an econometric fixed effects approach in two waves of data from the nationally representative Head Start Family and Child Experiences Survey, this study provides the first national estimate of the relationship between within-year lead teacher turnover and children’s development in Head Start. I find an annual within-year turnover rate of ~9%, about twice that of K–12, and that turnover is negatively associated with children’s language outcomes alongside suggestive evidence for behavioral outcomes.
Keywords
Children’s early experiences can have a meaningful influence on their life trajectories (Shonkoff & Phillips, 2000), and for most children in the United States, these early experiences now include some form of regular, nonparental care (Magnuson & Waldfogel, 2016). These early learning environments have the potential to both improve children’s immediate academic and socioemotional skills and their longer-term educational, health, labor market, and well-being outcomes—particularly when designed to support the early development of children from families who have low incomes (M. J. Bailey et al., 2021; Carneiro & Ginja, 2014; Deming, 2009; Pages et al., 2023; Phillips et al., 2017).
Developmental and educational research suggests that the adults who care for children in these settings play a pivotal role in shaping developmental trajectories. Children thrive in warm, secure settings staffed by teachers who are able to respond to their needs. There is evidence for the importance of both children’s relationships with their teachers and the nature of teacher-child interactions in supporting children’s development in early care and education (ECE) settings (e.g., Hamre, 2014; Pianta, 2007; Weiland & Yoshikawa, 2013). Such evidence suggests that whether children experience the potential academic and socioemotional developmental benefits of ECE will be meaningfully linked to the stability of the adult in the room. Historically, however, the ECE workforce in the United States has been highly unstable; some estimates suggest that about 25% of ECE teachers leave their jobs each year, a turnover rate that is four times higher than that of elementary school teachers (Bassok et al., 2013; Whitebook et al., 2014); recent data suggests rates closer to one-third (Bassok, Markowitz, et al., 2021).
There has been a rising public interest and investment in developing a more well-trained, well-paid, and stable ECE workforce (Institute of Medicine, 2015), particularly in settings that serve young children who are minoritized or from families with low incomes for whom high-quality early learning experiences can be most impactful. This is particularly true in federally funded Head Start—a two-generation, antipoverty program designed to provide developmental support for children from families with incomes under the federal poverty line—where there has been a sharp increase in attention to educator qualifications and professional learning over the past 15 years (Bassok et al., 2013; Markowitz & Ansari, 2020). Such investments often presume a stable workforce, however, or ignore the challenges that within-year turnover may cause in the near term for young children. Data that can inform these policies—including on the prevalence of within-year turnover and linking turnover to development—remain sparse, however, including in Head Start.
Using two waves of nationally representative Head Start data, this study estimates the prevalence of within-year lead teacher turnover in Head Start, explores correlates of turnover, and finally uses an econometric fixed effect approach to examine the association between within-year lead teacher turnover—that is, when a lead teacher leaves Head Start during the program year—and children’s language, literacy, mathematics, and behavioral outcomes. In doing so, it provides the first estimate of both the amount of within-year lead teacher turnover in Head Start and the relationship between this turnover and children’s development. Given that Head Start is the flagship federal investment in ECE and that its goal is to provide a better start for young children whose families have low incomes, understanding how this investment is compromised by teacher turnover is essential. As the national conversation about ECE stability and turnover reduction continues in the wake of COVID-19, understanding the link between turnover and development is essential for driving urgency and better understanding the support necessary for children as policymakers address this problem.
The Importance of Stable Caregivers for Children’s Development
Developmental theory asserts that stable, supportive relationships between children and adults are fundamental to children’s development—and that disruptions to these relationships, including turnover, should have negative implications. Ecological systems theory (EST; Bronfenbrenner & Morris, 2007) contends that the interactions between children and caregivers are the core of child development and that distal factors affect children through their ability to alter or disrupt those interactions. According to EST, children who receive frequent, high-quality verbal and cognitive stimulation in the context of a warm, responsive relationship will develop both academically and socioemotionally (Hamre, 2014; Howes et al., 2008; Phillips et al., 2017) because these interactions facilitate children’s willingness to explore new situations, encourage thinking and problem-solving, and create opportunities to practice language, social skills, and behavioral regulation.
In ECE settings, the lead teachers who spend time with children every day provide warm relationships that support socioemotional development and design targeted activities that support young children’s language, literacy, and mathematics skills. Research corroborates the importance of these adults and what they provide young children, linking both teacher-child relationships (Lippard et al., 2019; McNally & Slutsky, 2018; Sabol & Pianta, 2012) and teacher-child interactions (Araujo et al., 2016; Pianta, Mashburn, et al., 2008) to children’s academic and socioemotional development in ECE settings and in Head Start specifically (Choi et al., 2019; Lee, 2019; Myers & Morris, 2009).
EST also demonstrates how turnover could broadly impact ECE quality. Staff churn is difficult for leaders and teachers who must navigate the changing center climate and may have to step in to fulfill duties that departing staff have left behind, adding stress and burden. Investments in professional learning are lost when teachers turn over. Moreover, leaders who must quickly replace teacher turnover may struggle to find individuals who are well-qualified to take on the role. Previous research has linked turnover to the quality of ECE settings (Hale-Jinks et al., 2006; Phillips et al., 2000), and quality, in turn, has been linked to children’s development (Araujo et al., 2016; Burchinal, 2018; Early et al., 2007).
Teacher Turnover in Early Childhood Settings
Teacher turnover has long been a concern in early childhood settings (Whitebook et al., 1998). Work in early childhood has historically required little formal training, and teachers and caregivers receive very low wages (Bassok et al., 2013; Whitebook et al., 2014), conditions commonly associated with turnover. Both anecdotal evidence and data from large surveys suggest that turnover is higher in the ECE sector than among teachers of older children. National estimates of turnover have hovered near 25% (Bassok et al., 2013; Whitebook et al., 2014), and recent data from Louisiana found year-to-year turnover rates as high as 37% (Bassok, Markowitz, et al., 2021).
Turnover in Head Start
Head Start is the largest federal investment in early childhood education and is designed specifically to support the learning and development of young children from families with very low incomes. Serving roughly 1,000,000 children a year at a cost of $11 billion in 2022, it is a flagship ECE investment designed to reduce opportunity gaps by providing not just ECE but also support for family well-being, often through the mediation of a teacher. As such, understanding turnover prevalence, its correlates, and its impact on young children is essential for understanding both the ways turnover undercuts this holistic investment and how to better support these children.
As a federal program, Head Start collects more data than other ECE settings, including on teacher turnover. For example, director-reported Head Start Program Information Report (PIR) data suggest that annual turnover in Head Start from 2002–2015 ranged from 12% to 18%—though these data do not provide information on turnover timing. Similarly, a recent report using data from the nationally representative Family and Child Experiences Survey found that average director-reported, program-level annual turnover was 21.2%, 14.4%, and 13.7% in 2006, 2009, and 2014, respectively (Aikens et al., 2016). Finally, a recent paper using administrative data from Louisiana found an annual Head Start lead teacher turnover rate of 34% (Bassok, Markowitz, et al., 2021).
Data on within-year turnover is sparser. Using the same data as Bassok et al., Bellows et al. (2022) found a within-year turnover rate of 9% in Louisiana Head Start. A study of 65 Head Start teachers in the Midwest found that 36% of newly hired teachers who began at the start of the program year had left by January (Wells, 2015). Notably, while this estimate accounts only for turnover occurring by January and may underestimate within-year turnover, the sample includes only new teachers, who turn over at a high rate (Bellows et al., 2022).
Turnover Correlates
Due to a “data deficit” in early childhood (Whitebook et al., 2018), we know little about turnover in early childhood beyond estimates of prevalence, including in Head Start. There is very little large, at-scale data collected in ECE and almost no data containing the kind of rich, repeated information that would facilitate an analysis of the correlates and consequences of teacher turnover. Most ECE turnover data, including that cited previously, provide a one-time snapshot of the workforce and are not linkable to teacher characteristics, child development outcomes, or center characteristics. Such data portray an unstable workforce and raise concerns for how instability may influence program quality and child development but cannot answer other core turnover-related questions.
Empirical Evidence Linking Turnover to Development
Although there are strong theoretical reasons to assume that teacher turnover has negative implications for children, there is surprisingly little evidence documenting this relationship in ECE (Choi et al., 2019; Whitebook & Sakai, 2003). Tran and Winsler (2011) offer some of the only evidence to date. Using a large sample of four-year-olds in Miami, they found evidence that children who experienced within-year teacher turnover had more negative cognitive, social-emotional, and linguistic outcomes. Many of these associations disappeared when children’s skills at the beginning of the program year were accounted for, however, and in more controlled models, associations were only observed in the behavioral and socio-emotional domains: teacher-reported initiative and teacher-reported closeness/attachment. This study also had high levels of missing data (22% of children were missing outcome data) and a relatively limited set of control variables, most notably the absence of any family process, teacher, or center covariates, which raises the possibility that the children and centers that experience turnover systematically differ from those that do not and that those differences, rather than turnover, drove negative associations. The present study will begin to address these methodological concerns.
Research in K–12 does find that turnover is negatively linked to outcomes among older children. Ronfeldt et al. (2013) used a quasi-experimental design to demonstrate that school by grade level turnover rates were associated with reduced learning among elementary school students (−.08 and −.05 of a standard deviation in math and reading, respectively), particularly in schools serving more low-performing students or more Black students. More recently, Redding and Henry showed that within-year turnover specifically is associated with a .075 standard deviation decrease in test score gains (Henry & Redding, 2020).
The K–12 literature argues that a key mechanism for this loss may be that teachers who leave are less qualified or less skilled than those who remain (Adnot et al., 2017; Hanushek et al., 2016); that is, for children who do not experience turnover, the whole year is spent with a highly skilled educator, whereas for children who do experience turnover, at least part of the year is spent with a teacher who has a lower level of pedagogical skills. Descriptive data from K–12 does show that early career teachers, teachers with lower classroom quality scores, and teachers in high-poverty schools are more likely to leave (Boyd et al., 2008; Goldhaber, 2015; Henry et al., 2011), but researchers assert that findings are likely not explained by this mechanism alone (Henry & Redding, 2020). Nonetheless, such patterns highlight the importance of methods that can account for the characteristics of teacher turnover and control, in part, for observed classroom quality.
Present Study
This study explores within-year teacher turnover in Head Start. Using nationally representative data, I (1) estimate the prevalence of within-year lead teacher turnover in Head Start, (2) descriptively explore the characteristics of teacher turnover compared to their remaining counterparts, and (3) estimate the association between turnover and children’s math, literacy, social, and behavioral outcomes in econometric fixed effects models that account for children’s skills at Head Start entry as well as a set of child, family, teacher, director, and center factors. Based on theory and previous research, I expect that turnover will be negatively associated with developmental gains across outcomes.
This study adds to the literature linking turnover to children’s outcomes in several ways. It is the first national study examining the relationship between ECE teacher turnover and children’s outcomes. Second, it focuses on within-year turnover, which is understudied but likely to disrupt children’s development. Finally, it begins to address methodological limitations from existing ECE turnover studies through the use of imputation for missing data; lagged variables; more extensive controls for child, family, teacher, center, and program variables; and ultimately fixed effects modeling.
Method
Data come from the Head Start Family and Child Experiences Surveys (FACES). FACES is a nationally representative study of Head Start conducted every 3 years from 1997 through 2009 and restarted in 2014. Head Start children, families, and teachers are nested within Head Start centers, which are nested in Head Start programs. Head Start programs receive a grant from the federal government to oversee the management of one or more centers in the same geographic area; centers are independent ECE-providing sites within a program’s purview. To account for this complexity, FACES used a multistage probability sampling design with stratification to ensure a nationally representative sample at the program, center, classroom, and child level (West et al., 2011).
Data include Head Start program, center, and teacher characteristics; child and family characteristics; and direct child assessments in both fall and spring. A unique strength of FACES relative to other national early childhood datasets (e.g., the Early Childhood Longitudinal Study-Birth Cohort) was that in some data waves, lead teachers are surveyed in both the fall and spring of the Head Start year, making it possible to assess whether the lead teacher present in the fall (data collected from late September through mid-November) led the same classroom in the spring (data collected from mid-April through mid-June).
Sample
I used FACES data from 2006 and 2009, the two most recent years of FACES that surveyed teachers and collected child data in both fall and spring. 1 Across these two waves, I focus on children’s first year in Head Start, whether age 3 or age 4, to maximize sample size. In these data, there were 5,697 children with fall and spring data, all of whom were linked to a teacher at both time points. 2 Of these, 5,012 (88.0%) had the same teacher and stayed in the same classroom the entire year; 23 (0.40%) had inconsistent data whereby their fall teacher did not turn over, but the child’s teacher switched classrooms; 163 (2.9%) switched classrooms (and thereby teachers) over the course of the program year; and 499 (8.8%) 3 had teachers who left Head Start over the course of the program year. Within the 499 were 36 (0.6%) children who experienced turnover but also switched classrooms. For these 36 children, I could not identify whether classroom switching or teacher turnover came first; that is, I could not say whether these 36 children left a classroom or if the teacher’s turnover led to the dissolution of the classroom and therefore classroom switching. Because the purpose of this analysis was to understand the association between turnover and children’s development, I retained in the main analytic sample the 5,012 who had the same teacher in the same classroom for the entire year and the 463 children who experienced teacher turnover but stayed in the same classroom (N = 5,475). Finally, not all of these 5,475 children had full cognitive and behavioral outcome data; children with missing outcome data were removed using listwise deletion from individual outcome regressions. Thus, sample sizes for the main analyses ranged from 4,467 to 4,958. Imputation of other potential missing data (e.g., covariates) is discussed in the analytic strategy section.
At the teacher level, there were a total of 928 unique teachers in the data. Of these, 778 teachers stayed in both the fall and spring waves of Head Start data, 75 of these were turned over (for whom I have fall data only), and 75 of these teachers replaced the leaving teachers (for whom I have spring data only). Thus, at each time point—that is, in the fall and in the spring—the teacher level sample size was 853, with 778 teachers observed at both time points. These teachers were nested in 252 centers and 76 programs, with an average number of 3.36 teachers per center, an average number of 3.38 centers per program, and an average number of 11.15 teachers per program.
Measures
Within-Year Teacher Turnover
Within-year teacher turnover was coded using the unique teacher identification (ID) numbers generated in the fall. These identifiers are at the teacher level; if a teacher is observed in the fall and in the spring, the same identifier would be seen in the data at both time points, allowing me to know if a teacher was present in both periods. From this information, I created a dummy variable in which a teacher was coded as having stayed if I observed them in both the fall and spring (turnover = 0) and as having turned over if their ID number was present in the fall but not the spring (turnover = 1).
Developmental Outcomes
FACES included child assessments across language, literacy, mathematics, behavioral regulation, and social domains. For both fall and spring assessments, I used the raw score to capture children’s individual, absolute performance rather than their performance relative to a norm. I standardized each score within the final sample so that coefficients could be interpreted as effect sizes. Direct assessments of language, literacy, and mathematics are only reported for children who had sufficient language skills to be tested in English; parent-reported and behavioral outcomes are indicated for all children.
Peabody Picture Vocabulary Test
The Peabody Picture Vocabulary Test (PPVT, Dunn & Dunn, 2007) is a widely used receptive language measure in which children point to a picture that corresponds with the word spoken aloud by the assessor. The PPVT has demonstrated strong reliability and validity (Dunn & Dunn, 2013); in FACES, Cronbach’s alpha >0.90.
Woodcock-Johnson Letter-Word Identification
The Woodcock-Johnson (WJ) Letter-Word Identification test (Woodcock et al., 2001) is a literacy assessment that measures children’s ability to identify isolated letters and words. The letter-word subtest has shown high internal reliability in several studies (McGrew & Woodcock, 2001; Schrank et al., 2005); in FACES, Cronbach’s alpha >.80. FACES used a stopping rule of 3 consecutive items incorrect; most children were tested with about 10 items.
Woodcock-Johnson Spelling
The WJ Spelling subtest measures fine motor coordination and prewriting skills (e.g., drawing lines, copying letters) as well as the ability to write specific upper- or lower-case letters, words, phrases, and punctuation marks. This test has shown high internal reliability in previous studies (alpha =.94, McGrew & Woodcock, 2001; Schrank et al., 2005); in FACES, Cronbach’s alpha ranged from .79 to .83.
Woodcock-Johnson Applied Problems
The WJ applied problems subtest (Woodcock et al., 2001) measures children’s ability to analyze and solve math problems. Children were stopped after they answered 3 consecutive items incorrectly; most children were tested on at least 29 items. This test has shown high internal reliability in previous studies (McGrew & Woodcock, 2001; Schrank et al., 2005); in FACES, Cronbach’s alpha >.80.
Parent-reported behavior
In the fall and spring, parents rated their child’s behavior on 21 items, such as “has a very strong temper and loses it easily” or “makes friends easily” on a one to three scale ranging from “not true” to “very true or often true.” These items were drawn from several scales: the Personal Maturity Scale (Entwisle & Alexander, 1987), the Social Skills Rating System (SSRS; Gresham & Elliott, 1990), and the Behavior Problems Index (BPI; Zill & Peterson, 1986). The reliability of the Personal Maturity Scale is adequate (Cronbach’s alpha ranges from .74 to .85), and the reliability of the SSRS and the BPI have been historically high (Cronbach’s alpha >.85). FACES categorized these items into two summary scores—problem behaviors and social skills/positive behaviors—by summing component items (exact items are copyrighted). Scales had sufficient internal reliability, ranging from .72–.79 for behavior problems and .68–.72 for positive social skills.
Covariates
FACES included a rich set of child, family, teacher, director, and center variables that were unavailable in previous analyses and can help reduce, though not eliminate, omitted variable bias in regression models. At the child and family level, I included four mutually exclusive indicator variables for child race/ethnicity (non-Hispanic Black, Hispanic, non-Hispanic White, other race/ethnicity); gender (male = 1); disability status (1 = has disability); child’s age in months; an indicator for English as a second language in the household (1 = speaks a language other than English); an indicator for whether the child was born with a low birth weight (1 = low birth weight); a measure of days absent during the Head Start year; a mutually exclusive set of dummy variables for family income (<$10,000, $10,001–$20,000, $20,001–$30,000, $30,001–$40,000, $40,001–$50,000, >$50,000); an indicator for public benefit receipt (1 = indicates receipt of benefits such as food stamps or Temporary Assistance for Needy Families); a 4-level indicator of maternal education (less than a high school degree, a high school degree, some college, Bachelor’s degree (BA) or more); a dichotomous indicator of maternal employment (1 = employed); a dichotomous indicator for a single-parent household (1 = single parent); an interval measure of mother’s age at child’s birth in years; a continuous measure of maternal depressive symptoms (Center for Epidemiological Studies Depression Scale, CES-D; Radloff, 1977); a dichotomous indicator for parent reading (1 = parent reads to the child at least three times weekly); a dichotomous indicator of immigrant status (1 = at least one family member is an immigrant); an indicator of child cohort (1 = 4 years old at Head Start entry); and an indicator for whether the child’s data came from the 2006 or 2009 wave of FACES (1 = 2009).
At the teacher/classroom level, I controlled for characteristics of children’s fall teachers and classrooms to account for teacher-level factors that might influence employment decision-making and classroom factors that may be related to job difficulty and teachers’ decisions to leave their site. These included four mutually exclusive dummy variables indicating teacher race/ethnicity (non-Hispanic Black, Hispanic, non-Hispanic White, other race/ethnicity); three mutually exclusive dummy variables indicating teacher education (less than an associate’s degree (AA), AA, or BA or more); years of teacher experience; class size; an indicator for length of day (1 = full day); an indicator number of classes taught daily (0 = one class daily, 1 = two classes daily); teacher salary (in $10,000); a 5-level measure of teachers’ perceptions of class behavior (0 = class behaves exceptionally well, 4 = class misbehaves frequently); and a measure of teacher depressive symptoms (CES-D). In my main specifications, I control for fall teacher characteristics to account for children’s experiences with the teachers who left the classroom (Hanushek et al., 2016), as well as spring teacher race, education, experience, salary, whether the teacher teaches a full day, and depressive symptoms (Hindman & Bustamante, 2019).
I also include a measure of classroom instructional quality (the Instructional Support scale of the Classroom Assessment Scoring System, CLASS; Pianta, La Paro, & Hamre, 2008). This measure of quality is derived from a one-time classroom observation conducted in winter. Because it is not linked to a teacher ID, I cannot identify whether the measure comes from staying, turning over, or replacing teachers; nonetheless, it provides some information about classroom interactions during the program year.
I also included a set of director and center covariates, including mutually exclusive dummy variables for director education (AA or less, BA, or more than a BA); mutually exclusive dummy variables indicating director race/ethnicity (non-Hispanic Black, Hispanic, non-Hispanic White, other race/ethnicity); director experience in years; and National Association for the Education of Young Children participation (1 = NAEYC member). To better account for unobserved center characteristics that likely both influence turnover and how remaining teachers experience turnover at their center (e.g., Ronfeldt et al., 2013), I also include the number of teachers at a center; director-reported center-level turnover (0 = no turnover, 1= one teacher left, 2= two teachers left, 3= three+ teachers left); director-reported measures of whether or not the center provides teachers with mentors (1 = mentor provided); and the number of opportunities for training or technical assistance provided to teachers.
Analytic Strategy
This analysis had three goals: (1) estimate the prevalence of within-year lead teacher turnover in Head Start, (2) descriptively explore the characteristics of turning-over teachers compared to their remaining counterparts, and (3) estimate the association between turnover and children’s math, language, literacy, social, and behavioral outcomes. To address the first goal, I estimated the mean of the within-year teacher turnover variable. To address the second, I estimated uncontrolled relationships between within-year teacher turnover and teacher, classroom, director, and center characteristics by running a set of linear probability models predicting turnover from each teacher, classroom, director, and center characteristic, as well as an indicator for data wave (e.g., 2006 or 2009). For mutually exclusive categorical variables, I rotated omitted groups to understand the pattern of prediction across categories. I ran all models across and within centers.
Finally, to explore the relationship between within-year teacher turnover and children’s development, I estimated three models. First, I regressed each individual child outcome for child i in center j nested within program k on within-year teacher turnover and child, family, teacher, director, and center covariates and indicators for data wave (2006 or 2009) and cohort (3 or 4 years old at Head Start entry), as well as a measure of children’s skills from the fall of the Head Start year. The inclusion of this last variable accounts, in part, for children’s innate skills and their experiences prior to Head Start entry, making it a key adjustment for omitted variable bias (National Institute of Child Health and Human Development [NICHD] Early Child Care Research Network [ECCRN] & Duncan, 2003).

In equation 1, the coefficient
Though the inclusion of the lagged measure begins to address unobserved differences in children’s experiences prior to Head Start entry, it cannot account for unobserved, omitted features of Head Start centers and programs that may covary with turnover and thus bias the estimate. To address such potential omitted variables, I estimated two additional models. In equation 2, I add center fixed effects to account for unobserved, fixed center traits by making comparisons within centers.

In equation 2,
Accounting for center characteristics is important because centers serve different populations of children and have varied center climates; turnover is likely due, at least in part, to these center-level factors. These center factors may be related to program factors, however, based on grant specifications around teacher compensation, professional support, and program-level leadership. For this reason, I ran a second fixed effects model, including both center and program fixed effects, shown in equation 3.

Here,
Econometric fixed effects models were the preferred specification because of their ability to account for all unobserved, time-invariant center- and program-level factors, which help support causal inference (McNeish & Kelley, 2019). This approach is mathematically similar to a multilevel model with random intercepts and random slopes. Indeed, recent work from Hamaker and Muthén (2020) demonstrates that econometric fixed effects models are equivalent to a mixed effects model that includes both uncentered and level-2 centered predictors in two-level mixed effects models. While I use the econometric approach as my preferred specification, estimates derived from a mixed model are presented in Appendix A and are nearly identical.
All child-level analyses were weighted using FACES-provided sampling weight P21RA2WT, which is designed to generate nationally representative longitudinal child-level estimates; teacher-level means and bivariate relationships were estimated using T1TCHWT and T2CLSWT, the cross-sectional teacher weights for fall and spring, respectively.
Finally, not all children and teachers had full covariate information. Missingness ranged from 0.07% (child gender) to 13.6% (director salary). Analyses suggested no patterns of missingness, though recent analyses suggest that even when data are not missing at random, imputation improves estimation (Woods et al., 2021). Following this scholarship as well as Von Hippel (2007) and Johnson and Young (2011), missing data were multiply imputed (m = 100) using chained equations (MICE) with all independent and dependent variables, covariates, and several auxiliary variables related to teacher certification, age, and satisfaction. Models were run in each of the 100 imputed datasets and combined using Rubin’s rules, which adjust estimated parameters across datasets for between and within imputation variation (Barnard & Rubin, 1999; Royston, 2004).
Results
I first estimated within-year turnover and found that 9% of lead teachers left (and 9% of children experienced turnover) between the fall and spring of the program year. Table 1 presents descriptive statistics for children who did not and did experience lead teacher turnover, as well as the relationship between turnover and child and family characteristics, estimated between and within centers. These tests were conducted using OLS and center fixed effects models predicting turnover from each child and family outcome, as well as a control for data wave (2006 or 2009) and cohort (whether the child started Head Start at age 3 or 4). These tests provide some information about selection into turnover at the child level.
Child Level Bivariate Associations Between Teacher Turnover and Child and Family Characteristics

Note. Data are drawn from the 2006 and 2009 waves of the Head Start Family and Child Experiences Survey (FACES). Means are calculated across 100 multiply imputed datasets and weighted using FACES-provided sampling weights, imputed N = 5475. Standard deviations are in parentheses for continuous and interval measures. The column labeled “Diff” tests for uncontrolled differences in child and family characteristics by teacher turnover status. The columns under Diff are the result of individual regression models predicting each child characteristic from the turnover indicator variable, controlling for data wave and child cohort. The between-center column (“Btwn Center”) used an OLS approach (e.g., compared all children who did and did not experience turnover); the within-center column (“Within Center”) also included center fixed effects such that comparisons were made within each center.
p < 0.01.
Overall, the sample was 22% White, 34% Black, 36% Hispanic, and 8% other race/ethnicity; 27% of the sample spoke a language other than English at home. Consistent with Head Start’s mission, family incomes in the sample were low. About 55% of the sample had an income under $20,000, and about 60% received some kind of public benefit. Mothers also had low levels of education on average, and nearly 70% of children lived in a single-parent household (overall means not shown). There were no consistent differences in child and family characteristics across turnover groups. In uncontrolled models, there was no evidence that children who experienced turnover performed differently on assessments prior to (fall) or after (spring) turnover than their peers who did not (Table 1).
Bivariate Associations: Turnover and Teacher, Director, and Center Characteristics
Teachers were surveyed in both the fall and spring of the Head Start year, allowing for comparisons of teacher, director, and center characteristics between (1) teachers who stayed and teachers who turned over using fall data and (2) teachers who stayed and the teachers who replaced turning-over teachers using spring data (Table 2). This analysis allows me to explore both the correlates of turnover (fall analysis) and whether replacement teachers looked like their colleagues who had been in classrooms all year (spring analysis). Appendix B presents these comparisons at the child level.
Teacher-Level Comparisons of Teacher and Center Characteristics for Staying Teachers, Turning-Over Teachers, and Replacement Teachers

Note. Data are drawn from the 2006 and 2009 waves of the Head Start Family and Child Experiences Survey (FACES). Means are calculated at the teacher level across 100 multiply imputed datasets and weighted using FACES-provided sampling weights, imputed total N = 853. The column labeled Diff presents the results of tests to understand if there were differences between staying teachers and those who turned over and staying teachers and those who replaced the turned-over teachers. These results were derived from individual regression models predicting each teacher characteristic from the turnover indicator variable, controlling for data wave. The between-center column (“B”) used an OLS approach (e.g., compared all teachers); the within-center column (“W”) also included center fixed effects such that comparisons were made within each center. Analyses were weighted using T1TCHWT and T2CLSWT to compare staying teachers to leavers (fall analyses) and staying teachers to replacement teachers (spring analyses), respectively. **p < .01, *p < .05.
CLASS Instructional Support scores are identical across fall and spring groupings because CLASS was assessed once at the classroom, not teacher level. These scores thus reflect the quality of classroom instructional interactions as assessed in classrooms that did and did not experience teacher turnover.
Overall, Head Start teachers were diverse: 39% of teachers who stayed were White, 33% were Black, and 21% were Hispanic. Though there were large differences in point estimates such that Black teachers were less likely to turn over and Hispanic teachers were more likely to turn over than their White counterparts, these differences were not statistically significant.
About half of the teachers had a BA. Teachers who had less than an AA were slightly more likely to turn over than those with more education across all specifications (p < .05). While turning over, teachers had similar levels of experience as staying teachers; replacement teachers had less experience than those who stayed (p < .01). Average class size was ~17 children and equal across teachers. CLASS Instructional Support scores were similar in classrooms that did and did not experience turnover. Both turning over and replacing teachers were about twice as likely to have a schedule that required them to teach twice daily (as compared to teaching once daily) than staying teachers, a difference that was statistically significant in the fall (p < .01), suggesting a relationship between job difficulty and turnover.
Consistent with the literature on teacher turnover (Totenhagen et al., 2016), turning-over teachers made less than staying teachers within centers (p < .05) and persisted in models that accounted for teacher experience (not shown). This difference was about $1,500 a year.
Finally, although turning-over teachers did not view their classes as having a higher level of misbehavior than staying teachers, replacing teachers did (p < .05).
About 75% of Head Start teachers had a director who had a BA or more, and director education was not related to turnover. Directors were 42% White, 36% Black, and 17% Hispanic (not shown). No director or center-level variables were consistently linked to turnover.
Associations Between Turnover and Child Outcomes
Table 3 presents associations between within-year turnover and children’s outcomes across the three models described previously. The presented coefficient represents the difference in developmental gains between children who stayed in the same classroom with the same teacher all year and children whose teacher left Head Start.
Associations Between Teacher Turnover and Children’s Developmental Outcomes

Note. Data are drawn from the 2006 and 2009 waves of the Head Start Family and Child Experiences Survey (FACES). Estimates are calculated across 100 multiply imputed datasets and weighted using FACES-provided sampling weight P21RA2WT, total imputed N = 5475; model N varies based on valid responses to each dependent variable. Clustered standard errors are in parentheses. OLS models (equation 1) include the full set of child, family, teacher, director, and center covariates, including a lagged measure of each dependent variable, taken from the prior fall. Fixed effects models (equations 2 and 3) necessarily omit director and center covariates because estimates are derived from within centers. Full model estimates from equation 3, including all covariates, are presented in Appendix C.
I found a consistent, negative association between within-year teacher turnover and PPVT. In OLS models, the estimated effect size was equal to about one-tenth of standard deviation (b= −.10, p < .05); this effect size was similar across fixed effects models (b = −.13, p < .05 in both).
For WJ Letter-Word, I find a statistically significant, similarly sized negative association in OLS models only (b= − .12, p < .05). I find no conventionally statistically significant associations with WJ Spelling or WJ Applied Problems, though turnover was negatively associated with WJ Applied Problems in both the center fixed effects and center and program fixed effects models at the .10 level.
There were no statistically significant associations with parent-reported outcomes (behavior problems, positive behaviors), though turnover was disadvantageously associated with behavior problems in both fixed effects models at the .10 level.
Appendix C presents full model estimates across models and all child outcomes, including all covariates. While few teacher characteristics emerged as statistically significant across multiple child outcome models, the teacher’s perceptions of class misbehavior in the fall were negatively associated with WJ Letter-Word and Applied Problems scores, and CLASS Instructional Support was positively related to PPVT and Letter-Word outcomes (Table C1). No center-level characteristics are presented, as all time-invariant center-level differences are accounted for by the fixed effects.
Discussion
In both 2006 and 2009, about 9% of lead teachers in Head Start left during the program year. Head Start serves nearly a million children annually; this amounts to about 90,000 children who did not have a stable caregiver at their Head Start center. This rate is about twice as large as recent estimates of within-year teacher turnover in K–12 settings in North Carolina (Redding & Henry, 2018) and similar to recent within-year Head Start turnover estimates using 2016–17 Louisiana data (Bellows et al., 2022). Importantly, in a more recent wave of FACES data (2014), within-year turnover was higher (17%), 4 and Head Start staffing shortages have been substantial in the wake of COVID-19 (Office of Head Start, 2022). Data collection that allows for the observation of within-year turnover in present-day data is important for building our ongoing understanding of this construct.
In these data, within-year teacher turnover was negatively associated with children’s language development. Teacher turnover was consistently, negatively associated with the PPVT across all models, with an effect size about 1.5 times that of estimates in K–12 data (Henry & Redding, 2020). This finding is concerning given recent data suggesting that children’s “unconstrained skills” such as language are more likely to predict a long-term developmental boost from early learning than constrained skills, such as letter identification or counting (McCormick et al., 2021). The particular link with language may be because these skills are built in relational contexts—through conversation and shared storytelling, for example—such that a disrupted teacher-child relationship may be more salient in this domain.
There was not a consistent association between turnover and children’s literacy or math scores. While I observed a statistically significant association between turnover and the Woodcock Johnson Letter-Word test in OLS models, this association diminished once center and program-level factors were accounted for. For mathematics, no association reached conventional levels of statistical significance, though in the fixed effects models, associations were significant at the 0.10 level and of a similar magnitude to the PPVT estimates. This is notable because Head Start classrooms spend much more time on language and literacy skills than on mathematics skills (Markowitz & Ansari, 2020; Walter & Lippard, 2017) and warrants further study.
I did not find consistent evidence for associations between turnover and children’s parent-reported behavior problems, though fixed effects models provided suggestive evidence (p < 0.10) that should be probed in further study. This is particularly true because parents’ reports of children’s social and behavioral skills at home may not capture children’s behaviors in ECE settings. Unfortunately, given the perfect correlation between teacher turnover and having a different rater in the fall and spring—resulting in a lagged dependent variable with different meaning across turnover groups, biasing turnover estimates—I did not include models of the link between turnover and teachers’ perceptions of children’s behavior in the main specifications. I do, however, present exploratory regressions in which teachers’ lagged evaluations of children’s social and behavioral outcomes are replaced with parents’ (Appendix D). These models show a consistent, negative relationship between turnover and children’s behavioral outcomes.
Teachers’ perceptions of children’s behavior are important for their engagement with and cognitive stimulation of children and for the development of teacher-child relationships. If turnover leads to the arrival of replacement teachers who perceive children as having high levels of problem behaviors, even if turnover itself did not cause behavioral difficulties, this perception may impede relationship formation and children’s ongoing development. Moreover, rates of preschool expulsion are high (Gilliam, 2005), consequential for later development, and based, in part, on teachers’ perceptions above and beyond children’s behaviors (Gilliam et al., 2016; Martin et al., 2018). Future research should explore the link between turnover and children’s classroom behaviors as measured both by teachers and external raters.
It is also important to learn how turnover influences children’s development. Although it is not possible to identify mechanisms linking turnover to outcomes in these data, associations are likely due to children’s experiences with the turning-over teacher; the disruption of turnover; and children’s experiences with the replacing teacher, including the challenges a replacing teacher may face in quickly establishing a warm, positive climate and managing a classroom of children who have experienced teacher departure. The present data did not allow me to explore variability in classroom quality across turning over, replacing, and staying teachers, but it is an important next step. Understanding mechanisms linking turnover to outcomes is essential for creating support for classrooms that experience turnover in the future.
Limitations
There are several factors that should be kept in mind when interpreting these findings. First, though models used in this study included a large set of child, family, and teacher covariates and accounted for children’s skills at Head Start entry and time-invariant center and program characteristics (in fixed effects models), it is likely that omitted variables still exist. Teachers ultimately chose to turn over for reasons I could not observe, which are likely to matter for how they engaged with children in the classroom. For example, planned, temporary departures (such as family, medical, or maternity leave) may have very different implications for both centers and children than job turnover, but this could not be accounted for in this analysis.
Second, this method, while designed to support inference in observational data, limited the power of the analysis. For example, the fixed effects models leverage within-center and program variation; thus, in these data, just 25% of centers could contribute to the turnover estimate. Additionally, controlling for both fall and spring teacher characteristics, while conceptually important, also undercut power because for ~90% of the sample (children who did not experience turnover), fall and spring teacher covariates were identical, inflating standard errors. Future research should consider collecting data from more classrooms within centers to help address this issue.
Third, this analysis was conducted in Head Start only, not the breadth of formal, center-based ECE settings. Head Start is a holistic, two-generation, antipoverty program that also focuses on family well-being. These program features may influence the likelihood of teacher turnover and children’s development and may mean that turnover has additional impacts through family well-being mechanisms. Such factors should be explored. Additionally, recent policy shifts have required Head Start teachers to be more educated, which may result in higher-quality replacement teachers than other sectors or teachers who are more able to cope with the challenges of entering a classroom mid-year than in other ECE settings.
Relatedly, though these data were the most recent available that could be used for this analysis, and currently the only large-scale data in which this analysis could be conducted, they are from 2006 and 2009. There have been many changes to ECE broadly since then and in Head Start specifically. Global changes to the Head Start workforce and the arrival of COVID-19 likely have impacted average teacher preparation, teacher practice, and center strategies for mitigating instability, potentially impacting mechanisms by which turnover affects children. Future research should explore the link between turnover and outcomes not only in other ECE sectors—particularly the child care sector, which serves many children from minoritized groups—but also in modern data.
Fourth, this paper was not able to account for assistant teachers who play a vital role in ECE classrooms. In classrooms where an assistant teacher is able to step in as lead, the impact of turnover may be dampened. More broadly, to my knowledge, no previous studies have looked at the potential impact of assistant teacher turnover on classrooms or children. Attention to the essential role of assistant teachers in providing for young children is a key area for future research.
Fifth, the language, literacy, and mathematics findings are not generalizable to children whose English language skills precluded testing in English. Given Head Start’s mission, a large proportion of children attending these settings speak a language other than English at home. Understanding the impact of turnover for these children is critical for understanding the impact of within-year turnover in Head Start.
Finally, although a strength of this study is that it estimated the association between within-year turnover and children’s development, it is also likely the case that between-year turnover influences children such that this study understates the impact of workforce churn on children’s development (Sorensen & Ladd, 2020). For example, in Ronfeldt et al.’s (2013) K–12 turnover study, some of the estimated turnover effect was due to the disruptive nature of turnover on the teachers that remained; this is likely to be the case in ECE as well.
Implications and Conclusions
Head Start serves about one million children annually and remains the federal government’s largest investment in the early educational experiences of young children from families with low incomes. These findings suggest that many Head Start children experience within-year teacher turnover and that this turnover is associated with their development. Estimated effect sizes in this paper were about .10 of a standard deviation—about 40% of the average effect size for high-quality ECE interventions (D. Bailey et al., 2017) or 7–10% of a year’s worth of learning in kindergarten and first grade (Lipsey et al., 2012). Insofar as early learning contributions to later outcomes, turnover may have long-term ramifications as well, though this could not be tested in the present study.
These findings suggest that policymakers hoping to leverage Head Start to reduce opportunity gaps should focus on reducing turnover. Typical professionalization solutions, such as increasing educational requirements and providing professional learning have already been put in place in Head Start—and may account for the relatively low turnover estimates in this study—suggesting that other levers may need to be explored. Indeed, strategies such as the provision of professional learning opportunities are likely to be wasted without first addressing turnover, suggesting that a multilevel approach thinking about turnover in conjunction with efforts to improve quality broadly speaking could be fruitful.
One important consideration is teacher compensation. As noted previously, teacher salary was linked to turnover in these data—turning-over teachers made, on average, $1500 less annually than their peers (Table 2)—and is a commonly reported reason for teacher turnover (Totenhagen et al., 2016). Indeed, recent experimental evidence from Virginia highlights the potential of increasing compensation for dramatically reducing teacher turnover (Bassok, Doromal, et al., 2021). Early educators earn low wages, which has led in part to a staffing crisis in the wake of COVID-19 and calls for increased compensation (Adams et al., 2021). The present study, alongside extant evidence linking compensation to well-being and well-being to classroom practices, suggests that support for the compensation and well-being of early educators may pay additional dividends for child development (Buettner et al., 2016; Bullough et al., 2012; Grant et al., 2019; Jeon et al., 2014, 2019).
Another possible avenue is support for leadership. Recent research has found that teachers’ perceptions of their leaders are linked to teacher retention in ECE settings (Doromal & Markowitz, 2023). ECE leaders can support teachers by providing a clear vision for classroom quality, making optimal staffing decisions to support teacher autonomy and well-being and assisting teachers with challenging classroom experiences. Directors able to build a healthy center climate and create supportive contexts for teachers may be better able to both retain teachers and support teachers’ work in classrooms.
Additionally, given that some turnover will always exist, it is important to consider how programs can support remaining teachers and facilitate a successful transition for replacing teachers. Strategies such as transitioning qualified assistant teachers may be beneficial. Providing an extra or more experienced assistant teacher to mid-year replacements may also be promising for supporting quality practice. Providing new teachers with specific supports for the transition, such as curriculum or behavior management coaching, may also be effective, as may holding additional opportunities for children and parents to get to know the replacement teacher (e.g., parent-teacher night, home visiting). Research unpacking these mechanisms will be important in designing successful policy.
In sum, understanding how to prevent and mitigate the impacts of within-year teacher turnover will be essential for ensuring that Head Start, designed to serve the children in the United States who are most likely to need support, is able to do so efficiently and effectively.
Footnotes
Appendix A
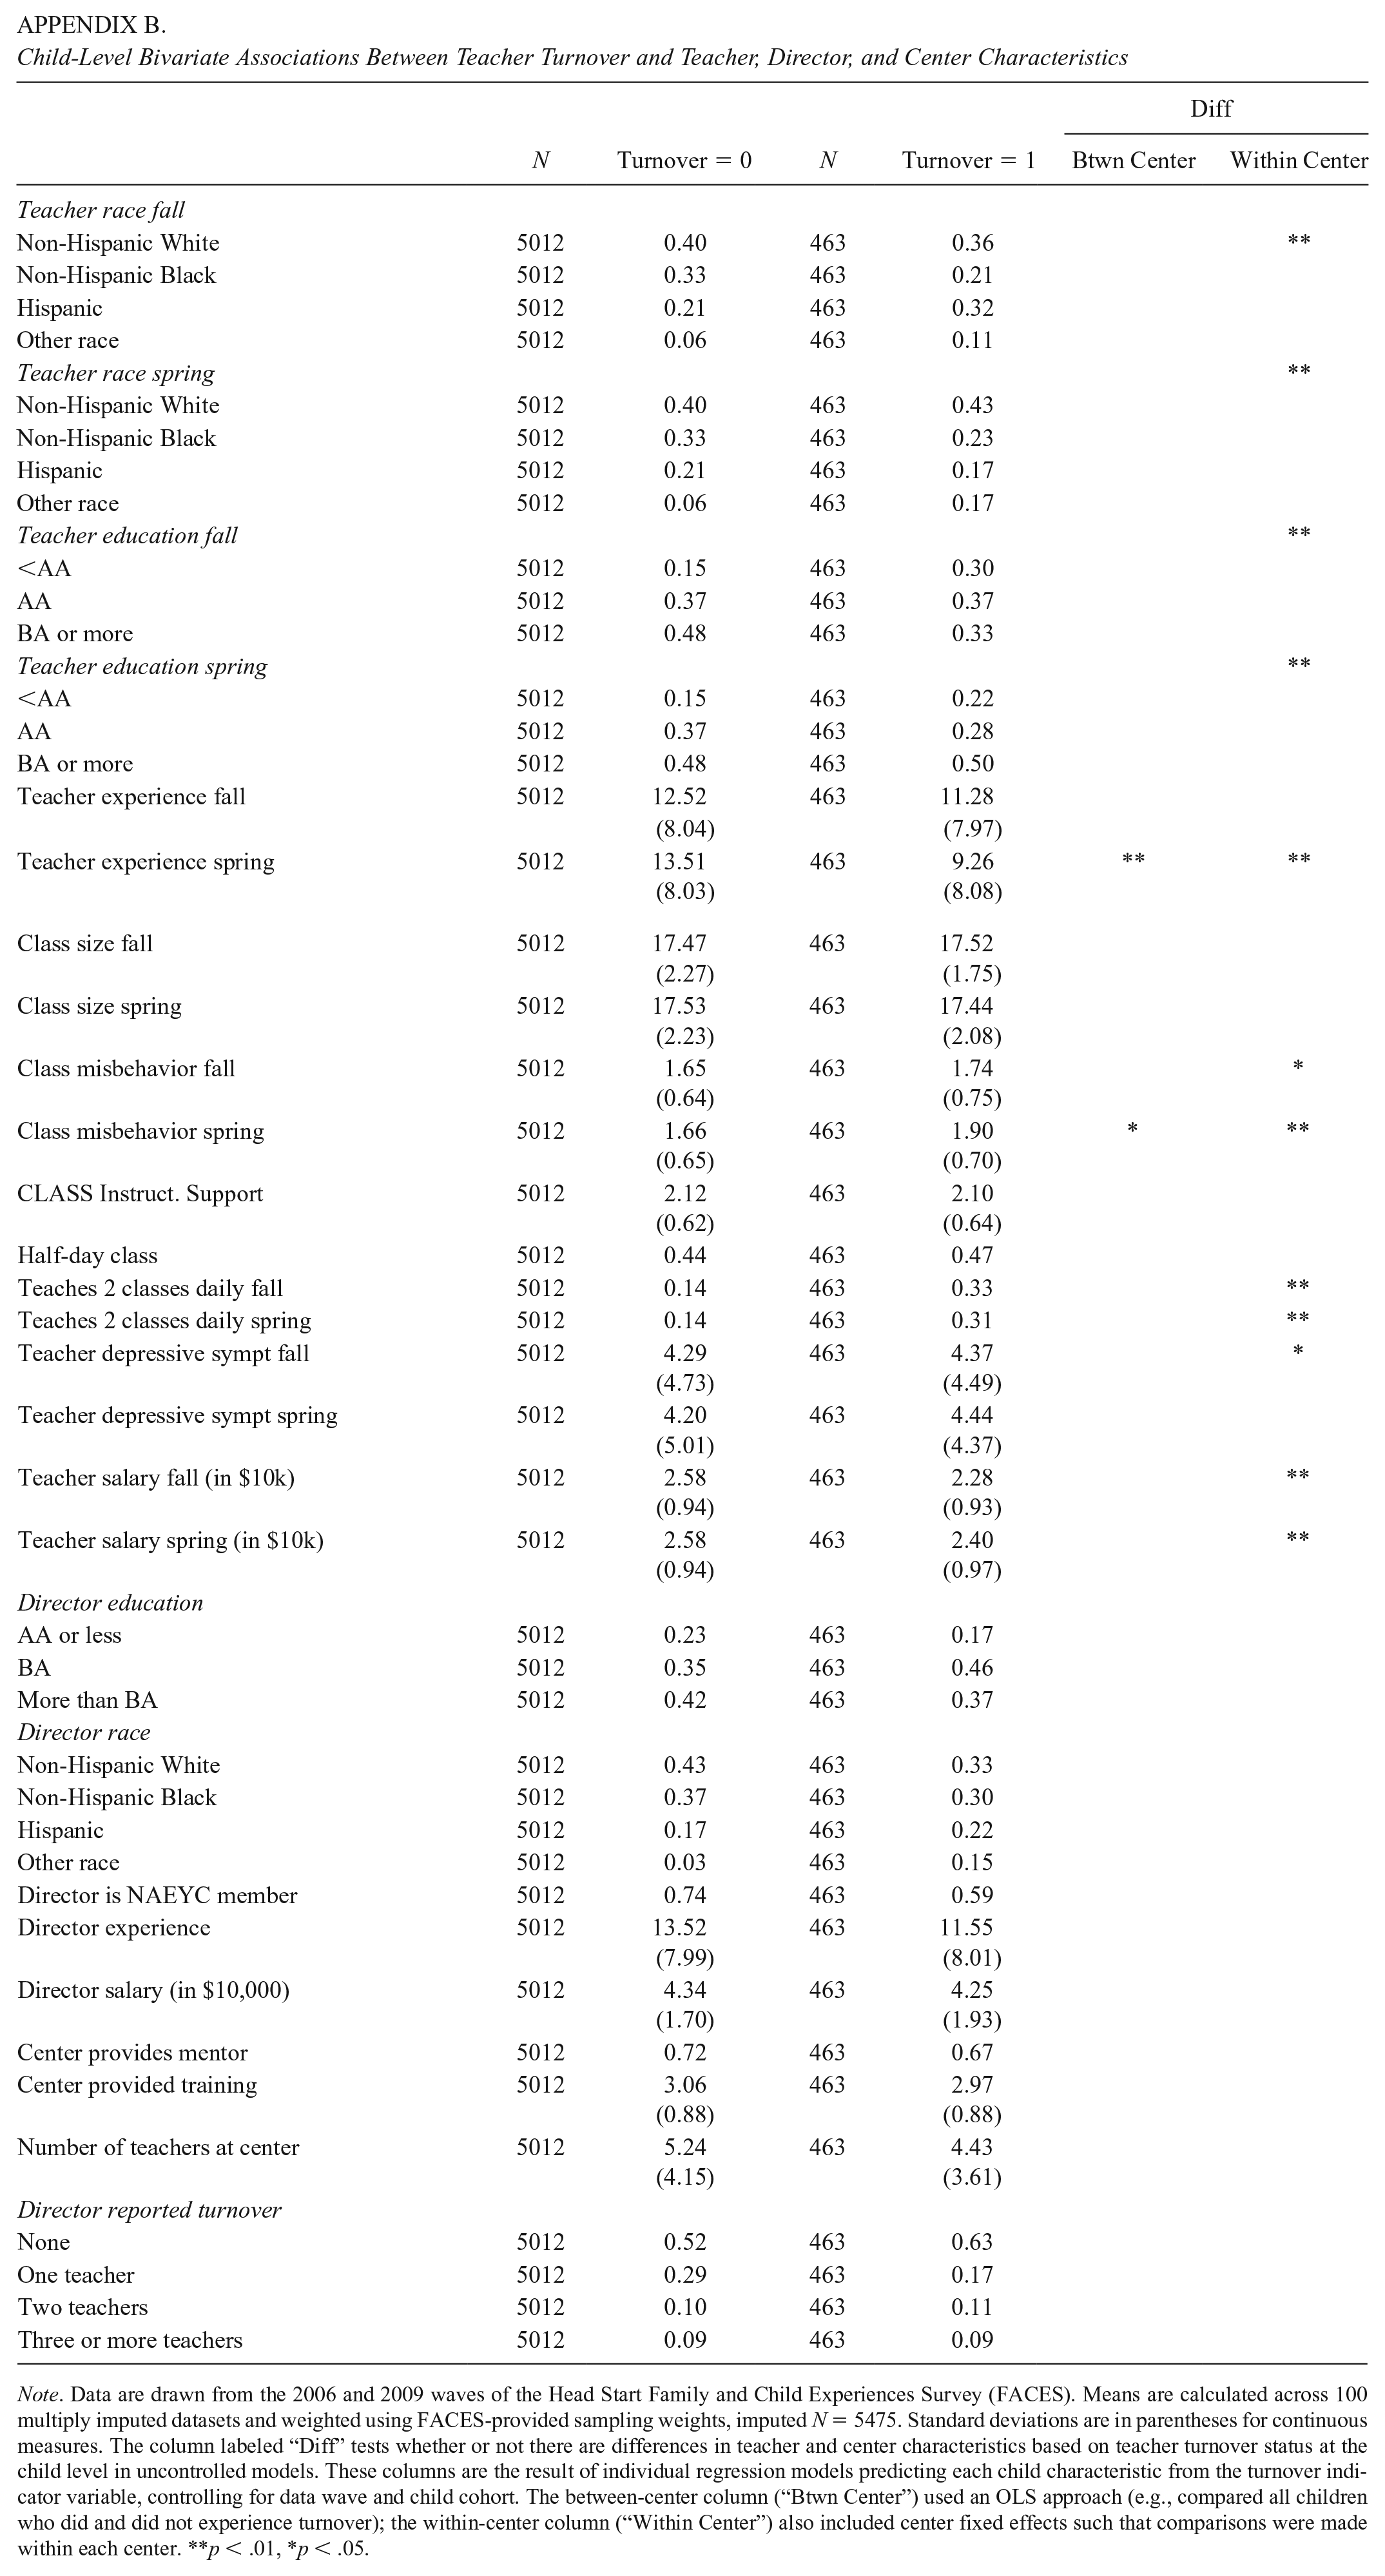
Child-Level Bivariate Associations Between Teacher Turnover and Teacher, Director, and Center Characteristics
| Diff | ||||||
|---|---|---|---|---|---|---|
| N | Turnover = 0 | N | Turnover = 1 | Btwn |
Within Center | |
| Teacher race fall | ||||||
| Non-Hispanic White | 5012 | 0.40 | 463 | 0.36 | ** | |
| Non-Hispanic Black | 5012 | 0.33 | 463 | 0.21 | ||
| Hispanic | 5012 | 0.21 | 463 | 0.32 | ||
| Other race | 5012 | 0.06 | 463 | 0.11 | ||
| Teacher race spring | ** | |||||
| Non-Hispanic White | 5012 | 0.40 | 463 | 0.43 | ||
| Non-Hispanic Black | 5012 | 0.33 | 463 | 0.23 | ||
| Hispanic | 5012 | 0.21 | 463 | 0.17 | ||
| Other race | 5012 | 0.06 | 463 | 0.17 | ||
| Teacher education fall | ** | |||||
| <AA | 5012 | 0.15 | 463 | 0.30 | ||
| AA | 5012 | 0.37 | 463 | 0.37 | ||
| BA or more | 5012 | 0.48 | 463 | 0.33 | ||
| Teacher education spring | ** | |||||
| <AA | 5012 | 0.15 | 463 | 0.22 | ||
| AA | 5012 | 0.37 | 463 | 0.28 | ||
| BA or more | 5012 | 0.48 | 463 | 0.50 | ||
| Teacher experience fall | 5012 | 12.52 | 463 | 11.28 | ||
| (8.04) | (7.97) | |||||
| Teacher experience spring | 5012 | 13.51 |
463 | 9.26 |
** | ** |
| Class size fall | 5012 | 17.47 |
463 | 17.52 |
||
| Class size spring | 5012 | 17.53 |
463 | 17.44 |
||
| Class misbehavior fall | 5012 | 1.65 |
463 | 1.74 |
* | |
| Class misbehavior spring | 5012 | 1.66 |
463 | 1.90 |
* | ** |
| CLASS Instruct. Support | 5012 | 2.12 |
463 | 2.10 |
||
| Half-day class | 5012 | 0.44 | 463 | 0.47 | ||
| Teaches 2 classes daily fall | 5012 | 0.14 | 463 | 0.33 | ** | |
| Teaches 2 classes daily spring | 5012 | 0.14 | 463 | 0.31 | ** | |
| Teacher depressive sympt fall | 5012 | 4.29 |
463 | 4.37 |
* | |
| Teacher depressive sympt spring | 5012 | 4.20 |
463 | 4.44 |
||
| Teacher salary fall (in $10k) | 5012 | 2.58 |
463 | 2.28 |
** | |
| Teacher salary spring (in $10k) | 5012 | 2.58 |
463 | 2.40 |
** | |
| Director education | ||||||
| AA or less | 5012 | 0.23 | 463 | 0.17 | ||
| BA | 5012 | 0.35 | 463 | 0.46 | ||
| More than BA | 5012 | 0.42 | 463 | 0.37 | ||
| Director race | ||||||
| Non-Hispanic White | 5012 | 0.43 | 463 | 0.33 | ||
| Non-Hispanic Black | 5012 | 0.37 | 463 | 0.30 | ||
| Hispanic | 5012 | 0.17 | 463 | 0.22 | ||
| Other race | 5012 | 0.03 | 463 | 0.15 | ||
| Director is NAEYC member | 5012 | 0.74 | 463 | 0.59 | ||
| Director experience | 5012 | 13.52 |
463 | 11.55 |
||
| Director salary (in $10,000) | 5012 | 4.34 |
463 | 4.25 |
||
| Center provides mentor | 5012 | 0.72 | 463 | 0.67 | ||
| Center provided training | 5012 | 3.06 |
463 | 2.97 |
||
| Number of teachers at center | 5012 | 5.24 |
463 | 4.43 |
||
| Director reported turnover | ||||||
| None | 5012 | 0.52 | 463 | 0.63 | ||
| One teacher | 5012 | 0.29 | 463 | 0.17 | ||
| Two teachers | 5012 | 0.10 | 463 | 0.11 | ||
| Three or more teachers | 5012 | 0.09 | 463 | 0.09 | ||
Note. Data are drawn from the 2006 and 2009 waves of the Head Start Family and Child Experiences Survey (FACES). Means are calculated across 100 multiply imputed datasets and weighted using FACES-provided sampling weights, imputed N = 5475. Standard deviations are in parentheses for continuous measures. The column labeled “Diff” tests whether or not there are differences in teacher and center characteristics based on teacher turnover status at the child level in uncontrolled models. These columns are the result of individual regression models predicting each child characteristic from the turnover indicator variable, controlling for data wave and child cohort. The between-center column (“Btwn Center”) used an OLS approach (e.g., compared all children who did and did not experience turnover); the within-center column (“Within Center”) also included center fixed effects such that comparisons were made within each center. **p < .01, *p < .05.
Appendix C
Associations Between Teacher Turnover and Children’s Teacher-Reported Behavioral Outcomes

| OLS, Lag |
Center FE, Lag |
Center & Program FE, Lag |
|||||
|---|---|---|---|---|---|---|---|
| N | β | p | β | p | β | p | |
| Teacher reported | |||||||
| Behavior problems | 5269 | 0.23 (0.10) |
0.02 | 0.23 (0.08) |
0.01 | 0.23 (0.08) |
0.00 |
| Withdrawn behavior | 5268 | 0.19 (0.08) |
0.03 | 0.15 (0.11) |
0.21 | 0.15 (0.10) |
0.16 |
| Social skills | 5265 | –0.28 (0.11) |
0.01 | –0.24 (0.08) |
0.00 | –0.24 (0.09) |
0.01 |
Note. Data are drawn from the 2006 and 2009 waves of the Head Start Family and Child Experiences Survey (FACES). Estimates are calculated across 100 multiply imputed datasets and weighted using FACES-provided sampling weight P21RA2WT, total imputed N = 5475; model N varies based on valid responses to each dependent variable. Clustered standard errors are in parentheses. OLS models (equation 1) include the full set of child, family, teacher, director, and center covariates, including a lagged measure of each dependent variable, taken from the prior fall. Fixed effects models (equations 2 and 3) necessarily omit director and center covariates because estimates are derived from within centers.
Funding
The author disclosed receipt of the following financial support for the research, authorship, and/or publication of this article: This research was supported by a grant from the American Educational Research Association which receives funds for its AERA Grants Program from the National Science Foundation under NSF award NSF-DRL #1749275. Opinions reflect those of the author and do not necessarily reflect those of AERA or NSF.
Notes
Author
ANNA J MARKOWITZ is an assistant professor of education in the School of Education and Information Studies at UCLA; Moore Hall, 405 Hilgard Avenue, Los Angeles CA;