
Abstract
Using newly available data from Tulsa, Oklahoma—home of a renowned and much-studied universal public preschool program—we investigated associations between public preschool attendance and a wide range of third grade school administrative outcomes collected in the post-COVID-19 era. We explored associations between preschool attendance and school outcomes in our full sample of students (all of whom were from low-income households) as well as in our sizable subsample of dual language learners. Public preschool was unrelated to state standardized test scores, grade retention, and special education status. However, for dual language learners only, public preschool attendance predicted substantial reductions in third grade (post-COVID-19) absenteeism. Given skyrocketing rates of absenteeism when schools reopened after COVID-19—rates that are especially large for students from low-income and minoritized backgrounds such as those in our sample—these results hold special importance and may suggest a potentially overlooked response to a rising problem.
Keywords
Introduction
There is widespread consensus that public preschool programs support children’s language, literacy, and math skills at the end of preschool or the start of kindergarten but ongoing debate about the extent to which preschool benefits sustain or fade throughout the elementary school years (Phillips, Lipsey, et al., 2017). Many preschool evaluation studies stop after kindergarten, precluding the possibility of detecting longer-term effects. Studies that have followed students beyond kindergarten have yielded mixed findings regarding persistence versus fade-out of preschool effects (Phillips, Lipsey, et al., 2017). Most of these studies have focused on state standardized math and reading test scores and, to a lesser extent, on grade retention and special education placement (Andrews et al., 2012; Ansari et al., 2017; Barnett et al., 2013, 2018; Courtney et al., 2023; Durkin et al., 2022; Early et al., 2019; Gormley et al., 2018; Gray-Lobe et al., 2021; Hill et al., 2015; Lipsey et al., 2018; Peisner-Feinberg & Schaaf, 2010; Phillips et al., 2016; Watts et al., 2023; Weiland et al., 2020, 2021). Less attention has been paid to another highly consequential school outcome—absenteeism. This is a substantial shortcoming because chronic absenteeism in elementary school predicts poorer academic and social outcomes (Chang & Romero, 2008; Gottfried, 2014; Romero & Lee, 2007; Wei, 2024) and higher absenteeism in subsequent grades (Connolly & Olson, 2012; Ehrlich et al., 2018). Moreover, chronic absenteeism is at an all-time high after the COVID-19 pandemic (Dee, 2024), and efforts to mitigate academic and social-emotional declines since COVID-19 by increasing students’ exposure to academic instruction depend on regular attendance (U.S. Department of Education, 2023). This study provides timely information about whether and for whom public preschool might protect against absenteeism—as well as other traditionally measured administrative outcomes (e.g., state test scores, special education placement, and retention)—following the unprecedented educational disruption of the pandemic. It does so in a large, urban public school district where—as in many districts across the country (Institute of Education Sciences, n.d.; National Center for Education Statistics, 2022)—schools closed for in-person instruction in March 2020 and remained at least partially closed until the fall of 2021.
Our study also addressed another gap in the existing knowledge base on longer-term associations between preschool and school-related outcomes by focusing on a sizable subsample of dual language learners (DLLs). Although DLLs constitute a rapidly growing and substantial proportion of students in U.S. public schools (Romo et al., 2018), little is understood about the long-term consequences of preschool attendance for this population despite evidence suggesting that they benefit more from it than their monolingual peers in the short term (Bloom & Weiland, 2015; Yazejian et al., 2015, but see Ansari & Winsler, 2016). It could very well be that sustained preschool benefits beyond kindergarten, including those captured by administrative data, are stronger for DLL students. However, to date, no preschool evaluation studies have tested this hypothesis. To our knowledge, our study is the first to address this gap, examining associations separately for DLLs and non-DLLs between preschool attendance and third grade test scores, retention, special education status, and absenteeism. Again, this may be especially important in the wake of COVID-19, which has highlighted challenges borne disproportionately by minoritized subgroups (Gee et al., 2023; Golden et al., 2023), including DLLs (Goldberg, 2021; Pier et al., 2021). If preschool experience boosts any or all of these consequential school administrative outcomes in the aftermath of COVID-19, it may be considered an untapped protective resource that school districts should investigate in advance of future widespread educational disruptions.
Associations Between Public Preschool Attendance and School Administrative Outcomes
State Standardized Test Scores
More than a dozen studies have evaluated the impact of public preschool attendance on students’ standardized test scores in third grade or later with relatively mixed findings. Most of these studies have found that third and/or fourth graders who attended public preschool programs across a wide range of cities and states had significantly higher math and/or reading scores than their nonattending peers (Ansari et al., 2017; Barnett & Jung, 2021; Barnett et al., 2013; Berne et al., 2024; Courtney et al., 2023; Early et al., 2019; Peisner-Feinberg & Schaaf, 2010; Weiland et al., 2021). In an earlier cohort of students (2005) who attended pre-K in Tulsa, Oklahoma, the location of the current evaluation, pre-K attendance was associated with higher standardized test scores in math (but not reading) in third and eighth grades (Gormley et al., 2018; Hill et al., 2015; Phillips et al., 2016). These studies, however, used correlational (i.e., ordinary-least-squares regression with covariate adjustment) or quasi-experimental (i.e., propensity score matching or inverse probability of treatment weighting) regression-based methods to estimate associations between preschool attendance and outcomes. These methods adjusted for but did not eliminate differential selection of families into preschool, leaving open the possibility that estimates of associations linking preschool attendance to later outcomes were biased.
A smaller number of studies have used more rigorous methods to estimate pre-K impacts and have produced mixed findings. One study exploited natural exogenous variation in the timing of pre-K program expansion in Texas to provide intention-to-treat estimates of pre-K impacts on standardized test scores in reading and math in third grade and found positive impacts and no evidence of selection to undermine ordinary-least-squares regression estimates of the same (Andrews et al., 2012). A set of studies using lottery data on students in Boston (Gray-Lobe et al., 2021; Weiland et al., 2020) and New Haven (Humphries et al., 2024) found no differences in third grade state standardized test scores between attenders and nonattenders. Only one study—of Tennessee’s income-targeted public preschool program—found negative effects of preschool attendance: An analysis of lottery data revealed that attenders performed worse than nonattenders on third and sixth grade state standardized tests (Durkin et al., 2022; Lipsey et al., 2018). With such a mixed pattern of results, this study adds much-needed evidence to this ongoing debate about persistence versus fadeout—or even reversal—of associations between preschool and state test scores later in elementary school.
Grade Retention and Special Education Status
Several studies also have examined associations between preschool attendance and elementary school grade retention and special education status. Both of these can be considered proxies for children’s school progress because they are consequential for later school completion and academic achievement (Giano et al., 2022; Gormley et al., 2018; Hwang & Cappella, 2018; Morgan et al., 2010; Phillips, Johnson, et al., 2017). Again, studies have yielded mixed results. Two nonexperimental studies of New Jersey pre-K found that public preschool attenders had significantly lower rates than nonattenders of both grade retention and special education placement in third grade or later (Barnett & Jung, 2021; Barnett et al., 2013). Previous nonexperimental work in Tulsa has reported significantly lower rates of grade retention but not special education placement in middle school (Gormley et al., 2018; Phillips et al., 2016).
More rigorous studies have produced inconsistent evidence. For instance, in Texas, results from intention-to-treat analyses leveraging natural variation in pre-K availability due to the timing of program expansions suggested positive impacts (reductions) on retention and special education placement in third grade (Andrews et al., 2012). In Boston, analyses of lottery data found no significant differences in grade retention or special education placement for public preschool attenders versus nonattenders in third grade (Gray-Lobe et al., 2021; Weiland et al., 2020). In North Carolina, there was no association between public pre-K funding exposure and retention or special education placement in fifth grade (Watts et al., 2023). In Tennessee, there were no differences in elementary or middle school retention for public pre-K attenders versus nonattenders (Durkin et al., 2022; Lipsey et al., 2018). The only negative impact emerged in the Tennessee study, however, where preschool attenders were significantly more likely than nonattenders to receive an individualized educational program (IEP) in third and sixth grades (Durkin et al., 2022; Lipsey et al., 2018). Again, there is a clear need for additional information on public preschool and later grade retention and special education. By examining these outcomes in yet another context, this study contributes to the evidence base and policy-relevant discussion on whether preschool exposure is linked with these important school-related outcomes.
Absenteeism
Relative to test scores, grade retention, and special needs status, school attendance and absenteeism have received scant attention as outcomes in the preschool evaluation literature. Yet, poor attendance and chronic absenteeism (defined as missing 10% or more days of the school year; see Chang & Romero, 2008; Ehrlich et al., 2014) are powerful predictors of suboptimal academic and social outcomes (Ansari & Gottfried, 2021; Ansari & Pianta, 2019; Connolly & Olson, 2012; Ehrlich et al., 2018; Gottfried, 2014). Only a few studies have examined the impacts of public preschool programs on absenteeism in third grade or later. Earlier nonexperimental work in Tulsa has yielded mixed findings. Phillips et al. (2016) found that attending Head Start in Tulsa was significantly associated with middle schoolers’ reduced likelihood of being chronically absent. In contrast, Gormley et al. (2018) found that attending Tulsa’s universal school-based public pre-K program was not significantly associated with middle school chronic absenteeism. To our knowledge, the Tennessee pre-K evaluation is the only other study in which third grade attendance has been examined as a public preschool outcome. This evaluation was a randomized, controlled lottery design that included a measure of overall absenteeism (total days missed) but not chronic absence status. Lipsey et al. (2018) found that Black children who attended public preschool had lower third grade absenteeism than Black children who did not; no significant results emerged for the entire sample. A follow-up study found that the entire sample of Tennessee preschool attenders had significantly higher rates of absenteeism in sixth grade than their nonattending peers (Durkin et al., 2022).
Our study builds on this work using two distinct measures of absenteeism: number of days absent and chronically absent status (Chang & Romero, 2008; Ehrlich et al., 2014). This distinction is important because chronic absenteeism confers a special disadvantage. Students who are chronically absent in elementary school demonstrate lower academic skills and worse social-emotional outcomes in high school than students who are only absent for a few days of the year (Ansari & Pianta, 2019). Similarly, students who have always-high or rising rates of absenteeism tend to perform worse on standardized math and reading tests than students who have always-low or declining rates of absenteeism (Wei, 2024).
Importantly, unlike prior work, our study captures attendance rates after the resumption of in-school instruction following closures precipitated by the COVID-19 pandemic. This is an especially important timeframe given record post-COVID-19 absences across the United States (Dee, 2024), evidence of the harmful impacts of school closures on learning, and growing awareness of the detrimental impacts of chronic absences over time (Ansari et al., 2020). In doing so, this study contributes essential data to the national conversation on the prediction and prevention of chronic absenteeism in a post-COVID-19 academic environment.
Moderation by DLL Status
One reason that preschool attendance might promote later school-related outcomes is that it forges an earlier connection between home and school. These connections theoretically could take the form of parent–teacher communication, regular household routines around commuting to and from school, or the family and child simply building an identity of the child as a student from an early age. These earlier home–school connections could be especially salient for DLLs because DLL households are more likely to encounter known obstacles to home–school connections such as language barriers and nonstandard work schedules (Adams et al., 2021; Ayón, 2015; Turney & Kao, 2009). Indeed, some evidence suggests that the short-term benefits of public preschool attendance—at least for academic outcomes—may be greater for DLLs than non-DLLs. In the national Head Start Impact Study, for example, the boost to academic outcomes associated with Head Start attendance was greater for DLLs than for non-DLLs (Bloom & Weiland, 2015). An evaluation of Educare, a high-quality birth to 5 years early intervention program that is aligned with Head Start standards, found that enrollment at age 2 years instead of 3 years benefited all children’s language/literacy scores, but with larger effects among DLLs than among non-DLLs (Yazejian et al., 2015).
However, the few studies that have compared the size of preschool effects on school administrative outcomes in elementary school by DLL status have produced mixed results. Researchers in Tennessee (Lipsey et al., 2018) found no differential effects of pre-K attendance by student native English language status on third grade test scores, retention, special education placement, or attendance. In Texas, pre-K attendance was associated with a greater reduction in grade retention by third grade for students with limited English proficiency than for other students (Andrews et al., 2012). In prior work in Tulsa, researchers found that positive associations between pre-K attendance and math test scores in eighth grade were driven primarily by DLLs, but no such pattern emerged for grade retention (Gormley et al., 2018). Additionally, Early et al. (2019) found stronger associations between pre-K attendance and third grade standardized math test scores for children who did not speak English at home than for those who did, but the associations with reading were the same.
These mixed findings highlight a need for more research examining differential associations between preschool attendance and consequential school administrative outcomes for DLLs in particular. Indeed, when differential preschool associations are found, they favor DLLs, but the paucity of research in this area precludes robust conclusions that could inform public preschool expansion efforts aimed at increasing preschool enrollment among DLLs. The most neglected administrative outcome in this body of literature appears to be absenteeism. This is problematic because, in general, DLLs who are classified as English learners (ELs) score lower than non-ELs on measures of school success (National Academies, 2017), and attendance (the inverse of absenteeism) is a well-established contributor to those measures (Chang & Romero, 2008; Romero & Lee, 2007; Wei, 2024). If preschool exposure promotes later school attendance and reduces absenteeism for DLLs, that increased school attendance could help to support DLLs in learning English, being reclassified out of EL status, and generally being more successful in school. This goal has assumed particular importance in the wake of COVID-19. The pandemic and associated school closures have actually widened achievement gaps between ELs and non-ELs (Goldberg, 2021; Pier et al., 2021). Researchers, policymakers, and parents are actively searching for strategies to help narrow this gap, and the promotion of preschool attendance among DLLs may be one such strategy.
Post-COVID-19 Context in Tulsa Public Schools
On March 16, 2020, the Tulsa Public Schools (TPS) district—the largest school district in Oklahoma—closed all schools (as did most urban public school districts around the United States) and moved to remote instruction. Tulsa public schools remained fully remote through the spring of 2021 and did not offer a formal hybrid instruction model; thus, children experienced the 2020–21 academic year remotely. Remote instruction included both asynchronous (e.g., online modules and paper packets distributed via Canvas and recorded lessons) and synchronous (e.g., live read-alouds) components. Schools reopened for full-time in-person instruction in the fall of 2021. All children in this study were in first grade when schools closed in 2020, spent the entirety of the second grade year (2020–21) in remote instruction, and returned to in-person learning in the fall of third grade (fall 2021).
Data from the Oklahoma State Department of Education (OKSDE) suggest that this period of school closure had a negative impact on student learning in Tulsa, which is consistent with national data. For instance, in the United States, the National Assessment of Educational Progress, a standardized test known as the “Nation’s Report Card,” recorded significant declines in fourth and eighth grade students’ math and reading skills in 2022 compared with 2019 (National Assessment of Educational Progress [NAEP], 2022a, 2022b). Likewise, in Tulsa, academic proficiency, according to state standardized test performance, declined from 18% in 2018–19 to 13% in 2021–22 (Oklahoma State Department of Education [OKSDE], 2022a). In Tulsa, other outcomes also worsened during this period; for example, regular attendance declined from 73% before the pandemic to 48% after (OKSDE, 2022b).
Together these data suggest that the third grade outcomes measured in this study during the 2021–22 school year will show less optimal performance than they would have in the absence of the pandemic and school closures. Specifically, it is possible that declines in test scores and attendance suppressed any long-term associations between preschool attendance and administrative outcomes that otherwise might have emerged in this sample. Yet, to the extent that such associations between preschool attendance and later outcomes can be detected, the protections they confer may be of greater value than ever.
This Study
This study draws on an ongoing evaluation of public preschool for children from low-income families in Tulsa, Oklahoma. It poses two research questions. First, we ask whether there are associations between public preschool attendance and school administrative outcomes—state test math and reading scores, special education placement, grade retention, and absenteeism—in third grade. Then we explore whether associations between preschool attendance and those outcomes are stronger for DLLs versus non-DLLs. The Tulsa School Experiences and Early Development (SEED) Study is especially well suited to address these questions. It has previously demonstrated associations between public preschool attendance and children’s scores on directly assessed (not state administered) language/literacy and math assessments in first (Johnson et al., 2023) and third (Johnson et al., 2024) grades. It also includes a large number of students who are DLLs, consistent with the population of low-income families in the region and in public schools nationwide.
Method
Setting and Sample
We drew data from the Tulsa SEED Study and administrative records from the OKSDE. The Tulsa SEED Study has followed a cohort of children from low-income families in Tulsa since preschool, comparing those who attended publicly funded preschool programs in the year before kindergarten with those who stayed home with a parent or relative. In Tulsa, the vast majority (~80%) of 4-year-olds from families with low incomes take advantage of no-cost public preschool. Of these, most attend pre-K programs administered by the TPS district (TPS pre-K), a universal school-based program open to all children regardless of income. A smaller number attends Head Start provided by the Community Action Program of Tulsa (CAP-Tulsa) or Tulsa Educare (a birth to 5-years early intervention program aligned with Head Start standards); eligibility for Head Start and Tulsa Educare is limited to families with incomes at or below 100% of the federal poverty line. TPS pre-K, Head Start CAP-Tulsa, and Tulsa Educare programs are of relatively high quality (see Choi et al., 2016; Phillips et al., 2009; Yazejian et al., 2015). For instance, these programs require lead teachers to have a BA and specialized training in early education, and they pay preschool teachers on the same pay scale as K–12 teachers in the TPS district. Given the similarities between the programs and their impacts on child outcomes to date (Johnson et al., 2023, 2024), this analysis condenses attenders of TPS pre-K, Head Start CAP-Tulsa, and Tulsa Educare into a single preschool attender group.
Recruitment for the Tulsa SEED Study occurred when children were 3 years of age (academic year 2016–17), 4 years of age (2017–17), and in kindergarten (2018–19) and concentrated on families in the TPS district with low incomes, defined as family income below 185% of the federal poverty level or receiving public benefits. Slightly different recruitment strategies were employed across waves to capture a variety of preschool experiences (for details, see Johnson et al., 2023, 2024). In short, at ages 3 and 4 years, we recruited families from public preschool settings in Tulsa (TPS pre-K, CAP-Tulsa, Head Start, and Educare); these students constituted our group of preschool attenders. To generate a comparison group of preschool nonattenders, we recruited students during the kindergarten year at the same schools attended by the preschool attenders. To be eligible, these students had to receive parental or relative care during the year prior to kindergarten and, as with preschool attenders, had to come from families with low incomes. The University of Oklahoma-Tulsa Institutional Review Board approved all study protocols.
Of the 1,156 children in our sample who either attended public preschool in Tulsa (preschool attenders) or spent the preschool year in parental/relative care (preschool nonattenders), all but 91 (1,065, or 92% of the sample) were still enrolled in public school in the state of Oklahoma for third grade (2021–22), per OKSDE administrative records. The 91 students who did not appear in OKSDE administrative records left the state or the public school system. Compared with those who did not appear in OKSDE administrative records, those still enrolled in public school in Oklahoma for third grade were more likely to be DLLs or Hispanic/Latinx (the two groups overlap substantially), less likely to be Black, and, on average, younger and from larger households. Their mothers were less likely to have high school degrees. They also were slightly more likely to be preschool attenders. There were no differences in maternal age, marital status, maternal employment status, or household income at the time of the child’s birth.
The final analytic sample for this study thus included 1,065 children. Of these, 986 (93%) were preschool attenders and 79 (7%) were preschool nonattenders. We note that the group of preschool nonattenders is small because public preschool is universal in Tulsa, and ~80% of 4-year-olds from families with low incomes attend TPS pre-K, Head Start CAP-Tulsa, or Tulsa Educare in the year before kindergarten (Kathy Siebold, personal communication, May 18, 2017).
Children in the analytic sample were racially and ethnically diverse (Table 1): 45% were Hispanic/Latinx, 22% were Black, 7% were Native American, 16% were White, 9% were multiracial, and 1% belonged to another racial/ethnic group. Roughly half the children were female (49%). A little less than half (42%) were DLLs, defined as living in a household where a language besides English was spoken; 97% of the DLLs in our sample spoke Spanish. Roughly one third of mothers had more than a high school education, and approximately two thirds were employed full or part time. Mothers were, on average, 26 years old at the time of the child’s birth, and about half (47%) were married at that point. Households had four to five members, on average, with monthly incomes averaging $1,922 ($23,064 annually).
Sample descriptive statistics

Measures
Preschool Attender Status
Parents’ reports, combined with school and program administrative records, were used to construct groups of public preschool attenders and nonattenders. Children were considered to have attended public preschool if they attended a TPS public school–based or TPS-affiliated charter school–based pre-K program (n = 788), a Head Start CAP-Tulsa program (n = 177), or a Tulsa Educare program (n = 21) for more than 50% of the offered days that school year (notably, only three children were dropped for not attending 50% of the days offered or more). Children were considered public preschool nonattenders if they were in parental or relative care that year.
Administrative Outcomes
The OKSDE provided Oklahoma State Testing Program (OSTP) scores, grade retention, IEP status, and attendance data for the third grade year (see Table 2 for descriptives by preschool attender status). For most participants, this was the 2021–22 academic year, but for those who were retained, data came from the 2022–23 academic year.
Descriptive statistics for outcomes by treatment group
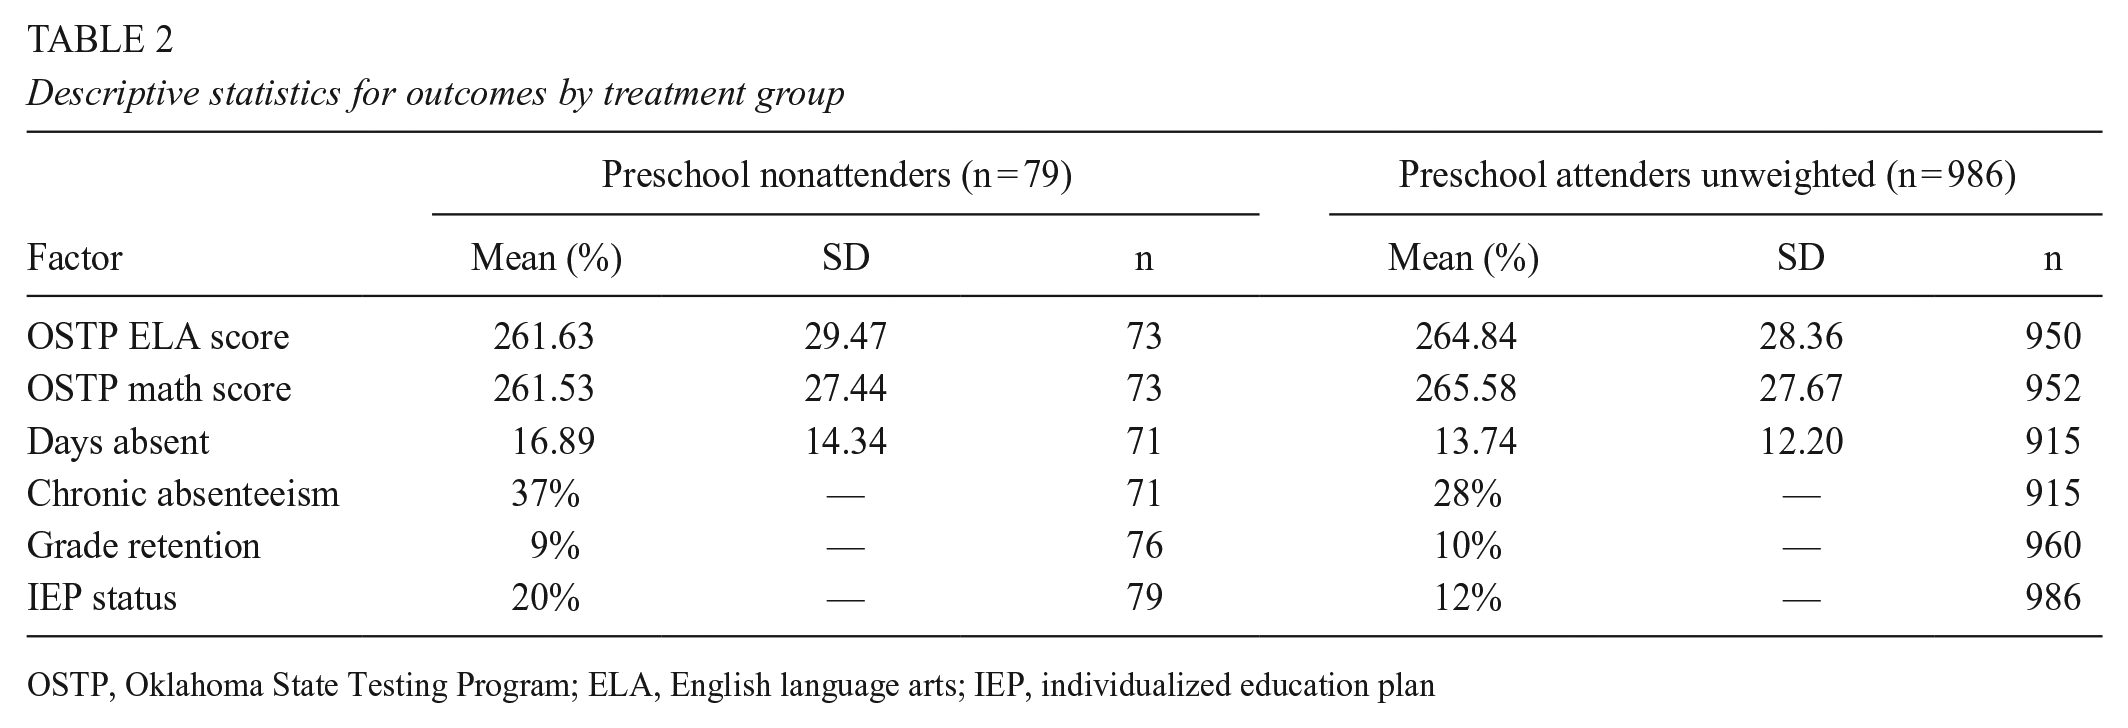
OSTP, Oklahoma State Testing Program; ELA, English language arts; IEP, individualized education plan
English Language Arts and Math Test Scores
As in public school districts around the country, school districts in Oklahoma administer standardized tests of English language arts (ELA) and math skills for the first time in the spring of third grade. In Oklahoma, these tests are referred to as OSTP tests. OSTP ELA and math test scores are scaled horizontally such that scores are equated from year to year, and they range from 200 to 399.
Grade Retention
A grade promotion history for each student and an indicator of retention were used to create a variable indicating whether the student had been retained as of third grade.
IEP Status
OKSDE provided an indicator of whether a student had an active IEP on file as of October 1 (2021 for on-time students or 2022 for grade-retained students). We cross-referenced this indicator with our measure of participants’ IEP status based on district administrative data and parent report. In the 22 cases in which the state did not indicate an IEP but our study data did and in the 11 cases in which the state indicated an IEP and our data did not, we updated the state data with our own.
Absenteeism
OKSDE tests provided data on number of days absent in the 2021–22 school year. We did not draw on attendance data for retained students from the following academic year, when they were in third grade, because the number of possible days was not comparable across years. Therefore, models of absenteeism were estimated only with on-time students. Absences were counted in half-day increments and summed to create a total for each student. If a student changed from one Oklahoma public school to another midyear, their number of days absent counts were combined across schools. Although the OKSDE provided some data on the reasons for absence and whether they were excused or unexcused, they were not systematic enough to examine by type. Therefore, excused, unexcused, and “other” absences were combined into a single count.
Using counts from the OKSDE, we defined chronic absenteeism following the standard definition (Chang & Romero, 2008; Ehrlich et al., 2014) of missing >10% of the school days offered in a given year (regardless of whether the absences were excused or unexcused). For the 2021–22 school year, this equated to 18 days in a 180-day school year.
DLL Status
Children were classified as DLLs if they were from a household where a language other than English was spoken; in our sample, most DLLs (97%) were Spanish speaking.
Covariates
To control for observable differences between preschool attenders and nonattenders, we included covariates that were drawn from TPS administrative data and parent survey responses. Child-level covariates included gender, race/ethnicity (i.e., Hispanic/Latinx, Black, White, and other; due to small cell sizes, the “other” category combines those who identified as American Indian or Alaskan Native, Asian, Native Hawaiian or Pacific Islander, multiracial, or other), and child age at the start of preschool. Parent/household-level covariates consisted of parental education and employment, the mother’s age and marital status at the child’s birth, household size, and monthly income.
Analytic Approach
Regression Models with Propensity Score Weights
To answer our first research question, which asked whether there were associations between public preschool attendance and school administrative outcomes in third grade, we estimated six separate regression models. All regression models included propensity score weights (see next section). Because OSTP test scores are continuous, we used ordinary-least-squares linear regression models to estimate their associations with preschool attendance. Because grade retention, IEP status, and chronic absenteeism are binary, we used logistic models to estimate their associations with preschool attendance. The number of days absent is a count, so a Poisson regression model was used to estimate its associations with preschool attendance. Of interest in all models was whether the indicator of public preschool attendance was significant, net of all covariates.
To address our second research question, which explored whether associations between preschool attendance and third grade outcomes differed between children who were DLLs versus non-DLLs, regression models for each outcome were re-estimated separately for those two subgroups (alternative models with an interaction term yielded similar results). Postestimation Wald tests were used to compare coefficients across subgroups. To correct for multiple comparisons and reduce the risk of Type I error, we implemented a Benjamini–Hochberg correction (Benjamini & Hochberg, 1995). Correcting for a false discovery rate of .20, only coefficients with p values of .033 or less were interpreted as statistically significant.
Propensity Score Weighting
Because selection into preschool attendance is nonrandom, we attempted to reduce bias in our estimates of preschool associations with administrative outcomes using a propensity score weighting approach. This approach is used increasingly in long-term preschool evaluation studies (e.g., Amadon et al., 2022; Ansari et al., 2020; Weiland et al., 2021) and is consistent with our earlier work examining associations between preschool attendance and child outcomes at first and third grades (Johnson et al., 2023, 2024).
Following the recommendations of Stuart (2010), a more comprehensive set of pretreatment covariates than those included in the regression models predicting outcomes were used in the models to calculate weights (see Appendix Table A1 for a complete list). These covariates were used as predictors of the probability that a given student attended preschool, and each case’s probability, in turn, was used to compute an inverse probability of treatment weight. All regression models were run with those weights and were used to estimate the average effect of the treatment on the control group (ATC), which approximates the treatment effect (in this case, preschool attendance) on the comparison group had they received the treatment (instead of averaging the effects of preschool over the entire sample). Estimating the ATC using propensity scores assigns the control subjects a weight of 1 and calculates weights of treatment participants equal to the predicted odds of treatment as outlined by Hirano et al. (2003). This up-weights treatment group subjects with covariates most similar to those of the comparison group and down-weights treatment group subjects with covariates most dissimilar to those of the comparison group. We repeated this process for each of the 40 imputed datasets, creating 40 sets of weights. We used the within approach (Granger et al., 2019), running 40 separate regression models, each with its own set of propensity weights, estimating 40 regression effects that were then combined using Rubin’s rules.
To construct the propensity weights, we relied on boosted logistic regression modeling techniques using a machine learning approach in the twang package in R (McCaffrey et al., 2004). We specified iterations, shrinkage, and interactions (n.trees = 5,000; shrinkage = .01; interaction.depth = 5) to minimize the absolute standardized difference (ASD), or the difference in means between the treatment and control groups, for each covariate divided by the pooled SD of the control group (for an ATC approach). We estimated scores once optimizing for the average absolute standardized effect size and once optimizing for the Kolmogorov–Smirnov statistic. Although the two stopping criteria performed similarly, the scores resulting from the Kolmogorov–Smirnov statistic stopping criterion performed slightly better and therefore were chosen for the final regression models.
Under this approach, ASDs of .25 were considered acceptable (Stuart, 2010). As shown in Table 3 and Figure 1, the average ASD across all 40 imputations was <.25 for all covariates and <0.10 for nearly all. We also examined balance in each individual imputed dataset; this examination revealed seven imputations in which covariate balance was not achieved (ASDs were >.25, although none were >.28). Specifically, Hispanic/Latinx racial/ethnic status achieved an ASD of between .25 and .28 in two of the 40 imputations; whether a student was in center-based care at age 3 years achieved an ASD of between .25 and .28 in three of the 40 imputations, and whether the child first experienced nonparental care after age 3 years achieved an ASD of between .25 and .28 in two of the 40 imputations. To account for these residual imbalances, the covariates listed earlier were included as controls in our main regression models (“doubly robust” regression models; Funk et al., 2011).
Characteristics of preschool attenders and nonattenders, before and after weighting
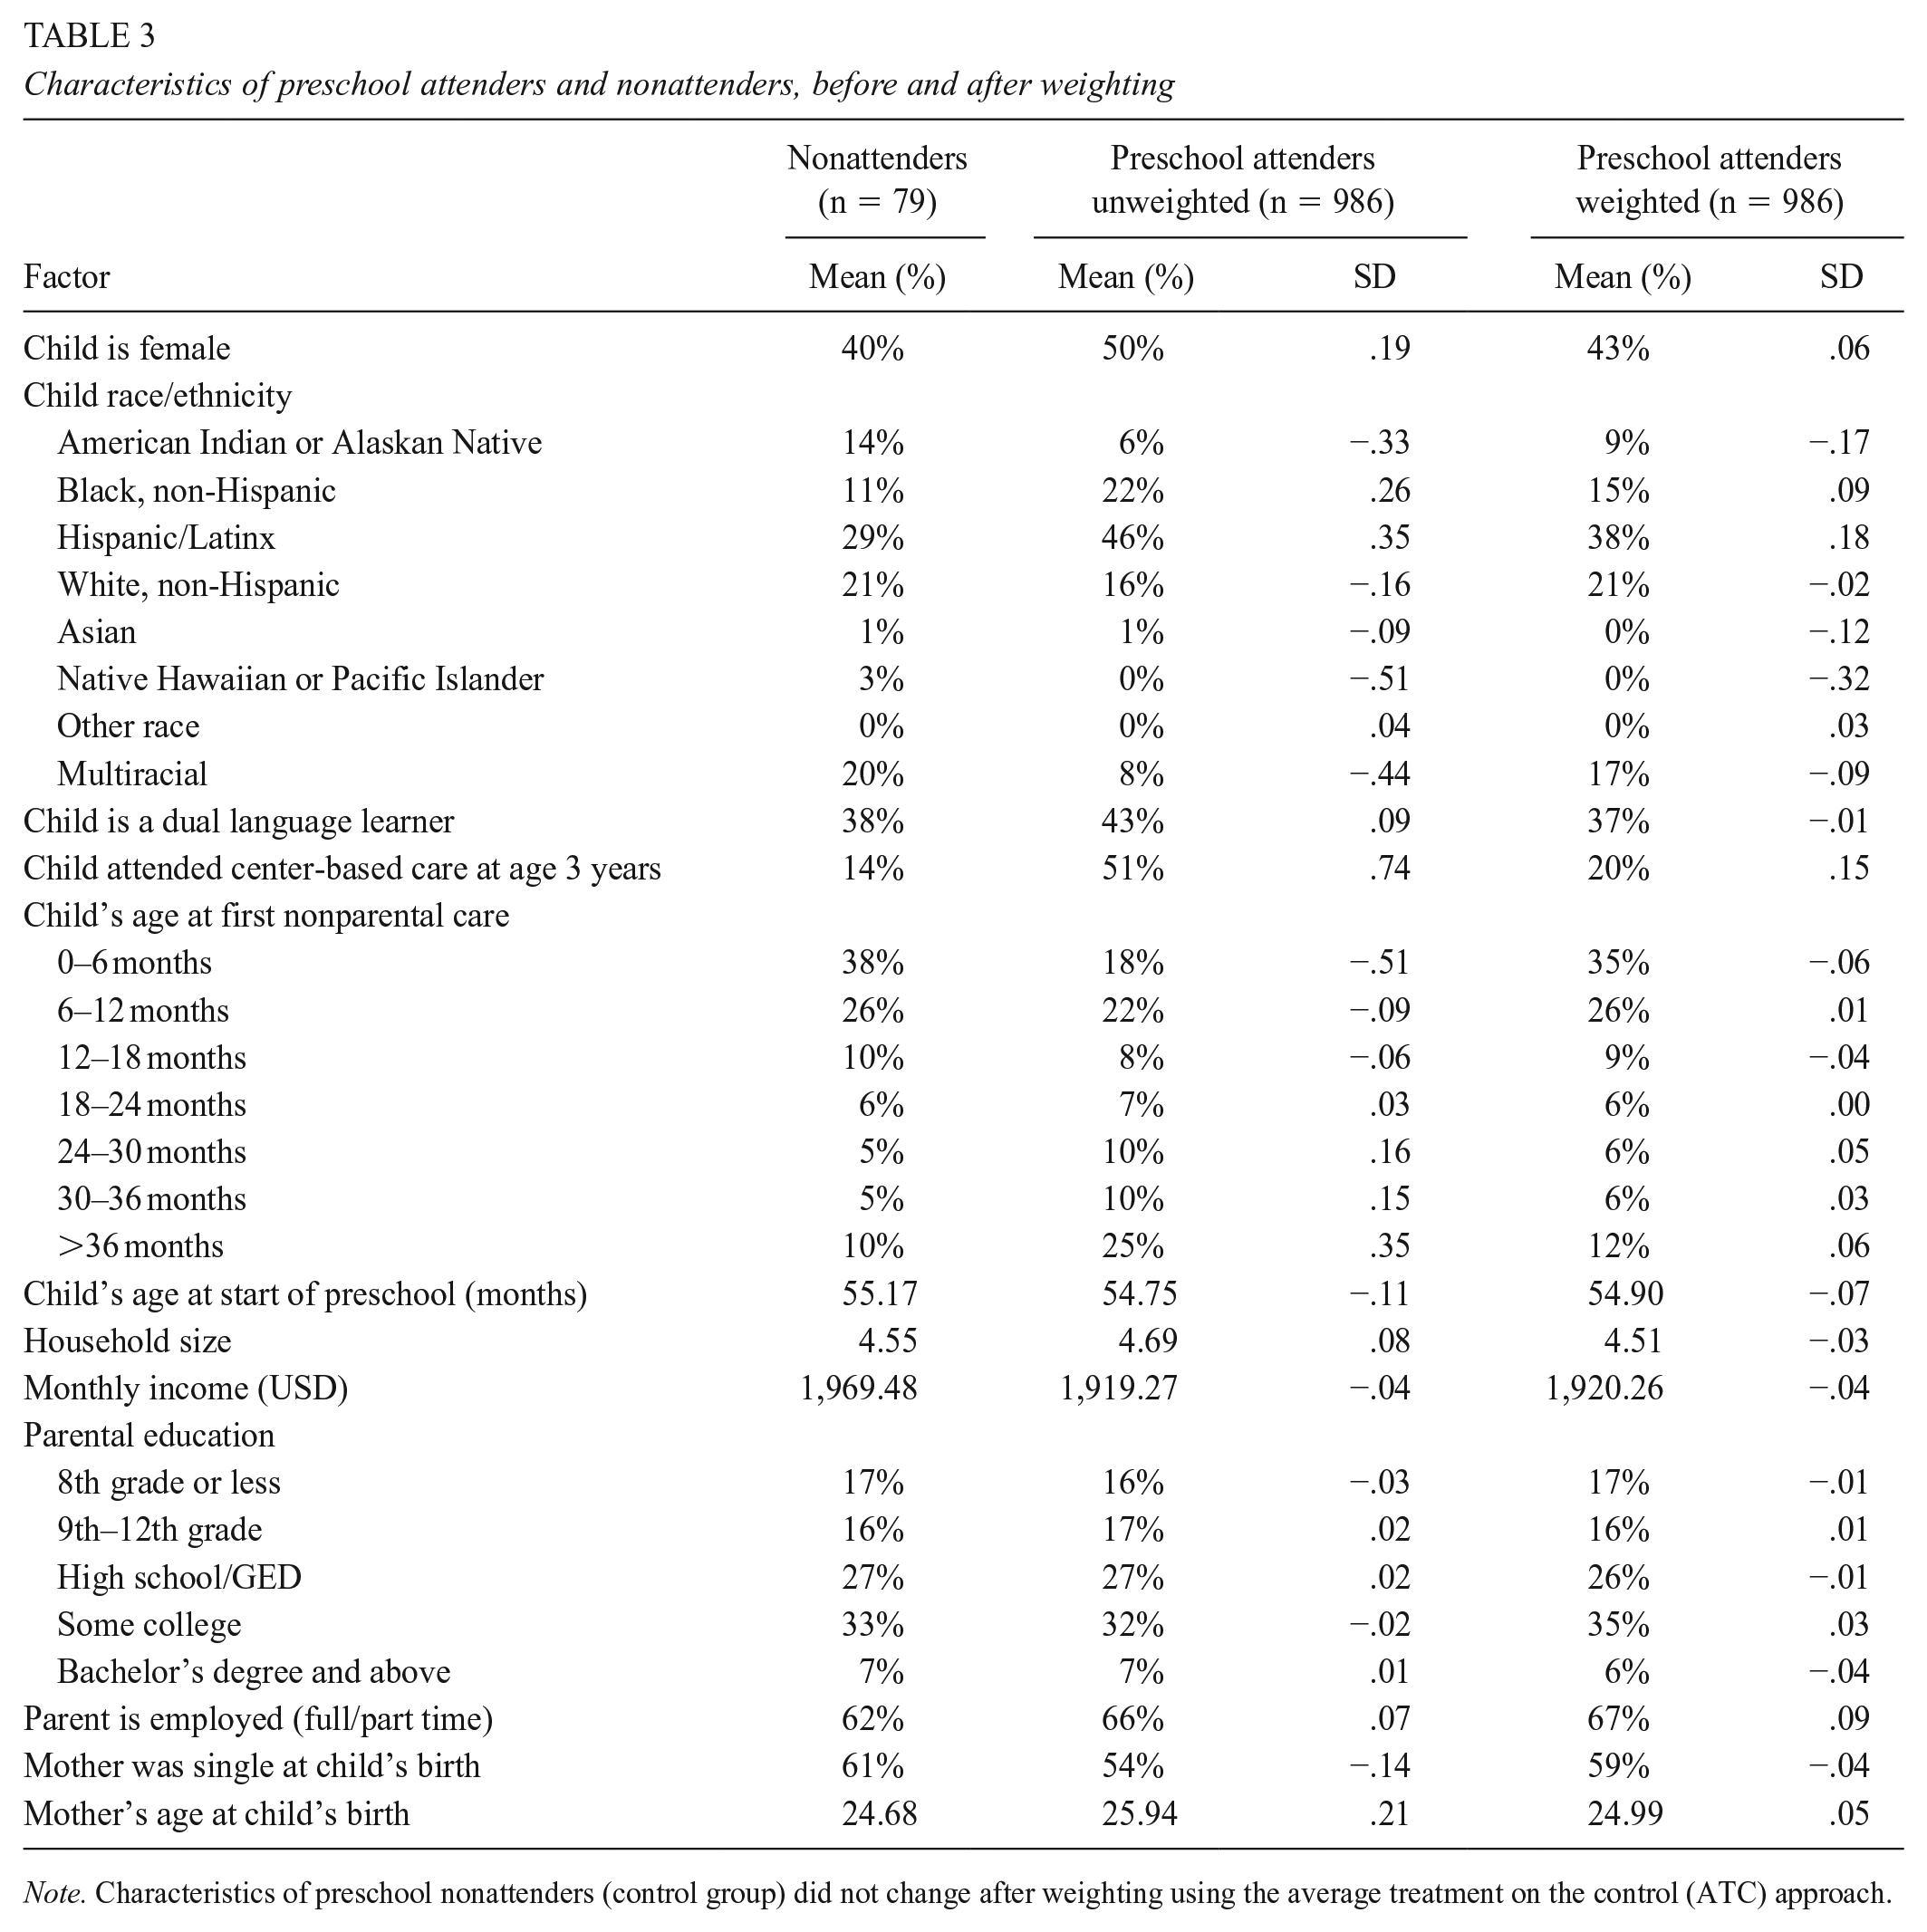
Note. Characteristics of preschool nonattenders (control group) did not change after weighting using the average treatment on the control (ATC) approach.

Balance statistics, pre- and post-propensity score weighting.
Missing Data
There were no missing data on child race/ethnicity, gender, DLL status, and age at the start of the preschool year. For the remaining covariates, rates of missingness ranged from 9% to 46%. Therefore, we implemented multiple imputation through chained equations (MICE) in Stata. We created 40 imputed data sets. Missing values were imputed using Stata’s “mi impute chained” command. Dependent variables were included in imputation models but were not analyzed in regression models per Von Hippel (2007). Since missingness of outcomes was not uniform, our analytic sample size differs across outcomes and is denoted in tables accordingly. We followed best practices in multiple imputation by including a wide range of relevant covariates in the predictive imputation models (Enders, 2022; Woods et al., 2024; see Appendix Table 1); this included post-treatment covariates which are not appropriate for propensity score weighted analyses (see Stuart, 2010) and thus were not used in the propensity score weight calculations or adjusted regression models.
Results
With respect to our first research question, which asked whether public preschool attendance was associated with school administrative outcomes in third grade, there were no associations between public preschool attendance and OSTP ELA or math test scores (Table 4). Likewise, preschool attendance did not predict grade retention, IEP status, days absent, or chronic absenteeism.
Results of IPT-Weighted Analyses Predicting Third-Grade Administrative Outcomes from Preschool Attendance

Note. OSTP = Oklahoma State Testing Program; ELA = English Language Arts; DLL = dual language learner; OR = odds ratio; IRR = incidence rate ratio. All regressions were estimated using IPT weights; estimates were combined and averaged across 40 imputed data sets. All models control for child gender, race/ethnicity, dual language learner status, age at start of preschool, household size, monthly income, parental education, parental employment, and mother’s age and marital status at child’s birth.
p < .05; **p < .01; ***p < .01.
With regard to our second research question, which asked whether results differed between DLLs and non-DLLs, we found that among non-DLLs, there were no associations between preschool attendance and OSTP ELA or math test scores, attendance, grade retention, or IEP status (Table 4). However, among DLLs, preschool attendance was associated with a large reduction in number of days absent (IRR = 0.64; SE = .11; p = .01); for the average student in the sample, this equates to a 6-day reduction in days absent. There was also a significant reduction in the odds of chronic absenteeism (OR = 0.30; SE = .17; p = .03). Post-estimation Wald tests comparing the results for non-DLLs to those for DLLs in models of attendance and chronic absenteeism revealed that these differences were statistically significant. There were no associations with OSTP ELA or math test scores, grade retention, or IEP status.
Sensitivity and Robustness Tests
To probe the robustness of our results to various alternative modeling decisions, we ran a variety of sensitivity tests. First, we re-estimated all models with an average effect of the treatment on the treated (ATT) estimand, which estimates the marginal effect of attending public preschool on those who actually attended it (as opposed to the ATC, which estimates the marginal effect of attending public preschool on those who did not). The pattern of results and interpretation was identical.
Next, as mentioned earlier, given that absenteeism data on grade-retained students in 2021-2022 was not available (because those students would have been in second grade in the 2021-2022 school year, and the state does not report administrative outcomes – including absenteeism – until third grade), we did not include them in models predicting absenteeism from preschool attendance. To test whether this biased our results, we re-estimated those models adding retained students’ third grade attendance data. These data were drawn from the subsequent school year (2022-2023) and thus are an imperfect substitution for missing 2021-2022 school year attendance data. Nevertheless, the inclusion of these data did not change the interpretation of our results. We also assessed the degree to which models estimating absenteeism might have been biased by excluding retained students by re-estimating models predicting all other outcomes excluding retained students. Results were unchanged.
We also experimented with an alternative form of test score outcomes. OSDE provides “performance levels” for OSTP ELA and math tests that categorize students into four groups: below basic (scaled scores of 200-249); basic (scaled scores of 250-299); proficient (scaled scores of 300-349); and advanced (scaled scores of 350-399). In sensitivity tests, we replaced scaled scores with performance levels; results were the same in the full sample and DLL/non-DLL subgroups. Next, we re-estimated models of ELA and math scores employing a binary measure of proficiency which Oklahoma uses as one of several criteria for promotion to fourth grade (based on a cutoff scaled score of 300 and above). Logistic regression models of ELA and math proficiency did not reveal any association with preschool attendance in the full sample or the DLL and non-DLL subgroups.
Finally, to address whether unobservable differences in families’ selection into kindergarten settings according to their preschool attender status may have confounded estimates of the associations between preschool attendance and administrative outcomes, we re-estimated all models with the inclusion of kindergarten school fixed effects (although we note that post-treatment covariates – like kindergarten school – are not typically included in propensity score models). Results from these models were identical to our main models. To ascertain whether unmeasured variables at the school level might bias results, we restricted our sample only to schools that had at least one preschool attender and at least one non-attender; results from the analysis restricted to those schools were substantively identical to our main results (all supplementary analyses available upon request).
Discussion
Public preschool attendance has been consistently linked to better kindergarten readiness (Phillips, Lipsey, et al., 2017), but the evidence base on longer-lasting preschool benefits is much more sparse and uneven. The current study aimed to contribute new data to ongoing debates over whether preschool benefits sustain to third grade and if so, on which outcomes and for whom. Specifically, we examined an array of third-grade school administrative outcomes including test scores, grade retention, special education status, and a largely ignored but increasingly important outcome: absenteeism. And we did so on a large and diverse sample of children from low-income families, as well as separately among the DLLs and non-DLLs in our sample. All of this work was conducted in the post-COVID-19 year, when students were just returning to school after more than a year of remote learning when nationally, test scores and attendance declined. Against this backdrop, in our full sample, we found no association between preschool attendance and test scores, grade retention, special education status, or absenteeism. However, preschool attendance was linked to lower absenteeism in our DLL subsample.
State Standardized Test Outcomes
Our failure to find links between preschool attendance and state ELA and math tests is consistent with recent studies of pre-K programs in Boston and Tennessee, respectively (Durkin et al., 2022; Lipsey et al., 2018; Weiland et al., 2020). However, it stands in contrast to results from other, earlier evaluations that found positive associations between pre-K and both reading and math test scores (Andrews et al., 2012; Ansari et al., 2017; Barnett & Jung, 2021; Barnett et al., 2013; Courtney et al., 2023; Early et al., 2019; Peisner-Feinberg & Schaaf, 2010). Results are also inconsistent with earlier results from Tulsa. Specifically, in a cohort of children who attended Tulsa pre-K in 2000-2001, there were no associations with third-grade test scores (Hill et al., 2015), but among children who attended Tulsa pre-K in 2005-2006, positive associations were detected with third- and eighth-grade math test scores only (Gormley et al., 2018; Hill et al., 2015), though in third grade, only for boys (Hill et al., 2015). The current study’s sample is still in elementary school and thus we cannot yet test whether we, too, might detect associations between preschool attendance and math scores in eighth grade; this is a question for future study.
This perplexing mix of findings makes it challenging to draw clear conclusions about under what circumstances – and for whom – public preschool promotes higher middle-grade school test scores. There is, in fact, a parallel mix of findings regarding associations between public preschool school and directly assessed language, literacy, and math skills in the middle grades (e.g., Johnson et al., 2024; Frede et al., 2009; Lipsey et al., 2018; Puma et al., 2012; Weiland et al., 2021). With respect to both sets of outcomes, we propose that variation in methods used to predict outcomes contributes to the mix of findings, as does the diversity in preschool programs being studied: evaluations of programs occurring in different locales with different attitudes and assumptions (both by teachers and by families) around the value of pre-K education, relying on different program models (i.e., mixed delivery versus school-based only) and eligibility criteria (i.e., income-targeted versus universal) are unlikely to produce uniform results. These differences could in turn contribute to differences in program quality, workforce characteristics, the demographic composition of both attenders and non-attenders, and the availability and appeal of alternatives to public preschool, each of which could influence estimates of program outcomes. For instance, some have found that attending preschool in a public school versus another setting drives impacts (Magnuson et al., 2007); others have found that universal programs are more likely to produce positive effects than targeted programs (Cascio, 2023). We further speculate that in areas where preschool is culturally accepted and valued by the community as a first step on the road to formal education (as opposed to “babysitting”), it may be easier to recruit and retain higher-quality teachers who view themselves as part of a professional workforce, and it may draw families who value education differently.
Moreover, the context within which public preschool operates has shifted dramatically over time. School-based pre-K, like the TPS program studied here, was a relatively new phenomenon in the early 2000s, when many evaluation projects were launched, but has more recently become an integral part of the elementary education system in many of the states and cities that offer it. This education system exists in the post-school accountability standards era, in which school funding decisions are yoked to student test score performance as early as third grade – a shift with likely repercussions for children’s experiences in their earliest school years, including preschool. Some have observed that these experiences now include a greater emphasis on academics to ensure all students are prepared for success on the high-stakes third-grade standardized tests (e.g., Desimone et al., 2004; Markowitz & Ansari, 2020; Weisenfeld et al., 2020). To the extent that more contemporary preschool programs focus on “teaching to the test” and kindergarten teachers repeat similar material to help preschool non-attenders catch up, any differences between the two groups on test outcomes would likely be diminished quite rapidly, as has been found in other studies relying on state standardized test score outcomes (Durkin et al., 2022; Lipsey et al., 2018; Weiland et al., 2020). Morevoer, national data show dramatic declines in standardized test scores after COVID-19-related school closures (NAEP, 2022a); it is possible that this decline quashed a pre-K advantage we may have otherwise found.
Yet with these same data, we did detect lasting associations between preschool attendance and students’ performance on directly assessed research-based assessments of language and math skills in first and third grades (Johnson et al., 2023, 2024). Thus, it appears public preschool – at least in Tulsa – is setting in motion learning that promotes better academic outcomes years later, even in the wake of COVID-19, just not for the outcomes captured by state standardized tests. Indeed, in our study, there are only modest correlations between children’s scores on our direct assessments of language and math abilities – like expressive vocabulary and the ability to quickly and accurately differentiate number symbols – and their OSTP ELA and math tests scores (Hummel-Price et al., 2023). To our knowledge, only two other studies have analyzed both researcher-administered direct assessments and state test scores in later elementary school. In New Jersey, public pre-K was positively associated with both research-based direct assessments (in second grade; Frede et al., 2009) and state test scores (in third grade; Barnett & Jung, 2021). In Tennessee, public pre-K was not associated with math when it was directly assessed in third grade, but it was negatively associated with state math test scores that year (Lipsey et al., 2018). The opposite pattern was found for language, whereby pre-K was negatively associated with directly-assessed oral language skills but not associated with state ELA tests. These apparent contradictions highlight the need for a deeper understanding of the overlap and divergence in content between state tests and direct assessments, as well as an accounting of the type of content targeted by various preschool curricula.
Retention and Special Education Status
Our null findings with respect to retention and special education status are also consistent with some – but not all – prior research. Very recent evaluations of public pre-K in Boston and North Carolina found no effects on grade retention or special education placement (Gray-Lobe et al., 2021; Watts et al., 2023; Weiland et al., 2020), but studies of programs in Texas and New Jersey found the opposite: public preschool attenders were less likely to be grade retained or have a special education placement in third grade or beyond (Andrews et al., 2012; Barnett & Jung, 2021; Barnett et al., 2013). In Tennessee, there were no differences in grade retention for public pre-K attenders versus non-attenders, but preschool attenders were more likely than non-attenders to receive an IEP in third and sixth grade (Durkin et al., 2022; Lipsey et al., 2018). And earlier work in Tulsa on the cohort of students who attended public preschool in 2005-2006 revealed lower rates of grade retention but no effects on special education placement, albeit in middle school (Gormley et al., 2018; Phillips et al., 2016). Again, the students in the current study’s sample are not yet in middle school, and thus it remains an open question whether links between preschool attendance and grade retention or special education status will emerge as they age.
It is important to note that the field is grappling with conceptualizing special education as a potentially positive versus negative outcome of preschool attendance. The interpretation attached to an IEP designation has important implications for understanding its null association with preschool attendance in this study. On the one hand, if attending public preschool leads to earlier disability identification and provision of necessary supports, then receiving an IEP would be considered a beneficial outcome of preschool attendance. This might be particularly true for children with disabilities that tend to be chronic or severely impact everyday functioning (e.g., autism, intellectual disability, hearing and visual impairments; Daley & Carlson, 2009) or for whom earlier intervention holds the promise of mitigating the negative impacts of the disability. On the other hand, some researchers conceptualize special education placement as an adverse outcome that should be reduced by successful pre-K programs – or amplified by unsuccessful ones (Durkin et al., 2022). The onset of certain disabilities (e.g., mild learning disabilities or speech-language impairments; Daley & Carlson, 2009) could plausibly be prevented by high-quality early learning environments. In this case, a post-preschool IEP could be negatively viewed as a proxy for adverse performance that reflects inadequate early education, rather than special needs. As such, the assumptions and conditions that lead to a negative conceptualization of IEP status as a whole remain unclear. Future research that adds more nuance to how we measure and conceptualize IEP status by capturing the types of IEPs that students receive, and IEP timing and duration, is urgently needed to add clarity to this discussion. This is particularly important for minoritized children and DLLs, who may be under- or over-represented in the IEP recipient population (Hosp & Reschly, 2004; Sullivan, 2011).
Attendance and Absenteeism
The association between preschool attendance and absenteeism was non-significant for the full sample. This finding is similar to the only other study examining third-grade absenteeism (Lipsey et al., 2018). It could also be that a pre-K advantage on attendance might have been sustained in the absence of COVID given the pandemic’s catastrophic effect on school attendance nationwide (Dee, 2024).
However, for DLLs alone, there was a large and significant association between preschool attendance and reduced school absences and chronic absenteeism. This finding mirrors one other study, on an earlier cohort of Tulsa students who attended Head Start in 2005-2006: that study found reduced absenteeism in middle school, with stronger effects for Hispanic/Latinx children (Phillips et al., 2016).
One possible explanation for both the earlier study’s finding and ours is that preschool exposure may cement a home-school connection for DLL families earlier than kindergarten entry: in our sample, DLL status overlaps highly with Hispanic/Latinx ethnicity, and Hispanic parents are often more likely than non-Hispanic parents to work multiple jobs and/or non-standard hours (Adams et al., 2021), which may present challenges for engaging in school activities. Further, Hispanic/Latinx parents are more likely to experience language barriers with school personnel (Turney & Kao, 2009), and to experience discrimination in schools (Ayón, 2015), which may be an obstacle to collaborative relationships with school personnel. Yet, an earlier start to school in a Head Start or school-based pre-K classroom may help DLL families overcome these barriers. In Tulsa, CAP-Head Start is well-integrated with the TPS system, and TPS pre-K classrooms are co-located in elementary schools, so regardless of whether DLL children attended Head Start or school-based pre-K, the preschool year may have established a solid home-school connection earlier that endured through elementary school. These home-school connections might include building trust with the district, having a trusted and reliable point of contact in the school, becoming familiar and comfortable with the various platforms school personnel use to communicate with families – all of which might contribute to greater attendance. Clearly, much more research is needed: understanding the mechanisms involved in public preschool’s impact on reduced absenteeism among DLLs is an essential next step for the field.
Limitations
Our study is not without limitations. First, there is likely differential selection into preschool attendance that our propensity score weighted models could not fully address. For instance, there may be something unique and unobservable about DLLs who attend preschool that explains increased attendance post-COVID-19. Although IPTW methods are increasingly popular, especially among longer-term preschool follow-up studies (see Amadon et al., 2022; Ansari et al., 2023; Weiland et al., 2021), these are imperfect solutions in environments in which random assignment is not feasible. Thus, our results must be considered correlational, and not causal. Nevertheless, they highlight key areas for future research with lottery or RCT designs to collect data: specifically, DLL status, and school attendance and absenteeism.
Second, our comparison group of preschool non-attenders is much smaller than the preschool attender groups. While this is a methodological weakness because it underpowered our analyses, it reflects the reality of preschool in Tulsa where a majority of 4-year-olds enroll in preschool. Other unique aspects of preschool in Tulsa have implications for the generalizability of results. The TPS pre-K program is universal, meaning it is available to all families regardless of household income. Some evidence suggests that universal preschool programs produce stronger benefits than programs that concentrate children from low-resourced families in income-segregated classrooms (Cascio, 2023), like the program in Tennessee. Sample attrition may also have limited the generalizability of our findings because participants who left Oklahoma public schools before third grade and were thus dropped from the analysis were less likely to be DLLs or Hispanic/Latinx, more likely to be Black, and had higher maternal education. Thus, results can only generalize to those who remained in an Oklahoma public school for third grade.
Conclusions and Future Directions
Preschool education in the U.S. has borne exceedingly high expectations, notably that this first year of formal education will produce enduring impacts on children’s school progress and beyond. The current findings, based on administrative data, join others that have painted a picture of mixed, if not disappointing, evidence of persistence into the elementary grades. Yet, as we have noted, standardized test scores may provide a narrow view of academic progress, and reliance on reduced special education placement as a uniformly positive indicator of preschool success is under debate.
On the other hand, our finding that DLLs who attended public preschool missed fewer days of school and had lower rates of chronic absenteeism carries highly consequential implications. Poor school attendance, beginning in the early elementary years, is one of the first indicators that a child may be headed for a troubling trajectory in school. It precludes steady learning, stable relationships with teachers and classmates, and the development of a strong connection to school. For some children, early absenteeism is the harbinger of a school career that is severely compromised by ongoing absenteeism. Today, absenteeism also threatens to compromise efforts across the nation to reverse slowed rates of learning during COVID-19. Our evidence suggests that an unrecognized benefit of preschool education could be reduced absenteeism. This is an avenue worth exploring alongside other efforts to stem absenteeism, particularly chronic absenteeism. In particular, such efforts could approach preschool as a platform from which to launch the multi-pronged strategies that are most effective in addressing chronic absence. To the extent that these efforts entail developing a culture and routines around regular student attendance, starting with a child and family’s first encounter with formal schooling could be a sound strategy.
There is also a need for more research following students long after the return to in-person schooling post-pandemic. Scholars have called for efforts to leverage existing data – studies that were in the field, collecting data before COVID-19 – to shed light on how children’s trajectories may have changed from pre-post-COVID-19 (see Weiland & Morris, 2022). Research projects, including our own, that have followed preschool cohorts into and through COVID-related educational (and other) disruptions could offer a rich source of lessons regarding which children succumb, survive, and thrive as they return to school, including examination of the role that preschool exposure may play in these patterns over time. Though beyond the scope of this analysis, these are rich questions ripe for future study.
Footnotes
Appendix
Variables included in regression, propensity score, and multiple imputation models

| Regressions | Propensity Scores | Multiple Imputation | |
|---|---|---|---|
|
|
|||
| Child race/ethnicity a | Yes | Yes | Yes |
| Child is female | Yes | Yes | Yes |
| Child is a dual language learner | Yes | Yes | Yes |
| Child age at start of preschool year | Yes | Yes | Yes |
| Mother’s education a | Yes | Yes | Yes |
| Mother is employed | Yes | Yes | Yes |
| Mother was single at child’s birth | Yes | Yes | Yes |
| Mother’s age at child’s birth | Yes | Yes | Yes |
| Monthly income | Yes | Yes | Yes |
| Household size | Yes | Yes | Yes |
| Whether child was in center-based care at age 3 | No | Yes | Yes |
| Child’s age at first non-parental care | No | Yes | Yes |
| Gifted status (per OKSDE records) | No | No | Yes |
| Number of days absent in 2022-2023 | No | No | Yes |
| Chronically absent in 2022-2023 | No | No | Yes |
| 4th grade OSTP Math (on-time students only) | No | No | Yes |
| 4th grade OSTP ELA (on-time students only) | No | No | Yes |
| Woodcock-Johnson Applied Problems b | No | No | Yes |
| Woodcock-Johnson Letter-Word b | No | No | Yes |
| Woodcock-Johnson Passage Comprehension b | No | No | Yes |
| Numeracy Numerical Comparisons b | No | No | Yes |
| Numeracy Numerical Ordering b | No | No | Yes |
| CELF Expressive Vocabulary b | No | No | Yes |
|
|
|||
| 3rd Grade OSTP Math | n/a | No | Yes |
| 3rd Grade OSTP ELA | n/a | No | Yes |
| Number of days absent in 2021-2022 | n/a | No | Yes |
| Chronically absent in 2021-2022 | n/a | No | Yes |
| Grade retained | n/a | No | Yes |
| Has active IEP | n/a | No | Yes |
Note. OKSDE = Oklahoma State Department of Education; OSTP = Oklahoma State Testing Program; ELA = English Language Arts.
Race/ethnicity and mother’s education used in propensity score and multiple imputation models included a richer set of options that had to be collapsed for the final regressions due to sparseness. Race/ethnicity collapsed American Indian or Alaskan Native, Asian, Native Hawaiian or Pacific Islander, Multiracial, and Other Race into a single “Other“ category. Mother’s education collapsed 8th grade or less, 9th-12th grade, and high school completion into a single “High School or Less“ category, and post high school certification, some college, Associate’s degree, Bachelor’s degree, and Master’s degree into a single “More than High School“ category.
Directly-assessed items were administered in fall 2021 (Woodcock-Johnson Applied Problems and Letter-Word), spring 2022 (Woodcock-Johnson Passage Comprehension; Numeracy Numerical Comparisons and Numerical Ordering; and CELF Expressive Vocabulary), and fall 2022 (all).
Acknowledgements
We are deeply grateful to the Tulsa Public School district, CAP-Tulsa Head Start, Tulsa Educare, charter school officials, and the many teachers, parents, and children who participated in this study.
Thanks to Pamela Morris-Perez and the other panelists and participants at the Fall 2023 Society for Research in Educational Effectiveness (SREE) conference for valuable feedback on earlier versions of this work, and to Elizabeth Stuart for her guidance on propensity score matching. Thanks to Anne Partika for her review, especially of analyses and discussion of DLLs. All errors are the responsibility of the authors.
Declaration of Conflicting Interests
The author(s) declared no potential conflicts of interest with respect to the research, authorship, and/or publication of this article.
Funding
The author(s) disclosed receipt of the following financial support for the research, authorship, and/or publication of this article: This study was supported by grants from the Heising-Simons Foundation (Grant #s 2016-107 and 2017-329), the Foundation for Child Development (Grant #GU-03-2017), the Spencer Foundation (Grant # 201800034), and the National Institutes of Health NICHD (Grant #1R01HD092324-01A1). Data collection was also supported by the George Kaiser Family Foundation and the University Strategic Organization Initiative at the University of Oklahoma.
Note: This manuscript was accepted under the editorship of Dr. Kara Finnigan.
Authors
ANNA D. JOHNSON, PhD, is a Professor in the Department of Psychology at Georgetown University and Co-Director of Georgetown’s Child Development and Social Policy Lab; email:
DOUGLAS HUMMEL-PRICE, MS is a research fellow affiliated with the Department of Psychology and the McCourt School of Public Policy at Georgetown University and a data scientist at the Universal Service Administrative Company. His research covers a broad range of topics related to public education in the US, including early childhood education, school finance, and standardized testing.
ANNE MARTIN, DrPH, is an Independent Consultant affiliated with the Department of Psychology at Georgetown University. Dr. Martin’s research focuses on the features of home and school environments that influence low-income children’s development, as well as the impacts of publicly funded programs aimed at narrowing income-based gaps in child development.
SOPHIE RODOSKY, MA is a graduate student in the Department of Psychology at Georgetown University and a research assistant in the Child Development and Social Policy Lab. Her research interests lie at the intersection of school policy, teacher experiences and wellbeing, and the teaching and learning of children with special needs.
DIANE HORM, PhD, is the Emerita George Kaiser Family Foundation Endowed Chair of Early Childhood Education and Founding Director of the Early Childhood Education Institute at the University of Oklahoma at Tulsa. Dr. Horm leads several applied research initiatives in early childhood education including program evaluation research in collaboration with Tulsa Educare, CAP-Tulsa Head Start, and the Tulsa Public Schools (TPS).
DEBORAH A. PHILLIPS, PhD, is Emerita Professor in the Department of Psychology at Georgetown University. Dr. Phillips is one of the nation’s leading child care and early education policy researchers, with more than four decades of experience leading evaluations of early care and education program effects – including public preschool and early elementary school – on vulnerable children’s learning and wellbeing.