
Abstract
The Teacher of the Year (TOY) program is the longest-standing teacher recognition program in the United States. The purpose of this study is to describe the characteristics of state and national TOY awardees and the schools in which they teach. To accomplish this aim, we develop a new data set including the characteristics of all TOY awardees and their schools from 1988 to 2019. Using descriptive and regression analysis, we find that TOY awardees are most likely to teach at the high school level, while the most common subjects taught were elementary education, English language arts, natural sciences, and, for National TOY awardees, social studies. They also have a greater probability of being selected from schools with a smaller fraction of students eligible for free or reduced-price lunch, and higher student enrollments. We discuss how these differences may impede the TOY program’s efforts to amplify teachers’ voice in education policymaking.
Keywords
Even as calls for teacher leadership grow and the formal roles within school systems broaden, teacher leadership still tends to be highly localized (Eckert et al., 2016; Wenner & Campbell, 2017). That is, when teachers engage in efforts outside their classroom to improve school conditions and student success, they are most likely to be confined to a local school or district or rely on collective mobilization, such as teacher walkouts or strikes. This focus on local conditions seems to result from four main factors: (1) teachers’ resource and time constraints, (2) a focus of teachers’ work on routine classroom demands as opposed to the broader policy conditions that shape their work, (3) lack of access to social networks with connections to policymakers, and (4) a long-standing policymaking paradigm whereby teachers are the target of reform rather than its drivers (Cochran-Smith & Lytle, 2006; Hess, 2015; Honig, 2006; Mehta, 2013).
One notable exception to this pattern is the National Teacher of the Year (NTOY) program, the longest-standing teacher recognition program in the United States. Established by the Council of Chief State School Officers (CCSSO) in 1952, the program has annually selected a single awardee from a set of state-level nominees. The significance of this recognition is in some ways self-referential; by selecting a single teacher from the more than 3.5 million public school teachers, these teachers, as well as their state-level counterparts, are elevated as ambassadors of the teaching profession. Teacher of the Year (TOY) awardees are positioned to overcome the constraints that have historically inhibited teachers’ broader involvement in the education policymaking process. As the NTOY program provides training for teachers to advocate for causes relevant to the teaching profession, access to policy networks, and, in some cases, support from states and districts to cover the cost of a year of paid leave, the program helps to amplify teachers’ voice in education policymaking.
This engagement in the policymaking process is, arguably, increasingly important for teachers as the education reform agenda has shifted in significant ways to the state and federal levels (Henig, 2009). Beginning with No Child Left Behind, reform efforts have shaped school practices in ways previous reform efforts had not (Berkovich, 2011; Cochran-Smith & Lytle, 2006). If critical decisions affecting teachers’ work are made at higher levels of governance, having teachers involved, even in the agenda-setting process, could lead to educational reforms that teachers are more receptive to (Fullan, 1991; Redding & Viano, 2018). In addition, which teachers are involved in this advocacy work might also be consequential. Public school teachers are not a monolithic group, with different job demands associated with teaching in high-poverty urban schools compared with the more affluent suburban schools (Kraft et al., 2015). If teachers working in schools with more traditionally underserved students are less likely to be selected as a TOY, it would suggest that these teachers have less opportunity to advocate for the unique needs of teachers and students in these schools.
As a first step in characterizing the TOY program, in this study, we report the grades and subjects taught by, and the school characteristics of the TOY awardees. To accomplish this aim, we develop a data set containing the characteristics of all state and national TOY awardees from 1988 to 2019. Using a descriptive and fixed effects regression analysis, we compare the characteristics of TOY awardees with a nationally representative sample of public school teachers and the characteristics of their schools with the population of public schools.
This study is guided by the following research questions:
Research Question 1: What are the characteristics of state and national TOYs? How do they compare with a national sample of teachers?
Research Question 2: What are the characteristics of the schools in which TOY awardees teach?
Are the schools in which they work representative of schools nationwide? Answering these questions is important for two main reasons. First, as TOY awardees are arguably the most public representatives of the teaching profession, describing who receives this honor is important given that a misrepresentation of the teaching workforce can create distorted public images of teachers (Bulkley & Gottlieb, 2017; Cochran-Smith & Lytle, 2006; Swetnam, 1992). Second, as education policymaking increasingly occurs at the federal and state levels, proponents of teacher leadership have increasingly called for teacher advocacy as a means to influence public policies that shape teachers’ work. Since the TOY program provides both leadership training and a platform for teacher leaders, it is one of the most prominent nationwide efforts to promote teacher advocacy and, as such, deserves systematic study.
The Teacher of the Year Program
The NTOY program has annually selected a single awardee from the set of state-level nominees for close to seven decades. The NTOY selection process has changed over time but, at present, is managed by state departments of education and CCSSO. State departments of education select a state Teacher of the Year (STOY), who is then eligible for the national recognition. The process by which STOYs are selected varies from state to state. Typically, states have a two-tiered process in which districts nominate their selected TOYs for state-level review. Some states include a third tier of regional TOYs, while other states have opened up the process to accept direct nominations from individuals. Applicants are required to submit a package that usually includes a form, one or more essays, and letters of nomination. At advanced stages of the process, state selection committees employ more rigorous review methods, asking semifinalists or finalists to participate in interviews, presentations, performance tasks, or classroom observations.
Selection committee membership varies widely from state to state but usually consists of state educational leaders, district superintendents, former TOYs, university representatives, business partners, and other stakeholders. In an effort to reduce bias, many states redact photos, demographics, and other identifying information prior to review. The process culminates in the selection and public announcement of an STOY, who will represent the state at the national level, plus several finalists, who may also have regional or statewide duties supplementing those of the STOY.
Each state’s nominee is then eligible to complete an application for NTOY (CCSSO, 2020a). These applications are reviewed by a selection committee composed of members of prominent educational organizations (e.g., American Federation of Teachers, National Education Association, American Association of Colleges for Teacher Education, American Association of School Administrators, Association for Supervision and Curriculum Development, and National Urban League; CCSSO, 2015). This committee identifies four finalists for interviews, one of whom is selected as NTOY. There are no formal requirements for the NTOY program other than a demonstration of exceptional teaching and a willingness to be released from classroom teaching during the year of recognition.
There have historically been two main elements of the NTOY program: a recognition ceremony at the White House and public engagement by TOY awardees. The goal of this public engagement is to serve as an ambassador for the teaching profession. That is, TOY awardees speak with students, teachers, school and district leaders, policymakers, and business leaders about the issues shaping the work of teachers and their students. Currently, their public engagement also includes meetings of state and national educational associations, CCSSO meetings, NASA’s Space Camp, and an induction meeting hosted by Google for Education at Google Headquarters, among other events (CCSSO, 2020b). The NTOY and some STOY awardees receive a year of paid leave to complete these responsibilities. In recent years, the NTOY program has broadened its focus from teacher recognition to encouraging teacher leadership and advocacy, and it provides explicit leadership training for TOY awardees in efforts to support their advocacy work (CCSSO, 2017).
Teachers of the Year and the Contemporary Landscape of Teacher Leadership
Efforts to increase teachers’ leadership opportunities have intensified in recent years, with the Teacher Leader Model Standards arguably the most notable development from this resurgent interest (Donaldson et al., 2008; Eckert et al., 2016; Smylie & Eckert, 2018; Teacher Leadership Exploratory Consortium, 2011). These standards were created to provide a policy framework to highlight teachers’ formal and informal leadership roles in efforts to foster their professional learning within their schools. The standards consist of seven domains, the first six of which focus on teachers’ school-based leadership activities (e.g., Fostering a Collaborative Culture to Support Educator Development and Student Learning; Promoting Professional Learning for Continuous Improvement). The final standard, Advocating for Student Learning and the Profession, suggests the need for teacher leaders to attend to not only school-based transformation but broader advocacy efforts as well. For instance, when engaging in the activities within this standard, teacher leaders advocate for the teaching profession outside their classroom by sharing information with colleagues about how education policies affect classroom practice and collaborating with colleagues to advocate for their students’ needs.
Alongside the TOY program are several other programs designed to promote teacher advocacy and engagement with education policymaking. At the federal level, programs such as the U.S. Department of Energy’s Albert Einstein Distinguished Educator Fellowship Program, the National Science Foundation’s Presidential Awards for Excellence in Mathematics and Science Teaching, and the U.S. Department of Education’s (USDOE) School Ambassador Fellowship seek to celebrate teaching excellence while involving teachers in education policy development and implementation. Research on the USDOE Teaching Ambassador Fellowship shows that participating teachers believed that the experience improved their leadership knowledge, skills, and dispositions (Eckert et al., 2016). Many teachers in the study also reported changing positions to extend their impact in the field, with those who remained in teaching often struggling to find spaces that fostered continued professional growth. These findings suggest that teacher programs have the potential to promote teachers’ leadership development but the available career pathways for teachers might be too narrowly defined for teachers who want to make broader impacts on the profession (Eckert et al., 2016).
Other organizations have placed greater emphasis on promoting teacher advocacy among teachers who maintain a connection to the classroom. For instance, Educators for Excellence (n.d.) seeks to identify and train teacher leaders who create teacher-led policy recommendations and advocate for their implementation as a means to elevate the teaching profession and improve student outcomes. Through its Teaching Policy Fellowship, Teach Plus (n.d.) has developed a network of teacher leaders committed to influencing education policymaking. Despite their different approaches to promoting teacher advocacy efforts, these different organizations appear to be operating within a similar policy space, with one of the 2021 NTOY finalists a Teach Plus Policy Fellow (Teach Plus, 2021). These efforts to promote teacher leadership also point to teachers’ growing interest in leadership development as a means to influence the education policymaking process.
Conceptual Framework
Our conceptualization of the TOY program draws primarily from research on nonprofit organizations in the fields of public administration and sociology. Nonprofit organizations, scholars explain, fulfill at least two social functions. First, they operate as value guardians by advancing organizational values in pursuit of broad public interests (Salamon, 1993). While this social function has historically operated as advocating for the welfare of those who often have a limited voice in public discourse (i.e., the homeless, disabled, members of other neglected communities), in the case of the NTOY program, the values being advanced align with those of each state and of the CCSSO selection committee. Broadly stated, by promoting a positive public image of teachers, the program allows CCSSO to advance their priorities (i.e., advocating for the long-term success of each child through championing the need for adequate public school funding and students’ access to high-quality teachers, rigorous coursework, a positive school climate, and support services; CCSSO, 2017).
In addition to an advocacy and value guardianship role, nonprofits also create and sustain social capital (Eikenberry & Kluver, 2004; Salamon, 1993). The basis of this social capital is the formation of social networks between core constituencies, organizational members, and partner organizations. Eikenberry and Kluver (2004) describe how the successful completion of an organization’s mission and perhaps even the organization’s longevity depend on these networks. In a climate favorable to teacher leadership and advocacy, CCSSO leverages their existing networks with national organizations and state departments of education to give teachers the opportunity to reach a broad, national audience with a message crafted independently by the TOY awardee but ostensibly a pro–public education message. A large responsibility of STOY and NTOY awardees is the speaking engagements. Without the maintenance of diverse social networks of educational administrators, policymakers, and business leaders, the outreach of TOY awardees would be more limited and the efficacy of the program likely hampered. As an example, CCSSO’s role as both manager of the TOY program and partner in state-level education decision making might encourage state policymakers to include TOYs in policy deliberations.
Although being identified as a TOY brings clear opportunities for these teachers, by definition, a recognition program identifies only a small segment of teachers. Portes (1998) has cautioned that the strong ties within a network that bring benefits to members often form the basis for restricting access to opportunities for those outside the network. For the purposes of the current study, this gatekeeping function is concerning if certain groups within the teaching workforce are overlooked for this honor at the state or national level. For instance, although the modal teacher in the United States teaches elementary education, TOY awardees may be selected to represent a broader array of subject areas, leaving elementary education teachers underrepresented and other subject areas overrepresented.
We also expect TOY awardees to be overrepresented in schools with certain characteristics. Teachers in larger schools might be more likely to be selected, which would also result in high school teachers being overrepresented, given the student enrollment differences across school levels. To the extent to which state selection committees want to highlight the diverse and specialized forms of public school teaching, teachers in magnet schools would be expected to have a higher likelihood of being selected. On the other hand, teachers in charter schools may be underrepresented among TOY awardees if charter schools are not included in the formal TOY selection process.
The extent to which TOY awardees work in schools enrolling more students living in poverty or students of color is less clear. On one hand, state selection committees may want to spotlight how excellent teaching can occur at any school. On the other hand, schools enrolling traditionally underserved students have a history of being underresourced and overlooked, leaving the teachers in these schools less likely to be considered as an ambassador of the teaching profession. Systematic patterns of sorting within the teacher labor market may be an additional factor shaping why teachers in schools that enroll more traditionally underserved students are less likely to selected. Research has shown that more qualified, experienced, and effective teachers are less likely to teach in schools with high concentrations of low-income students and traditionally underserved racial/ethnic groups (Goldhaber et al., 2015). Teachers in these schools also tend to face more challenging working conditions at the classroom and school levels, exacerbating turnover rates (Borman & Dowling, 2008; Guarino et al., 2006; Ingersoll, 2001). To the extent to which selection committees identify TOYs among teachers who have longer tenures in a school, the conditions within these schools may result in a reduced likelihood of teachers being selected. There may also be a temporal element to these patterns. The combination of demographic shifts in students served by the public education system and increased income segregation between schools has resulted in the average school now enrolling the majority of students living in poverty or who identify as a racial/ethnic minority (Owens et al., 2016; Snyder et al., 2018). As the demographic profile of America’s schools has changed, we would expect TOYs to be increasingly likely to be selected from schools enrolling more students living in poverty and who belong to racial/ethnic minority groups.
Data and Measures
For this study, we create a new data set using several public data sources. To identify TOY awardees from the 1987–1988 to 2018–2019 school years, we scrape public text data from the websites of CCSSO, state departments of education, and Education Week. In cases where the year of award indicated by the state department of education or Education Week listing is inconsistent with CCSSO data, we prioritize the CCSSO year for consistency. These data generally include the name of the awardee, their school at the time of the award, and the subjects and grades taught. In total, we were able to identify 1,632 TOY awardees.
We matched the TOY awardees to the schools in which they worked, using school-level data from the Common Core of Data (CCD). To match TOY awardees with an accurate National Center for Education Statistics (NCES) identification number concurrent with the year of award, and subsequently with pertinent school-level data, we used year, state, school name, and school level. To resolve ambiguity due to schools with similar names, we used school district data provided by the state department of education’s listing of historic STOY awardees. For this 32-year period, we were able to match approximately 98% of teachers with their schools, resulting in 1,602 observations. 1 We were not able to match the remaining TOY awardees due to their employment at an organization other than a public school, such as a school district, nonprofit organization, or private school. To compare the characteristics of the schools in which TOY awardees work with those of other public schools, in our regression analysis we include all public schools, resulting in an overall sample ranging from 2,439,017 to 2,971,422 schools.
We also integrate data from the Schools and Staffing Survey (SASS) and National Teacher and Principal Survey (NTPS) as a means to compare the subject areas and grade levels of TOY awardees with a nationally representative sample of teachers. Specifically, we draw on administrations of these surveys in the following school years: 1993–1994, 1999–2000, 2003–2004, 2007–2008, 2011–2012, and 2015–2016. Each wave includes roughly between 30,000 and 40,000 surveyed teachers. From these data, we identify public school teachers’ subjects taught and grade levels, as well as key features of their school (i.e., enrollment, proportion of racial/ethnic minorities, the proportion of students eligible for free or reduced-price lunch FRPL, and whether or not the school is a charter or magnet school). 2 While these data do not cover the full range of the TOY data set, we believe they provide a meaningful snapshot of the characteristics of American public school teachers over the 32-year span of this study. In addition, to account for the stratified cluster sampling design and to ensure representativeness, sample weights are used when reporting on these data.
Teachers of the Year
The independent variable for this study is whether or not a school had a TOY awardee in a given year. In most analyses, we focus on both STOYs and NTOYs, although in some analyses, we separate them.
School and Teacher Characteristics
The regression analysis includes several variables related to school context from the CCD. The measurement of these variables is described in greater detail in Appendix Table A1. They include the logged school size, the proportion of racial/ethnic minority students, the proportion of FRPL-eligible students, urbanicity, whether or not the school is a charter school, whether or not the school is a magnet school, and school level (elementary, middle, high, or other).3,4
The descriptive analysis includes additional variables measured at the teacher level. Due to variation in subject area descriptions, as well as instances where the data included two topics within the same general field (e.g., environmental science and biology), we normalized subject area data using the categories listed on the SASS/NTPS questionnaire (NCES, 2015). These categories include one of the following subject areas: early childhood, elementary education, arts and music, special education, English language arts (ELA), English as a second language, foreign languages, health education, mathematics and computer science, natural sciences, social sciences, career or technical education, and miscellaneous. We measure grades taught in two ways. First, we create indictors for any grades taught, including prekindergarten through adult education. As primary subject information is not available for all teachers, we create an indicator for when subject area is missing. When grade level is missing, we impute the grade bands aligned to the school level.
Data Analysis
To answer our first research question regarding the characteristics of TOY awardees, we compare the subject areas, grades taught, and school characteristics of STOYs and NTOYs with the nationally representative sample of public school teachers in the SASS and NTPS.
To assess the extent to which the schools in which TOY awardees work are representative of schools nationwide—our second research question—we adopt a fixed effects regression analysis. A limitation with the descriptive analysis is that it does not account for the fact that TOY awardees are selected at the state level, making the most appropriate comparison not with schools nationwide but with schools within their state in a given year. Second, across our 32-year panel data set, the demographic characteristics of schools have changed, as have the types of schools (i.e., magnet, charter). As a result, we estimate the following model:

where Yist represents the characteristics of school i in state s in year t (e.g., school level; FRPL rate); TOYist is an indicator or whether or not the school in a given state had a Teacher of the Year awardee in a given year; φs indicates a state fixed effect to account for state-level differences in the characteristics of public schools; γt indicates a year fixed effect to account for secular trends in the characteristics of American schools over time and; eist is an error term. When β1 is significantly greater or smaller than zero, it indicates that the average TOY awardee was selected from a school that was different from other schools, after accounting for fixed state-level differences and historical trends.
To reflect the fact that TOY awardees are selected from a given state in a given year, our preferred model replaces that state and year fixed effects with state-by-year fixed effects to examine within-year differences in school characteristics between the schools of TOY awardees and other schools in the same state. In the sets of both analyses, standard errors are clustered at the level of the fixed effect.
Results
The results in Panel A of Table 1 provide a broad overview of the subject and grades taught by STOY and NTOY awardees. The highest proportion of STOY awardees have been elementary school teachers (25%), which is less than the national percentage of elementary school teachers from the SASS/NTPS (32%). The highest proportion of NTOY awardees have been ELA teachers (30%), which is close to three times greater than the public school teacher workforce. The next highest percentage of NTOY awardees are social studies teachers (23%), which is close to four times greater. For other subject areas there is greater parity—such as arts and music, English as a second language, foreign languages, mathematics and computer science, and career and technical education. Special education and health education areas are underrepresented compared with the broader teacher workforce. In addition, no NTOY awardees have taught foreign languages, health education, or career and technical education.
Characteristics of Teacher of the Year Awardees and Their Schools

Note. Authors’ calculations are from the SASS and NTPS. Estimates are adjusted for SASS/NTPS probability weights. Grade taught represents any grades taught. NTOY = National Teacher of the Year; STOY = state Teacher of the Year; FRPL = free or reduced-price lunch; SASS = Schools and Staffing Survey; NTPS = National Teacher and Principal Survey.
In terms of grades taught, there is the greatest concentration of TOY awardees at the secondary level, particularly among NTOY awardees working in high schools. Roughly half of the NTOY awardees from the 32 years of this study have taught in 9th through 12th grades, compared with only a quarter of public school teachers nationwide.
When comparing the school characteristics of TOY awardees with the average public school teacher, the differences are generally more stark for STOY awardees than for NTOY awardees. For NTOY awardees, the most notable differences are that these teachers work in larger schools with a slightly greater proportion of racial/ethnic minorities and slightly smaller proportion of FRPL students than the average public school teacher’s school. They are also more likely to work in charter and magnet schools. STOY awardees also work in larger schools than the average teacher, but they have much sharper differences in terms of student demographics. For instance, the average teacher in the SASS/NTPS sample works in a school with 39% racial/ethnic minorities compared with 31% for STOY awardees. Their schools also have a smaller share of FRPL-eligible students (43% vs. 33%).
Tables 2 to 4 present our main regression results. For each set of outcomes, we report an unadjusted model, a model with state and year fixed effects, and a model with state-by-year fixed effects—our preferred specification. In this final specification, our results show that TOY awardees worked in schools with an average of 8.4 percentage points fewer FRPL students than other schools in the state in the year they were recognized (column 6). TOY awardees also worked in schools with fewer racial/ethnic minorities, although the magnitude of this relationship was not as large as for FRPL status (−1.7 percentage points, p < .01). In the sensitivity analyses reported in Appendix Table A2, we examine the extent to which the proportion of Black or Hispanic students drives this observed relationship. Only marginally significant evidence is found in terms of the proportion of Black students in a school (−0.8 percentage points, p = .09).
Estimating the Demographics and Size of Teacher of the Year Awardees’s Schools

Note. Standard errors clustered at the level of the fixed effect are in parentheses. FRPL = free or reduced-price lunch.
p < .10. *p < .05. **p < .01. ***p < .001.
Estimating the School Level of Teacher of the Year Awardees

Note. Standard errors clustered at the level of the fixed effect are in parentheses.
p < .10. *p < .05. **p < .01. ***p < .001.
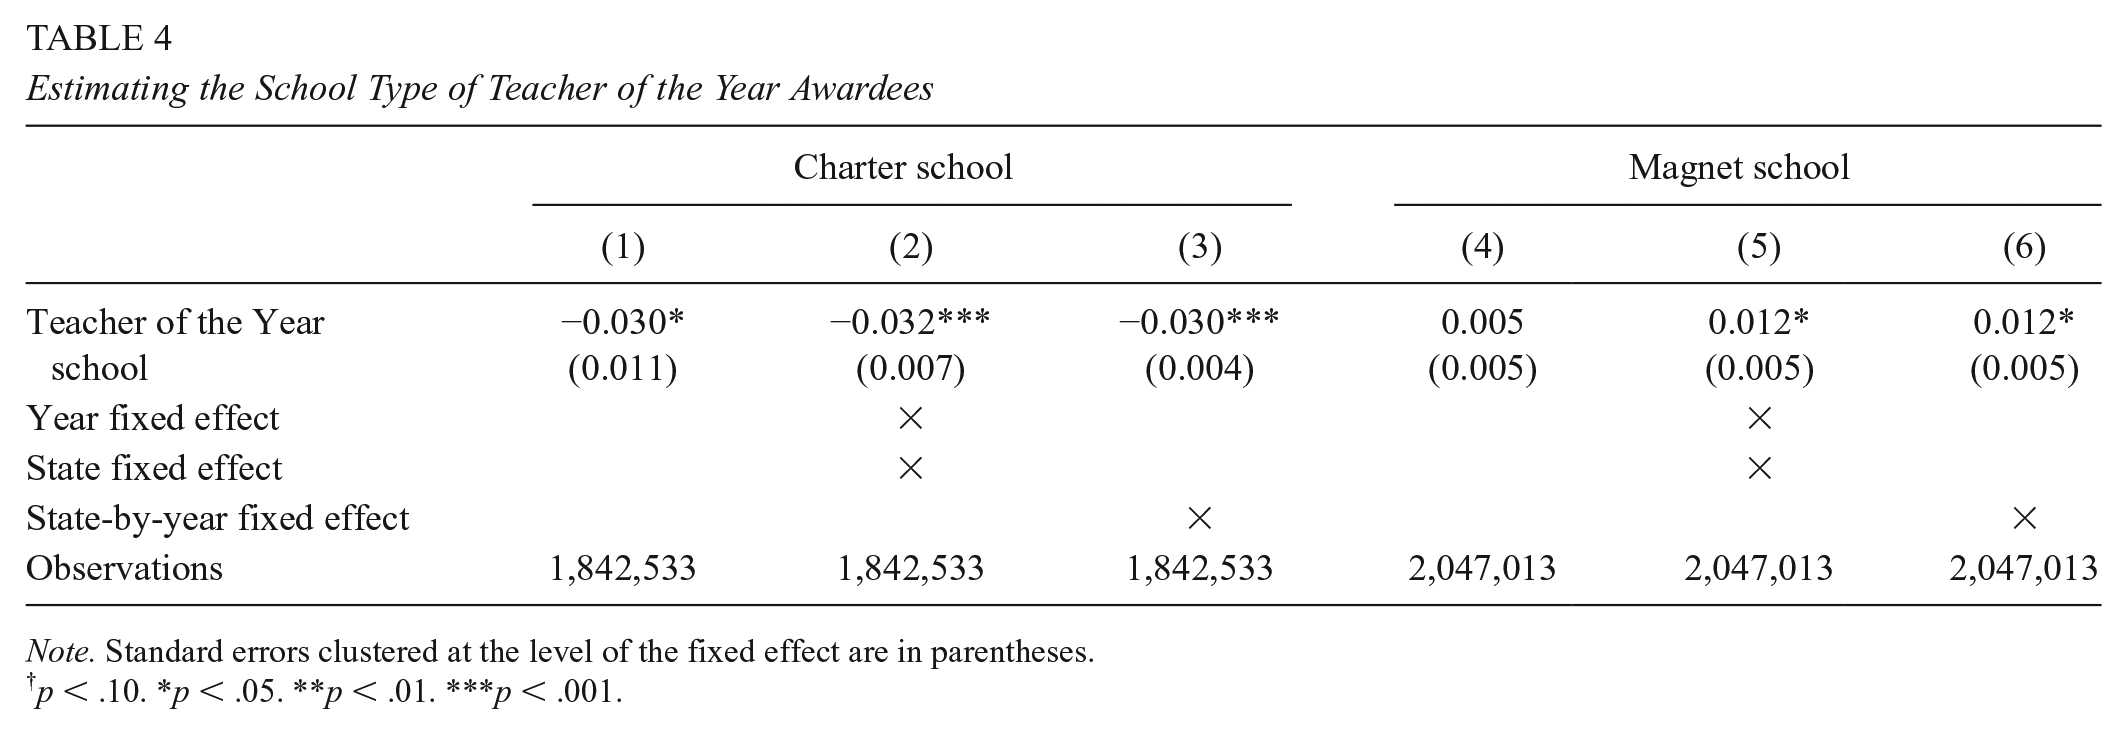
Estimating the School Type of Teacher of the Year Awardees
Note. Standard errors clustered at the level of the fixed effect are in parentheses.
p < .10. *p < .05. **p < .01. ***p < .001.
Figure 1 provides a visual representation of school demographic characteristics, where we report the results from a state fixed effect model with an interaction between TOY status and year to examine the differential time trends in the characteristics of the schools from which TOY awardees were selected. With the exception of 6 years, TOY awardees worked in schools with fewer racial/ethnic minority students than their state’s average. TOY awardees consistently worked in schools that enrolled a smaller share of FRPL-eligible students than other schools in their state.

Predicted probability of school composition for Teachers of the Year (TOY).
The schools in which TOY awardees worked had significantly higher student enrollments: Student enrollments were 118% higher than in other schools in their state in the year they were recognized. 5 To further guide the interpretation of the size of the schools from which TOY awardees were selected, we estimate school size without the log transformation in Table A2. Results from the state-by-year fixed effects model show that the schools in which TOY awardees worked enrolled an average of 415 more students than other schools in the state in the year they were selected. Not surprisingly given the sharp student enrollment discrepancies, the schools from which TOY awardees were selected were predicted to have 21 more teachers (Table A2).
Returning to Table 2, we show that TOY awardees were more likely to work in urban schools compared with other schools in the state in the year they were recognized (0.033, p < .01). Unfortunately, changes in the CCD’s measurement of urbanicity preclude us from identifying the extent to which schools in other locales were less likely to have a TOY awardee.
In terms of school level, TOY awardees are much more likely to be working in a high school and much less likely to be working in an elementary school. TOY awardees were 23 percentage points less likely to be working in an elementary school than in another school level within a state in the year they were recognized. In contrast, TOY awardees were 27 percentage points more likely to be working in a high school than in another school level within a state in the year they were recognized. Figure 2 depicts this relationship, with significant year-to-year variation in the school level of TOY awardees but, consistently, a greater predicted probability of working in a high school and a reduced probability of working in an elementary school.

Predicted probability of school level for Teachers of the Year (TOY).
In terms of school type, TOY awardees had a decreased probability of working in a charter school but an increased probability of working in a magnet school compared with other school types in the state in the year of their award (Table 4). The probability that a TOY awardee’s school is a charter school is 3 percentage points less than for a traditional public school in the state in the year of their award. The probability that a TOY awardee’s school is a magnet school is 1.2 percentage points greater than for a traditional public school in the state in the year of their award.
In our final analysis, we test the extent to which there are differences in the characteristics of the schools from which NTOY and STOY awardees were selected (Table 5).
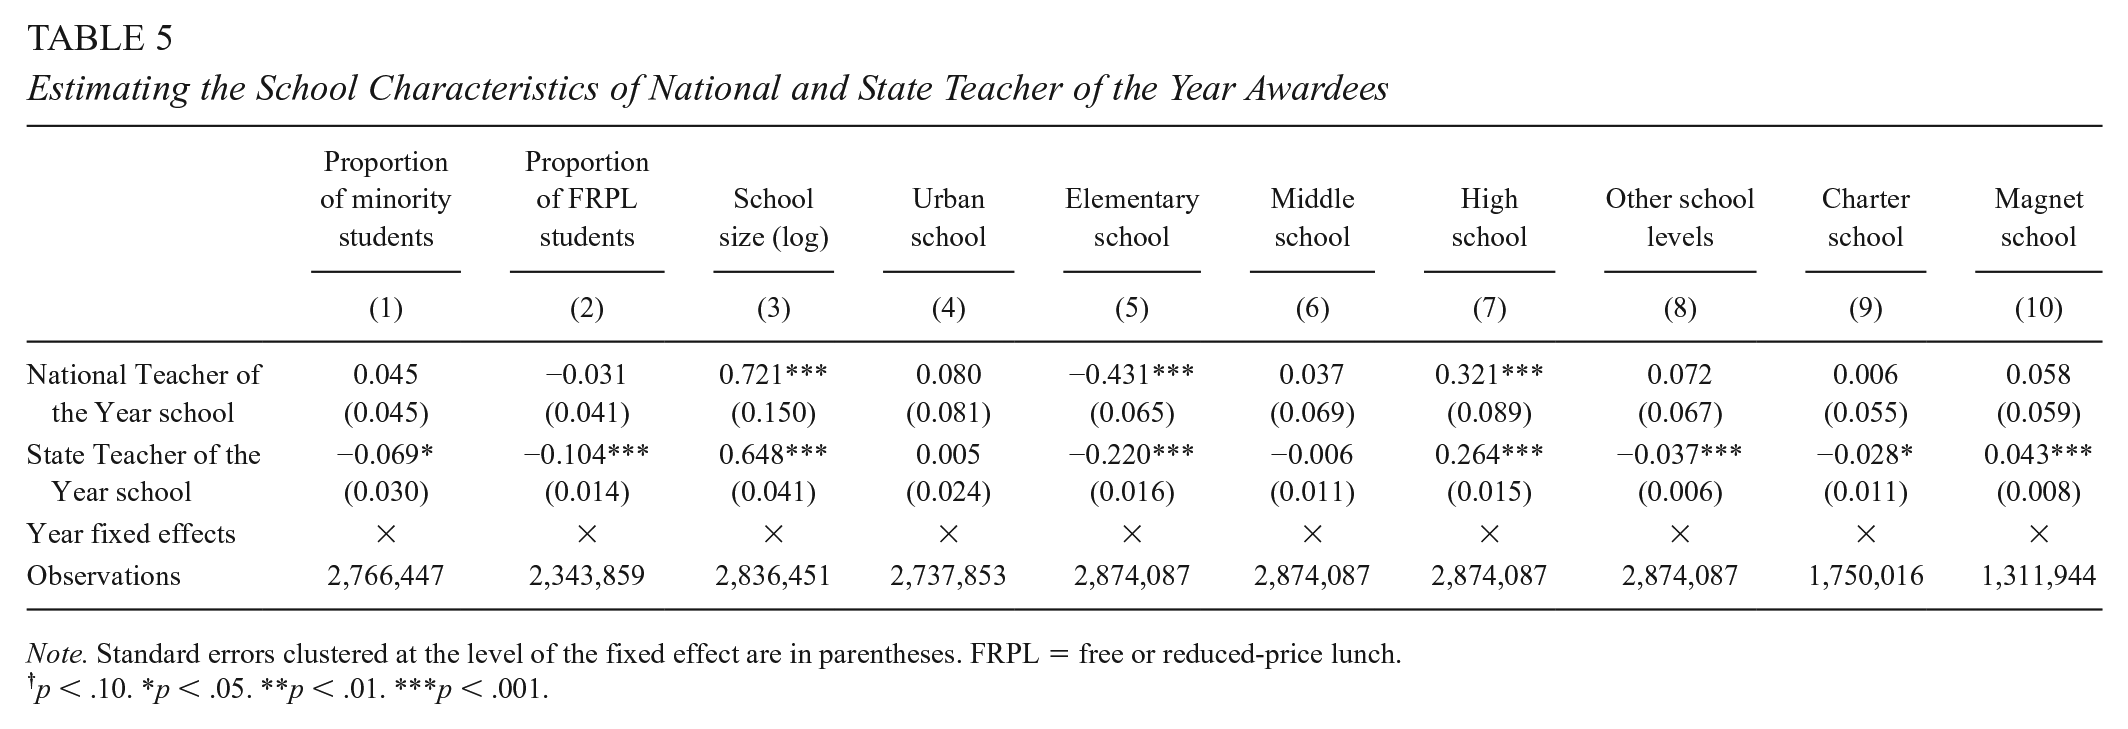
Estimating the School Characteristics of National and State Teacher of the Year Awardees
Note. Standard errors clustered at the level of the fixed effect are in parentheses. FRPL = free or reduced-price lunch.
p < .10. *p < .05. **p < .01. ***p < .001.
Overall, this analysis suggests that there are fewer differences between the schools in which NTOYs worked and other American schools compared with the schools in which STOYs worked. Similar to STOYs, NTOYs had an increased probability of working in high schools enrolling more students, with no significant differences observed for student demographic characteristics or school type. Wald tests indicate that the schools in which NTOY awardees worked had more racial/ethnic minorities (p = .02) and FRPL-eligible students (p = .08) than the schools in which STOY awardees worked. Although Wald tests don’t indicate a difference between STOY and NTOY awardees in terms of charter schools, the lower probability of being selected from a charter school appears to be driven by the state level. In other words, the schools in which NTOY awardees worked were more comparable to the average American school in terms of student composition but not school size or level. Consequently, it is the schools in which STOY awardees work that tend to be less similar to the average American school in terms of racial/ethnic composition, student poverty, school level, and school type.
Discussion
The overarching aim of this study was to characterize the awardees of the longest-standing teacher recognition program in the United States, the TOY program. As arguably the most public representatives of the teaching profession, describing who receives the TOY honor is important given that public images of teachers can inform the values of future generations of teachers and the design of educational policies (Bulkley & Gottlieb, 2017; Schneider & Ingram, 2005). As the NTOY program aims to increase teacher agency in the education policymaking process in a way that few other intermediary organizations do, it also marks an important challenge to a policymaking paradigm whereby teachers are the target of reform rather than its drivers (Cochran-Smith & Lytle, 2006; Hess, 2015; Honig, 2006; Mehta, 2013).
Comparing the subjects and grade levels taught by STOYs and NTOYs with a nationally representative sample from the SASS/NTPS yielded three key findings. First, the subjects that are most underrepresented among TOY awardees include special education and health education. Second, the most overrepresented subjects include ELA, natural sciences, and social sciences, the last of which is particularly prevalent among NTOY awardees. Third, TOY awardees were most likely to teach at the secondary level, with NTOY awardees particularly likely to teach a high school grade. These differences are concerning insofar as they result in teachers in some subject areas and grade levels gaining a platform to advocate for the issues most relevant to them or their students more than other teachers. To the extent to which TOYs operate as value guardians of the teaching profession, there is likely a tension between advocating for issues relevant to all teachers and those that are more pertinent to teachers with their subject- or grade-level expertise.
This issue is most salient for special education teachers. The roles and responsibilities of special education teachers, including their service delivery model, caseload, and paperwork, are often markedly distinct from those of general education teachers (Hagaman & Casey, 2018). The students for whom they are responsible may also have unique academic and developmental needs. As only 3% of STOY awardees taught special education compared with 10% of teachers in the nationally representative sample, the voices of special educators may not be adequately included in the advocacy efforts of TOY awardees. This marked underrepresentation of special educators points to a larger issue in identifying a single representative as ambassador of the teaching profession. Successful teaching is a culturally bounded social activity, rooted in attention and responsiveness to the unique learning needs of one’s students (Villegas & Lucas, 2002). Thus, to advocate for the teaching profession requires simultaneously attending to the universal and the local experience of teaching. This point is perhaps most evident in the case of Rodney Robinson, the 2019 NTOY. As a Black teacher in a juvenile detention center, he not only promoted the central role of culturally relevant instruction in his own pedagogy but also spoke out on broader set of issues, including the school-to-prison pipeline, restorative justice, student mental health, teacher diversity, and equitable school funding (Walker, 2019).
Our analysis is also motivated by the ways in which the inherent gatekeeping function of a recognition program can elevate teachers from certain schools more than others. As teachers’ jobs are informed by features of the school environment—school size, school level, student demographics, locale, and school type—ensuring that the schools from which TOY awardees are selected are broadly representative of American public schools is important given their association with teachers’ values and policy priorities. The extent to which teachers from certain types of schools are recognized more commonly might shape the policy issues these teachers focus on when given the opportunity to advocate for the teaching profession.
On this point, our results show clear differences between the characteristics of the schools from which TOY awardees were selected and those of other schools in their state, suggesting a gatekeeping role of the TOY program. TOY awardees worked in larger schools with a smaller proportion of FRPL-eligible students and racial/ethnic minorities. Their schools were also more likely to be high schools and magnet schools and less likely to be a charter school. In some instances, these differences were quite large in magnitude. The schools from which TOY awardees were selected had an average of 8.4 percentage points fewer FRPL-eligible students than other schools in the state in that year, reflecting three-tenths of a standard deviation. TOY awardees’ schools were also much larger than other schools in the state—415 students, or nearly one full standard deviation. TOY awardees were much more likely to work in a high school than another school level. Whereas 20% of schools across our sample were high schools, 46% of TOY awardees worked in a high school. There were also large discrepancies in terms of charter and magnet schools. With only 2.6% of schools classified as magnet schools, TOY awardees were more than 1.2 percentage points more likely to work in a magnet school than in a nonmagnet school in their state. In contrast, although an average of 5.4% of public schools were charters, TOY awardees were more than 3 percentage points less likely to work in a charter school than in a traditional public school.
While these descriptive and regression results show clear differences in the types of schools from which TOY awardees were selected compared with other schools, the reasons for these differences are less clear. For instance, high school teachers are clearly overrepresented among TOY awardees. Yet this pattern could arise for a couple of different reasons. It might result from the fact that standout teachers in large schools are highly talented since they were nominated from a much larger set of teachers. The overrepresentation of secondary schools is, in part, a statistical artifact of the analytic approach adopted in this article. Although high schools constitute roughly 20% of schools nationwide, student enrollments account for 30% of all K–12 public school students (Snyder et al., 2018). As a result, we would expect secondary schools to be somewhat overrepresented at the school level but perhaps not to the degree observed in this analysis.
Most concerning from our analysis is the extent to which schools enrolling a greater proportion of racial/ethnic minorities and students living in poverty have been underrepresented among TOY awardees, particularly STOYs. Again, it is unclear to what extent this pattern results from teacher labor market sorting or features of the TOY selection process that favor teachers from more affluent schools. For instance, teachers in higher-poverty schools may deprioritize what is seen as a largely symbolic gesture when they are faced with more immediate challenges and deep time constraints. Alternatively, implicit biases among selection committee members or the reliance on application materials that privilege certain forms of expertise (e.g., reflective essays as opposed to videos of classroom instruction) could result in some teachers being overlooked as a TOY. Regardless of the cause, as the student bodies of American public schools continue to diversify, having teachers that can speak to this diversity is critical as a way for the public to understand the shifting nature of teachers’ work in response to these larger demographic changes.
Evidence of this gatekeeping function must also be balanced against benefits to participants in the TOY program. TOYs undoubtedly gain access to social capital unavailable to most teachers, which forms the basis of their advocacy efforts. Yet programs such as Teach Plus, Educators for Excellence, or federal fellowship programs may also promote teacher leadership development and build teacher social capital while maintaining more accessibility than the TOY program. A better understanding of this interplay between gatekeeping and social capital development is critical to understanding how best to promote teacher advocacy efforts. Models of school-based teacher leadership development suggest that the most important way to develop teacher leaders is to identify teachers with an initial capacity for leadership and provide them with development activities and experiences (Smylie & Eckert, 2018). It is likely that this school-based model is appropriate for describing the development of teachers as advocates for their profession, although attention must also be paid to how leadership development experiences facilitate access to policymaking networks at the local, state, or national level.
Finally, while we are generally unable to speak to the mechanisms driving the relationships observed in this article, separating the results for STOYs and NTOYs shows larger discrepancies between the schools in which STOYs work and schools nationwide, particularly in terms of racial/ethnic composition, student poverty, and school type. To this point, it is important to emphasize that the decision of who will be the NTOYs is, in large part, defined by the choice set of STOYs. That is, regardless of efforts to ensure that the national selection process is fair, the decision is constrained by the varied approaches that states have to identifying their STOY (e.g., whether states employ a multitiered or direct nomination approach; application materials used within a state). As we discuss in greater detail in the next section, this finding points to the need to better understand the state-level selection process by which TOY awardees are identified.
Limitations and Future Research
The chief limitation of this study is our inability to speak to the mechanisms driving the observed differences in the characteristics of the schools in which TOY awardees work compared with other schools in the state. In the previous section, explanations for some of our key findings, but ultimately, qualitative research examining the state-level selection processes would be required to describe the local dynamics shaping which teachers are ultimately selected for this honor within schools, districts, and states across the country.
Our study is also limited by the use of publicly available information on the TOY awardees. Although TOY awardees have been selected each year since 1952, NTOY and STOY awardee data are more complete for later decades, with data for approximately 8% of possible awardees in the 1950s, 39% in the 1960s, 69% in the 1970s, and 81% for 1980–1987, leading us to limit the current study to the period from 1988 to 2019. Data on subject or specific grade level were also not available for all teachers. In addition, while subject area and grade level are important characteristics of teachers and their work, the profile and representativeness of TOY awardees in terms of teaching experience, age, educational background, racial/ethnic identity, and gender are also important to consider.
Using the CCD for longitudinal data analysis also has its limitations. For instance, CCD expanded classifications over time to include school classifications for magnets and charters starting in 1999 and student classifications for Hawaiian/Pacific Islander and two or more races starting in 2009. Beginning in 2005, the CCD also changed its categorization of school locale. The use of school-by-year fixed effects as our preferred estimation strategy generally precludes these concerns, although they are still important to note.
Finally, our description of the characteristics of TOY awardees and their schools marks an important first step in characterizing the TOY program. Future research could study the experiences of TOY awardees to understand the issues for which they advocate and the extent to which they feel they are successful in this endeavor. For instance, we make the assumption in this article that the issues in which TOY awardees engage are connected to their subject area, grade level, and school characteristics. While a teacher’s school context is likely impactful for the issues they advocate, teachers’ individual backgrounds and values may prove more important. Future studies could extend our work to consider the specific issues TOY awardees advocate for, whether related to the teaching profession, their students, or education policy more broadly. As the TOY program clearly offers a public platform for a select group of teachers, it is important to understand the extent to which TOY awardees are able to effectively advocate for and drive educational reform.
Footnotes
Appendix
Estimating the School Characteristics of Teacher of the Year Awardees, Sensitivity Analysis

| Proportion of Black students |
Proportion of Hispanic students |
School size |
FTE teachers | |||||||||
|---|---|---|---|---|---|---|---|---|---|---|---|---|
| (1) | (2) | (3) | (4) | (5) | (6) | (7) | (8) | (9) | (10) | (11) | (12) | |
| Teacher of the Year school | −0.009 (0.017) | −0.010 (0.006) | −0.008 † (0.004) | −0.070* (0.028) | −0.003 (0.005) | −0.002 (0.004) | 363.493*** (29.417) | 410.456*** (25.374) | 414.955*** (15.497) | 17.531*** (1.582) | 19.396*** (1.507) | 21.373*** (0.902) |
| Year fixed effect | × | × | × | × | ||||||||
| State fixed effect | × | × | × | × | ||||||||
| State-by-year fixed effect | × | × | × | × | ||||||||
| Observations | 2,862,586 | 2,862,586 | 2,862,586 | 2,862,859 | 2,862,859 | 2,862,859 | 2,933,044 | 2,933,044 | 2,933,044 | 2,812,878 | 2,812,878 | 2,812,878 |
Note. Standard errors clustered at the level of the fixed effect are in parentheses. FTE = full-time equivalent.
p < .10. *p < .05. **p < .01. ***p < .001.
1.
While the overall match rate was 98%, only 94% of NTOYs were matched to schools. One of the NTOYs worked in a private school, while the other worked for a nonprofit organization affiliated with the district.
2.
A limitation of drawing on repeated waves of the SASS/NTPS is that the response categories have changed over time. Fortunately, for the broad subject area and grade-level variables we use, the changes are minimal. The main changes relate to subject areas, which were constant from 2004 to 2016 but had fewer subject matter–specific response categories in the two earlier surveys. For instance, in 1994, there were only two subjects related to social sciences: social studies/social sciences (including history) and American Indian/Native American studies. Beginning in 2004, there are nine categories attached to social sciences: social studies, anthropology, economics, geography, government or civics, history, Native American studies, psychology, and sociology.
3.
CCD’s measurement of school locale has changed over time. Beginning in 2006, CCD expanded locale from 9 categories to 12 categories. We defined urban schools as large city or midsize city, which was consistent across categorizations, although the other categories changed, resulting in some discrepancy over time in this measure.
4.
Data designating schools as magnet or charter schools are only available from 1999.
5.
The interpretation of this estimate is obtained from the following equation: 100 × (exp(βˆ(TOY)-1)).
Authors
CHRISTOPHER REDDING is an assistant professor in the School of Human Development and Organizational Studies in Education, College of Education, at the University of Florida. His research focuses on teacher labor markets, school improvement, and educational equity.
TED MYERS is a doctoral student in the School of Human Development and Organizational Studies in Education, College of Education, University of Florida. His research focuses on education research methodology and teacher professional learning.