
Abstract
Despite significant interest in Career and Technical Education (CTE), little is known about CTE teachers. Using ten years of Maryland administrative data, we find that almost one-fifth of CTE teachers enter the profession with a high school diploma or associate’s degree, reflecting state policies allowing trade/industry professional experience to substitute for higher degrees. Relatedly, CTE teachers are roughly twice as likely as non-CTE teachers to enter through alternative licensure pathways that bypass traditional teacher education (68% vs. 36%). In Maryland, there is a larger share of Black teachers in versus out of CTE (37% vs. 22%), leading to greater race matching opportunities for Black students. This pattern extends across nine out of the eleven total CTE career clusters. We hypothesize that these patterns are related: decreased barriers to entry may support more Black individuals to become CTE teachers, with potential implications for their Black students’ career success.
Keywords
Introduction
Pathways into the teaching profession for Career and Technical Education (CTE) teachers are described by scholars as the “wild west” because licensure policies can differ fairly substantially from non-CTE teachers (Goldhaber & Theobald, 2024), there is wide variability across states in CTE teacher licensure policies (Bonsu et al., 2013; Kelley et al., 2023; C. J. Zirkle et al., 2007), and very little academic scholarship exists regarding how policy translates into practice (Anglum et al., 2023). This gap in the literature is concerning not only because of demand for CTE courses nationwide (Theobald et al., 2022) but also because the limited evidence that does exist suggests that CTE teachers’ training and pathways into the profession matter substantially for supporting students’ short- and longer-term academic and career success (Chen et al., 2023; Theobald et al., 2024). Following a call by Sims (2010) and recent exploratory analyses (Gottfried et al., 2025), we further examine the racial/ethnic characteristics of CTE teachers, with a particular focus on Black teachers, given our geographic context in the mid-Atlantic region in the U.S. This exploration aligns with broader literatures on the importance of having a diverse teacher workforce (Bristol & Martin-Fernandez, 2019) and supporting students across racial/ethnic groups to access CTE courses and pathways linked to in-demand, high-paying jobs (Ecton & Dougherty, 2023).
Using 10 years (2013 to 2023) of statewide, administrative data from Maryland’s public-school system, we extend the handful of prior studies on CTE teachers (Gottfried et al., 2025; Kistler et al., 2024; Nguyen et al., 2023; Theobald et al., 2024) by asking three questions: (1) What trends in CTE course enrollment exist over the past decade—overall and in specific CTE clusters, as well as by race/ethnicity? (2) How has the makeup of the CTE teacher population changed, as evidenced by characteristics (e.g., endorsement area, license, highest degree, race/ethnicity) of CTE versus non-CTE teachers? (3) To what extent do opportunities for teacher-student race/ethnicity matching differ between CTE and non-CTE high school courses? The first question sets the context for our primary research questions focused on teacher characteristics and opportunities for students to work with a teacher of the same race/ethnicity.
More specifically, we start by showing that CTE course enrollments have risen over the past decade for all students, with similar trends for Black and White students who comprise roughly three-quarters of the high school student population in Maryland public schools. The largest share of enrollments are in CTE clusters focused on business, information technology, and human resource services (e.g., training in early childhood and K–12 education), with the largest increases over time in technology fields.
Next, by examining incoming degrees and licenses of CTE and non-CTE teachers, we find novel and varied pathways into the profession. CTE teachers are substantially more likely than non-CTE teachers to enter the profession with a high school diploma or associate’s degree (19% versus zero). Similarly, among teachers for whom we can observe their first year in the classroom, CTE teachers are more likely to enter with a “conditional” or “resident teacher” license that allows them to work full time while completing requirements for full licensure (68% versus 36% for non-CTE teachers). Following other scholarship on CTE teachers (Bonsu et al., 2013; Jacques & Potemski, 2014; C. Zirkle et al., 2019)—and on teacher licenses more broadly (Walsh & Jacobs, 2007)—we categorize conditional and resident teacher licenses as “alternative” pathways because they bypass traditional (often undergraduate) teacher education.
Disaggregating patterns into specific CTE certification endorsement areas, we find that Professional and Technical Education (PTE) drives much of the overall trend. In Maryland, this endorsement area is distinct because it allows individuals to substitute professional experience in a variety of trades and industries (common ones include nursing, culinary arts, cosmetology, automative technician, law enforcement, construction, information technology, accounting) for higher degrees. Similar policies and pathways exist in other states too (Bonsu et al., 2013; Kelley et al., 2023). Pooling data over a decade, we observe that 40% of newly licensed CTE teachers in Maryland have a PTE endorsement, and over 90% of these PTE-endorsed teachers enter the profession through an alternative pathway. Alternative certification rates are over 50% in several other CTE endorsement areas, including Business Education (66%), Family and Consumer Sciences (63%), and Technology Education (59%), as well as Computer Science (81%) which, in Maryland, straddles CTE and non-CTE high school curricula. Time trends over a decade reveal that licensing through an alternative pathway has become increasingly common for all newly hired Maryland high school teachers (from 18% in 2013 to 46% in 2023) and especially for newly hired CTE teachers (from 57% in 2013 to 86% in 2023). Together, this evidence aligns with policy goals that aim to provide unique avenues for CTE teachers to enter the profession.
We next examine racial/ethnic characteristics of CTE teachers, compared to broader pools of high school teachers, and whether demographic patterns may be related to patterns on teacher degrees and licenses. Despite longstanding exploration of the racial/ethnic background of students in CTE programs and pathways (e.g., Ecton & Dougherty, 2023; Oakes, 1983), attention to teacher race/ethnicity in CTE is far more limited. Questions we explore in this paper related to teacher and student race/ethnicity stems largely from recent exploratory work by an overlapping set of authors (Gottfried et al., 2025) showing a larger share of Black teachers in STEM-specific CTE courses in Maryland, relative to high school courses more broadly. However, other state contexts show different patterns (Theobald et al., 2024). We argue that extending this line of inquiry is important given longstanding and growing evidence of the impact that same-race/ethnicity teachers have on the short- and long-run academic and school-based outcomes of their students (Blazar, 2024; Bristol & Martin-Fernandez, 2019; Dee, 2004; Gershenson et al., 2022), as well as on students’ career choices (Kofoed & McGovney, 2019). Jacques and Potemski (2014) describe certification and licensure policies that allow for high school equivalence and work experience—including Maryland’s PTE endorsement area—to present “low potential for recruitment challenges” (p. 12). This description is similar to other scholarship on pathways into teaching for Black and non-Black individuals of color, which argues that policies that decrease barriers to entry (e.g., limiting the financial cost, opportunity cost, and time it takes to gain a teaching credential and license) are “promising practices” for diversifying the profession (Carver-Thomas, 2018; Gist & Bristol, 2022).
Our analyses on teacher race/ethnicity and opportunities for teacher-student race/ethnicity matching focus primarily on Black individuals, who make up roughly 18% of high school teachers (compared to 72% white teachers) and roughly 35% of high school students in the state (compared to 38% white students). In several analyses, we focus on teachers we observe entering the CTE teaching profession for the first time, which includes sizable numbers of Black (n = 481) and white (n = 688) new hires over a decade, but fewer than 50 Asian and 50 Hispanic newly hired CTE teachers over the same period. Therefore, we are not able to draw strong inferences about these groups of Asian and Hispanic teachers, particularly when further decomposing the sample to examine endorsement areas, licenses, and degrees of these first-time CTE teachers.
Consistent with theory described above about addressing barriers to entry into teaching for Black and non-Black individuals of color, we document several key findings. There is a larger share of Black teachers in CTE in Maryland compared to other high school teachers (37% versus 22%). Black CTE teachers make up an even larger share of individuals with a PTE endorsement (40%), where barriers to entry may be particularly low. Aligned to these patterns, roughly one-fifth of Black CTE teachers enter the profession with a high school diploma or associate’s degree, which is a distinct option and pathway available to the PTE endorsement. On average across time, schools, and districts, white CTE teachers have similar rates of entry as Black CTE teachers with a high school diploma or associate’s degree. However, we observe a statistically significant difference—with a 5 percentage point [pp] increase for Black versus white teachers—when making within-school comparisons, likely reflecting, in part, the availability of specific CTE programs of study and courses within certain schools. Furthermore, while white teachers see the largest difference in rates of alternative certification between CTE and non-CTE (38 pp), Black CTE teachers have the largest absolute rates of alternative certification (83%, compared to 61% for Black non-CTE high school teachers and 65% for white CTE teachers).
CTE courses cover a wide variety of topics and may prepare individuals to enter careers with different earning potential. Therefore, we further decompose these analyses to examine the racial/ethnic characteristics of teachers and students and race/ethnicity-matching for each of 11 career clusters. Combining descriptive statistics with regression analyses that include a variety of controls (e.g., year, district, school, and student fixed effects) to account for potential confounders (e.g., which districts or schools offer specific CTE clusters, and which students enroll in them), we find that, compared to non-CTE courses, Black students are more likely to have a Black teacher in courses within nine clusters. The largest differences are in Business Management and Finance (22 pp), Information Technology (18 pp), Consumer Services, Hospitality, and Tourism (17 pp), Career Research and Development (16 pp), and Health and Biosciences (12 pp).
Together, our descriptive analyses provide insight into the characteristics of CTE teachers and their pathways into the profession, the importance of integrating race/ethnicity in discussion of CTE teacher licensure and recruitment, and the potential impact that Black CTE teachers may have on the future career opportunities of Black students due to race matching in high-demand and high-pay CTE career clusters.
Motivating Literature
The Evolving Role of CTE in U.S. High Schools
Over the past 20 years, significant policy attention (e.g., Carl D. Perkins Act of 2006) to CTE pathways and courses as a mechanism for boosting college enrollment and career outcomes has led to growing scholarship on this topic (Dougherty, 2023). While the literature base is new and evolving, studies document several key findings. CTE programs today are “not your father’s vocational education” (Zinth, 2013), meaning that the target audience has developed to include both college-aspiring students and high school graduates entering the workforce. Nationally, CTE course enrollments have held steady over several decades—while decreasing for some student groups in the early 2000s—suggesting that some of the negative stigma about career training (Kreisman & Stange, 2020) has not fully disappeared. However, enrollments have increased in STEM fields (e.g., information technology, health) where there is significant workforce demand and opportunity for high-wage jobs (Theobald et al., 2022), a trend we show below in Maryland as well.
Further, well-designed quantitative, causal studies document meaningful and often substantial impacts for students on both margins: college-aspiring and not (for a review, see Dougherty, 2023). For example, Brunner et al. (2023) show that attending a CTE high school boosts male students’ high school graduation and average quarterly earnings, with most of the effects attributed to students who transitioned to the workforce within one or two years after high school. In Maryland, the context of this study, access to a CTE program aimed at preparing future teachers increases high school graduation and four-year college-going among females, with substantial wage effects for Black females (Blazar, Gao, et al., 2024).
Characteristics of CTE Teachers
Positive impacts on students naturally raise questions about mechanisms and increase attention on CTE teachers. Like broader scholarship on the importance of teachers to student outcomes (Hanushek & Rivkin, 2010; Jackson, 2018), the characteristics and experiences of CTE teachers matter too. Chen et al. (2023) show that, in Massachusetts, CTE teachers who earn higher scores on subject-specific licensure tests produce higher longer-run earnings for their students, echoing other scholarship linking non-CTE teachers’ subject knowledge to student outcomes (Metzler & Woessmann, 2012). In Washington state, CTE teachers who enter the profession through the state’s Business and Industry pathway—rather than a traditional, university-based certification program—outperform their colleagues in terms of contributions to students’ non-tested outcomes (e.g., absences, suspensions). This finding suggests that work experience of CTE teachers may be more important for improving some student outcomes than knowledge gained in a traditional teacher education program. Relatedly, Kistler et al. (2024) show that teachers in hard-to-staff CTE areas, such as health science, information technology, and STEM, are more likely than their colleagues to leave teaching and are difficult to replace, leading to gaps in demand for seats in courses and supply of eligible teachers to teach these courses.
Though limited, this evidence provides some empirical justification for CTE-specific teacher licensure policies that can differ substantially from policies for non-CTE teachers. Some scholars describe the “traditional” teacher licensure process as a method of matching course titles on a transcript to a list of state-approved courses, failing to consider that the knowledge and skills needed to actually teach a course could be obtained non-academically including through workplace experience (Walsh, 2001). Historically, work experience was the main factor in CTE certifications due to a stipulation in the Smith-Hughes Act of 1917 that only personnel with practical work experience could teach in federally reimbursed programs (Miller, 1982). Unsurprisingly, in 1994, more than 45% of secondary trade and industrial education teachers did not have bachelor’s degrees (Lynch, 1996). For non-CTE teachers, “alternative” certification pathways still require bachelor’s degrees, just not in teacher education, and hands-on work experience comes from teaching full time while pursuing necessary requirements for full licensure (e.g., coursework, testing) (Walsh & Jacobs, 2007).
Today, almost every state allows the alternative credentialing of CTE teachers, primarily choosing to substitute years of occupational experience for higher levels of formal education (Bonsu et al., 2013). Policy tracking from Education Commission of the States identifies five categories of requirements to become a CTE teacher today (Kelley et al., 2023): 48 states place an emphasis on work experience, including specified hours/years of relevant experience; 45 states have degree requirements, though not always at or above the bachelor’s level (as traditional teacher education programs do); 41 states require teacher or CTE training, including completion of professional development or other pedagogical training; 26 states seek certification, including industry-recognized licenses; and 17 states require assessments, including completion of testing in CTE subject matter or content area expertise. By emphasizing subject-matter expertise through accumulated experience and decreasing emphasis on specific types of education, CTE pathways align with some scholars’ concerns that would-be qualified teachers are deterred from the career path due to the very restrictions that are in place, particularly around testing (Goldhaber & Hansen, 2010; Petchauer & Baker-Doyle, 2019).
In Maryland, state CTE licensure policies are on the lower end of restrictiveness (Jacques & Potemski, 2014). While teacher licenses in Maryland generally require a completed bachelor’s degree and passing scores on an accepted standardized exam such as the Praxis I, there is variation in the amount of prior professional experience with which candidates enter. However, the PTE endorsement area within CTE is the exception to this rule. Prospective teacher candidates can enter with an associate’s degree and two years of previous occupational experience in the career area to be taught, or with a high school diploma (or equivalent) and official verification of three years of occupational experience (13A CMR § 12.02.15). Unsurprisingly, then, we show below that a PTE endorsement often is associated with an alternative pathway into the profession that bypasses traditional teacher education. Below, we also map the PTE endorsement at the teacher level to different career cluster options for students.
There are two types of alternative licenses in Maryland: conditional and resident teacher. Both allow individuals to work full-time for at least two years while completing additional requirements for full licensure. The key distinction between the two pathways is that resident teacher licenses are associated with state-approved alternative preparation programs (e.g., Teach for America), while conditional licenses generally are not associated with a program. Districts hire conditionally licensed teachers, who then must find a pathway to complete required coursework and tests prior to advancing to full licensure. In Maryland, conditional licenses are quite common, while resident teacher licenses are less common.
Filling Gaps in the Literature
Within this literature base, we aim to make two contributions. First, despite documentation on the varied ways that CTE teachers can enter the profession, we know very little about how these policies play out in practice. Theobald et al. (2024) document patterns in Washington state, where roughly 25% of CTE teachers enter with a bachelor’s degree and roughly 15% without any postsecondary degree. Depending on the grade level, 40–50% of CTE teachers enter through the states’ Business and Industry pathway, which is similar in spirit to Maryland’s PTE endorsement area. These teachers also are less likely to enter with a college degree compared to traditionally licensed CTE teachers (roughly 64% versus 95%). Nguyen et al. (2023) also examine characteristics of CTE teachers, with the benefit of national data, but focus on broad categories (e.g., graduate degree, CTE qualification) that do not align entirely with details from policy tracking. Assessing the state of the CTE teacher literature as a whole, Anglum et al. (2023) argue that “our understanding of the current workforce and training needs of CTE teachers is insufficient to inform necessary action. Failing to build our collective knowledge could undermine the overarching objectives of the CTE movement—to ensure students are sufficiently prepared to meet their own future workforce needs” (p. 21). Our study aims to address this concern, with detailed descriptive analyses on Maryland CTE teachers and how they compare to non-CTE high school teachers.
Second, as discussion on CTE teachers grows, we argue that one piece of the story is largely missing: race/ethnicity. Sims (2010) makes a similar argument in a short commentary, but without companion empirical analyses. In the broader literature on teachers, alternative pathways and certification processes are described among the “promising practices” for diversifying the teacher workforce (Carver-Thomas, 2018; Gist & Bristol, 2022), and may be important for prospective Black and non-Black teachers of color for several reasons. Many first-generation Black and non-Black college students of color face acute economic challenges that make it unfeasible to major in teaching, which requires up-front capital (Harper & Griffin, 2010). Traditional licensure and testing processes also are shown to be a deterrent for Black and other teacher candidates of color who may otherwise be successful in the classroom (Goldhaber & Hansen, 2010; Petchauer & Baker-Doyle, 2019), not to mention broader systemic racial biases and barriers in traditional teacher education programs (Chávez-Moreno et al., 2022). Conversely, alternative routes to teacher certification and licensure can provide reentry points to the pathway from K–12 to college and career, fast-track licensure earning time, and, thus, more readily support Black and non-Black individuals of color to balance employment with course obligations and other opportunity costs of teacher education programs (Bergey et al., 2019; Dinkins & Thomas, 2016). Indeed, descriptive analyses show that in Maryland (Blazar, Anthenelli, et al., 2024), Massachusetts (Bacher-Hicks et al., 2023), and Washington state (Backes & Goldhaber, 2023), there is substantially more diversity in recruitment pathways where barriers to entry are low.
While the literature on decreasing barriers to entry for prospective Black and non-Black teachers of color generally has focused on teaching as a whole, there are some hints in existing scholarship that CTE licensure and certification pathways may be particularly fertile ground. Theobald et al. (2024) show that Black individuals comprise a larger share of CTE teachers certified in the Business and Industry pathway compared to traditional teacher education programs (1.9% versus 0.7%), though the share of Black teachers in Washington state as a whole and in their CTE program is quite low. In Maryland, the share of Black teachers overall is much higher (18% in public high schools), and Gottfried et al. (2025) show that there is a larger share of Black individuals who teach in STEM-focused CTE areas (23% to 30%, depending on teachers’ course load and specific CTE subject area). However, this study does not examine the entering pathways, licenses, and degrees of teachers and how these differed by CTE status and race/ethnicity. Our study builds on this work to examine characteristics of CTE teachers, how these differ from non-CTE teachers, and how they also vary across race/ethnicity groups.
Data and Methods
Our analyses draw on statewide, administrative public-school data from Maryland, which we access through the Maryland Longitudinal Data System (MLDS) Center. The data system includes records for all teachers and students in Maryland beginning in the 2008–2009 school year. We limit the broader population data by first focusing on high schools, the context in which CTE courses are offered. To define CTE teachers, we leverage course roster data, which is available statewide starting in 2012–2013. We include data through the 2022–2023 school year, which (at the time of writing) is the most recent year of available data to link teachers to course records and to students. 1
We define CTE teachers as those whose course load in any given year is at least 50% CTE. 2 In the data, courses are flagged by the State Department of Education as associated with one of the 11 career clusters, and we count all of these within our definition of CTE courses. The career clusters include: (1) Arts, Media, and Communications; (2) Business Management and Finance; (3) Career Research and Development; (4) Construction and Development; (5) Consumer Services, Hospitality, and Tourism; (6) Environmental, Agriculture, and Natural Resources; (7) Health and Biosciences; (8) Human Resource Services; (9) Information Technology; (10) Manufacturing, Engineering, and Technology; and (11) Transportation Technologies. Our approach is similar to Nguyen et al. (2023), who identify CTE teachers as those whose main teaching assignments include classes in a federally defined CTE career cluster (which are similar to Maryland’s). We also narrow the group of CTE teachers to those who have a specific “teacher” code in human resources data. Although a small subset (6%) of non-teachers (e.g., school counselors, administrators) teach CTE courses, this restriction ensures that we have consistent information about entering pathways and licenses, which differ between teachers and other school-based staff.
In our analytic sample, we start with the full population of Maryland high school students (n = 3,123,738 student-years) and their teachers from 2012–2013 through 2022–2023. When examining characteristics of CTE teachers, we are primarily interested in new teachers who enter the profession sometime between the 2013 and 2023 school year (n = 11,031 unique high school teachers and 1,302 unique CTE teachers), for whom we can observe CTE teaching status at time of entry as well as their entering certification endorsement area, license, and degree. In some analyses focused on race/ethnicity—which we have for all teachers—we also make comparisons between all high school teachers (n = 180,318 teacher-years and 34,716 unique teachers) and all CTE teachers (n = 17,724 teacher-years and 4,390 unique CTE teachers).
Our analyses are descriptive. Following the research questions described in the Introduction, the first set of analyses examine trends in enrollment for CTE courses—overall and in specific career clusters—among high school students and evolution over a decade, as well as variation by race/ethnicity. Next, we turn our attention to the primary purpose of our analyses: the population of CTE teachers. We start by examining characteristics (e.g., endorsement area, license, degree, race/ethnicity) of CTE teachers for whom we can observe their first year in the classroom. We examine trends over time and pooled across a decade of data.
We extend these analyses to examine differences between CTE and non-CTE, supplementing basic summary statistics with regression analyses that control for factors that may serve as confounders. For example:

Here,
Finally, we examine opportunities for student-teacher race/ethnicity matching in/out of CTE, overall and by career cluster, applying the same sensitivity tests as with the teacher-level analyses. To do so, we restrict the sample by student race/ethnicity, focusing most prominently on Black students, and adapt the equation above so that the dependent variable is an indicator for whether the teacher is the same race/ethnicity as the student. Here,
Results
Student Enrollment in CTE Courses Over Time
In Figure 1, we show trends in CTE course enrollments over a decade. In the top panel, we show the proportion of all public-school students enrolled in any CTE course over their high school career, disaggregated by race/ethnicity. For all groups, the share of students taking a CTE course has increased over time, from 40% in the 2012–2013 school year to 53% in 2022–2023. The slight decline in 2016 largely reflects shifts in the state’s course management system, with a slight reclassification to CTE courses in that year. Enrollments are similar between Black and white students, slightly higher for Asian students in the most recent years, and roughly 10 pp lower for Hispanic students.
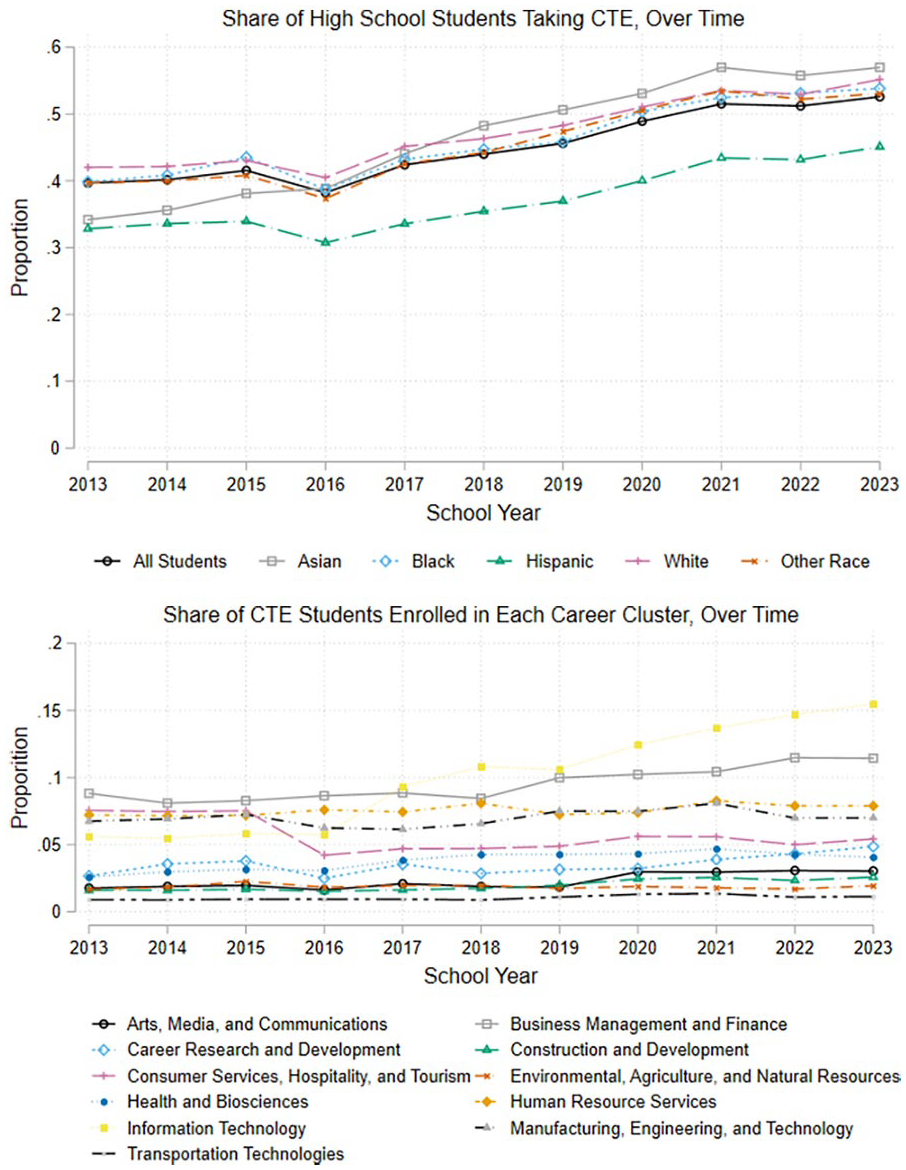
Student Enrollment in CTE, Over Time and by Career Cluster.
In the bottom panel of Figure 1, we examine the share of CTE enrollments within each of the 11 career clusters in the state. We observe the largest increase over time for the Information Technology cluster, with just over 15% of CTE takers enrolled in a course in this cluster in the 2022–2023 school year. In 2017, Information Technology surpassed Business Management and Finance, which, before that, accounted for the largest share of enrollments (roughly 9%). Enrollments in this cluster also have increased over time (to roughly 11% in 2013). Human Resource Services (which primarily includes training in early childhood and K–12 education and other areas) and Manufacturing, Engineering, and Technology are the third and fourth largest clusters, holding steady over a decade at roughly 8% of CTE course takers. The largest decrease over time can be seen in Consumer Services, Hospitality, and Tourism. Time trends are similar when disaggregated by race/ethnicity (see Appendix Figure 1), particularly for Black and white students who make up roughly three-quarters of students in the state.
In Figure 2, we pool data across the ten-year period to examine the share of CTE students within each cluster who are Black versus white. Trends for Asian and Hispanic students, who make much a much smaller share of high school students in Maryland, are shown in Appendix Figure 2. The horizontal dashed line identifies the share of students of a particular race/ethnicity in the broader high school population. We observe that, relative to their share in the broader population (34%), Black students are overrepresented in Business Management and Finance (39%); Career Research and Development (48%); Consumer Services, Hospitality, and Tourism (44%); Health and Biosciences (39%); and Information Technology (37%). Patterns for white students are reversed, reflecting the fact that Black and white students make up over 70% of the Maryland student population in and out of CTE.

Student and Teacher Race/Ethnicity, in and out of CTE.
Student enrollment in CTE courses is a function of interest and personal preferences, as well as availability of CTE courses across schools and districts. (In some districts in Maryland, students can take CTE courses outside of their home/neighborhood school, generally at a centralized CTE center, while in others they can only take a course provided by their home school.) We cannot separate interest from availability, as we only can track enrollments in CTE courses. Nonetheless, descriptives on enrollments in CTE overall and by cluster across districts and schools—and schools with different racial/ethnic characteristics—provide insight into the distribution of CTE across the state.
All 24 local education agencies in the state have enrollments in (almost) all CTE clusters at least some point in the time frame of our analyses. One small and rural district did not enroll students in four out of 11 career clusters, while three more do not enroll students in one each. Out of the 410 unique schools that enrolled high school students, 71% enrolled students in at least one CTE course/cluster over the 10-year panel. Transportation technologies is the least commonly enrolled at 13% of high schools—followed by Construction and Development at 22%—while Information Technology is the most common, at 64% of schools—followed by Manufacturing, Human Resource Services, Business, and Career Development each at 52% to 54% of schools.
In Appendix Table 1, we further examine whether enrollments at the school-year level are related to the racial/ethnic characteristics of the student (and teacher) bodies, which we find they are. Schools with larger shares of Black students are less likely to have any enrollments in CTE, driven by Environmental, Agriculture, and Natural Resources; Human Resource Services; Information Technology; and Manufacturing, Engineering, and Technology. These findings suggest that the overrepresentation of Black students in several CTE clusters (Figure 2) is potentially in spite of decreased availability. Characteristics of teachers may be a possible mechanism or explanation.
CTE Teacher Population: Characteristics of Newly Hired Teachers
In our primary analyses, we examine the characteristics of new teachers who teach these CTE courses. We start these analyses by looking at trends pooled across the 10-year period, given that our interest is to examine relationships between characteristics (i.e., how teacher certification endorsement areas map to the career clusters they teach, how certification endorsement areas align with entry degrees and licenses) that are more easily observed in pooled data. Afterward, we turn to time trends in teacher characteristics.
Certification Endorsement Areas, Licenses, and Degrees
In Table 1, we examine CTE teachers’ certification endorsement areas, license/certificate type, and highest degree. The most common certification area among Maryland’s CTE teachers is Professional and Technical Education (PTE; 40%), which equips individuals to teach in all 11 career clusters in the state (depending on a teacher’s specific professional experience and alignment to a career cluster’s content); we map PTE and all other endorsement areas to career clusters below. Other CTE-specific certification areas include Business Education (14% of CTE teachers), Technology Education (6%), Family and Consumer Sciences (6%), and Agriculture (3%). 3
License and Highest Degree of Newly Hired CTE Teachers, by Certification Endorsement Area

Note. Except for the first row, the sample includes newly hired CTE teachers, between 2012–2013 and 2022–2023 school years, for whom we can observe their certification endorsement area, license, and highest degree at time of entry (n = 1,302 unique teachers). The first row includes newly hired teachers not in CTE (n = 11,031 unique teachers). The first column shows the proportion of all newly hired CTE teachers with a given endorsement area at the time of entry. Endorsement areas are grouped into those that are specific to CTE (Panel A), endorsements that overlap with CTE and non-CTE (Panel B), and endorsements not aligned to CTE (Panel C). Endorsement areas are sorted within category based on their column proportion. In the first two rows, – indicates that the column proportion is not relevant. The remaining columns show row proportions of licenses or degrees for observed endorsement area of CTE teachers. ^ indicates that certification areas are combined to avoid small cell sizes of fewer than 10 teachers.
In Maryland, teachers also can teach CTE classes with CTE-adjacent certification areas that align with a specific cluster. For example, to teach courses in the Health and Biosciences cluster, teachers can receive certification in Biology or Chemistry, in addition to PTE or Technology Education. The Computer Science endorsement area also allows teachers to teach CTE classes, in addition to computer science courses not classified under CTE. Together, 18% of entering CTE teachers hold CTE-adjacent certification endorsements: Computer Science (6% of CTE teachers), Life and Physical Sciences (combined into one group; 3%), Mathematics (3%), Art (3%), and Health and Physical Education (2%).
We also observe that some teachers teach 50% or more CTE courses in their first year as a teacher but enter the profession with a certification not associated with CTE. These areas include Social Studies (3% of CTE teachers), Special Education (3% of CTE teachers), Elementary Education (1%), English, Reading, and ESOL (combined into one group; 1%). There also is a small share of individuals missing certification area (5%) and a smattering of other non-teaching certificates (less than 1%). It is possible that teachers may have multiple unobservable endorsement areas; the data system only tracks primary endorsements. That said, these patterns are similar to national data showing that, in the same time period, 12% to 16% of teachers teaching CTE did not have a CTE qualification (Nguyen et al., 2023).
In Appendix Table 2, we map endorsement areas of CTE teachers to the specific career clusters they teach, which provides more detail on what a specific endorsement equips them to teach. Intuitively, Business Education is the most common endorsement area among CTE teachers who teach in the Business Management and Finance career cluster (59%), while the Agriculture endorsement is the most common in the Environmental, Agriculture, and Natural Resources cluster (58%). PTE is the most common endorsement in the Construction and Development (81%), Consumer Services, Hospitality, and Tourism (60%), Health and Biosciences (71%), Human Resource Services (36%), and Transportation Technologies (94%) clusters, highlighting the different trades and industries that this endorsement area pulls from. Both career clusters with a focus on technology—Information Technology and Manufacturing, Engineering, and Technology—draw CTE teachers with endorsement areas in PTE, Technology Education, and Computer Science.
Table 1 also tracks teachers’ entering license and highest degree, by endorsement area. To start, we include three license types: traditional, conditional, and resident teacher, where the latter two both fall under the category of “alternative.” Conditional certificates are very common among PTE-certified teachers (91%), but also are common in several other CTE-specific endorsement areas (e.g., 66% in Business Education, 54% in Technology Education, 59% in Family and Computer Sciences) as well as in Computer Science (78%) which overlaps with CTE and non-CTE. Resident teacher certificates are not observed at all for PTE-certified teachers. This finding indicates that none of the state-approved alternative certification programs in Maryland train and certify PTE teachers, consistent with PTE’s emphasis on work experience outside of a teacher education program. Conversely, resident teacher certificates are more common in some CTE-adjacent certification endorsement areas (e.g., 5% for Mathematics), while conditional certificates are slightly less common (e.g., 27% for Mathematics and 19% for Life and Physical Sciences). Closely aligned to state policy, PTE-certified teachers can and do enter with a high school diploma or associate’s degree (47%). Bachelor’s degrees are the most common entry point for other certification endorsement areas.
We visualize these patterns in Figure 3. For parsimony, we categorize the 16 endorsement areas into four groups: (1) PTE, which is unique from other CTE areas because of the ability to substitute professional experience for higher degrees; (2) other CTE-specific endorsement areas, excluding PTE (e.g., Business Education, Technology Education); (3) CTE-adjacent endorsement areas meant to support individuals to teach both CTE and non-CTE classes (e.g., Computer Science, Life and Physical Sciences, Mathematics); and (4) non-CTE endorsement areas. We also group conditional and resident teacher certificates into one “alternative” certification category. We observe that high school diplomas and associate’s degrees are observed almost exclusively among PTE-certified teachers, and master’s degrees become increasingly common across the next three groups of teachers. Similarly, traditional certification is rare amongst PTE-certified teachers and increasingly common across the next three groups of teachers.

Endorsement Areas, Licenses, and Degrees of CTE Teachers, Overall and by Race/Ethnicity.
Teacher Race/Ethnicity
We extend these initial findings by disaggregating patterns by teacher race/ethnicity. Here, we focus on Black and white teachers for whom we have large numbers of new hires. We group Asian, Hispanic, and other race/ethnicity teachers into one category given limited sample sizes for each, recognizing that the very coarse nature of this category does not support inferences about any individual group.
In Table 2, we show that 37% of newly hired CTE teachers are Black and 53% are white, compared to 21% Black and 63% white of new high school teachers in other content areas. Figure 2 disaggregates these trends by career cluster—matching the analyses for student demographic representation in/out of CTE—and extends the sample to include all high school CTE teachers (rather than newly hired teachers). Compared to the broad population of all high school teachers (horizontal dashed line) where 17% of teachers are Black, Black CTE teachers are overrepresented in Business Management and Finance (33%); Career Research and Development (31%); Consumer Services, Hospitality, and Tourism (33%); Health and Biosciences (22%); Human Resource Services (18%); and Information Technology (25%). These are largely the same career clusters where Black students are overrepresented, foreshadowing analyses that examine teacher-student race/ethnicity matching (see below).
Endorsement Areas and Degrees of Newly Hired CTE Teachers, by Race/Ethnicity

Note. Except for the first row, the sample includes newly hired CTE teachers, between 2012–2013 and 2022–2023 school years, for whom we can observe their certification endorsement area, license, and highest degree at time of entry (n = 1,302 unique teachers). The first row includes newly hired teachers not in CTE (n = 11,031 unique teachers). The first three columns show the row proportion or the share of teachers with a given endorsement who are Black, white, or Asian/Hispanic/Other Race. Asian, Hispanic, and other race teachers are in one group to avoid small cell sizes. Endorsement areas are grouped into those that are specific to CTE (Panel A), endorsements that overlap with CTE and non-CTE (Panel B), and endorsements not aligned to CTE (Panel C). Endorsement areas are sorted within category based on their column proportion in the full sample (see Table 1). The next three columns show the column proportion, or the share of newly hired CTE teachers from a given race/ethnicity group with each endorsement (Panels A through C), entering license (Panel D), or entering degree (Panel E). In the first two rows, – indicates that the column proportion is not relevant. ^ indicates that certification areas are combined to avoid small cell sizes of fewer than 10 teachers.
In Table 2 and the bottom panels of Figure 3, we observe that PTE certifications are the most common among both Black and white CTE teachers (44% and 40%, respectively). However, Black CTE teachers are more likely than white CTE teachers to have a CTE-specific endorsement area that includes PTE and other areas (74% versus 69%). Black and white CTE teachers have similar rates of entering the profession with a high school diploma or associate’s degree (roughly 20%), while Black CTE teachers have much higher rates of entering the profession through an alternative pathway and with a conditional or resident teacher license (83% compared to 65% for white teachers).
Time Trends
In Figure 4, we examine time trends in CTE teacher characteristics. The top left panel shows counts of all new high school teachers per year (average of 1,100, except for the 2020–2021 school year during the COVID–19 pandemic) 4 and counts of new CTE teachers (average of 118, or roughly 10% of all new hires). The share of new hires that are white decreased from 74% to 54%, while the share of Black new hires increased from 17% to 28%. However, in the top right panel, we show that the race/ethnicity of newly hired CTE teachers has been steadier over time, compared to all high school teachers. In the bottom left panel, we show time trends for the endorsement areas of new CTE teachers. Here, we include all five endorsement areas that are unique to CTE, as well as Computer Science, which is the most common endorsement area among those that overlap between CTE and non-CTE. In every year, PTE comprises the largest share of endorsement areas, though has declined over time (from roughly 50% in 2013 to roughly 35% in 2023) as Business Education has grown (from roughly 8% to roughly 20%). The share of CTE teachers with a Computer Science endorsement also has grown substantially over time (from close to zero to roughly 10%). Finally, the bottom right panel of Figure 4 shows times trends in licenses and degrees. Conditional licenses make up over 50% of new CTE teachers in every year, but over 80% in the most recent years. Following the downward trend in PTE endorsements over time, we also see are slight downward trend in the share of CTE teachers entering with a high school diploma or associate’s degree.

Characteristics of Newly Hired Teachers, Over Time.
Accounting for Potential Confounders
While our descriptive analyses do not attempt to support causal claims, between-group differences may lead to incorrect conclusions if there are factors related to CTE program rollout and teacher hiring. For example, the time trends shown above indicate that time may serve as a potential confounder. Further, the availability of certain CTE programs likely depends on common industries and businesses in the surrounding area of a district or school, as well as the presence of colleges and universities that train students for these industries. It also is possible that CTE programs operate in larger school systems that have larger shares of Black teachers. Indeed, in Appendix Table 1, we show that the share of teachers from different racial/ethnic backgrounds in a given school and year—above and beyond the share of students from different racial/ethnic backgrounds—is correlated with student enrollments (and potential offerings) of specific CTE clusters. However, these patterns are driven, in part, by districts.
Therefore, in the next set of analyses, we formalize between-group differences in teacher characteristics—across race/ethnicity groups and in/out of CTE—in a regression framework that controls for other observable background characteristics of teachers (i.e., gender, age, and experience), year fixed effects, and either district or school fixed effects. In Table 3, we first examine differences in teacher race/ethnicity in CTE—pooling across all clusters—versus the broader population of high school teachers. The top panel focuses on newly hired teachers that are a focus of most of our analyses, while the bottom panel includes all high school teachers. In the first, naïve model that excludes all controls, we estimate a statistically significant difference of 16 pp in the share of Black teachers in CTE versus non-CTE for newly hired teachers (the same as in Table 2) and 8 pp for all high school teachers (the same as Figure 2). Accounting for background teacher characteristics shrinks the between-group difference slightly, while adding district or school fixed effects increase the difference slightly. In contrast, white teachers are slightly underrepresented in CTE, at least when pooling across clusters. In the top panel, we present results for a third pooled group of Asian, Hispanic, and other race teachers (given small sample sizes for each group amongst newly hired CTE teachers). In the bottom panel that includes all high school teachers, we have sufficient sample sizes to disaggregate by group.
Differences in Teacher Race/Ethnicity in and out of CTE

Nots. Estimates in each cell come from separate linear probability regression models where the dependent variable is a dummy indicator for the race/ethnicity group listed in each row and the key independent variable is a dummy indicator for whether a teacher teaches in CTE. Some models include additional covariates. Teacher background characteristics include years of teaching experience (Panel B only, where there is variation in experience), age, and sex. The non-CTE mean is estimated from the model with no controls. The sample in Panel A includes all newly hired high school teachers, while the sample in Panel B includes all high school teachers. In Panel A, Asian, Hispanic, and other race teachers are in one group to avoid small cell sizes. Robust standard errors (clustered at the teacher level in Panel B) are in parentheses.
p < 0.001, **p < 0.01, *p < 0.05, ~p < 0.1.
Table 4 provides estimates of between-group differences in entry characteristics (i.e., endorsement area, license, degree) that are only observed for newly hired teachers. We include interactions between teacher race/ethnicity and CTE to simultaneously estimate differences in entry characteristics across these two dimensions. We focus on models that include district or school fixed effects, as well as year fixed effects and background teacher characteristics. Overall, results substantiate patterns shown in the descriptive analyses. There is a large difference between CTE and non-CTE in the share of teachers with a PTE endorsement, which is mechanical, since PTE does not equip teachers to teach non-CTE courses. Similarly, there is a large increase of roughly 30 pp to 38 pp in the share of teachers who enter the profession through an alternative pathway (largely with a conditional license), as well as a large difference of 12 pp to 22 pp in the share of teachers who enter with a high school diploma or associate’s degree (aligned to the patterns on PTE).
Differences in Endorsement Area, License, and Degree, In and Out of CTE and by Teacher Race/Ethnicity

Note. Estimates in each column come from separate linear probability regression models where the dependent variable is a dummy indicator for the entry characteristic listed in each column header. The key independent variables include a dummy indicator for whether a teacher teaches in CTE, dummy indicators for race/ethnicity (with white as the omitted category), and their interactions. Asian, Hispanic, and other race teachers are in one group to avoid small cell sizes. Some models include additional covariates. Teacher background characteristics include age and sex, both mean centered so that the constant can be interpreted as the mean value of the outcome for white non-CTE teachers. Robust standard errors are in parentheses. The sample includes all newly hired high school teachers. Sample sizes change slightly across models as singletons within sets of fixed effects are dropped.
p < 0.001, **p < 0.01, *p < 0.05, ~p < 0.1.
Examining differences by race/ethnicity requires attention to the coefficients on race/ethnicity and the interaction between race/ethnicity and CTE. For the likelihood of having a PTE endorsement, in the model with district fixed effects, the coefficient on the interaction term is small and not statistically significant while the coefficient on a dummy indicator for whether teachers are Black (versus white) is positive and statistically significant but small, at roughly 1 pp to 1.5 pp. The sum of these two coefficients provides an estimate of the difference in PTE endorsements between Black versus white CTE teachers, which is not statistically significant in the first model (see p-values on the bottom of Table 4). However, when we swap in school fixed effects to replace district fixed effects, we find a statistically significant difference between Black and white CTE teachers. These patterns likely reflect the availability of certain CTE programs, as well as the sorting of teachers from different backgrounds across schools. Accounting for school fixed effects limits these potential confounders. Patterns for between-group differences in the likelihood of entering the profession with a high school diploma or associate’s degree are similar, given that this option is only available for the PTE endorsement. More specifically, when we include school fixed effects, we observe a roughly 5 pp difference between Black and white CTE teachers in the likelihood of entering the profession with a high school diploma or associate’s degree.
Lastly, we observe a large and statistically significant difference of 30 pp to 38 pp between CTE and non-CTE in rates of entry into the profession through an alternative pathway (namely, with a conditional license). On average across CTE and non-CTE, Black teachers are more likely than white teachers to enter the profession through an alternative pathway. The coefficients on the interaction between Black teachers and CTE are consistently negative, reflecting the fact that white teachers see the largest increase in alternative certification rates between CTE and non-CTE. However, summing the interaction term with the coefficients on Black teacher indicates that Black CTE teachers have higher rates of alternative certification than white CTE teachers, and these differences are large and statistically significant no matter the control set.
Student-Teacher Race/Ethnicity Matching
In our third set of analyses, we examine opportunities for student-teacher race/ethnicity matching. Table 5 shows estimates from regression models that estimate mean differences in race/ethnicity matching between CTE and non-CTE courses, for CTE overall and by cluster. We conduct these analyses in a student-course-year dataset. Because our focus here is on students’ experiences, we include all teachers rather than focusing solely on newly hired teachers. (These analyses do not require information on endorsements, licenses, and degrees from teachers’ entry year.) As such, we show estimates for Black and white students, as well as for Asian and Hispanic students. Estimates can be interpreted as the percentage point difference in the share of CTE versus non-CTE courses that have a race/ethnicity match between students and teachers. To account for the correlation between schools’ racial/ethnic makeup and overall CTE enrollments (Appendix Table 1) and, more broadly, the non-random sorting of students, teachers, and CTE programs across schools, we show estimates from models that control for year fixed effects and school fixed effects. We also show estimates from models that add student fixed effects and thus make within-student comparisons, though these estimates are fairly similar to the models that exclude student fixed effects.
Student-Teacher Race/Ethnicity Matching In versus Out of CTE, Overall and by Cluster

Note. Estimates in each cell come from separate linear probability regression models where the dependent variable is a dummy indicator for the race/ethnicity of the teacher of a course and the key independent variable is a dummy indicator for whether the course is CTE (or a specific CTE cluster). Unlike prior analyses, Asian and Hispanic are in separate groups given large sample sizes in the student-course dataset; other race is excluded because it has little meaning in an analysis of race/ethnicity-matching. Some models include additional covariates. The sample sizes presented are for all student-course combinations. For analyses by CTE cluster, the sample sizes are slightly smaller as the sample is limited to all non-CTE courses and CTE courses in that specific cluster (excluding CTE courses in other clusters). Robust standard errors clustered at the student level are in parentheses. *** p < 0.001, **p < 0.01, *p < 0.05, ~p < 0.1.
We find that Black students are more likely to have a Black teacher in CTE than outside of CTE, with an absolute difference of 15 percentage points. In other words, for Black students, roughly one out of four non-CTE courses is taught by a Black teacher. In CTE, this likelihood increases to roughly one out of two. As another benchmark for interpretation, we consider the share of Black students who only encounter a race-matched teacher in CTE. On average, 81% of Black high school students have a race-matched teacher in any of their classes, across all years of high school, compared to 99% of white students. Race-matching is common for Black students in Maryland, given its unique demographic makeup in the mid-Atlantic region; however, it is much less common than for white students. On average, Black students have a total of 5.5 courses with a race-matched teacher, 10% of which come from CTE. White students have twice as many courses with a race-matched teacher over the course of high school, compared to Black students, also with roughly 10% coming from CTE. However, 3% of Black students only have a race-matched teacher in CTE, compared to less than 1% of white students. In other words, access to Black teachers for Black students vis-à-vis CTE operates both on the extensive margin (having any Black teachers) and the intensive margin (how many Black teachers), but with larger increases in the latter.
These patterns in increased access to Black teachers for Black students in CTE hold across models with/without student fixed effects, and for nine out of 11 career clusters. The largest differences are in Business Management and Finance (22 pp, relative to non-CTE courses), Information Technology (18 pp), Consumer Services, Hospitality, and Tourism (17 pp), Career Research and Development (16 pp), and Health and Biosciences (12 pp). For Transportation Technologies, we find no difference in race-matching rates for Black students relative to non-CTE courses. In Environmental, Agriculture, and Natural Resources, we observe a decreased likelihood of race-matching for Black students (11 pp). Conversely, white students have an increased likelihood of race-matching in this cluster (5 pp), even though they are less likely to have a race-matched teacher in CTE versus non-CTE pooling across clusters (2 pp).
Like white students, differences in race/ethnicity-matching rates between CTE and non-CTE are similarly small for Asian and Hispanic students. The fact that race/ethnicity matching rates for Asian and Hispanic students are often lower in CTE is partially a function of who teaches CTE, but also a function of students who take CTE courses. Across our analyses, we find that Hispanic students are underrepresented in CTE, overall and across clusters (see Figure 1 and Appendix Figure 2); the same is true for Hispanic teachers (see Appendix Figure 2). There may be a “chicken and egg” problem here, or the patterns may be mutually reinforcing.
Discussion and Conclusion
Our analyses, which draw on statewide data from Maryland public schools, identify several important patterns. CTE teachers are certified in several endorsement areas, with the plurality of individuals (40%) entering under the PTE area that has unique requirements under state law. Indeed, a large share (47%) of PTE-certified teachers enter with a high school diploma or associate’s degree, and a large majority (91%) have a conditional license that implies an alternative avenue into the profession that bypasses traditional teacher education. Because PTE is the most common certification endorsement area, it drives patterns across all CTE teachers. These patterns are fairly similar to those found by Theobald et al. (2024) in Washington state, whose Business and Industry pathway provides similar affordances as the PTE pathway in Maryland.
We also document that PTE endorsements are particularly common among Black (43%) CTE teachers. When comparing Black versus white teachers in the same school, we estimate a statistically significant 11 pp difference in the rate of entry to the profession with a PTE endorsement, as well as a 5 pp difference in rates of entry with a high school diploma or associate’s degree. Again, Theobald et al. (2024) document similar patterns in their study, though the overall share of Black and non-Black teachers of color is quite small in Washington state. Thus, our study provides a deeper dive into teacher licensure and degrees by race, relative to just a handful of other studies that examine the characteristics of CTE teachers. In national data, Nguyen et al. (2023) document a slight uptick over time in the share of CTE teachers who are Black, but do not probe potential mechanisms such as certification pathway, degree, license, or endorsement area.
We further extend prior studies by examining representation of Black teachers across specific career clusters. We find that, relative to high school teachers as a whole, Black CTE teachers are overrepresented in several clusters, including Business Management and Finance; Career Research and Development; Consumer Services, Hospitality, and Tourism; Health and Biosciences; Human Resource Services; and Information Technology. The PTE endorsement is a pathway into the profession for all these clusters.
Though the main focus of our analyses is on teachers, we document an important trend for students: Because of the larger share of Black teachers in CTE versus high school teachers more broadly, Black students are substantially more likely to have a race-matched teacher in their CTE classes compared to other classes. This is true despite the fact that larger shares of Black students (and teachers) in a school is negatively associated with the likelihood of a specific school enrolling students in (and potentially offering) CTE courses. Similar trends across many career clusters is important, as training in information technology, health, business, etc. can all prepare Black students for in-demand, high-paying jobs. Together, these findings situate race/ethnicity as a central component to discussion on the CTE teachers’ characteristics. Like Anglum et al. (2023), we argue that we need to know a lot more about the characteristics of CTE teachers, but we clarify this directive and urge other scholars to explore not just characteristics associated with certification and entry but also to consider the extent to which patterns differ by race/ethnicity.
Aligned with this perspective, we use our analyses and findings to make links between longstanding discussion on unique features of the CTE licensure process (Bonsu et al., 2013; Jacques & Potemski, 2014; Lynch, 1996; Miller, 1982; C. J. Zirkle et al., 2007) and parallel literature on the importance of decreasing barriers to entry for prospective Black and non-Black teachers of color (Carver-Thomas, 2018; Gist & Bristol, 2022). CTE scholars argue that substituting years of professional experience for higher degrees is fundamental to the nature of teaching CTE courses, which requires direct application to real-world work. In this sense, state policies that provide these pathways may not be “alternative” at all, even though scholars often use this language because of the ways in which these pathways bypass traditional teacher education (Bonsu et al., 2013; Jacques & Potemski, 2014; Lynch, 1996; C. J. Zirkle et al., 2007). Either way, alternative pathways to become a CTE teacher that allow one to enter the profession without a bachelor’s degree, for example, generally are thought to afford novel recruitment opportunities (Jacques & Potemski, 2014). This is the same argument for relying on alternative certification pathways—and other strategies that can decrease barriers to entry—when recruiting Black and non-Black individuals of color into teaching and aiming to diversify the teacher workforce.
While our analyses are descriptive and not causal, patterns support the idea that decreased barriers to entry through alternative pathways—and their unique presence in the CTE licensure process—may be responsible for the larger share of Black teachers in CTE compared to high school courses more generally. We find that alternative certification rates are incredibly high among entering CTE teachers, driven primarily by PTE, and they are highest among Black CTE teachers. Future research should look for causal identification strategies to expand our findings, potentially exploiting differences in or changes to CTE certification laws and requirements across states and over time. This sort of work also would help consider whether Maryland is an outlier in the patterns we observe (and whether this drives the results).
Similarly, when looking at student-teacher race/ethnicity-matching in versus out of CTE, we hypothesize that students may be selecting CTE pathways within their schools where they feel a connection with same-race/ethnicity teachers. However, causal analyses are needed to determine if the selection mechanism goes in this direction or the reverse (i.e., teachers being placed in CTE pathways where students from the same demographic background tend to enroll), or if there are other confounders we are not accounting for in our analyses. Future causal research may also link access to same-race/ethnicity teachers in CTE to student outcomes (e.g., completion of a CTE pathway, high school graduation or equivalent, employment post high school, college enrollment), as well as to explore whether increased access on the extensive versus intensive margin matters more. Our analyses show that increased access to Black teachers for Black students in CTE primarily increases the number of race/ethnicity-matched courses (i.e., intensive margin) with smaller differences in whether students ever have a same-race/ethnicity teacher (i.e., extensive margin). Research on the test-score impacts of Black teachers on Black students suggest that both margins matter (Gershenson et al., 2022).
It is also important to explore and understand underlying mechanisms. We descriptively observe a higher proportion of Black teachers in CTE positions, but we do not know about their motivations for becoming CTE educators and if they viewed these requirements as a barrier to entering the teaching profession. For example, previous literature has suggested that the use of high-stakes standardized testing for prospective teachers adversely impacts Black and non-Black teachers of color generally, who are more likely to not retake a licensure test if they do not pass (Cowan et al., 2023), and the trajectory of Black teachers into the profession specifically (Petchauer & Baker-Doyle, 2019). In Maryland, individuals pursuing PTE certification who do not hold a bachelor’s degree do not need to complete a basic skills assessment. Alternative certification and CTE certification also decrease barriers to entry along additional dimensions, including financial and opportunity costs. These dimensions may work in tandem, or one may be a key driver.
We also recognize the cautions of some Black scholars that decreasing barriers to entry may not always be beneficial, if these programs provide less rigorous or comprehensive training (White et al., 2020). CTE scholars raise similar concerns, noting that CTE often has a stigma of decreased rigor compared to core academic courses (Kreisman & Stange, 2020). Additional lines of inquiry may explore the specific programmatic features and rigor of alternative route CTE teacher credentialing processes, as well as the perceptions of CTE teacher training and quality. That said, at least in Maryland, the primary ways that CTE programs—particularly in PTE—decrease barriers to entry are by eliminating testing and allowing candidates to substitute work experience for degrees. In most instances, candidates still need to complete professional education courses to learn the skills needed to translate industry work experience to the K–12 classroom.
Finally, we situate our findings within broader policy conversations about teacher diversity and teacher shortages. While there is greater representation of Black teachers in CTE, we also know that there is a shortage of CTE teachers in the profession overall (Sims, 2010; C. Zirkle et al., 2019). In fact, PTE, Business Education, and other endorsement areas within CTE are high-needs subject areas for Maryland, along with Special Education, STEM (science, technology, engineering, and mathematics), and English. Also drawing on Maryland data, Gottfried et al. (2025) point out that many teachers who teach CTE also teach in non-CTE areas too, potentially reflecting teacher shortages across content areas and, thus, resulting in teachers wearing several different hats. As such, we cannot argue that expanding CTE certification pathways—potentially with the simultaneous goal of increasing diversity—is necessarily easy or straightforward. Decreasing barriers to entry appears to be a good idea with respect to increasing participation in the teaching profession for Black individuals. Policy efforts also need to consider multiple recruitment pools of prospective teachers, including industry and potentially also from current CTE students.
Supplemental Material
sj-docx-1-ero-10.1177_23328584251361382 – Supplemental material for Pathways into the CTE Teaching Profession: A Descriptive Analysis of Degrees, Licenses, and Race in Maryland
Supplemental material, sj-docx-1-ero-10.1177_23328584251361382 for Pathways into the CTE Teaching Profession: A Descriptive Analysis of Degrees, Licenses, and Race in Maryland by David Blazar, Danett Song, Ramon Goings, Jay Plasman and Michael Gottfried in AERA Open
Footnotes
Acknowledgements
This research was supported by the Maryland Longitudinal Data System (MLDS) Center. We are grateful for the assistance provided by the MLDS Center. All opinions are the authors’ and do not represent the opinion of the MLDS Center or its partner agencies.
Authors’ Note
The opinions expressed are those of the authors and do not represent the views of the National Science Foundation or the Institute of Education Sciences or the U.S. Department of Education. This research also was supported by the Maryland Longitudinal Data System (MLDS) Center.
Declaration of Conflicting Interests
The author(s) declared no potential conflicts of interest with respect to the research, authorship, and/or publication of this article.
Funding
The author(s) disclosed receipt of the following financial support for the research, authorship, and/or publication of this article: The research reported here was supported by the National Science Foundation DRL2101163; as well as the Institute of Education Sciences, U.S. Department of Education, through Grant R305A210031 to the University of Maryland, College Park.
Notes
Authors
DAVID BLAZAR is an associate professor at the University of Maryland College Park in the department of Teaching and Learning, Policy and Leadership. With training in the economics of education, Blazar’s research examines the efficient, effective, and equitable allocation of educational resources, focusing in particular on resources related to teachers and teaching.
DANETT SONG is a doctoral candidate at the University of Maryland College Park in the department of Teaching and Learning, Policy and Leadership. Her research focuses on educational policy.
RAMON GOINGS is an associate professor in the Language, Literacy, and Culture doctoral program. His research interests are centered on exploring the academic and social experiences of gifted/high-achieving Black males PK-PhD, diversifying the teacher and school leader workforce, and investigating the contributions of Historically Black Colleges and Universities (HBCUs).
JAY PLASMAN is an assistant professor in the Workforce Development and Education in the College of Education and Human Ecology at the Ohio State University. His research focuses broadly on education policy and explores the pipeline of career and technical education between high school and college along with the role this type of education has on high school dropout rates and college considerations.
MICHAEL GOTTFRIED is a professor in the Organizations, Leadership, and Systems division at the University of Pennsylvania, Graduate School of Education. His research targets data-driven decision making on a broad range of educational issues, including student absenteeism, career and technical education, early childhood education, and educating students with disabilities.
References
Supplementary Material
Please find the following supplemental material available below.
For Open Access articles published under a Creative Commons License, all supplemental material carries the same license as the article it is associated with.
For non-Open Access articles published, all supplemental material carries a non-exclusive license, and permission requests for re-use of supplemental material or any part of supplemental material shall be sent directly to the copyright owner as specified in the copyright notice associated with the article.