
Abstract
In the past year, automation has become more and more important in the field of elemental and structural chemical analysis to reduce the high degree of manual operation and processing time as well as human errors. Thus, a high number of data points are generated, which requires fast and automated data evaluation. To handle the preprocessed export data from different analytical devices with software from various vendors offering a standardized solution without any programming knowledge should be preferred. In modern laboratories, multiple users will use this software on multiple personal computers with different operating systems (e.g., Windows, Macintosh, Linux). Also, mobile devices such as smartphones and tablets have gained growing importance. The developed software, Project Analytical Data Evaluation (ADE), is implemented as a web application. To transmit the preevaluated data from the device software to the Project ADE, the exported XML report files are detected and the included data are imported into the entities database using the Data Upload software. Different calculation types of a sample within one measurement series (e.g., method validation) are identified using information tags inside the sample name. The results are presented in tables and diagrams on different information levels (general, detailed for one analyte or sample).
Introduction
Spectroscopic methods such as atomic spectroscopy1–3 and mass spectrometry3–5 are used in analytical measurement to separate substances in complex matrices. The results of these methods are directly related to the structural characteristics of the substances. Without a suitable data evaluation, the substances cannot be precisely identified, as there are no obvious defined standards. Software delivered by the manufacturers of the analytical devices regularly does the conversion of the electrical measured data to interpretable values and also a qualitative and quantitative evaluation.
Based on the high amount of vendors, a variety of software exists, and often the appropriated functionality is not enough for the daily laboratory routine, especially for the validation of new methods for the detection of chemical compounds. This includes the determination of the limits of detection and quantification 6 as well as statistical and validation calculations7,8 such as the determination of precision. Nowadays, this is mostly realized by spreadsheet software such as Excel (Microsoft, Redmond, WA) and requires a high manual effort and working time.
With the high amount of measurements resulting from high-throughput screening,9,10 data evaluation is a bottleneck in modern laboratories. For that reason, a fast and automated data evaluation is required.11–13
Data Evaluation in Analytical Measurement
Automated Data Evaluation
In modern laboratories, analytical processes, including sample preparation, analysis, and data processing, have been automated to reduce the high degree of manual operation and processing time as well as possible human errors. As a result of the high automation, more and more samples can be analyzed.14–18 In modern huge laboratories, more than 1000 samples can be analyzed each day. 19 High-throughput screening, found in clinical laboratories or in the field of toxicology,20–22 obtains more than 8000 samples per day.9,10
Often, it is essential to evaluate the results received by the device software. It could be necessary to filter the nonrelevant data (e.g., calibration solutions), correct the values with a second internal standard to eliminate the possible errors occurring during the sample preparation, or calculate statistical values.6–8 Therefore, some individual software for special data analysis has been developed. Such software is reported for lipid experiments, 23 for the identification of proteins and peptides, 24 in toxicological studies,20–22 and in other analytical applications.25–28
Different from these software, which is used to identify and quantify analytes in a sample, electronic laboratory notebooks (ELNs) collect measurement data and document analytical experiments to allow a fast and effective search of laboratory data. Software such as Pipeline Pilot or Isentris from Biovia/Accelrys (San Diego, CA) analyze molecules to find similarities and substructures or filter them by features.29,30 Also, general software for data analytics such as KNIME is used in modern laboratories to mine the huge amount of generated data.31,32
Since modern laboratories are mostly electronic and paperless, an automated data evaluation is possible.33–37 This change in digitalization of data in analytical measurement, the way to handle the high amount of data, and use of computational intelligence will change the work in laboratory for the future.33,37–39
Digital Laboratory
Automation in laboratory environments is the combination of various devices such as laboratory equipment (e.g., centrifuge, thermos shaker, ultrasonic bath), robots for transport or manipulation, and analytical instruments. For these complex sensor systems, integration and automation have to be done on a software level via the device software running on a computer linked to the analytical instrument. In addition, personal computers with Windows, Macintosh, or Linux operating systems are used in the office, and mobile devices such as smartphones or tablets have gained growing importance.40–42 For an optimized workflow, the data evaluation software and the analyzed data should be accessible from any device in the laboratory environment. To keep such software updated on every device easily and to minimize the development effort, a multiplatform solution (e.g., a web application running on a webserver with a central data storage) should be preferred. 43
Since modern laboratories are mostly paperless and electronic, the integration of such software and central data storage is easily possible. More complex is the integration of multiple analytical devices from various vendors with different software versions, because the export format (e.g., Excel, csv, xml) and the style (e.g., table layout) of the measurement data are manufacturer dependent. 28
The presented software solution, Analytical Data Evaluation (ADE), should overcome the challenges mentioned above. The aim was to develop and enhance a standardized automated data evaluation software for analytical devices in elemental and structural analysis to integrate every available measurement device in typical life science laboratories.
Development of ADE
The first version of the software was developed for Windows operating systems and specialized to evaluate preprocessed data from the inductively coupled plasma–mass spectrometer (ICP-MS; Agilent Technologies, Waldbronn, Germany). The measurement values achieved were included in Excel report files generated by the MassHunter Workstation Software for ICP-MS (version A01.02 G7201A; Agilent Technologies). To extract only the relevant data from the tables inside the Excel report files and to grant flexibility to several table styles, we implemented the possibility of creating reusable filter methods. 30
As a next step, the software was extended for use with other measurement instruments, including a gas chromatography triple quadrupole mass spectrometer (GC-QQQ) and a liquid chromatography time-of-flight mass spectrometer (LC-TOF; Agilent Technologies). Both systems use the MassHunter Workstation Software for Quantitative Analysis (version B07.00 for GC-QQQ; version B.03.02 for LC-TOF) to quantify the measured data and generate the Excel reports. A special analytical technique for rapid enantiomeric excess determination, the chiral mass spectrometer (Chiral MS), was included. 44 In this case, the reports were created using the MassHunter Workstation Software for Qualitative Analysis (version B.04.00). All these reports have a different table style compared to the ICP-MS ones. Thus, the import process was adapted. To get access to ADE independent of the used device and operating system, this version was implemented as a web application using ASP.NET WebForms. Therefore, the reports of the device software were uploaded to and saved on the web server with the help of the developed software, Data Upload. 32
To integrate new analytical instruments and import their corresponding Excel report files, this procedure requires one individual algorithm for each different table structure. The actual version of the ADE uses XML export files of the device software, which contains, different from the Excel reports, the entire provided information (e.g., general and detailed information about the batch, samples, analytes, qualifiers, and measurement results). Furthermore, XML files can be saved as a string inside a database and analyzed by an algorithm using the XML-Schema and the tags to find the required data inside the file. In addition, ADE was extended to Project ADE ( Fig. 1 ), which consists of a web application and a web service to get access to the entities, such as analytes, measurement series, or projects, stored in a database. Moreover, a new version of the Data Upload software to automate the data transfer from the device software to Project ADE and the functionalities to parse the data from the XML string and calculate the results are included. In addition, to complete the analyte data, Project ADE gets access to the PubChem database (National Center for Biotechnology Information [NCBI], National Library of Medicine [NLM], National Institutes of Health [NIH], Department of Health and Human Services [DHHS]). 45
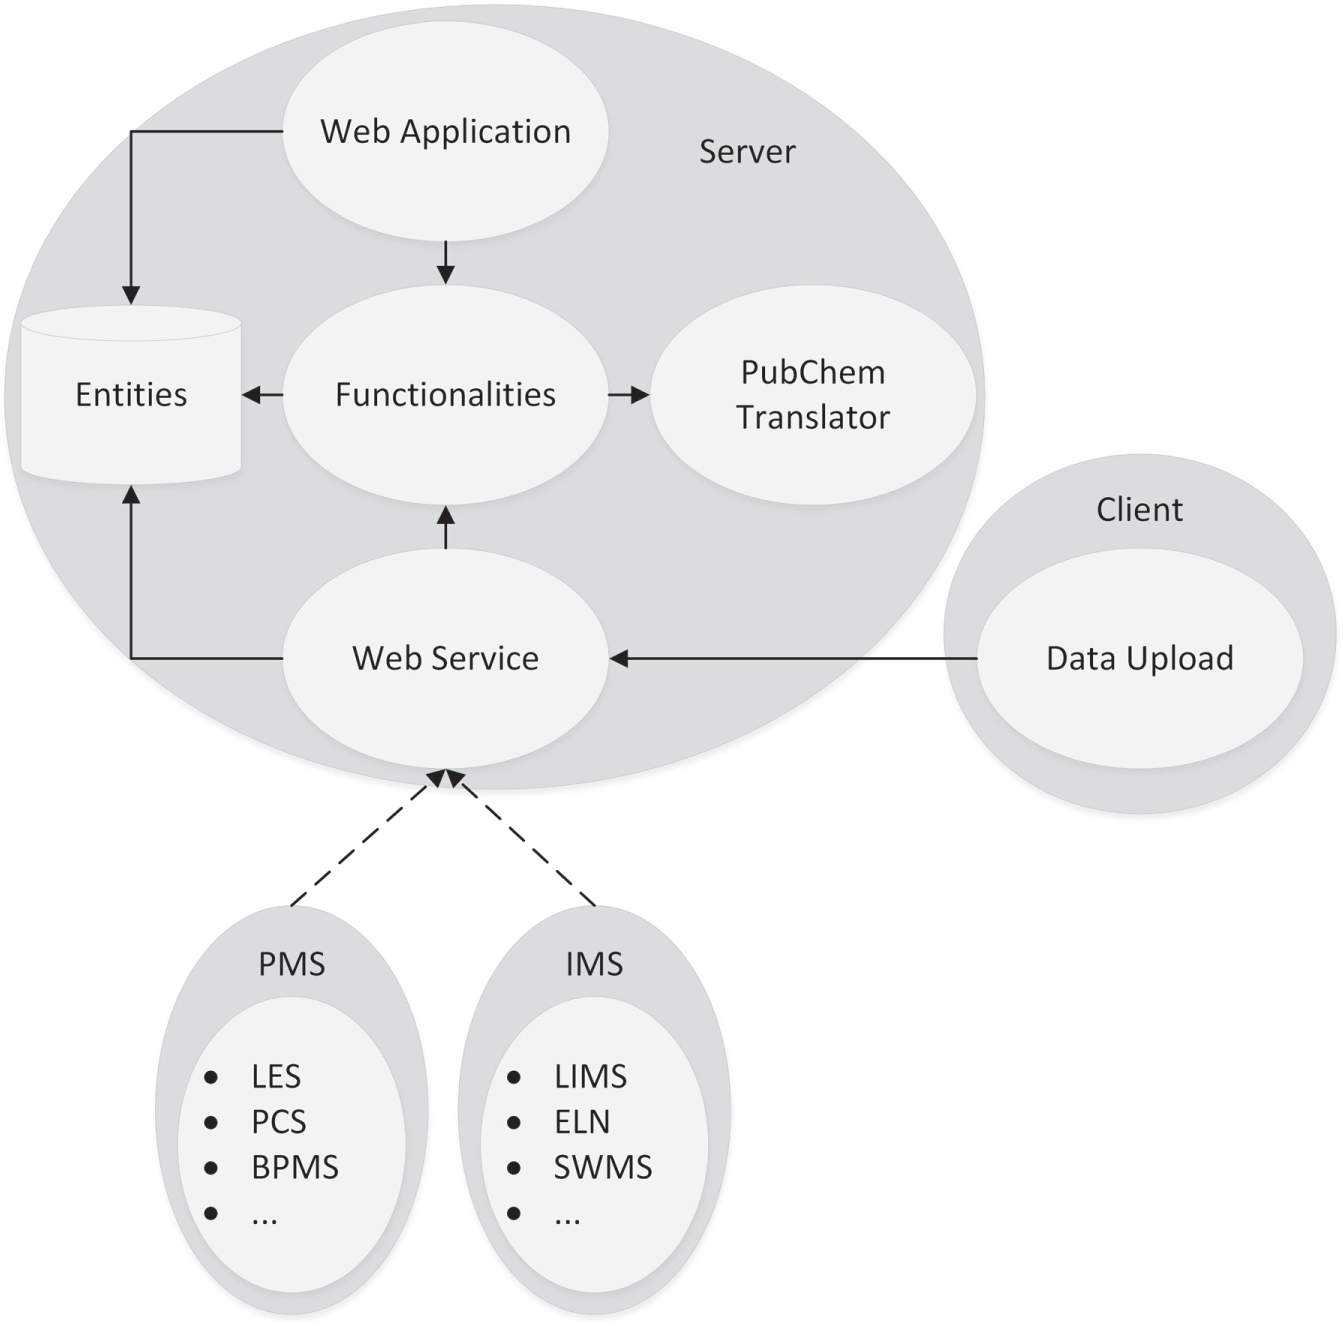
Concept of Project Analytical Data Evaluation (ADE). PMS, process management system; IMS, information management system; LES, laboratory execution system; PCS, process control system; BPMS, business process management system; LIMS, laboratory information management system; ELN, electronic laboratory notebook; SWMS, scientific workflow management system.
ADE was developed to automate the data evaluation not only for routine measurements but also for the special tasks and requirements in method validation. It simplifies the workflow and reduces the required processing time from hours to a few minutes.
System Concept: Project ADE
As mentioned above, Project ADE is a combination of different software and software modules to handle the complex functionality of an automated data evaluation process for analytical measurements.
Web application
The user gets access to the data stored in the entities database through the web application, using the ASP.NET MVC framework to handle the complexity of the environment. The Model-View-Controller (MVC) provides better control about the data (model), the web page (view), and the functionalities (controller), since the application is divided into these three independent modules. Furthermore, the bootstrap framework developed by Twitter is included to optimize the design and performance on mobile devices such as smartphones and tablets. To handle multiple users in the laboratory environment, a user and role management system was integrated. A user with normal rights has full control about the projects created by him or her. Otherwise, a user with manager rights has full access to each project except the ones marked as confidential. This makes the confidential data only accessible to authorized users.
Web service
The web service is the counterpart to the web application and allows a machine-to-machine interaction without the graphical user interface (GUI) as it is preferred for a user-to-machine interaction. Since Project ADE benefits from the service-oriented architecture (SOA) by using the power user gateway (PUG) to access the PubChem database, the web service allows an improved integration into existing process management systems (PMS) (e.g., laboratory execution system [LES], process control system [PCS], business process management system [BPMS]) and information management systems (IMS) (e.g., laboratory information management system [LIMS], ELN, scientific workflow management system [SWMS]). Thus, Project ADE can be used as a stand-alone solution as well as a middleware to reduce the integration costs. Inside Project ADE, the web service is used by the Data Upload software to get access to the entities database and the functionalities.
Entities database
The entire data used by Project ADE are managed by the entities database. This includes the user account information and their roles; entire information about the projects, measurement series, and its settings; and information about the analytical devices and the linked device software. To keep the whole information for one sample from one measurement series, the results remain inside an XML string within the entity sample. To extract the relevant data about samples and analytes from these strings, corresponding parsers were included in the functionality module of Project ADE. For these algorithms, it is necessary to know where to find the required data. Therefore, the user connects this information to a specific tag inside the XML string. To minimize this manual effort, a representative XML export file from the device software is linked to the corresponding entity software inside the entities database ( Fig. 2 ). Thus, the user has to make these adjustments only once for every device software. In addition, the possibility to use CSV tables instead of XML files was integrated. The user only has to select the separator inside this CSV table. Once an algorithm transforms the CSV table into an XML string, there is no difference for the user and the software to handle the contained information. The biggest advantage is that a new analytical device, its software, and the corresponding XML or CSV export format can be integrated in Project ADE via the web application without any programming knowledge.
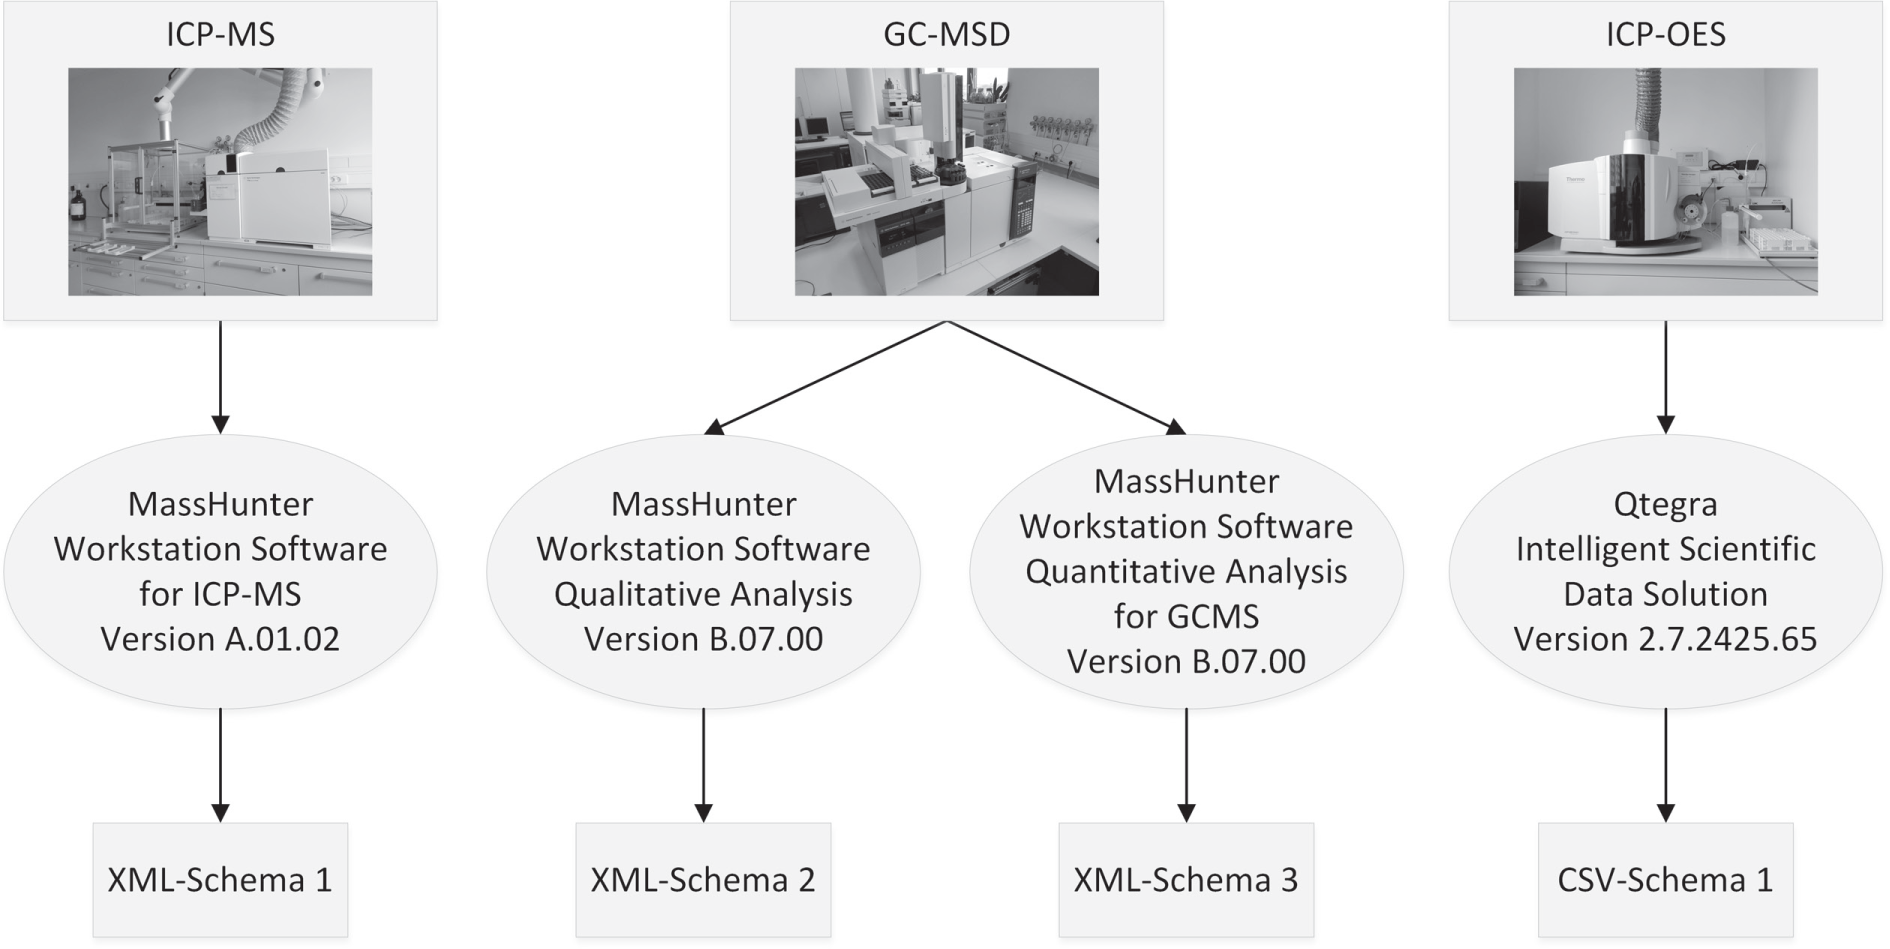
Relationship between the entities device, software, and the XML style from a representative report file inside the entities database. ICP-MS, inductively coupled plasma–mass spectrometer; GC-MSD, gas chromatography–mass selective detector; ICP-OES, inductively coupled plasma–optical emission spectroscopy.
One of the challenges for Project ADE is the use as a stand-alone software and a middleware for process management systems as well as information systems. While Project ADE as a stand-alone solution has to manage all information about the devices, the software, and the measurements, this can lead to consistence problems for Project ADE as a middleware. To avoid this, the information inside the entities database can be manipulated (create, change, delete) via the integrated web service to manage them via the superior system.
PubChem translator module
In addition, the integrated link to the PubChem database 45 using the provided PUG 46 allows one to complete the information for the analytes with the molecular formula, the molecular weight and exact mass, the simplified molecular-input line-entry system (SMILES), and the international chemical identifier (InChi), with synonyms and a structure.
Functionality module
Furthermore, the functionality module of Project ADE includes the algorithms to evaluate the extracted measurement series results like the final concentration. Therefore, some additional information is required that the device software deliverer does not deliver. That is why an information tag was included to the sample name. This tag consists of the calculation type, a link identifier, the sample type, and, in the case of a calibration sample, the known concentration and unit. For example, the tag <R_1_S> belongs to a sample (S) of a routine measurement (R) and has the link identifier 1. The tag <NONE_1_C_50_ppm> is a calibration sample (C) with the link identifier 1 and the known concentration of 50 ppm.
To make the information tags as small as possible, the calculation and sample types are indicated by abbreviations. In addition, one sample name can include one or more of these tags. The link identifier is used to connect samples from one calculation type (e.g., to calculate the average for repetition measurements). The calculation types, which can be handled by Project ADE, are shown in Table 1 .
Relationship between Tag Abbreviation and Calculation Type.
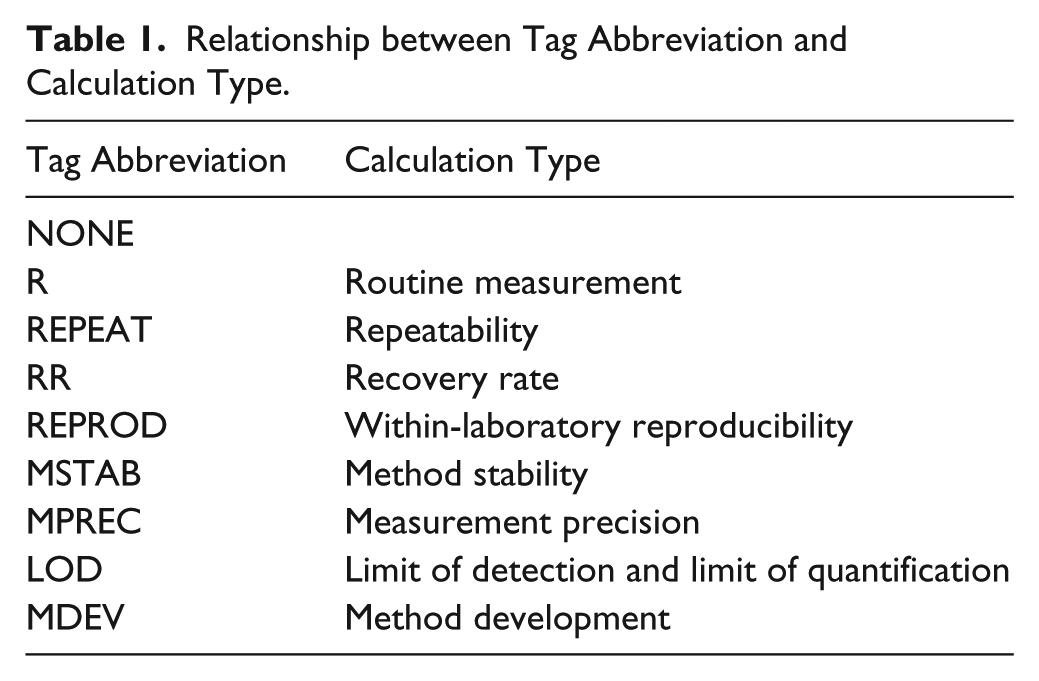
Following this naming convention, the single samples can be assigned and the statistical evaluation can be calculated according to the corresponding calculation types.
The main goal of Project ADE is to edit and analyze data. These include filtering the data, transferring the values to the required units, calculating statistical values, and generating tables and diagrams to visualize the results to the user. This is done according to the calculation types. Currently, the single steps are hard coded for the included calculation types. In future work, the possibility to create own calculation types will be implemented. Therefore, the user selects a name and abbreviation for the calculation type and chooses calculation steps (e.g., average, median, standard deviation). In addition, the possibility to edit the related formulas or create one’s own should be implemented.
Data upload
To adapt the Data Upload software on the client side of Project ADE to the changes of the other modules, a revision and update were developed. In the first version, the user had to set up an upload task for each single measurement that led to a high manual effort. The improved version has to be adjusted only on the first start. Afterward, the software runs as a background task and observes one user-given folder, including all subfolders. Furthermore, the user has to choose which device is linked to the client computer and which software produces the export files. To get a list of the devices inside the entity database and their linked software, the Data Upload software gets access to the entity database via the web service interface. This access is also needed to create a new measurement series or update an existing one.
Experimental
Automated data evaluation using ICP-MS
The ICP-MS is used for a fast and sensitive determination of the concentration of chemical elements (e.g., heavy metals in environmental samples). 5 To generate an export file automatically after the measurement is finished, the data analysis (DA) method has to be adjusted in the acquisition software module of the MassHunter Workstation for ICP-MS. The user has to choose an Excel template to generate the result export. During the creation of the report, an XML file is created, which includes the complete information. This is required by Project ADE. Once the Excel report is created, this file is deleted.
To keep this file, the report has to be created in a manual way via the quantification software module. Thereby, more files than the required XML report are created (e.g., image files). These files require a high amount of disk space and should be deleted manually or by the Data Upload software.
After the manual or automatic upload of the XML export file (either via the web application or by the Data Upload software), the user has to adjust some information about the sample preparation (e.g., weight, volume, dilution), check for the correct extraction of the naming convention, select the analyte(s) to be shown in the result tables and diagrams, and set some settings for these analytes (e.g., recovery rate value and unit). Afterward, the measurement series is added to an evaluation project, and the results are calculated and shown in tables and diagrams for each included calculation type. This process is shown in Figure 3 .
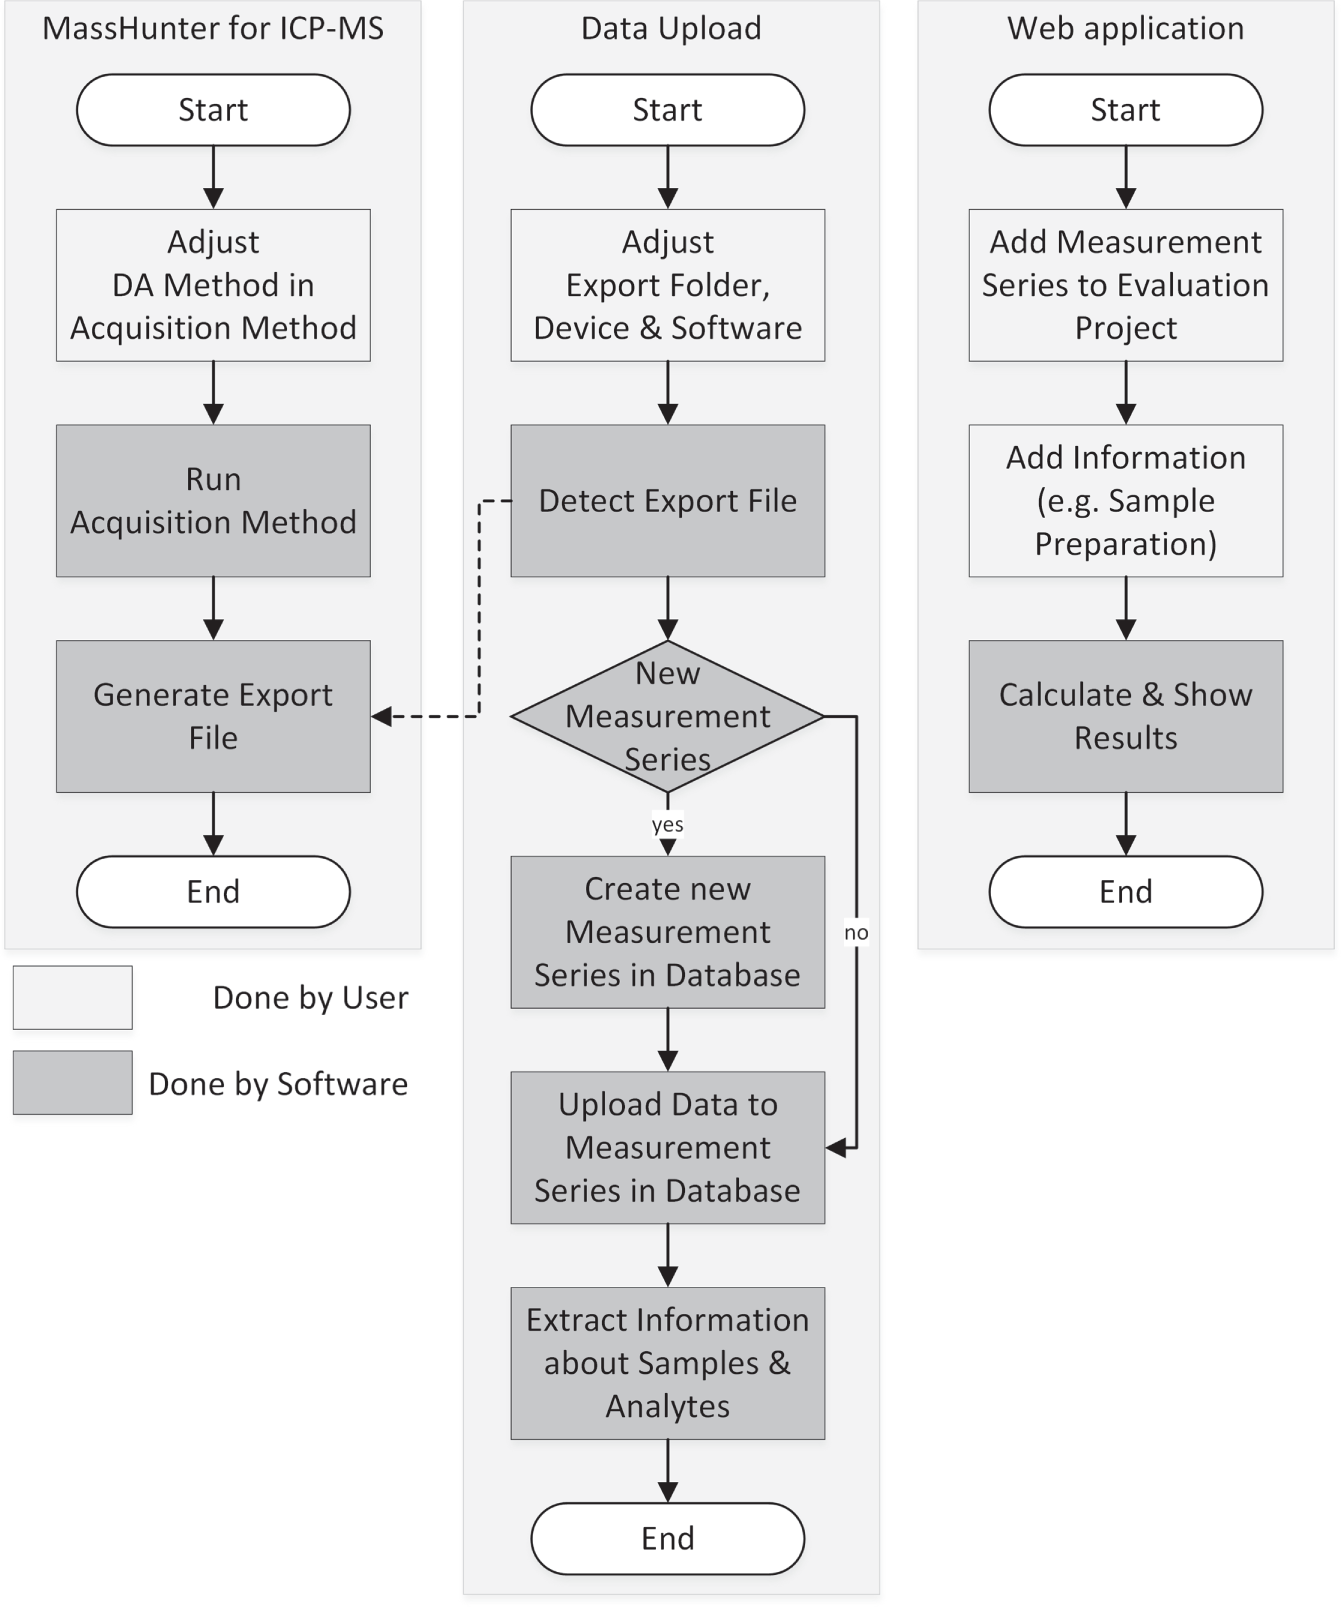
Evaluation workflow for the Project Analytical Data Evaluation (ADE) and the device software MassHunter for the inductively coupled plasma–mass spectrometer (ICP-MS) from Agilent Technologies (Waldbronn, Germany).
To determine the effectiveness of the developed software validation, measurements to analyze biliary endoprosthesis were performed. Biliary endoprosthesis stents are used to prevent blockages caused by cancer 47 and are made of plastic (Teflon, polyethylene, or polyurethane) or metal (stainless steel or nickel titanium alloy).48,49 While metal stents have significantly less stent occlusion and a reduced risk of recurrent obstruction, they have a higher stent migration, tumor overgrowth, and sludge formation. 50 To prevent occlusion by using new coating material for bile duct stents, the components of the blockage material have to be analyzed. Analogously to gallstones, the congested stents should contain calcium and magnesium, 51 which can be verified via an ICP-MS measurement.
Results of the repeatability measurement series done for the method validation were analyzed in a manual way using Excel spreadsheet software and in an automatic way using the ADE software. Afterward, the attended time ( Table 2 ) was compared.
Comparison Regarding the Needed Time between Manual Data Evaluation Using Excel Spreadsheet Software and Automatic Data Evaluation Using Analytical Data Evaluation (ADE).
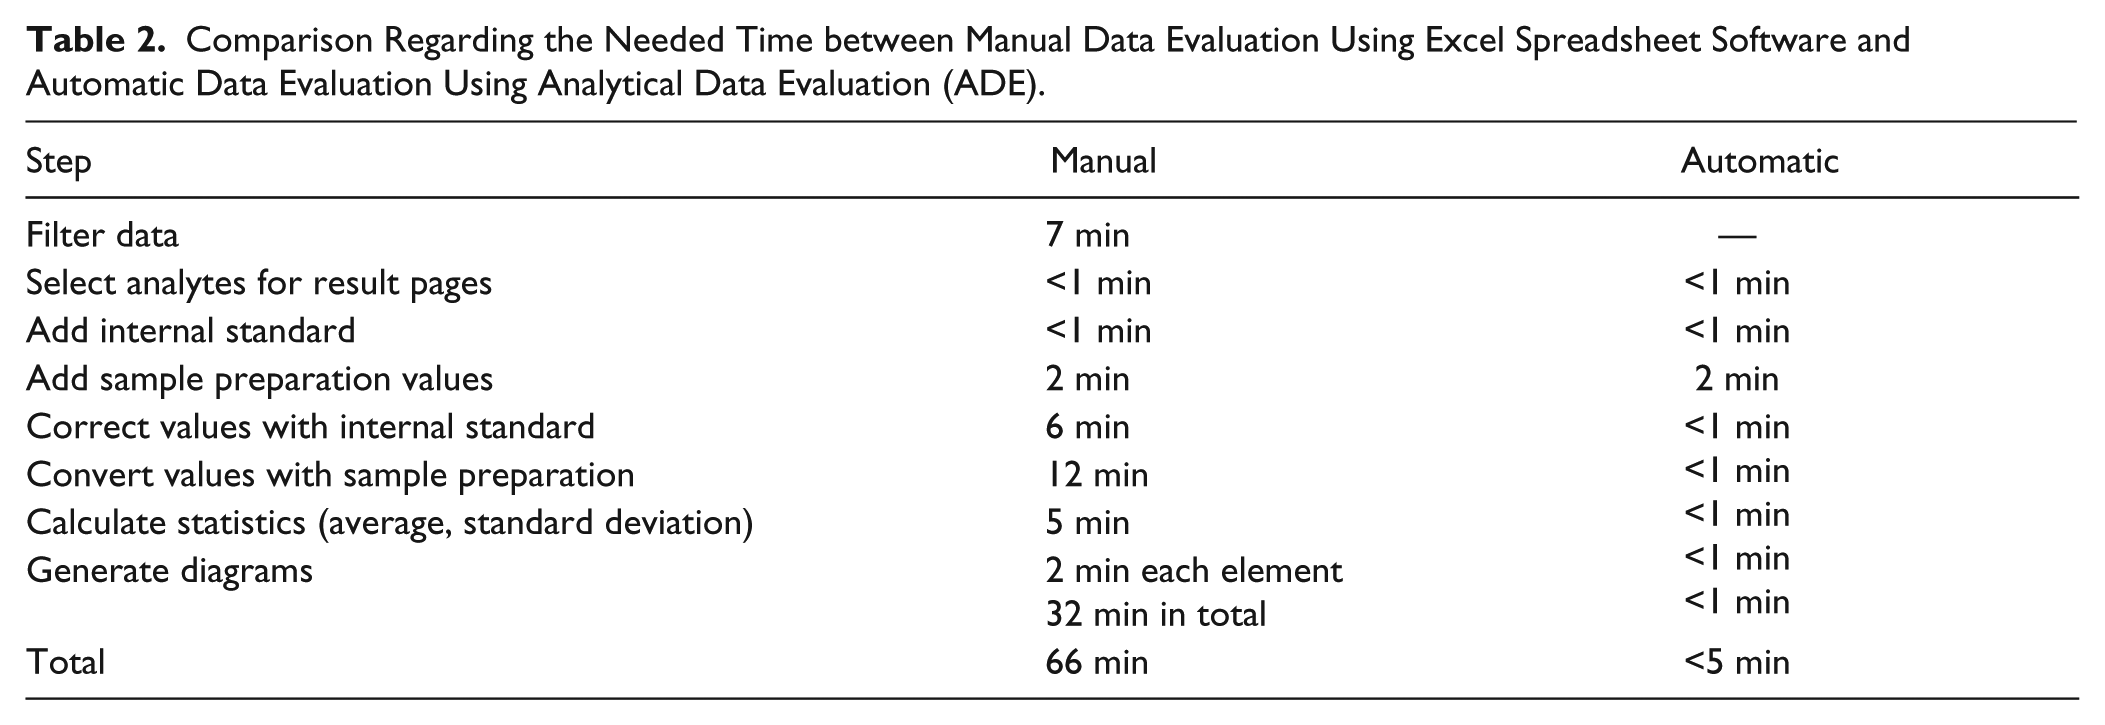
The measurement series contains the calibration samples, the blank samples to flush the instruments, and the samples for the repeatability measurement, 67 measurements in total. Thereby, the concentration of 17 different elements with partly different collision/reaction modes (no-gas mode, helium [collision] mode, hydrogen [reaction] mode) was detected. Altogether, the measurement series includes 1273 data points.
For the data evaluation, only the 24 samples of the repeatability measurements are important. Also, the internal standard (lutetium—175Lu) used by the ICP-MS and the second internal standard (rhenium—185Re) to correct possible errors occurring during the sample preparation are not relevant. Thus, the exported table from the MassHunter software has to be filtered to reduce the provided to the required information for the final data evaluation. After filtering the table, additional information for the sample preparation (weighted portion, volume, and dilution) and the value for internal standard were added. Thereafter, the values were corrected with the internal standard and converted to the required unit using the sample preparation information. Finally, the statistical values (average and standard deviation) were calculated and the diagrams were generated.
The time-consuming steps are the filtering of the data, correction, converting and calculating the results, and especially generating the diagrams ( Table 2 ). For the automatic data evaluation using the ADE software, the filter process is done by an algorithm that analyzes the information tags inside the sample names. The user only has to select the elements to be shown in the final table. Also, the calculation of the results and the generation of the diagrams are done by an algorithm without any manual assistance. Only the input of the required data, such as the sample preparation values, could not be reduced because these steps are necessary for both manual and automatic. For this measurement series, the time required for the data evaluation could be reduced by more than 92%.
Besides the tables with the numeric results, diagrams are generated ( Fig. 4 ). These diagrams contain the final concentration of each sample inside the measurement series (black bars) as well as the average (dark blue line) and standard deviation (light blue area). Thus, the user gets a good overview about the measured and calculated results.
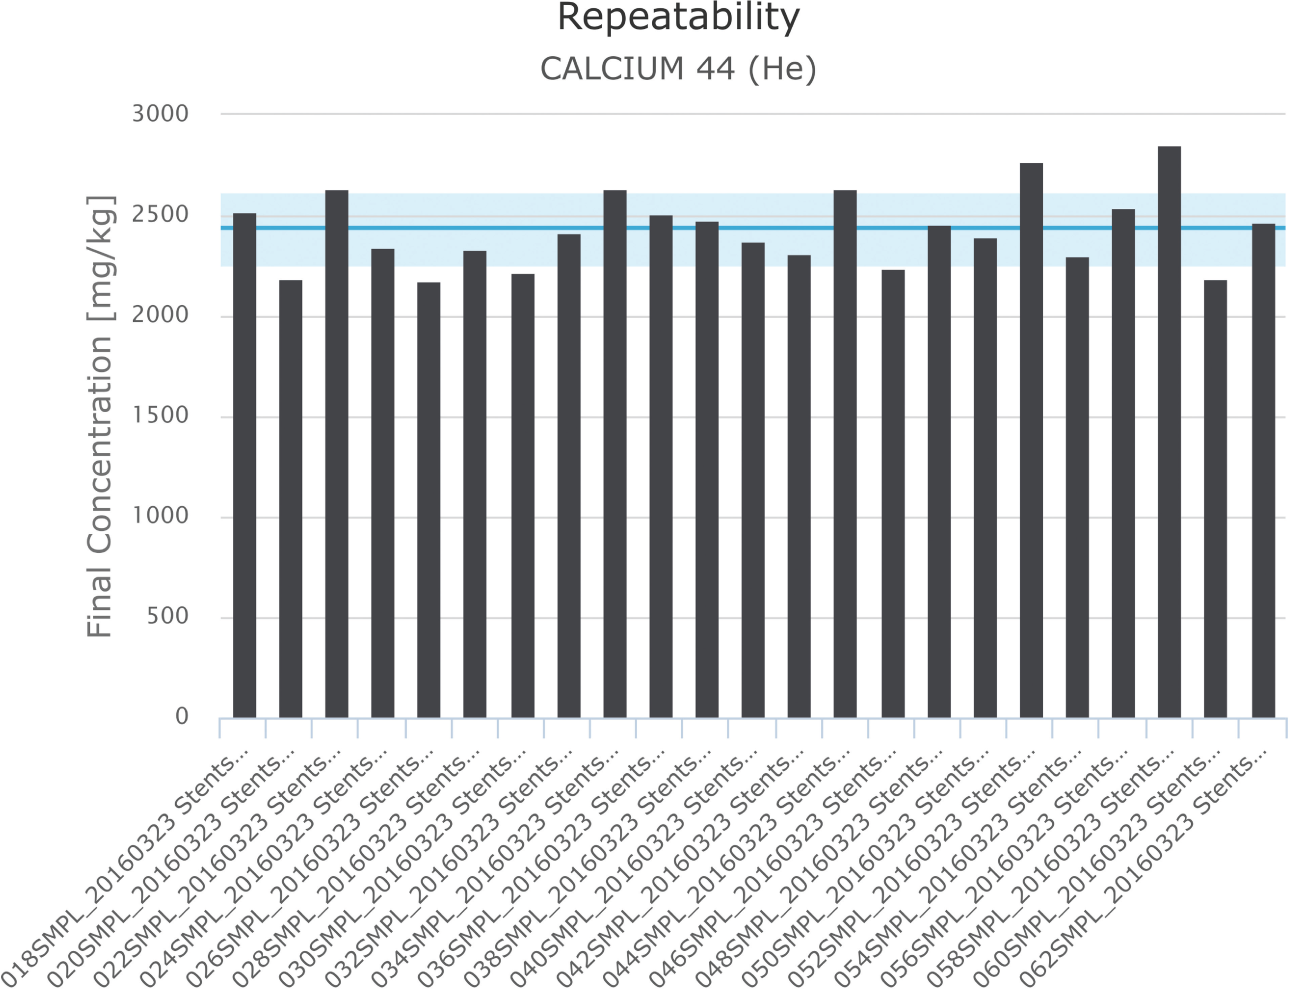
Repeatability measurement result for calcium (final concentration, average and standard deviation).
In conclusion, Project ADE enables a fast and effective, automated, and standardized data evaluation of measurement data from various analytical devices for elemental and structural analysis.
The user can integrate new analytical devices fast and easily without programming knowledge. Using the Data Upload software on the device computer, the upload process for the generated export files from the device software can be automated. A full automation is possible, if the device software allows an automated generation of these XML exports.
The uploaded data are saved in a database on the web server, which allows a multiuser environment. This is necessary because the user accesses the data via a web application using a web browser. So every Windows, Macintosh, or Linux computer or mobile device such as smartphones or tablets can reach the same data. An integrated web service allows the connection to the database and functionalities for other software or machines (e.g., Data Upload software).
To identify the samples, an information tag following a special naming convention was introduced. Thus, an algorithm sorts the samples included in the measurement series and calculates the results.
The result pages give an overview about the calculated results for the different calculation types. These results are shown in tables and diagrams on different information levels (general, for one analyte or sample).
In future work, the integration of several other analytical instruments using optical spectroscopy or mass spectrometry should be tested. Furthermore, additional file formats, such as the comma-separated values (csv), will be supported. In addition, an intelligent decision maker will be included to help the user interpret the chromatograms and mass spectra in the right way to quantify the right chemical compound. Therefore, the results of structural and elemental analysis will be combined with additional information (e.g., source) for the sample and the possible compounds.
Thus, Project ADE allows a standardized data evaluation for multiple applications (e.g., routine tasks and method validation) that are necessary in the daily laboratory routine. This simplifies the necessary steps and eliminates the time-consuming manual steps.
Footnotes
Declaration of Conflicting Interests
The authors declared no potential conflicts of interest with respect to the research, authorship, and/or publication of this article.
Funding
The authors disclosed receipt of the following financial support for the research, authorship, and/or publication of this article: Financial support was provided by the Federal Ministry of Education and Research (BMBF, Germany) (FKZ: 03Z1KN11; 03Z1KI1).