
Abstract
The monitoring of chemical reactions is an important task in chemical engineering, especially in quality control, pharmaceutical and biological processes, or industrial production. The development of new reactions such as catalyst-based procedures requires detailed knowledge about process steps and reaction kinetics. For qualitative and quantitative analysis of reactants and resulting products, proprietary online measurement systems are used, which were designed for special applications. A mobile online reaction monitoring system was developed for a flexible coupling to different mass selective measurement systems for structural (ESI-MS) and elemental (ICP-MS) analysis to determine chemical precursors, reaction products, and internal standard compounds and their elemental composition at any stage of the reaction. Chemical reactions take place in a tempered continuous-flow microreactor. The flow rate in the microreactor can be varied to adjust the residence times in the reactor. An online dilution module was integrated to adapt the concentration of the reaction solutions to the working range of the analyzers. The performance and limitations of the online reaction system were determined using standard solutions and a real chemical reaction. The control software with a graphical user interface enables the adjustment of reaction, sampling, and measurement parameters as well as the system and process control.
Keywords
Introduction
Monitoring of chemical reactions in real time is an important tool in chemistry and chemical engineering. In research and development (R&D), reactions can be designed and optimized to increase product yields, improve product purity, reduce side reactions and therefore by-products, reduce production costs, and minimize risks from unexpected processes. In manufacturing, online monitoring supports operators in process design and optimization and enables an early intervention in case of unexpected behavior. In academic studies, the real-time data allow researchers to determine reaction kinetics and mechanisms of reactions that can be exploited for online reaction optimization or for synthesizing new compounds.
Different measurement techniques can be applied for online reaction monitoring, including spectroscopic techniques such as infrared (IR), Raman, ultraviolet-visible (UV/VIS), and nuclear magnetic resonance (NMR) spectroscopy, as well as other methods, including calorimetry and mass spectrometry (MS), electrochemistry, and chromatography-based techniques. 1 For spectroscopic methods such as IR and UV/VIS, the absorbance/emission spectrum is used to identify functional groups or chemical bonding of compounds, allowing the identification of species and study of reaction mechanisms. 2 In addition, by using standard calibration solutions, concentrations of educts or products as a function of time can be derived and employed to determine reaction kinetics. These methods are limited in case of unknown sample compositions or overlapping matrices. For NMR, the absorption spectrum of radio waves by nuclei (of some combined atoms in molecules) in a magnetic field is used for studying the shape, structure of molecules and their concentrations, chemical equilibria, reaction kinetics, motion of molecules, and intermolecular interactions.3,4 Interferences with matrix molecules or sample impurities may limit the information content. MS is based on the separation of ions with respect to their mass-to-charge ratio (m/z). Information regarding the structural and elemental composition of molecules as well as their concentrations can be derived from mass spectrometric data.4,5 Due to the high selectivity, MS can flexibly be adapted to different applications and can be used for the determination of unknown sample compositions as well as for complex matrices.
Combinations of microreactors and various types of analyzers have been realized and documented in the literature. In some configurations, reagents from the microreactor are directly sent to the analyzer, for example, by coupling its output to an electrospray ionization (ESI) ion source. 6 Other configurations use the flow injection analysis (FIA) concept. A liquid sample is injected into a moving, nonsegmented, uninterrupted carrier solvent flow in the analyzer. 7 In addition, samples can be monitored directly inside the microreactor or while passing through flow-through cells.8,9 Some microreactors are embedded with waveguides or optical fibers that enhance triggering and receiving signals as well as the system’s flexibility.10,11
In general, chemical reactions are performed with highly concentrated reaction components, higher than the working range of the measurement system. In the case of mass selective analyzers, this may result in instrument contamination, detector overload, poor signal shapes, and decreased detector lifetime.12,13 Different approaches have been reported to overcome these disadvantages. Modifications of the ionization techniques, such as low-temperature plasma (LTP), extracted electrospray ionization (EESI), and direct analysis in real time (DART), are possible solutions. 14 This approach shows the capability to analyze chemical reactions at molar concentrations. However, a dilution of the analytical solution provides more flexibility, especially within the scope to perform various applications. 15 Several principles are used in dilution systems, such as the variation of the ratio of the input flow rate, the frequency, the time, or the volume.15–18
Different control systems for online reaction monitoring systems (ORMSs) have been reported: manually operated reactor systems using buttons directly on the devices6,19 and individually controlled system components using in-house software 5 or software modules written in LABVIEW.20,21 At a higher control level, automatic control solutions using feedback data from the analyzer have been applied, whereby the control algorithms are usually realized in MATLAB.22–24 Furthermore, a modular software system operating via Internet is presented for monitoring chemical reactions, control, and autonomously self-optimizing the reaction parameters. 25 Evolutionary algorithms, design of experiments (DoE), and kinetic parameters are used for the optimization. 26
However, these systems are limited in their applicative flexibility. Typically, an ORMS is coupled to only one measurement system. In addition, flexibility is also required in the adjustment of the concentration of the reactor output prior to analysis of the working range of the measurement system. Thus, online dilution modules able to work with varying flow rates are required. In this study, an automated ORMS has been developed that is coupled to a mass spectrometer with electrospray ionization (ESI-MS) for structural analysis and alternatively coupled to an inductively coupled plasma mass spectrometer (ICP-MS) for elemental analysis, such as metal detection and monitoring catalytic reactions.27–32 Several integration concepts between the microreactor system and the measurement systems have been developed and practically investigated. The system provides the adjustment of reaction parameters such as flow rate and reaction temperature using an external heating module. Two sampling methods have been developed and validated allowing measurements of multiple identical samples (replicate measurements) for the desired reaction stadium or rapid measurements with low material consumption using single samples per reaction stadium. A dilution module with flow compensation allows the system to work with highly concentrated solutions at different flow rates. The ORMS control software is used for setting the reaction and sampling parameters. The measurement parameters and the measurements are controlled by integration of the device software into the ORMS control software, providing a fully automated workflow.
System Concept and System Design
System Components and Hardware
The ORMS is divided into several subsystems for delivering the starting solutions, reaction, dilution, coupling to the analyzer, measurement, and data evaluation. Figure 1 gives an overview of the general system structure.
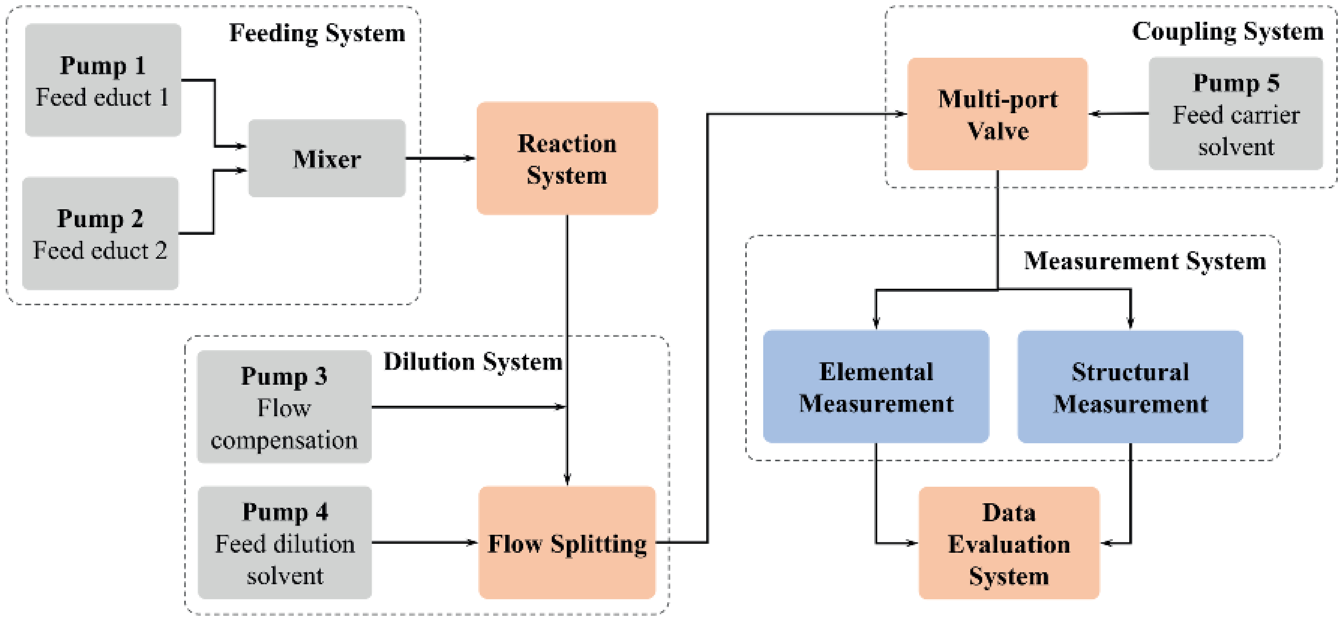
General structure of the ORMS.
The starting solutions (educts, reactants, catalysts, etc.) are transferred into the meander microreactor with a volume of 11.2 mL (Ehrfeld Mikrotechnik BTS, Wendelsheim, Germany) using two high-performance liquid chromatography (HPLC) pumps, WellChrom K-501 and Smartline 100 (Knauer, Berlin, Germany). The ratio of the solutions transferred by the pumps and the reaction time (residence time in the microreactor) can be adjusted by variation of the pump flow rates.27,28 The reaction time is also called reaction stage since it embodies a certain duration of the chemical reaction—the time for sampling in reaction monitoring.
The temperature in the microreactor is controlled by a refrigerated/heating circulator F26-HP (Julabo, Seelbach, Germany). The microreactor has a built-in liquid heat exchanger and the heating source does not contact the sample solution. An additional heating plate (Cole-Palmer, Vernon Hills, IL) was placed under the microreactor base plate to enhance the tempering process. This configuration stabilizes the temperature of the reaction solutions with varying flow rates in the microreactor since the upper and lower surfaces of the microreactor are heated. This ensures a homogeneous temperature distribution in the microreactor. The temperature module provides a heating rate of approximately 5 °C/min and a cooling rate of approximately 1 °C/min. This heating performance is limited by the amount of materials to be heated, including a volume of heating liquid of 4.5 L and a weight of the microreactor block of 2200 g. In addition, the small port size of the microreactor reduces the flow rate through the heat exchanger and thus also limits the heat exchange.
The microreactor output is directly connected to the dilution module. The main part is an active splitter G1968D (Agilent Technologies), which splits the reactor output flow and mixes it with dilution solvent, which is provided using an HPLC pump WellChrom K-501 (Knauer, Berlin, Germany). The split factor defines the amount of reactor output transferred to the dilution solvent by variation of the switching frequency in the range from 0.2 to 2 Hz and of the aliquot volume (22, 100, and 300 nL). An additional pump was integrated for flow compensation since the flow rate of the reactor output varies and the active splitter requires a constant flow. If the reactor output flow rate is less than 3 mL/min, an HPLC pump (G1310A; Agilent Technologies) stabilizes the split flow. 30 In the automated dilution process, the split factor, the dilution, and compensation flow rates are automatically calculated and selected based on the desired dilution ratio and reaction stages to be monitored. Figure 2 shows the general structure of the dilution module.
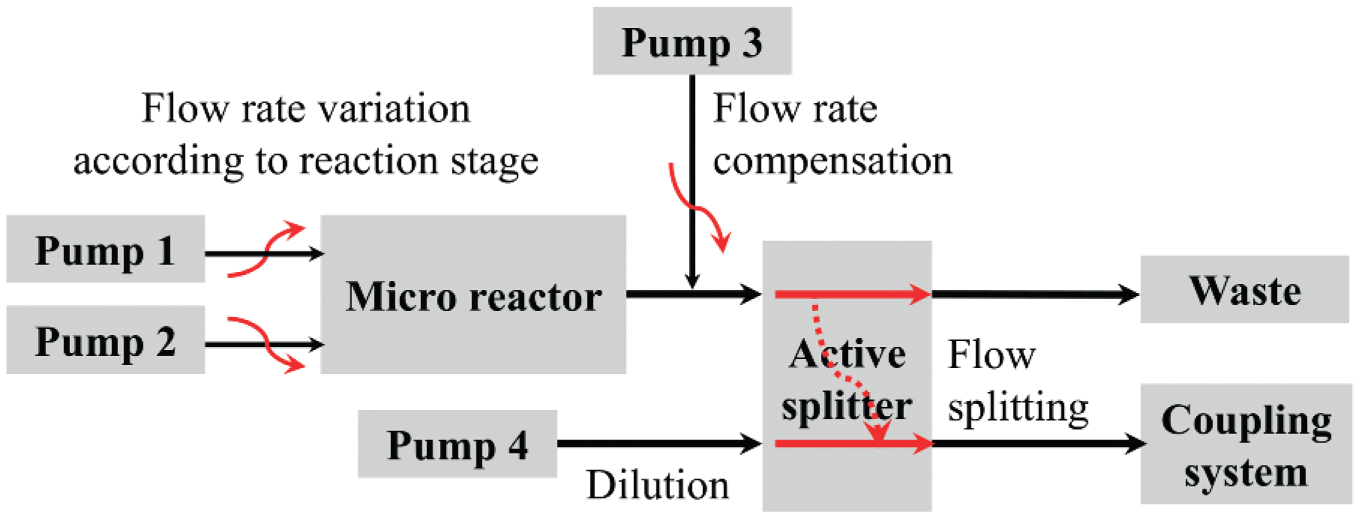
Structure and components of the dilution module: pumps 1 and 2, starting solution provision; pump 3, flow rate compensation to ensure a stable flow rate at the active splitter input; and pump 4, dilution solvent provision.
For structural measurements, a time-of-flight ESI-MS (G1969A) is used with the instrument’s MassHunter Acquisition and MassHunter Qualitative Analysis software for data acquisition and preprocessing (Agilent Technologies). In elemental monitoring, an ICP-MS (7700x) with the MassHunter Workstation software for ICP-MS was integrated (Agilent Technologies).
The output of the dilution module is connected to a switching multiport valve C10UW (Valco Instruments, Schenkon, Switzerland). Various coupling configurations are possible depending on the connected analyzer (ESI-MS or ICP-MS). The sampling via a sample loop (5 µL volume) is used in two configurations (
Figs. 3-1
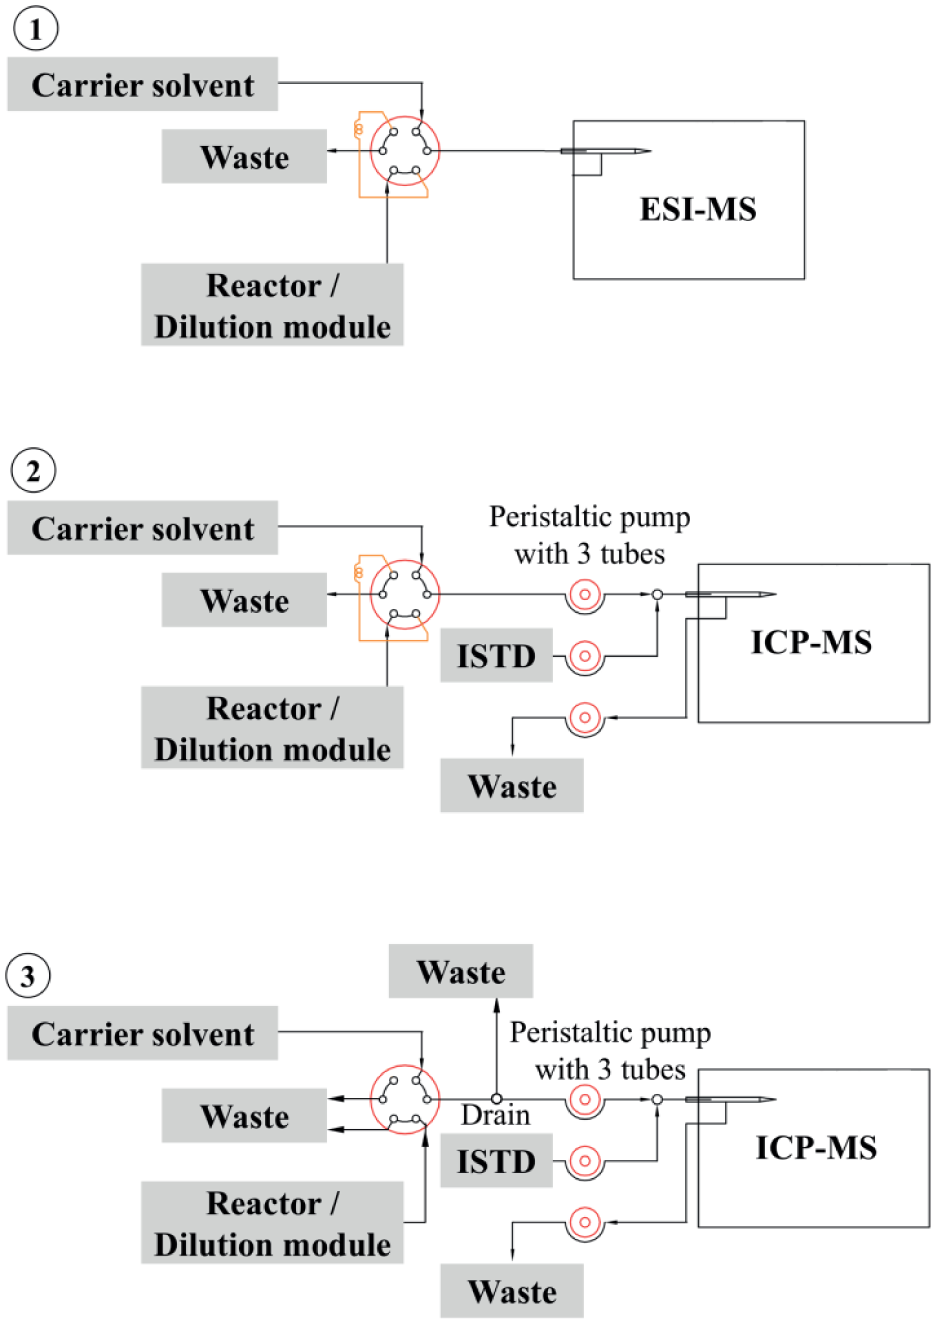
Coupling configurations: (1) connection to ESI-MS via sample loop, (2) connection to ISP-MS via sample loop, and (3) connection to ICP-MS via direct sample stream and drain for stable flow rate.
The mobile design of the ORMS enables the transportation to different measurement systems. The total ORMS is shown in Figure 4 (excluding the measurement instruments).
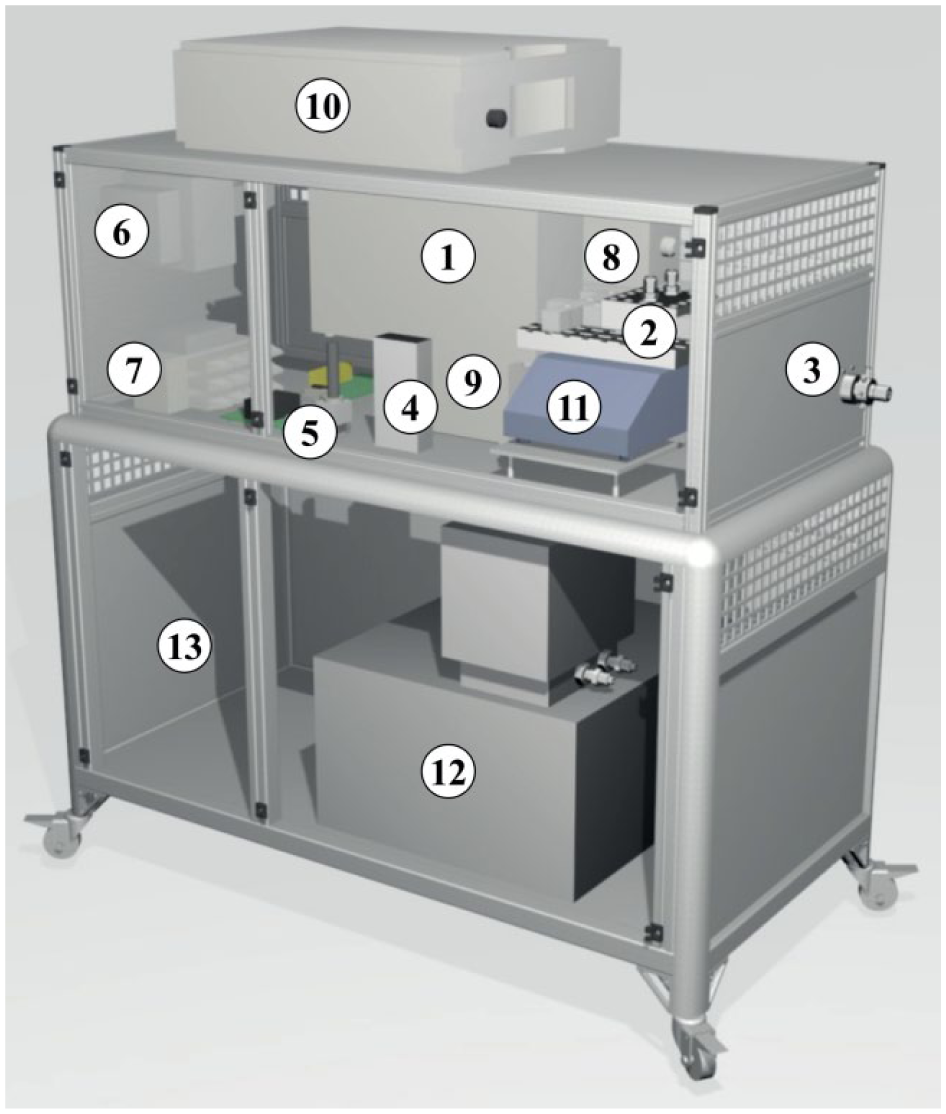
3D CAD view of the ORMS: (1) HPLC pumps to provide two starting solutions, (2) microreactor, (3) multiport valve for sampling, (4) flowmeter, (5) microannular gear pump to provide carrier solvent flow into the measurement system, (6) power supply, (7) communication hub and electronics, (8) active splitter, (9) HPLC pump to provide dilution solvent, (10) HPLC pump for flow compensation during the dilution process, (11) heating plate, (12) heating/cooling circulator, and (13) space for storage and waste bottles.
Software Structure and System Control
The data communication to the ORMS subsystems is performed via RS232 interfaces. The communication between the RS232 hubs and the control computer uses the USB interface. The control software programmed in C++ (ORMS software) is divided into several functional modules, including the measurement mode (manual, automated), reaction parameters (pump flow rates, temperature), dilution parameters, and the software control of the external device software of the measurement systems. The graphical user interface (GUI) provides user-friendly tabs with input fields for adjusting the detailed parameters. The current status of the main components is monitored in a separate section of the GUI, and the system activities are stored in a log file after each system action. After the data processing, the measurement data is exported to an Excel file. Figure 5 gives an overview of the functionalities of the ORMS and the GUI of the control software.
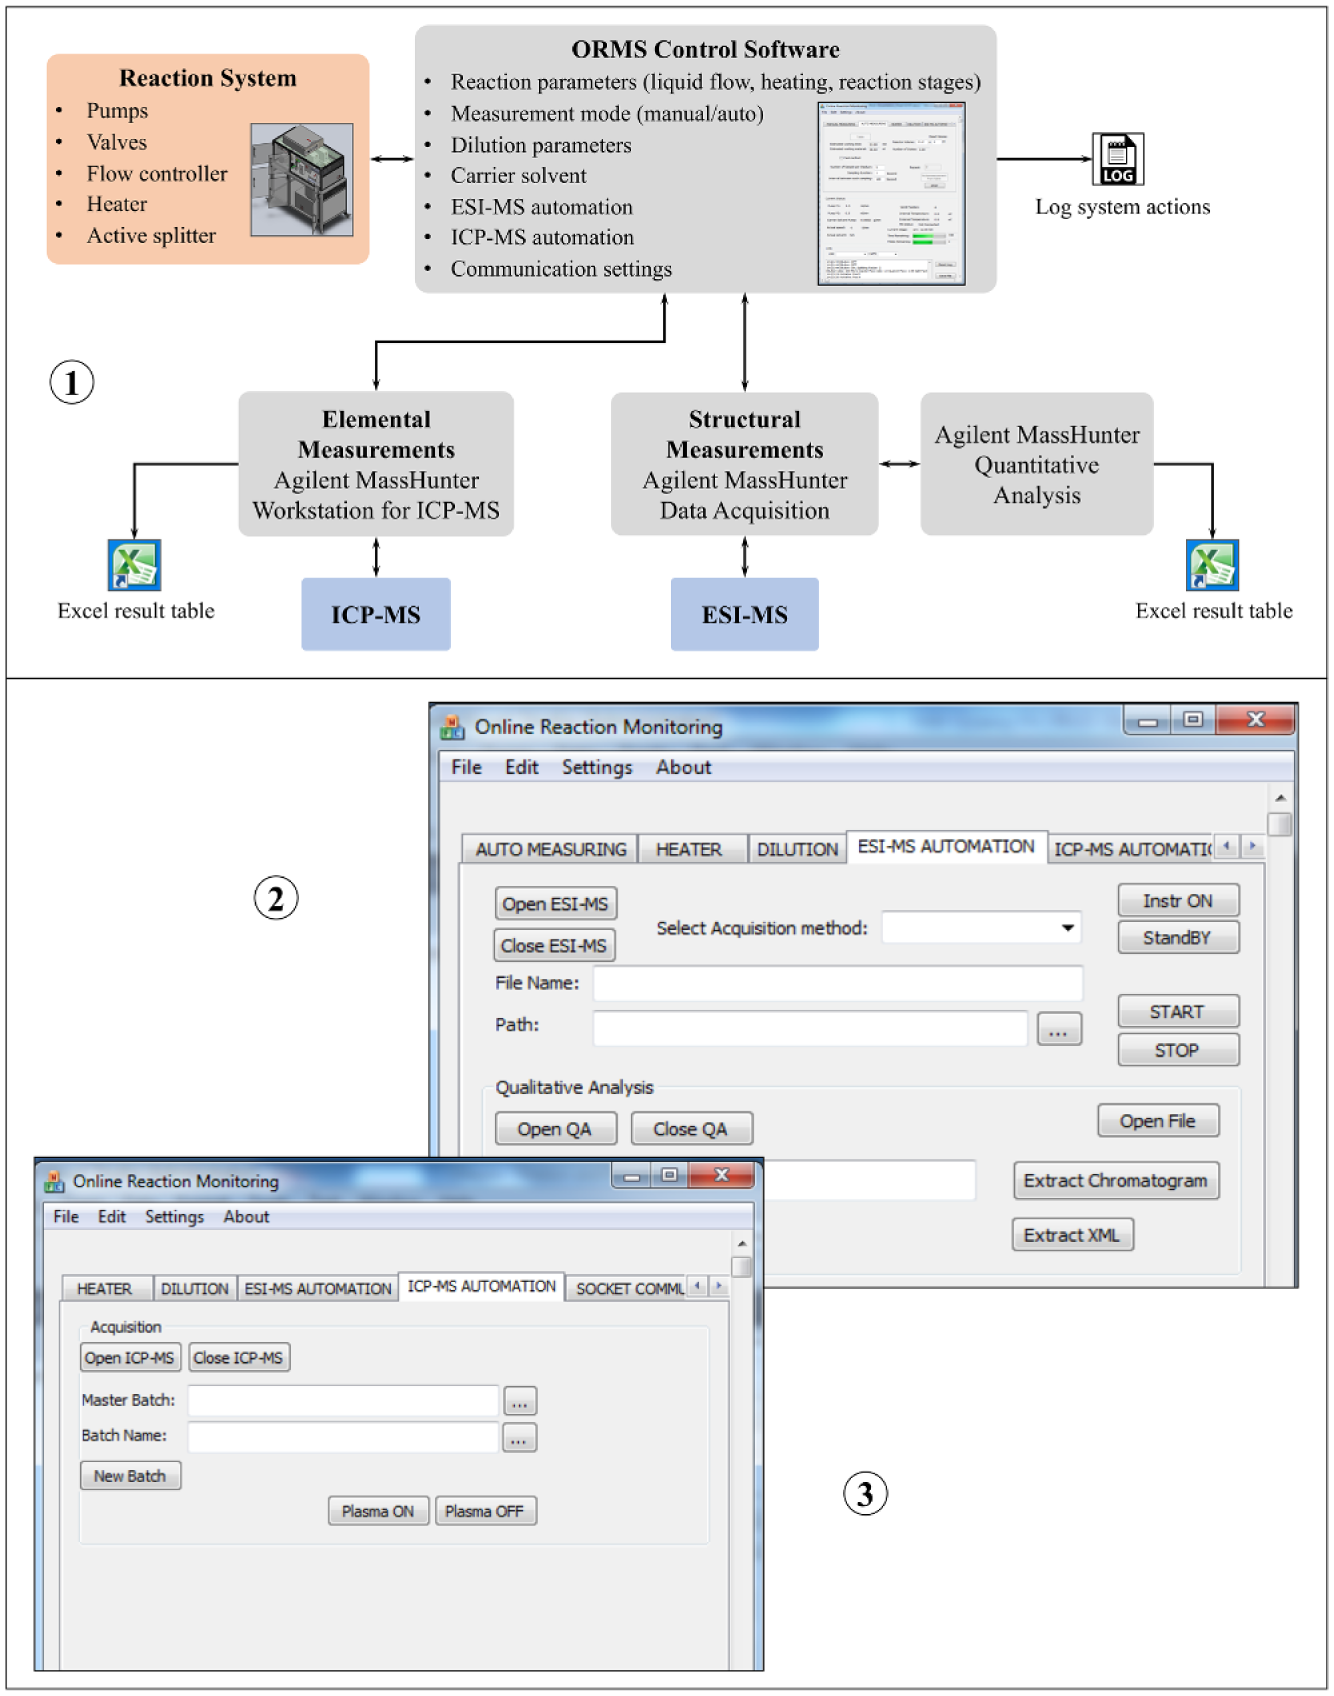
Control software of the ORMS: (1) general overview of the functionalities, (2) GUI tab for adjustment of the parameters of structural measurements (ESI-MS), and (3) GUI tab for adjustment of the parameters of elemental measurements (ICP-MS).
GUI automation can be done via the Windows application programming interface (API) or using utilities such as UIPath Studio, 33 Automa, 34 SeleniumHQ, 35 JUnit, 36 AutoHotKey, 37 and AutoIt Scripting Language.38–40 AutoIt is a freeware BASIC-like scripting language. It was designed for automating the Windows GUI and enables scripting tasks using mouse clicks, keyboard control, and control actions. In addition, the library can be conveniently incorporated to existing C++ code. For these reasons, AutoIt was selected for the GUI automation purpose for integrating the software of the measurement devices into the ORMS control software to realize a fully automated workflow. 29
The imitation of mouse movements and clicks as well as keystrokes requires that the controlled GUI is active and shown on the top window. This is a limited method since the coordinates of the controls on the screen depend on the screen size and resolution. 39 Another approach obtains handles of the windows/controls (e.g., on the GUI of the measurement instruments software) before sending commands. The controlled GUI does not need to be on the top window, and the handle is specific to a window/control. Although the handle is not always obtained and is subjected to changes after new software launches, 40 the control action approach (using a control ID such as “name” and “text”) is combined with menu control via keystroke to fulfill most of the automation tasks. The implementation was realized by sending commands via the SciTE Script Editor. In the ORMS software, the library of AutoIt was used by incorporating the files AutoItX3_DLL.dll, AutoItX3_DLL.lib, and AutoItX3_DLL.h into the project ( Fig. 6 ). Using these techniques, basic functionalities of the control software of the measurement systems (ESI-MS and ICP-MS) have been successfully automated, such as open and close the software, select an acquisition method, start and stop the acquisition process, and monitor the current instrument status (start, busy, standby, etc.).
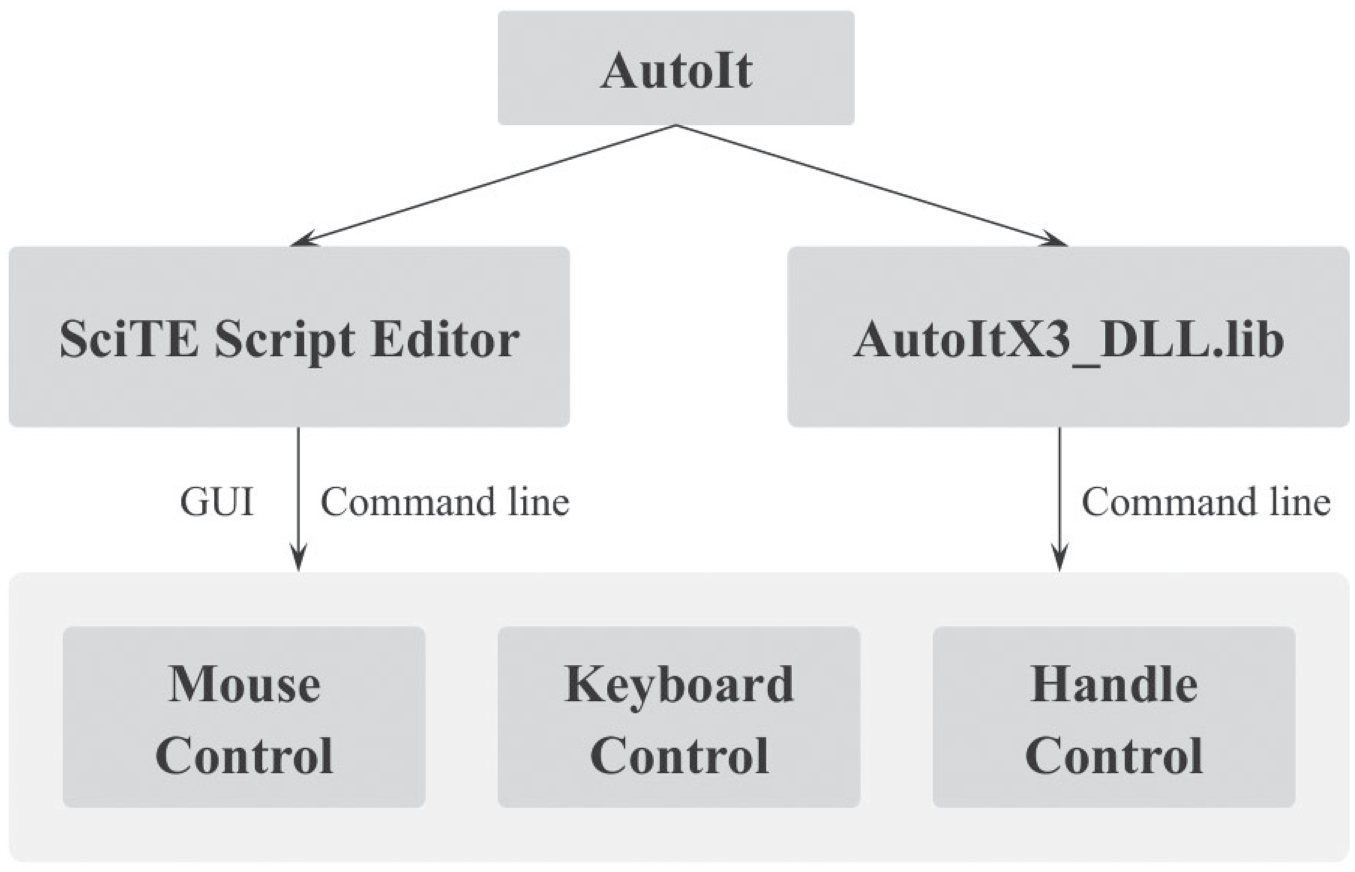
General strategy for GUI automation using AutoIt to control external software.
General Operation Principle
The ORMS can be manually operated or in an automated workflow. Independent from the operation mode, the user defines the reaction parameters (temperature, dilution factor) and the carrier solvent for the sample transfer into the analyzer. In manual operation, the flow rates of the pumps providing the starting solutions are set by the operator depending on the desired reaction stage to be monitored. The sampling is manually performed by switching the multiport valve using the control software at the desired time. The measurements are also manually executed.
In automated operation, a measurement series is defined by the operator. Therefore, the operator sets the reaction stages to be monitored (in minutes) and the required flow rates are calculated by the software. The user selects one of two possible sampling methods depending on the monitoring aim (see the following section). After the selection of the measurement instrument and of the method and worklist (ESI-MS) or the batch (ICP-MS), the automated monitoring run can be started. The measurement results are automatically exported in Excel files for further data processing and evaluation.41–45
Sampling Methods
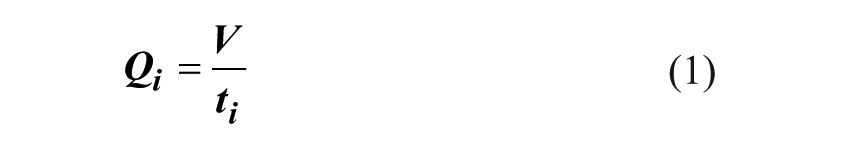
Suitable sampling methods are required for economic operation with less time and material consumption. Two sampling methods were developed for the sequential monitoring of a series of reaction stages in one run (multiple reaction stages). The slow sampling method (SSM) operates with a constant flow rate for each reaction stage ti. The flow rate (Qi) is calculated using the total reactor volume (V) and the reaction time of stage ti (eq 1).27,28
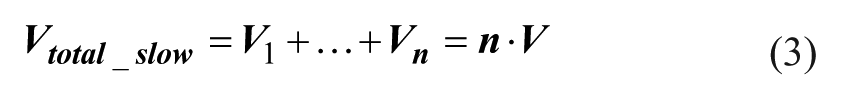
The total operation time and the material consumption can be calculated according to eqs 2 and 3. 28

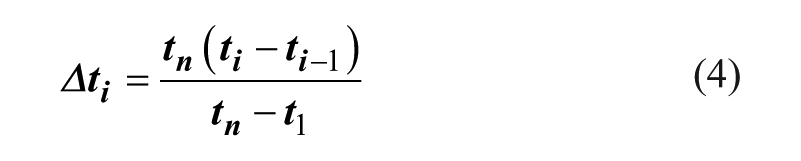
The idea of the fast sampling method (FSM) is to exploit the reaction time that has elapsed in previous reaction stages to begin a new stage.27,28 After the measurement of the first reaction stage is finished, the flow rate for all following reaction stages is set to that of the last reaction stage n (slowest flow rate). The additional waiting time for sampling (Δti) to monitor other stages between the first and the last stage can be calculated according to eq 4.
The total operation time and the total material consumption are equal to the summation of the first stage t1 and the last stage tn, according to eqs 5 and 6.

The required sampling method is selected depending on the monitoring task. SSM is predestinated to measure multiple samples at one reaction stage before the next reaction stage is adjusted. This is interesting especially for the determination of repeatability, recovery rate, and measurement precision. FSM is perfect for providing a quick overview of the reaction behavior with less time and material consumption.
Materials and Methods
Chemicals and Standard Solutions
The performance of the sampling methods and the temperature module was determined with a model reaction. The functionality of the dilution module was evaluated using a standard solution. The elemental monitoring was also performed with defined elemental standard solutions in various concentrations. The following chemicals and standards were used. Acetonitrile Rotisolv (HPLC gradient grade), methanol (MeOH; HPLC gradient grade), acetic acid Rotipuran (100%), and acetic anhydride Rotipuran (⩾99%) were purchased from Carl Roth (Karlsruhe, Germany); N-formyl-
Measurement Parameters
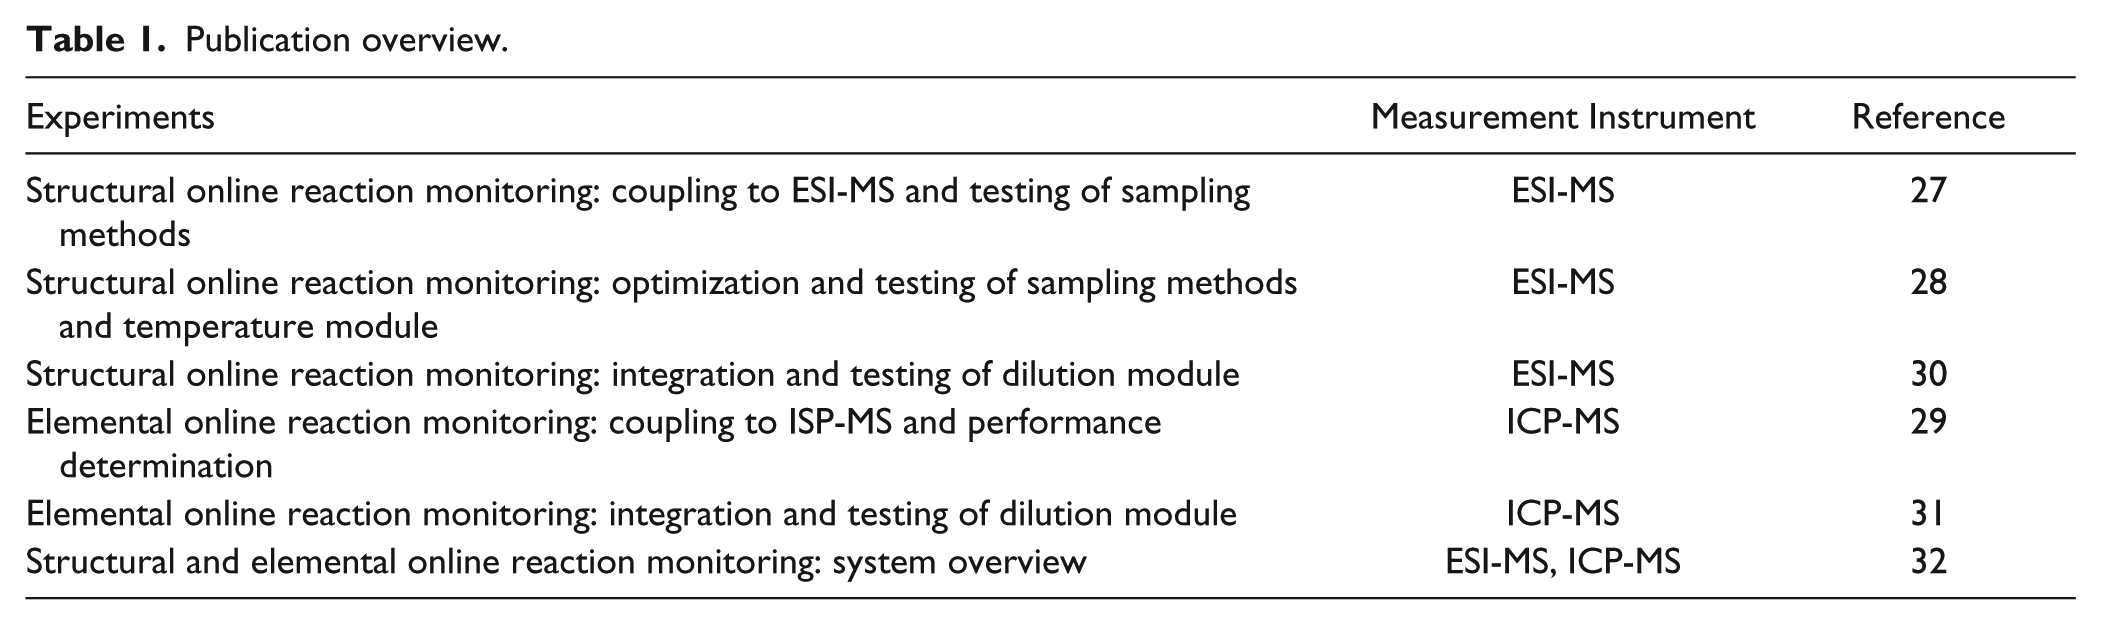
The measurement parameters have been described in detail previously. Table 1 gives an overview of the experiments performed and the related references.
Publication overview.
Results and Discussion
Structural Monitoring and Sampling Methods
The performance of the sampling methods was tested using an acetylation model reaction (
Fig. 7
). The starting material,
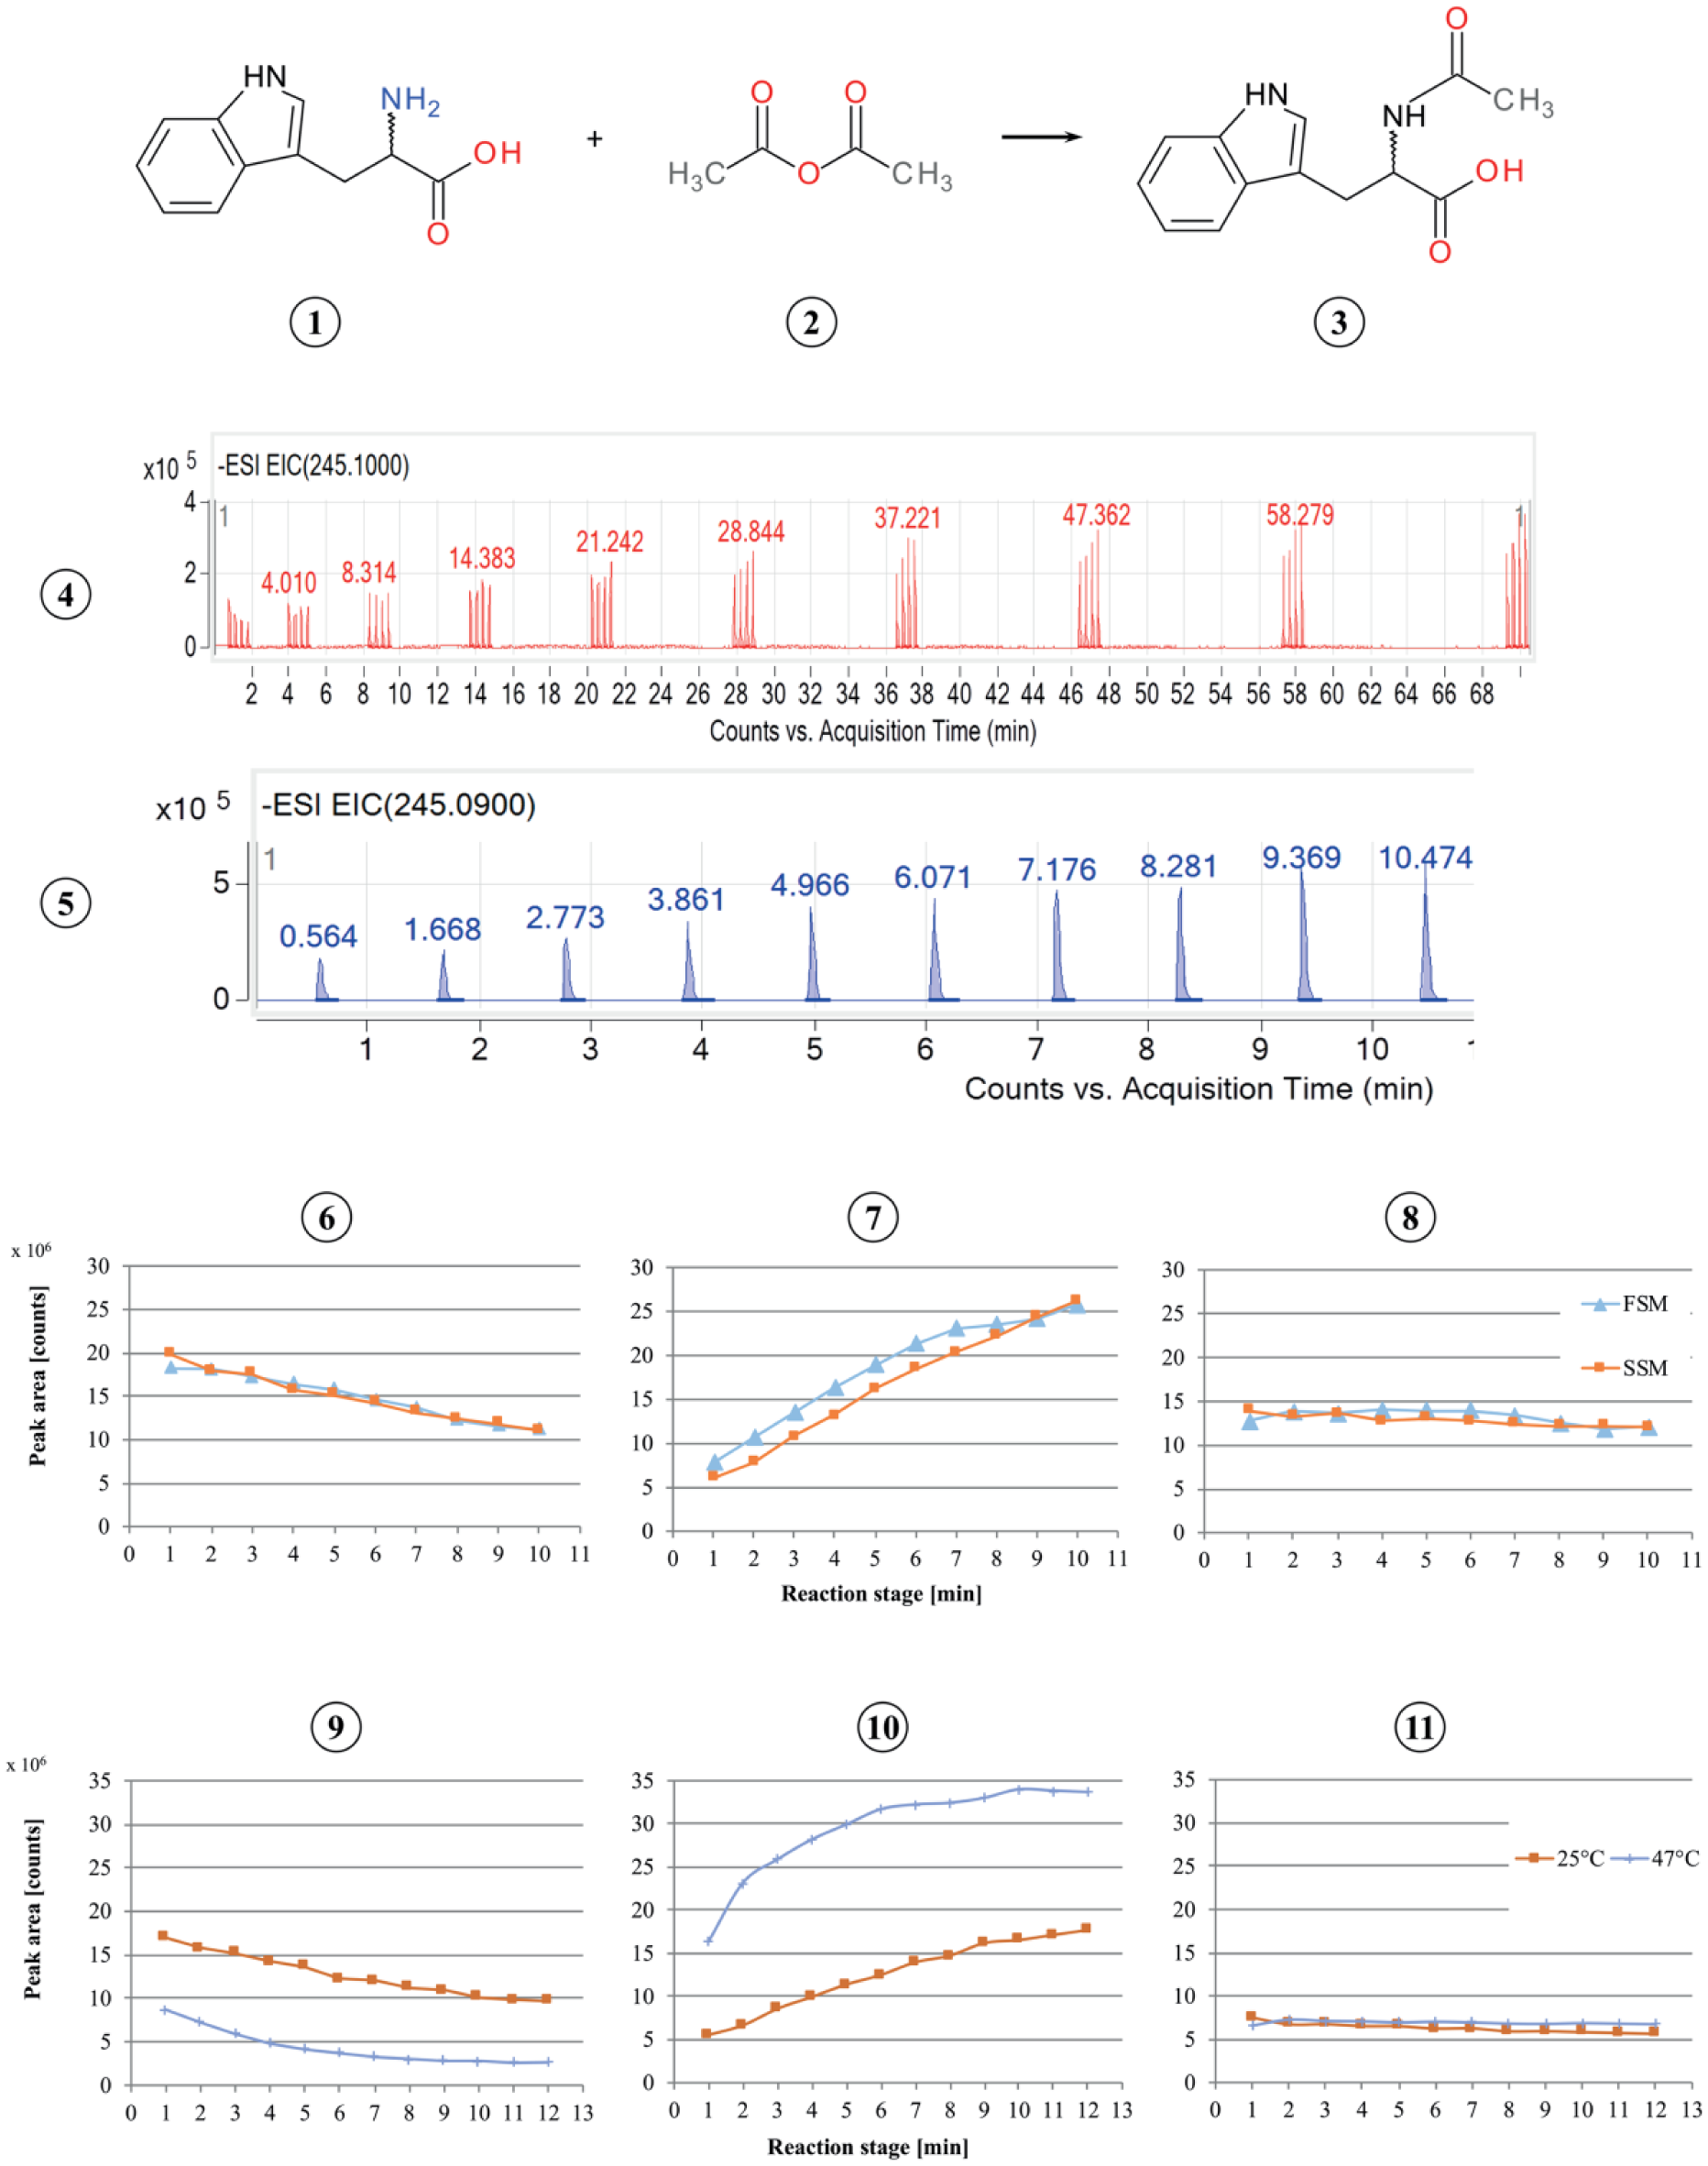
Acetylation model reaction of tryptophan: (1)
The reaction was monitored at 10 reaction stages from 1 to 10 min in 1 min steps using SSM and FSM. In
Figure 7
, the measurement signals of the reaction product NAT (ion mass m/z = 245.10) are shown; they were acquired using SSM (each reaction stage with four replicate measurements) and FSM (each reaction stage with one measurement). The measurement signals for the ions monitored show a decreasing amount of the educt
Measurements performed using SSM or FSM differ in their required process time and the consumption of reaction solutions. For comparison, 10 reaction stages were monitored with one sampling per reaction stage for the two methods. Measurements using SSM consume at least 55 min process time and 112 mL reaction solutions. In contrast, measurements using FSM require only 11 min process time and 22.4 mL reaction solutions—this is a reduction of approximately 80%. The efficiency can be varied by measuring multiple samples (replicate samples) in SSM. Detailed measurement results are documented in separate publications.27,28
SSM has the advantage in that a multiple sampling can be realized for each reaction stage to be monitored due to a constant reaction time at every position in the reactor for each reaction stage. Multiple sampling is not possible in FSM. Moreover, the reaction flow in FSM is more disturbed by the sampling of each reaction stage than in SSM. This results in a lower repeat accuracy of FSM with coefficients of variation (CVs) between 10% and 30% in comparison with SSM, with CV values of about 3%–12%. 27 The CV values were improved to a maximum 23% due to an optimization of FSM. 28 In contrast, FSM has the advantage of fast data acquisition. Therefore, this method is predestinated to realize short processing times and for processes with limited amounts of reaction solutions. 28
Furthermore, the model reaction (acetylation of tryptophan) was executed at different reaction temperatures. The amount of reaction components (starting solution, reaction product, and internal standard) was measured in five runs (measurement series) at reaction stages from 1 to 12 min in steps of 1 min at 25 °C (77 °F) and 47 °C (116.6 °F) using FSM. The signal intensity of the educts (
Dilution Module
The general functionality and the precision of the dilution module were determined for both structural and elemental monitoring. For each experiment, a manual dilution was prepared and measured, and the results were compared with those achieved by automated dilution using the ORMS.
Dilution for ESI-MS Measurements
The manual and automatic dilution was performed using OS and 4-MOS in MeOH at four dilution ratios 1:500, 1:300, 1:100, and 1:50. For each dilution ratio, different reactor flow rates (4, 2, and 1 mL/min) were adjusted to simulate the different reaction stages. SSM was used for sampling with five replicates for each reaction stage (flow rate). Three stock solutions were prepared containing OS and 4-MOS in MeOH, each in the following concentrations: 45.5, 91, and 136.5 mg/L OS. Pure MeOH was used as the diluent by both dilution pump and compensation pump ( Fig. 2 ).
The average peak area (n = 3), the standard deviation (STD), and the CV were determined for each dilution ratio and reactor flow rate. The CV values range from 1.9% to 10.5%. In manual dilution, CV values from 3.9% to 6.4% were achieved. The recovery rates (calculated as percentage between manual and automated dilution results) are between 68% and 84%. More detailed measurement results are documented in a separate publication. 30 The CV values reached by automated dilution are slightly higher than those in manual dilution due to effects from varying flow rates. Furthermore, the abrasion of the rotor seal and the stator face assembly pair of the active splitter requires regular replacement to ensure stable precision and functionality.
Elemental Monitoring
The ORMS can be alternatively coupled to an ICP-MS 7700x (Agilent Technologies), which provides two acquisition modes. Spectrum analysis (SA) is the commonly used analysis mode in the qualitative and quantitative analysis of liquid samples provided in single vessels using an additional autosampler. The time-resolved analysis (TRA) mode is used for hyphenated ICP-MS. This means that the ICP-MS is coupled to previous liquid or gas chromatography (LC-ICP-MS, GC-ICP-MS). The chromatography outlet stream is continuously introduced into the ICP-MS and time-dependent signals are generated. Two integration concepts were developed to enable the use of these two acquisition modes within the ORMS. 29 The first concept uses a sample loop for sampling and the SA mode. In the second concept, the reactor outlet continuously flows into the ICP-MS and a TRA is performed (for coupling configurations, see Fig. 3 ).
ORMS Operation with ICP-MS in SA Mode
An automated liquid sampler (ALS; ASX-500 series; Teledyne CETAC Technologies, Omaha, NE) and the reactor/dilution output of the ORMS are connected to the multiport valve ( Fig. 3-3 ). The valve position realizes the connection of either the ALS (position A) or the reactor flow (position B) to the carrier flow into the ICP-MS via a peristaltic pump. The peristaltic pump determines the sample flow rate to the nebulizer. The drainage line with an adjustable back-pressure regulator is used to drain the reactor output flow, if this exceeds the accepted flow of the peristaltic pump (typically 0.1 rps, which corresponds to 0.4 mL/min). Using this configuration, the ICP-MS can be operated in common procedures, including plasma stabilization, tuning, creating a calibration curve, and (if required) manually measuring prepared samples using the ALS. After that, the multiport valve is switched and the reactor output can be directly introduced to the ICP-MS nebulizer and measured. This integration setup enables the quantitative analysis of samples using a previously generated calibration curve and the subsequent measurement of the reaction solutions (optional online dilution possible). 29
Several metals were detected in the sample solutions (contamination) due to the metal parts of the ORMS. For determination of the contamination amount, two solvent solutions were prepared and measured: nitric acid (1%, v/v, suprapure grade) and pure water (ultrapure grade). The metals iron (Fe) and chromium (Cr) showed concentrations in nitric acid (1%, v/v) of 1.27 and 0.70 μg/L, respectively. Some elements, such as Mn, Ni, Cu, and Al, contaminate samples with lower concentrations, for example, 0.16 μg/L (Mn) and 0.07 μg/L (Cu). The measurements using ultrapure water showed similar results with slightly lower element concentrations. As a result, these contaminations are very low but limit the use of the ORMS in ultratrace measurements. For measurement tasks in higher concentration ranges, the influence may be neglected. 29
Furthermore, the performance of the dilution module in elemental analysis was determined. Two stock solutions were prepared using CertiPUR ICP multielement standard solution IV (Merck, Darmstadt, Germany) dissolved in nitric acid (1%, v/v) and in ultrapure water to a final element concentration of 5 mg/L. These solutions were manually and automatically diluted at ratios of 1:1000, 1:500, 1:100, and 1:50. In automatic dilution, the microreactor flow rate was varied from 1 to 4 mL/min for each dilution ratio to simulate the adjustment of different reaction stages. The results in elemental analysis confirm the those achieved using the dilution system in structural analysis. Detailed measurement parameters and results achieved for several elements are documented in a previous publication. 31 Limitations can be found for measurements with varying flow rates, which currently results in higher CVs; this optimization is presently a research task. 31
ORMS Operation with ICP-MS in TRA Mode
In the initial state, the reactor output flow passes the sample loop to the waste and the ALS is connected to the peristaltic pump via the multiport valve. When the valve switches, the sample in the sample loop is withdrawn and introduced into the ICP-MS ( Fig. 3-2 ). In this configuration, the ALS is supplying the carrier solvent for the peristatic pump that is continuously introduced into the spray chamber of the ICP-MS. Similar to the experiments described above, the performance of the total system and the dilution module was determined using the TRA mode. The detailed measurement parameters and results achieved for several elements are documented in two previous publications.29,31
An ORMS realizing the coupling of a microreactor and measurement instruments for structural and elemental analysis has been developed and used in several practical applications. The integration of a dilution module, using an active splitter (dilution ratios up to 100,000 possible), enables the system to work with highly concentrated reaction solutions. The module can be operated using different solvents and is stable in different reactor output flow rates. The heating module provides a heating rate of about 5 °C/min in a range from −20 up to 180 °C. SSM allows multiple sampling for measurement of a number of replicate samples per reaction stage. FSM provides fast measurements with low material consumption. The ORMS is computer controlled—all actions can be adjusted and automated via the GUI. The ORMS software manipulates not only hardware devices but also the control software of the measurement instruments. Finally, several improvements of the system are current research tasks. This includes the integration of additional different types and sizes of microreactors realizing various measuring times and heating rates. Evolutionary algorithms or self-optimization could be applied to automatically influence reaction conditions by online reading data of the reaction.
Footnotes
Acknowledgements
The authors wish to thank the Federal Ministry of Education and Research Germany (FKZ; 03Z1KN11) and the Vietnam Ministry of Education and Training for the Project 911 Scholarship for financial support of this project.
Declaration of Conflicting Interests
The authors declared no potential conflicts of interest with respect to the research, authorship, and/or publication of this article.
Funding
The authors disclosed receipt of the following financial support for the research, authorship, and/or publication of this article: The authors received financial support for this project from the Federal Ministry of Education and Research Germany (FKZ; 03Z1KN11) and the Vietnam Ministry of Education and Training for the Project 911 Scholarship.