
Abstract
Laboratories today face increasing pressure to automate their operations as they are challenged by a continuing increase in workload, need to reduce expenditure, and difficulties in recruitment of experienced technical staff. Was the implementation of a laboratory automation system (LAS) in the Clinical Biochemistry Laboratory at Singapore General Hospital successful? There is no simple answer, so the following topics comparing and contrasting pre- and post-LAS have been explored: turnaround time (TAT), laboratory errors, and staff satisfaction. The benefits and limitations of LAS from the laboratory experience were also reviewed. The mean TAT for both stat and routine samples decreased post-LAS (30% and 13.4%, respectively). In the 90th percentile TAT chart, a 29% reduction was seen in the processing of stat samples on the LAS. However, no significant difference in the 90th percentile TAT was observed with routine samples. It was surprising to note that laboratory errors increased post-LAS. Considerable effort was needed to overcome the initial difficulties associated with adjusting to a new system, new software, and new working procedures. Although some of the known advantages and limitations of LAS have been validated, the claimed benefits such as improvements in TAT, laboratory errors, and staff morale were not evident in the initial months.
Established in 1821, the Singapore General Hospital (SGH) is Singapore’s oldest and largest acute tertiary hospital and national referral center. With about 1500 beds and a pool of more than 550 specialists, SGH accounts for about a quarter of the total acute hospital beds in the public sector and about one-fifth of acute beds nationwide. Annually, about 70 000 patients are admitted to the wards and another 600 000 attended to at the specialist outpatient clinics.
The Clinical Biochemistry Laboratory Section, Department of Pathology provides a wide range of routine and specialized investigations for the diagnosis and management of inpatients and outpatients. There has been a gradual incremental growth in workload since 2003. Tests performed outside office hours also have increased compared with previous years. There were 5.94 million tests done in 2007, an 8.6% increase over the previous year.
The expectations of implementing a laboratory automation system (LAS) were to (1) contain escalating workloads at minimal cost; (2) advance the quality of the service by reducing delays in preanalytical processing and eliminate sources of error in aliquoting samples; (3) improve the service to clinicians and patients through a decrease in turnaround time (TAT); (4) improve the working atmosphere through reduced sample handling and manual process, positive sample identification, and reduced health risks; (5) compensate for recruitment of experienced technical staff; (6) reduce staff frustrations by automating retrieval of specimens from a refrigerated stockyard for repeat and add-on testing; (7) better use manpower resources; and last but not least, (8) improve workstation consolidation leading to a reduction in the number of analytical platforms, improve inventory handling, and simplify staff training.
The system was expected to automate sample processing, both online and offline analysis, for the following test categories: general clinical biochemistry and immunoassay. The system was expected to process more than 5 million tests, of which 70% would be chemistry, 20% ion-selective electrode (ISE) tests, and 10% immunoassays.
In July 2007, after requesting proposals for the supply, installation, and commissioning of a front-end clinical LAS from major vendors, and after many discussions and presentations, the project was awarded to Beckman Coulter Singapore Pte Ltd. Prior to implementation of the LAS, multiple analyzers from different vendors were used for clinical chemistry and immunoassay testing. These included the Beckman Coulter LX20; Beckman Coulter DxI; Roche Modular D, P, and E; Roche Cobas 6000; Vitros ECi; Vitros DT60; Abbott TDx; and Abbott Axsym. Over the subsequent months, renovation works were carried out, and the system went “live” on November 14, 2007.
The system comprised the Beckman Coulter Power Processor with two centrifuges, an aliquot upgrade, and two 3K refrigerated stockyards that are able to store up to 3000 specimens each. The capabilities include sample receiving, sorting, and sample prioritizing, centrifugation, decapping samples, creating aliquot tubes from primary sample tubes, loading and unloading samples from analyzers, recapping samples after analysis, transferring samples to refrigerated stockyards for easy retrieval, and performing rerun and repeats automatically. In SGH, the Power Processor was connected to two Beckman Coulter DxCs and one Beckman Coulter DxI.
Methods
The benefits of automation are well documented with various examples of successful LAS installations worldwide.1–22 Unfortunately, there is scant reference of less successful LAS efforts and documentation of the early months post-LAS.
This study was designed to answer the following question: Was the implementation of LAS in the Clinical Biochemistry Laboratory at SGH successful? As there is no simple answer to the above question, the impact of LAS to the workflow process, laboratory output, and staff satisfaction will be explored. The research objectives are listed as follows:
To compare and contrast the TAT pre- and post-LAS
To compare and contrast laboratory errors pre- and post-LAS
To gauge the level of staff satisfaction and their feedback post-LAS
To document the advantages and limitations of the LAS and the continuous improvement process for the first 6 months.
Results and Discussion
Turnaround Time
TAT in our laboratory is defined by the time interval from the sample arriving in the laboratory to the verification of results in the laboratory information system (LIS). The percentage of samples completed within the target TAT is used to derive the performance indicator. The higher the percentage, the better the performance.
The target TATs for samples from the Accident & Emergency department and intensive care units are 95% results reported in 60 min and 100% reported in 90 min. The samples from these locations are referred to as stat samples. All other samples are considered routine, and the target TAT for these samples is 100% results reported in 3 h.
It has not been feasible to carry out decisive studies of the effect on TAT due only to the LAS because other changes to the workflow process have been executed during the same time.
Nevertheless, the mean and 90th percentile TAT of samples processed using the manual and automated systems for June 2007 were compared with April 2008 ( Fig. 1 ). It was not possible to trace the time taken for the preanalytical process alone, but the time of specimen arrival and the time the results were available on the LIS were extracted from the archive files. The time of specimen arrival in this context represents the moment the specimen arrives in the laboratory. The mean TAT for both stat and routine samples decreased post-LAS (30% and 13.4%, respectively). Also, in the 90th percentile TAT chart, it is shown that processing stat samples on the LAS was more efficient than the manual practice (29% reduction). However, no significant difference in the 90th percentile TAT was observed with routine samples. This was likely due to several factors, such as “less priority” of handling routine samples, specimen “pile-up” at bottleneck areas during peak hours, and insufficient analyzers on the track due to physical space limitation of the clinical lab.
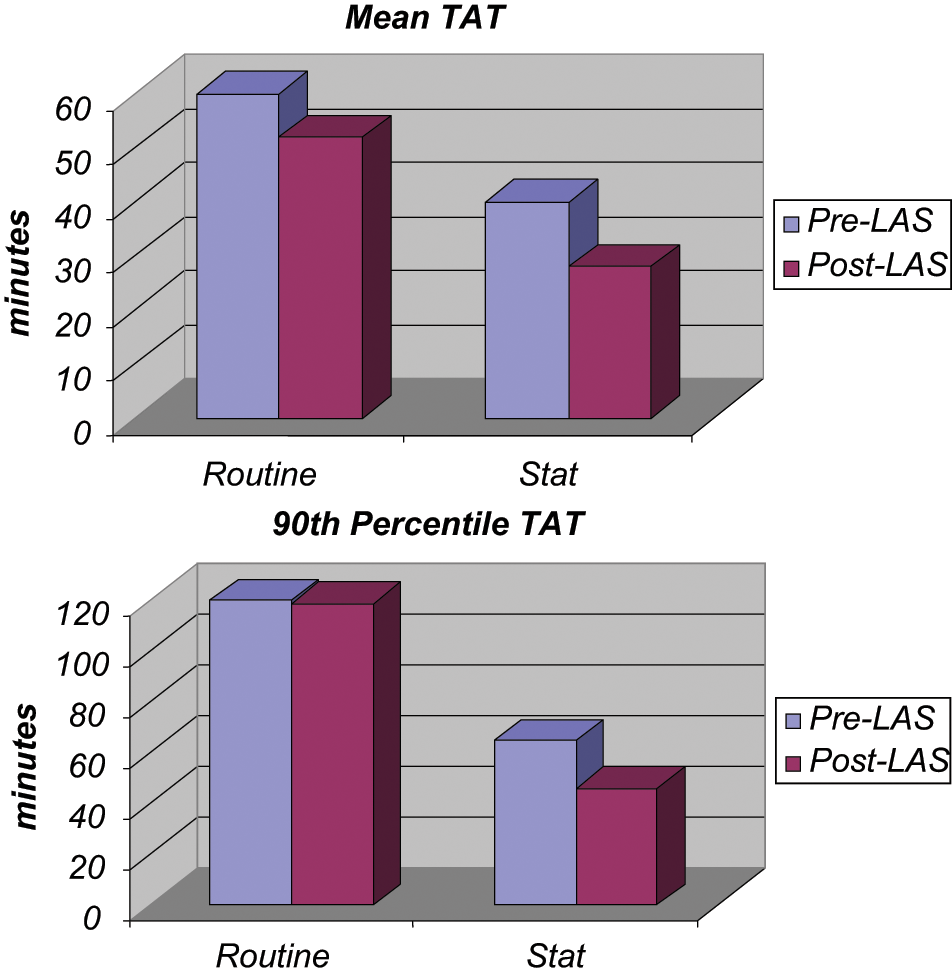
Mean and 90th percentile turnaround time (TAT) before and after the laboratory automation system (LAS).
The LAS could not differentiate stat specimens from the routine specimens at the preanalytical phase because this system does not have an alternative loading platform or centrifuges that could recognize stat specimens. Therefore, staff needed to be vigilant to load stat specimens in front of all routines on the loading rack to ensure they were sent for centrifugation first. The centrifuge setting was configured at 4 min spin time at 3000 rpm with a maximum wait time of 1 min. Upon completion of centrifugation and aliquoting, the stat specimens reaching the designated analyzers would be attended to immediately.
TAT Discussion
The TAT of stat samples ( Figs. 2 and 3 ) deteriorated slowly in the first half of 2007. This was likely due to several factors, such as increasing workload, high turnover of staff (six resignations from January to May 2007), and perhaps, to a lesser extent, staff complacency with regard to handling stat and urgent samples. Staff members were reminded to give priority to stat samples throughout the analytical cycle from sample requisition, centrifugation, loading, to validation of results. In addition to frequent reminders during lectures and meetings, several new measures were taken, including introducing a priority number series whereby the completed test results would appear at the top of the list of results to be validated, instead of queuing behind the less urgent tests in sequential order.
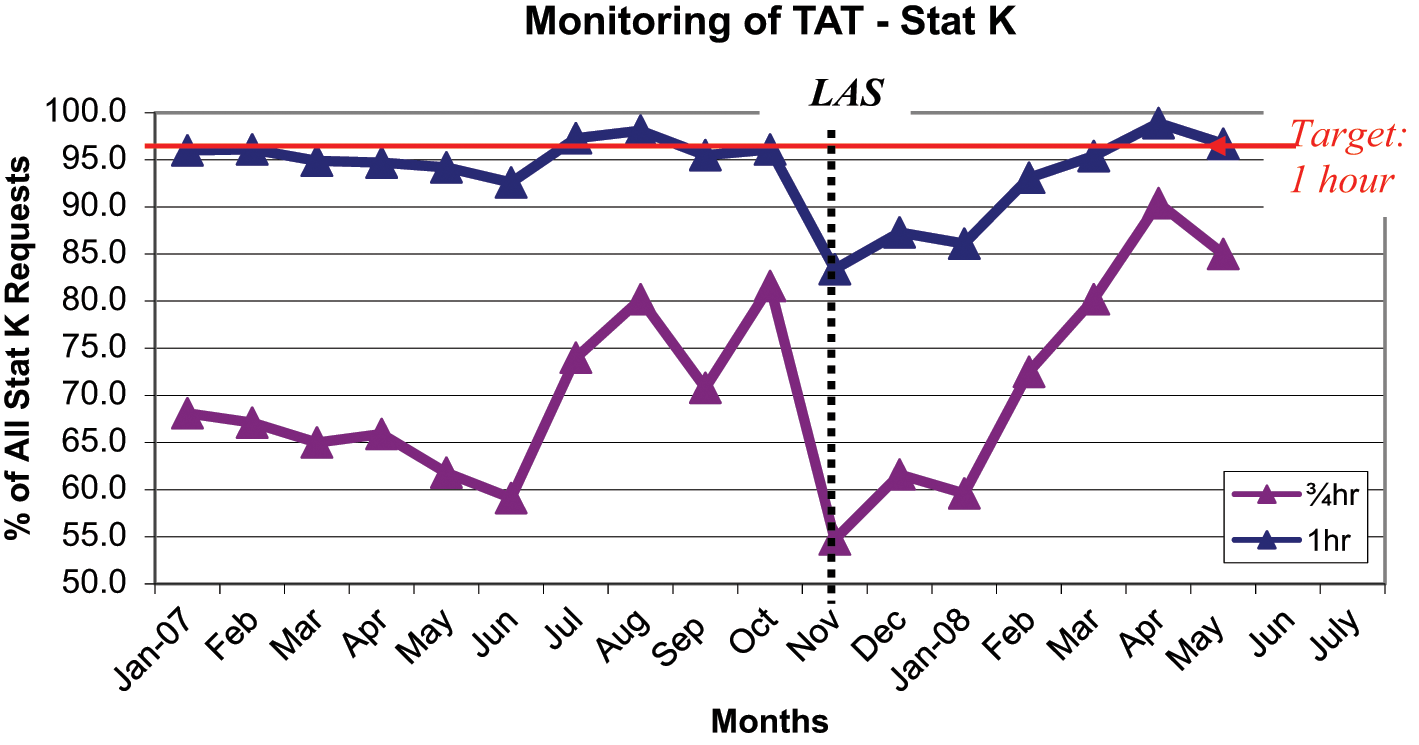
Turnaround time (TAT) for stat potassium (K) from January 2007 to April 2008. LAS, laboratory automation system.
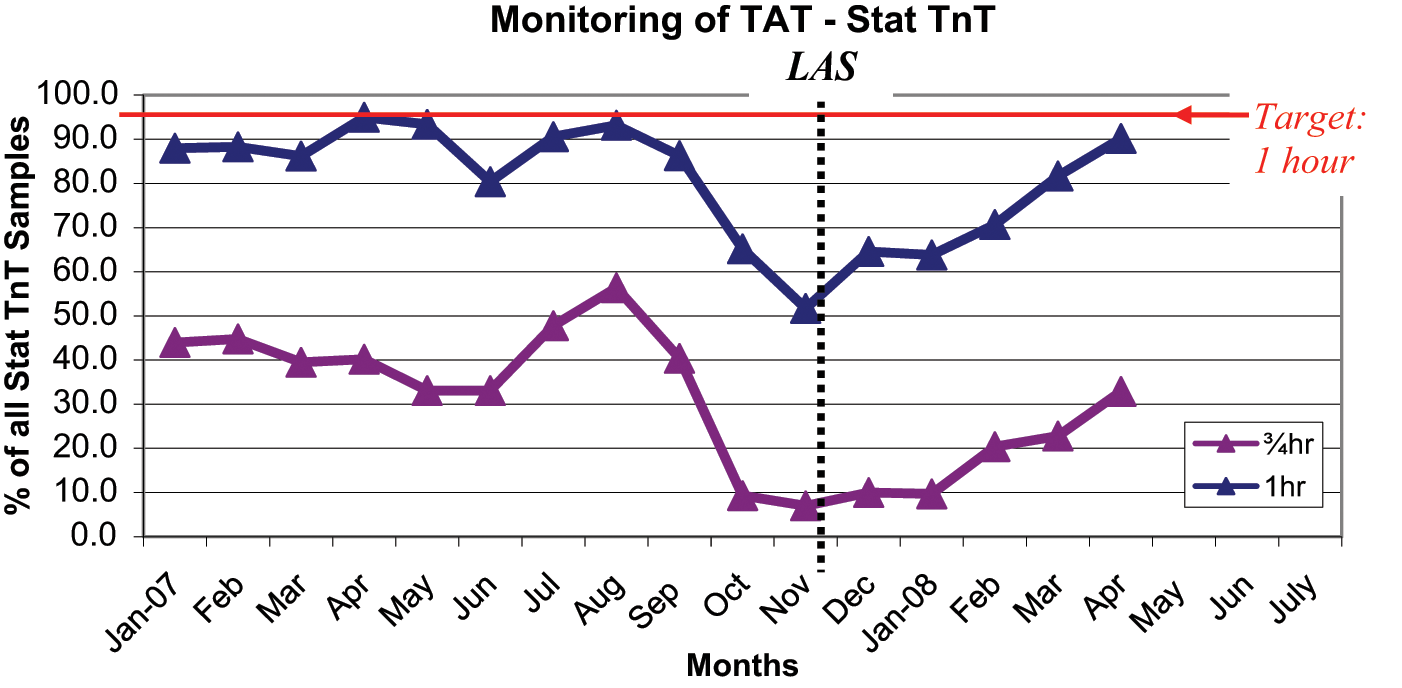
Turnaround time (TAT) of stat troponin (TnT) from January 2007 to April 2008. LAS, laboratory automation system.
Also, a large plasma television screen was installed in June 2007 (6 months prior to installation of LAS) in the laboratory showing the TAT of samples exceeding desired TAT. This allowed staff to attend to the samples more diligently. As shown in Figures 2 and 3 , the initial improved stat TAT was not sustained because of the frequent disruptions of workflow during the renovations (September–November 2007).
There was a significant increase in the TAT of stat samples after going “live” with LAS. Among the contributory factors were a lack of understanding LAS operations (both hardware and software) and unfamiliarity with new workflow processes. Prior to going live, two senior staff members were sent to the vendor for onsite training, and the rest were trained in-house by the application specialist from the vendor. According to the director at the University of Chicago Hospitals and Health System who recalled his early experience with automation, “When you make the switch to an automated system, people don’t know what to do at first. If an alarm goes off, everyone just stands around and stares, and they don’t know what to do or they’re scared they might do something wrong.” 19 This view was very much seen in the laboratory in the initial months following LAS introduction.
It appeared in the first 3 months post-LAS that it was not possible to reduce the TAT of the majority of samples ( Figs. 2 – 4 ) as the preanalytical system cannot handle the maximum workflow, especially when there is inadequate centrifuge capacity at peak times. However, regular meetings and discussions with the vendor and the technical support team were useful in enhancing our understanding of the LAS. For example, it was observed that when the LAS inlet and centrifuges were performing at their maximum capacity, the instruments attached to the track system were also operating at the highest capacity. Therefore, it would be wise at this point to “load” the LAS inlet with samples that have test requests that needed to be processed on the offline analyzers. In other words, these specimens would be centrifuged and aliquoted if indicated and sent to the LAS outlet without direct competition with samples queuing on the track awaiting processing by the analyzers linked to the LAS. In tackling this problem, a “floor supervisor” role was created whose duties include directing the various types of samples such as stat, routine, and offline to maximize the efficiency of the LAS.
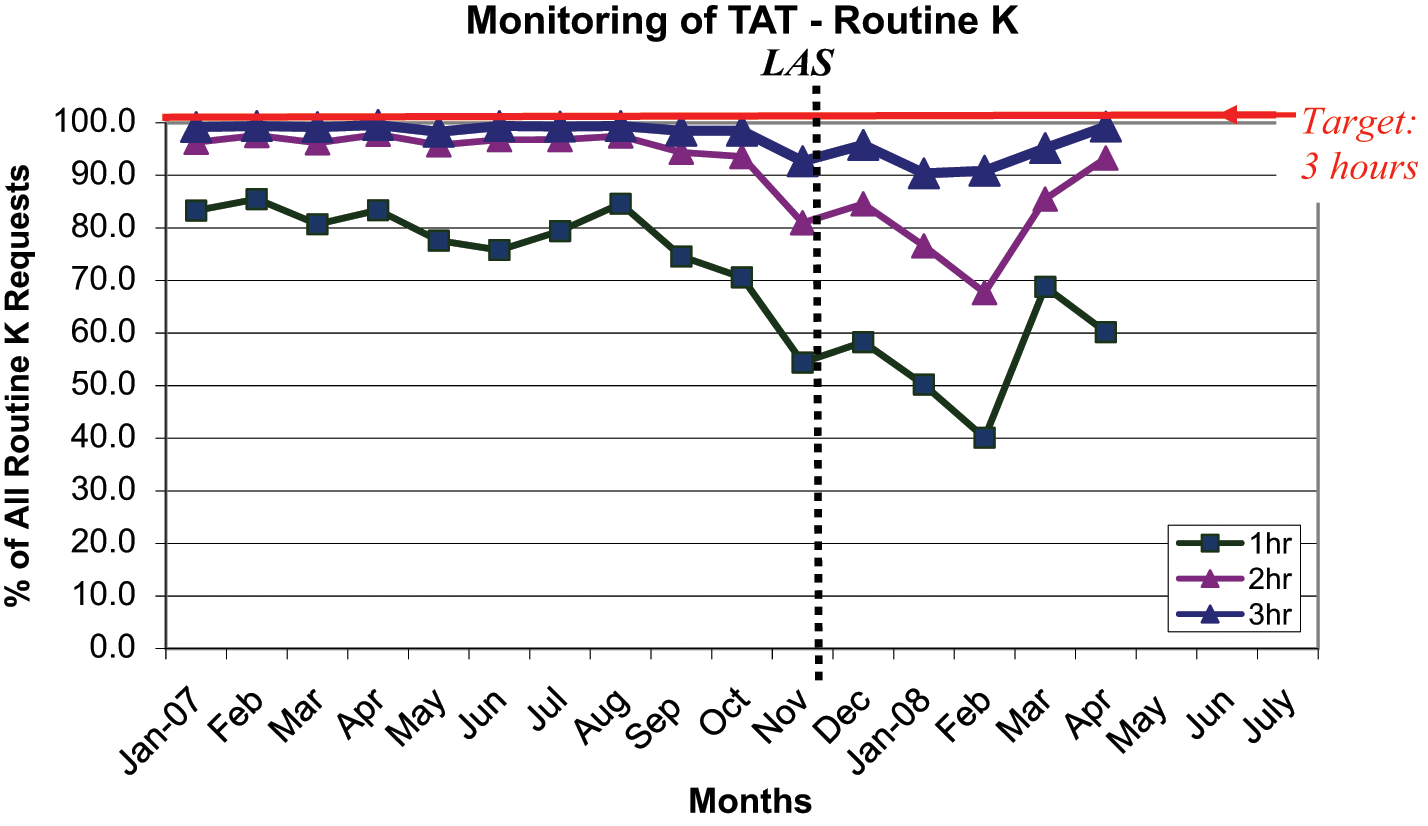
Turnaround time (TAT) of routine potassium (K) from January 2007 to April 2008. LAS, laboratory automation system.
In addition, a weekly internal meeting among clinical biochemistry management staff was also useful in addressing problems that arose during the previous week and to fine-tune the workflow process.
The TAT of routine potassium samples ( Fig. 4 ) remained stable until approximately 1 to 2 months prior to going “live” with LAS. As expected, the dip was due to laboratory renovation. Post-LAS, the TAT of routine potassium samples remained high for the first 4 months before improving to pre-LAS levels.
A particularly encouraging finding was that the 45-min stat potassium TAT ( Fig. 2 ) had improved significantly post-LAS compared with pre-LAS data. This provides a strong justification for introducing front-end automation to the laboratory as a faster and more consistent TAT can be produced. A slower improvement in the 45-min stat troponin TAT ( Fig. 3 ) was also noted. However, being processed on an offline analyzer and being an immunoassay that requires a longer analytical time (18 min) are contributory factors in comparison with stat potassium TAT.
Laboratory Errors
There is a lack of universally accepted definition of laboratory error, but in SGH, error is defined as a mistake detected during the analytical and/or postanalytical process that influenced in any way the quality of the laboratory service. As for preanalytical errors, weakness in the detection methods means that mistake rates are likely to be somewhat higher than observed.23–25
In SGH, the most common errors seen are those associated with manual intervention, for example, in documenting the communication of critical results with clinicians and ward staff, whereby a comment “high” was entered instead of low, “calcium” was entered instead of glucose, a urine volume was entered as “11000 mL” instead of 1100 mL, and so on. Other errors typically encountered include the manual transcription of results from smaller instruments not linked online to the LIS. Also not uncommon are errors due to manual data entry, for instance, wrong age and/or sex entered. Less frequently seen errors are isolated malfunctioning of the instrument, including those due to sample clots, resulting in significantly different values when repeated.
Missed test requests are not uncommon because test requisitions are manually entered into the LIS by laboratory staff. Statistics for missed test requests were captured separately.
The biggest problem with the analysis of laboratory errors and missed tests is the accuracy of data collection. It is inevitable that any step in the laboratory process requiring manual intervention is susceptible to mistakes. Furthermore, the current method of error detection requires yet another level of due diligence from the staff. Nevertheless, the data obtained show a statistically significant difference (p < 0.05) in laboratory errors detected pre-and post-LAS (chi-square statistic was applied using data from the first quarter of 2008 compared with the first quarter in 2001 in Fig. 5 ).
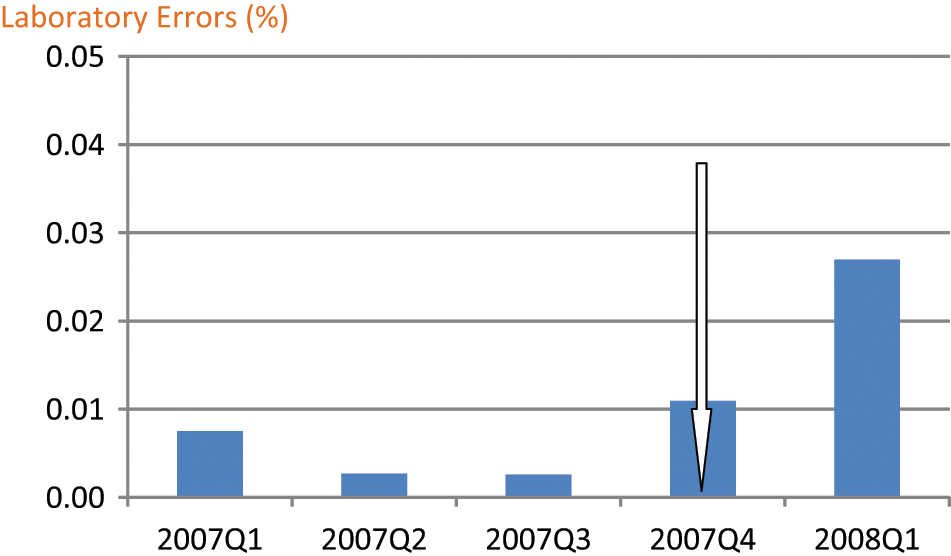
Percentage of laboratory errors detected in Singapore General Hospital from January 2007 to March 2008. Arrow indicates laboratory automation system (LAS) implementation. Q1, first quarter; Q2, second quarter; Q3, third quarter; Q4, fourth quarter.
It was surprising to note that laboratory errors increased post-LAS. This is likely due to the inexperience of the staff, especially with regard to data entry, whereby not only the requisition of test requests was done using real-time barcode printing compared with prelabeled barcodes but also the redeployment of laboratory technologists to assist the clerks in the area. An improvement in the data collected in the coming months should confirm the hypothesis.
Staff Survey
A cross-sectional laboratory workflow and job satisfaction survey was carried out using a questionnaire designed by the author with input from the scientific officers and senior staff supervisors. The statements were carefully selected with local context and references to cover the different aspects of the laboratory process, particularly the changes made to the workflow post-LAS. Special attention was paid to the statements’ wording and the number of ordinal scale categories to obtain valid information on the questions. The entire survey is reproduced in the
The study was conducted over a week in March 2008. The inclusion criteria include technologists of all three grades (Laboratory Technologist, LT; Medical Technologist, MT; Senior Medical Technologist, SMT) and have been employed in the laboratory for at least 6 months. This was to ensure that all respondents have adequate exposure to the changes in the workflow process pre- and post-LAS.
Percentage distributions of the responses were used to present the data. As a screening tool, a cumulative percentage of the two disagreement levels (disagree and strongly disagree) of ≥25% was considered a high level of dissatisfaction. These items were selected for further clarification and possible corrective actions.
Staff Survey Results and Discussion
All 38 laboratory technologists participated in the survey. Only 28 participants were eligible for the study, according to our inclusion criteria, comprising 8 LTs, 8 MTs, and 12 SMTs.
The reproducibility of the results was not specifically pretested in this study with a subgroup of laboratory technologists because the number of eligible candidates is small. This survey does not quantify whether the “neutral” results leaned toward disagree or agree, nor does it attempt to gauge whether the “expected benefits of the introduction of the LAS” were an improvement.
In the open-ended questions, the following were some of the frustrations listed by the respondents (frequency in parentheses): repeated alarms going off at the LAS (3) and insufficient training provided (2). Suggestions on ways to improve the workflow practice include processing samples intended to be run on offline analyzers manually (e.g., polyclinic and National Kidney Foundation specimens) (7), providing troubleshooting guides to LAS alarms (2), adding another chemistry analyzer to the LAS track (2), and adding another centrifuge to the LAS track (1).
In the category of “Samples Arrival and Processing,” about one-third of the staff disagree that posttest requisition labeling of barcodes contributed to a reduction in laboratory errors. Before LAS, staff would prelabel specimens received in large batches before requisition of test requests. Despite an improvement whereby the name of the patient is printed on the barcode label generated after the test requisition, some staff still preferred to do specimen labeling in batches. This is probably because staff belief that the previous workflow was faster and definitely more familiar. Consequently, several cases of specimen mislabeling were found due to the inattention and carelessness of the staff, as admitted upon interview.
Most of the staff believed that the LAS inlet as well as the two attached centrifuge units is inadequate in handling the workload, especially during peak periods. Furthermore, a quarter of the respondents suggested in the open-ended questions that specimens intended for offline analyzers be processed manually. This is to minimize the “congestion” at the LAS inlet during peak periods. However, as mentioned earlier, a “floor supervisor” role is created instead to overcome this problem.
About one-fourth of the respondents disagreed with the statement that “LAS downtime is reasonable.” This is likely because of the initial inexperience with the LAS. For example, one of the major limitations of the LAS is the positioning of the barcode labels on the samples. There are many barcode readers located at various positions along the entire LAS tracks to direct and verify specimen identification and destination. The correct positioning of barcode labels on the samples is essential to ensure minimum interruption due to the barcode reading errors.
Common Problems of the LAS
With the introduction of error log recordings from late January 2008, the most frequent problems causing LAS downtime at the various sections of the track were identified. Figure 6 shows the types of LAS errors that occurred from January to April 2008. One of the most common problems of the LAS is barcode reading-related errors that occurred in most LAS modules ( Fig. 6 ). Other than the poor labeling technique as mentioned above, another frequently encountered problem was the “poor quality of barcode labels.” For example, it was noted that many barcode labels on the specimens that were recalled for add tests and failed to proceed at the barcode reader had a “dog-ear” appearance where the corners of the label became unstuck. This problem was partially solved by switching to another barcode label manufacturer and by encouraging the staff to “press down” the labels on the specimen tube. A different problem was seen when several specimens that failed barcode read were found to have poor barcode quality. A question was raised whether this could be due to the barcode printers (using thermal transfer ribbon on normal barcode labels), and the issue was resolved when a switch to thermal printers (using thermal barcode labels) was made. “Dirty” barcode readers caused by dust and fingerprint smudges were also found to contribute to the barcode reading errors, prompting regular cleaning as part of the maintenance. Also, barcode laser misalignment and inconsistency in the spring elasticity of some of the specimen tube carriers (also known as pucks) “holding” the specimen tubes at a nonvertical position can result in a barcode read failure.
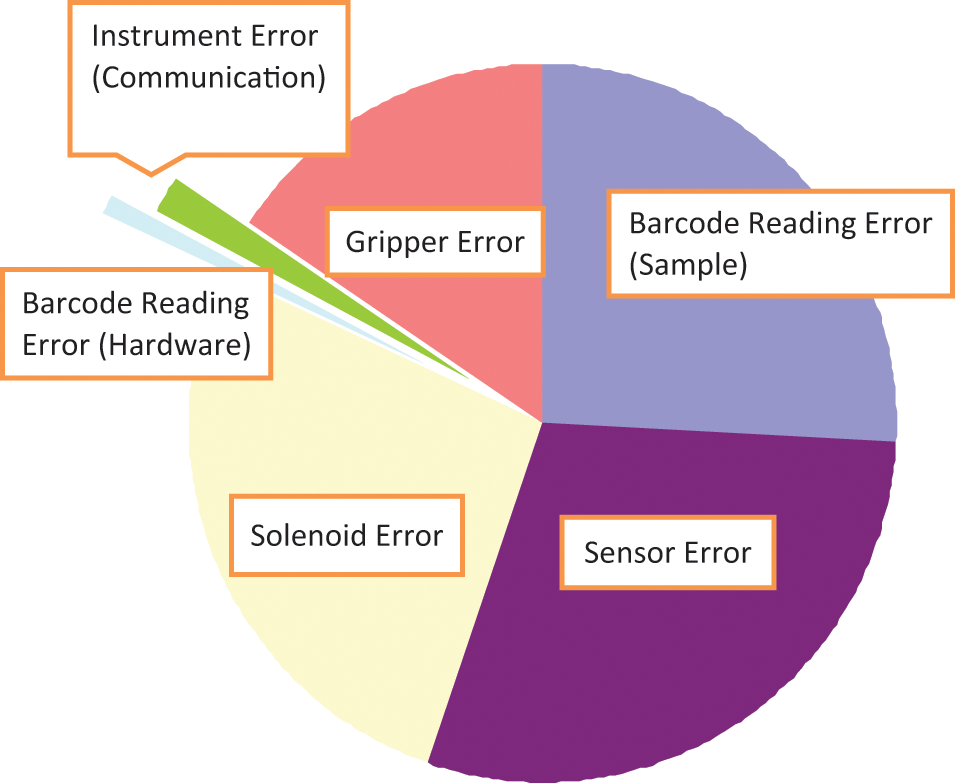
Laboratory automation system (LAS) error log from January to April 2008.
Gripper-related errors ( Fig. 6 ) were another commonly seen problem of the LAS. This includes barcode labels stuck to the gripper because of poor-quality labels used, missing the specimen tube because the puck was “holding” the tube at an angle (misalignment), and gripper slippages due to the wearing off of gripper pads. Less seen was the malfunction of the motor controlling the gripper.
Solenoid and sensor errors also appeared to be common LAS problems ( Fig. 6 ). Solenoids and sensors keep track of the movement of pucks, ensuring a continuous and smooth flow of the specimen tubes. Solenoid or sensor errors indicate a puck is unable to move because of a problem. For example, if a specimen tube is not placed in a puck properly, it would be detected by a sensor, triggering an alarm to alert the staff for troubleshooting. Other causes of sensor errors include a “dirty” or faulty sensor that is unable to detect a specimen tube or a specimen tube detected at a wrong position. Examples of solenoid errors include faulty or misaligned solenoids. Sensor and solenoid errors were reduced or fixed by educating the staff if it was a user-triggered problem or by adjusting/replacing the parts if it was a hardware failure.
Instrument-related errors ( Fig. 6 ) are usually caused by failure of the instrument to “communicate” with the Automated Data Manager of the Power Processor, resulting in specimen pileup on the track. Common underlying glitches include insufficient water supply, insufficient reagent, and probe crash.
It is hoped that with further understanding of the LAS, hardware fine-tuning, and adjustments and improvements by the vendor, downtime can be reduced in the near future.
Challenges of the Project
Many challenges were encountered in the attempt to quantify the impact of introducing LAS to SGH. It was not possible to study the effect on TAT due only to LAS because other changes have been put into operation during the same time period. For example, the reorganization of both the physical laboratory layout and workflow process was done to optimize workflow efficiency. Also, tests performed on multiple platforms were consolidated into fewer instruments. This will reduce the manual steps needed to transfer from the LAS outlet to the offline analyzers.
The journey post-LAS is one of a continuous quality improvement process. Initial teething errors and mistakes both expected and unexpected were brought up during regular meeting discussions and workable solutions brainstormed.
With the benefit of hindsight, it was realized that the majority of the perceived imperfections of the LAS was due to the staff’s early inexperience. In other words, as frequent problems causing LAS downtime at the various sections of the track were identified and as the problems were overcome, it was noted that laboratory error rate and LAS downtime decreased, whereas TAT improved. The possibility to spread out the peak load to improve TAT was not feasible because there are no dedicated phlebotomists employed by the hospital. Also, other variables, such as analyzer downtime and water supply failure, which are unrelated to the LAS, can affect the TAT. It is therefore difficult to decide on a “cutoff” point at which to compare whether the laboratory throughput was better or worse with the introduction of the LAS.
Many efforts were needed to overcome the initial difficulties associated with adjusting to a new system, new software, and new working procedures. Immediate improvement in TAT, laboratory errors, and staff morale were not appreciated. Close cooperation with the vendor is paramount in “turning around” the TAT. Although it took no less than 4 months to reach pre-LAS levels, the laboratory is optimistic the figures can be improved. Also, a snapshot of mean and 90th percentile TAT of two periods taken 10 months apart showed a reduction of TAT post-LAS, especially for stat samples.
The features of automated sample retrieval and reruns were much appreciated by the staff. Specimen tracking also improved post-LAS. Although it was shown in the staff survey that many were frustrated with the frequent LAS alarms, staff morale seemed to have increased with time. A repeat survey will be done later to validate the success of LAS in the laboratory.
The issue of full-time equivalent (FTE) reduction is not considered by the laboratory. Staff members have been redeployed to attend to areas of specimen processing bottlenecks. As there is still much to learn about the operation of the LAS, the redistribution of staff to evaluate new tests for laboratory test menu expansion plans is not feasible currently. Nevertheless, the laboratory is confident in handling present and future workload without requiring additional FTEs.
Footnotes
Acknowledgements
We gratefully acknowledge the support of Beckman Coulter in this project. We also would like to thank our laboratory staff for their patience, hard work, and input in this project.
The authors declared no potential conflicts of interest with respect to the research, authorship, and/or publication of this article.
The authors received no financial support for the research, authorship, and/or publication of this article.