
Abstract
In this article, we report on the development of indicator-impregnated agarose sensor films for colorimetric estimation of the pH of different standard buffer solutions and urine samples. In contrast to the conventional paper-based dipstick method, the presented method employs dried agarose that was infused with a chemical indicator, which when exposed to the test sample results in an appropriate chromogenic outcome. The color change was then quantified by the smart camera system. The divulged instrument has been calibrated with standard buffers and also tested with clinical urine samples. The systematic study was conducted to characterize the performance of the presented technique, such as interplate variations, time variations, volume variations, and shelf life study of agarose sensor films for the commercial viability of such a technique. The employed method is competent enough to bring a change in the paradigm of dipstick method from being qualitative estimation to quantitative, manual detection to automated, and a subjective approach of diagnosis to an objective one. The technique presented here has potential application in the field of point-of-care diagnostics with high fidelity, multiplexing, and robust quantitative estimation.
Keywords
Introduction
In the human body, biological fluids are maintained at a certain pH range by homeostasis, for example, blood pH, 7.36–7.40, and urine pH, 4.6–8.0. The measurement of pH is one of the important parameters in urinalysis because of its lucidity to classify urine as acidic or alkaline. The conditions of urine becoming highly acidic or alkaline are acidosis, starvation, dehydration, uncontrolled diabetes, urinary tract infection (UTI), pyloric obstruction, chronic renal failure, and some respiratory or metabolic disorders. One of the standard techniques for the measurement of pH is the glass electrode–based pH meter, and standard buffers for the calibration, but it requires several resources and also a skilled person in the laboratory to calibrate the system and handle it befittingly. The conventional method of estimating the pH of urine samples is dipstick analysis. Dipsticks are paper-based pads having chemicals impregnated on them that react with the analyte present in the urine sample. These dipsticks are dipped into 5–10 mL of urine sample for clinical analysis. Dipsticks are capable of assessing several clinical parameters, such as pH, specific gravity, glucose, protein, ketone, bilirubin, urobilinogen, erythrocytes, leukocytes, and nitrites, to screen the abnormality. This is based on impregnating the respective indicator chemical to react with specific analytes present in the sample. The major drawbacks of dipstick-based urinalysis are poor manual interpretation, cross-reactivity (due to leaking of the reagent from the pad and mixing with the adjacent pad), and low fidelity (as the variation in accuracy of the dipstick is more than ±20%).1,2 The accuracy of pH determination is clinically relevant in the detection of various pathological conditions, such as UTI and renal disease. The poor sensitivity and accuracy is of particular concern in the case of detecting UTI. As evident from recent studies, the reliability of dipsticks is questionable when ruling out UTI. 3 Further, the dipstick sensitivity has been found to be very low (2.3%) 4 in the case of pregnant women, wherein UTI screening is more frequently performed. Due to the subjective nature of the color matching aspect implicit in the test, the desired level of accuracy and sensitivity may not be achievable using the dipstick method.
To overcome these disadvantages, meticulous research is feeding in the area of miniaturization and automated point-of-care (PoC) diagnostics. PoC diagnostics are low-cost portable devices that help in delivering the immediate results, hence saving the time for diagnosis and improving the quality of treatment. 5 These can be implemented in adverse conditions, such as emergency triage like epidemic conditions, where an urgent diagnosis is required for a large population; nonexistent laboratories, like in military areas or war zones; and rural or remote areas, where regular centralized laboratory-based diagnosis is impossible. One of the approaches in PoC diagnostics is paper-based microfluidics, in which paper is used as a substrate to perform various chemical analysis.6,7 Paper-based microfluidics has predominantly been used for the quantification of analytes through various colorimetric assays. 8 It enables the option of using sensors such as a charge-coupled device (CCD) or complementary metal-oxide-semiconductor (CMOS) 7 –based portable analysis unit for the detection of target analytes. Paper-based microfluidics is becoming popular due to its low cost, simplistic approach, and on-spot result generation ability. It includes detection of various analytes and microorganisms, such as a paper-based pathogen sensor, 9 glucose sensor, 10 nitrite sensor, or ketone sensor, as a part of urinalysis.11,12 Some major limitations of paper-based microfluidics include poor maintenance of the hydrophobic surface, which results in loss of guided sample transport to the zone of detection; inefficient sample delivery within the device due to sample evaporation during its transport in the paper-based microfluidic channel; and insufficient sample volume for the detection of different analytes of very low concentration since the limit of detection is very poor for colorimetric assays integrated into paper-based microfluidic devices. 13 To subdue the limitations of paper-based microfluidics, researchers are looking for polymer- or hydrogel-supported 14 platforms for colorimetric assays as an option to be used in quantifying the analyte concentration. There have been reports suggesting the use of a polymer or hydrogel as a detection medium for color-based diagnostic tests, such as immunoassays and enzyme-based assays. 15 The color change in the above-mentioned tests has been detected by using a CCD camera mounted on a microscope, 16 followed by the analysis of the acquired images by a computer to interpret the diagnostic result. Hence, for the purpose of automated quantification, it requires a bulkier setup having a microscope with a CCD camera mounted onto it and a computer to analyze the results, which may not be ideally suitable for PoC diagnostics. Nevertheless, the polymer-based colorimetric assays have the advantages of working with low reagent and low sample volumes, and they are also very flexible in terms of size of the polymer detection zone, which may vary from a few micrometers to a few millimeters in diameter. On the part of automated analysis and report generation, lab-in-a-phone is one of the latest technologies that is evolving fast and may become commercialized soon to reach the user’s pocket.17,18 Smartphone (or smart camera) analysis offers an appealing option for image acquisition, processing, and communicating the results for remote sensing in a single module. It not only cuts down the time and cost of the diagnosis, but also accelerates global access to the healthcare diagnosis. 19 The smart camera–based automated analyzer should be capable of quantifying the analyte in a colorimetric assay, such as a cell phone–based colorimetric glucose sensor 20 and automated pH reader.21–23 Also, to improve the reproducibility and sensitivity of the smart camera–based estimation of the colorimetric assay, researchers have tried various approaches to minimize the effect of ambient light. There are some ambient light compensating methods, such as using a dark hood,22,24 that have been employed to ameliorate the sensitivity of the system. Regardless of how much advancement is brought into the readout module, there is a fundamental limitation in the sensor, which is paper in most of the aforementioned literature. Thus, we have proposed agarose sensor film (ASF)–based cartridges for colorimetric estimation of the pH of various buffers and urine samples and realized a miniaturized smart camera detection system for quantification. The chromogenic reactions are made to occur between the analyte present in the samples and the chemical indicator impregnated in agarose films. These ASFs were placed in the wells of an acrylic plate with specific dimensions. The images of the ASF exhibiting the chromogenic change as a result of uptake of the sample were captured and processed to extract the hue values. A three-dimensional (3D) printed prototype has been used to nullify the effect of ambient light so that the sensitivity of the system is enhanced. The calibrated pH values estimated by the proposed system were compared with the values obtained by the conventional glass electrode–based pH meter and found to be reliable. We envision that our setup provides a holistic approach in replacing the conventional paper-based dipstick analysis with a smart camera–based automated reader (SAR) for ASFs targeting PoC applications. SAR-ASF is capable of quantitative estimation of the analyte concentration, which casts out the qualitative and semiquantitative test of the paper-based method of detection. We characterized the performance of our system by studying the various parameters, such as interplate variations, time variations, volume variations, and the shelf life of the designed ASF for 4 weeks without having any considerable impact on the sensitivity of ASF.
Materials and Methods
Acrylic plastics were used to fabricate the ASF cartridges. Each ASF cartridge consisted of two layers of 2 mm thick acrylic plastic. The ASF cartridge was 45 mm × 45 mm and comprised nine wells (3 × 3 array). The top layer of the ASF cartridge had 5 mm diameter wells, which were grooved using a laser cutting machine, and the center-to-center distance between two consecutive wells was 15 mm. The top and bottom layers were bonded using chloroform. The preparation of ASF was carried out in four steps: heating, mixing, loading, and drying ( Fig. 1 ).
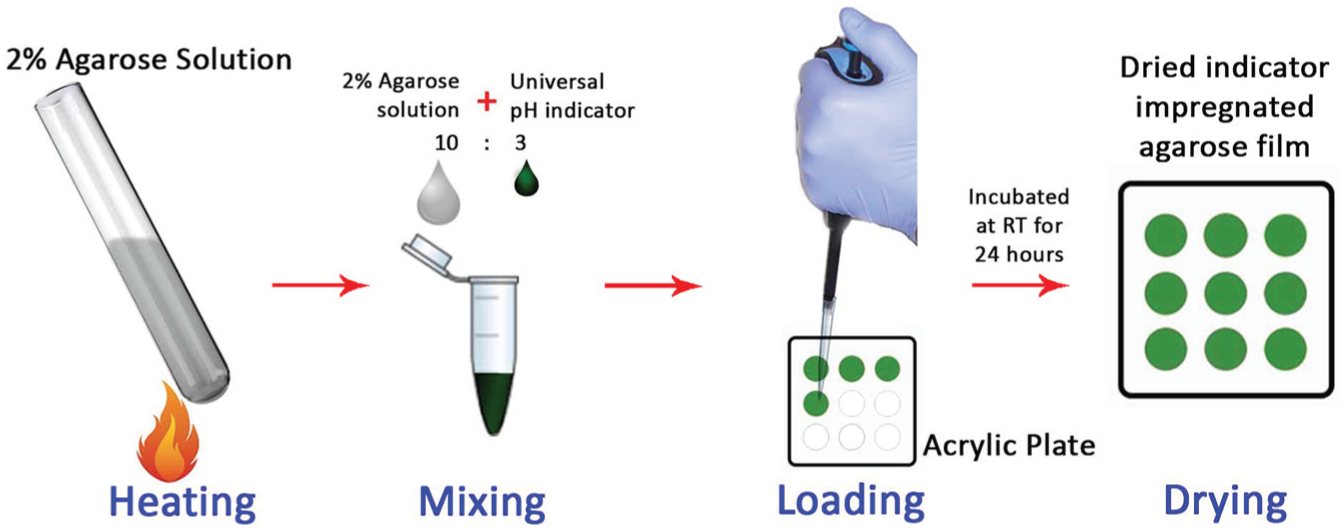
Schematic for the preparation of the ASFs involving four steps: heating, mixing, loading, and drying.
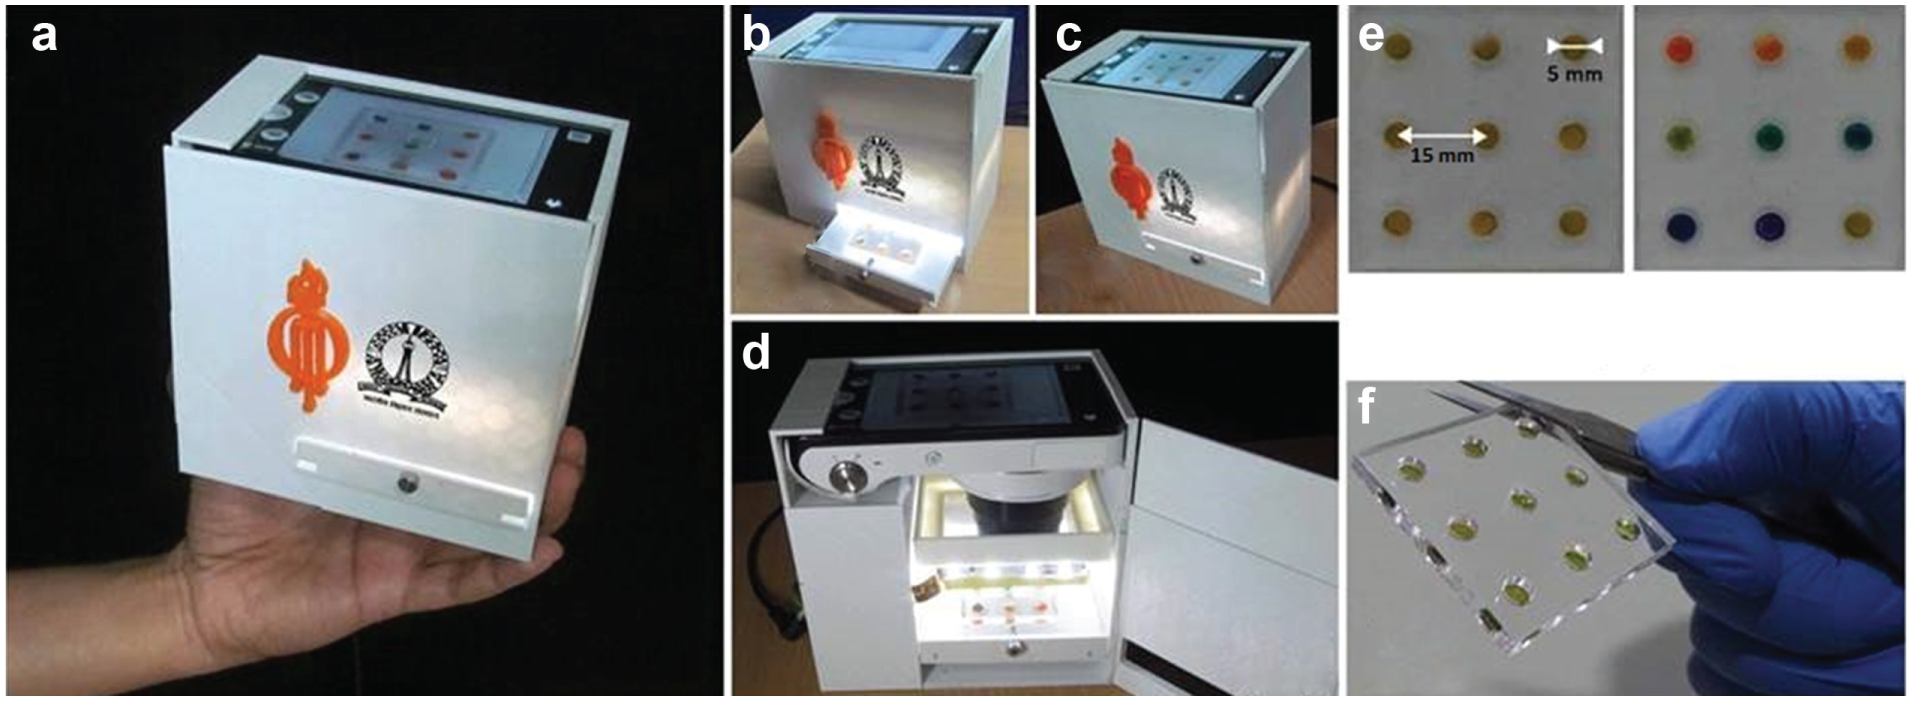
2% (w/v) agarose (Seakem LE Agarose) was heated first, and then the mixture of universal pH indicator (Fisher Scientific, Hampton, NH) and agarose was prepared in a 10:3 volume ratio. Thirty-five micro liters of the mixture was loaded into the well, followed by drying at room temperature for 24 h. This results in ASF formation on acrylic cartridges. When sample is added, the ASF swells up and the pores of the ASF are exposed to the sample, where it reacts with the impregnated pH indicator to give an optimal color change. SAR-ASF was calibrated for measuring pH in the range of 4–11, as described in Figure 2 . The standard buffers having pH values of 4.05, 7.01, and 8.95 were procured for the preparation of different solutions of pH 5.05, 6.14, 8.05, 9.90, and 11.35 with 1 M HCl/5 M NaOH solutions. Ultimately, we had pH 4.05, 5.05, 6.14, 7.01, 8.05, 8.95, 9.90, and 11.35 buffers to obtain a calibration curve. All the pH values were cross-checked using a standard glass electrode–based pH meter (Eutech, Singapore) before measuring the pH values using ASF. A smart camera (Samsung Galaxy EK-GC100) was used to capture the images of the wells of the acrylic plate for quantifying the color change of ASF. In order to quantify the chromogenic change, the hue values were extracted and the hue value change was calibrated with the expected pH value. A systematic study was conducted to characterize the deviation of the values in pH estimation (1) from plate to plate (the same devices, five total, are made for the same samples); (2) within the same plate but as a function of time; (3) within the same plate and at the same time, but as a function of sample volumes; and (4) within the same plate and at the same time, but measured at different weeks to estimate the shelf life. The prototype used to estimate the pH as per propounded method is shown in Figure 3 . To conduct this study, a 3D printed casing (to house the camera), cartridge, and loading tray were built. The casing was designed using Dassault Systemes SolidWorks (Waltham, MA), computer-aided design (CAD) software. The model was then sliced with MakerBot, which is slicing software. The sliced model was 3D printed using Wanhao Duplicator, a dual-extrusion-type desktop 3D printer. With polylactic acid (PLA) as a filament, a nozzle temperature of 205 °C and base plate temperature of 60 °C were maintained throughout the print job. For constant illumination, a white light-emitting diode (LED) strip containing 14 LEDs was wrapped inside the casing. These were powered by a 12 V DC supply and illuminated uniformly in all four directions. A hood was attached to the prototype to avoid the direct LED reflection on acrylic plates. Buffer solution of 35 µL volume was loaded in each well of the ASF cartridge, and color change was observed from red to violet for pH 4 to pH 11.01. This step was repeated for five plates to get five readings for each pH value. Each image was analyzed to get the hue value for each pH buffer at time t = 1, 3, 5, 10, and 15 min after buffer loading to find the optimum reaction time, as the indicator takes time to diffuse uniformly in wells. We cropped out a square from the image of each well, with the diagonal equal to the well diameter, and imported the cropped image of the square to MATLAB to get an average hue value. We followed this procedure for all the images. The average hue value of five images for each pH value was plotted as hue value versus pH calibration curve. This calibration curve was subsequently used to estimate the pH value of a given solution by measuring the average hue value of the color obtained after loading it in a well on ASF. The pH value was estimated from the linear interpolation.
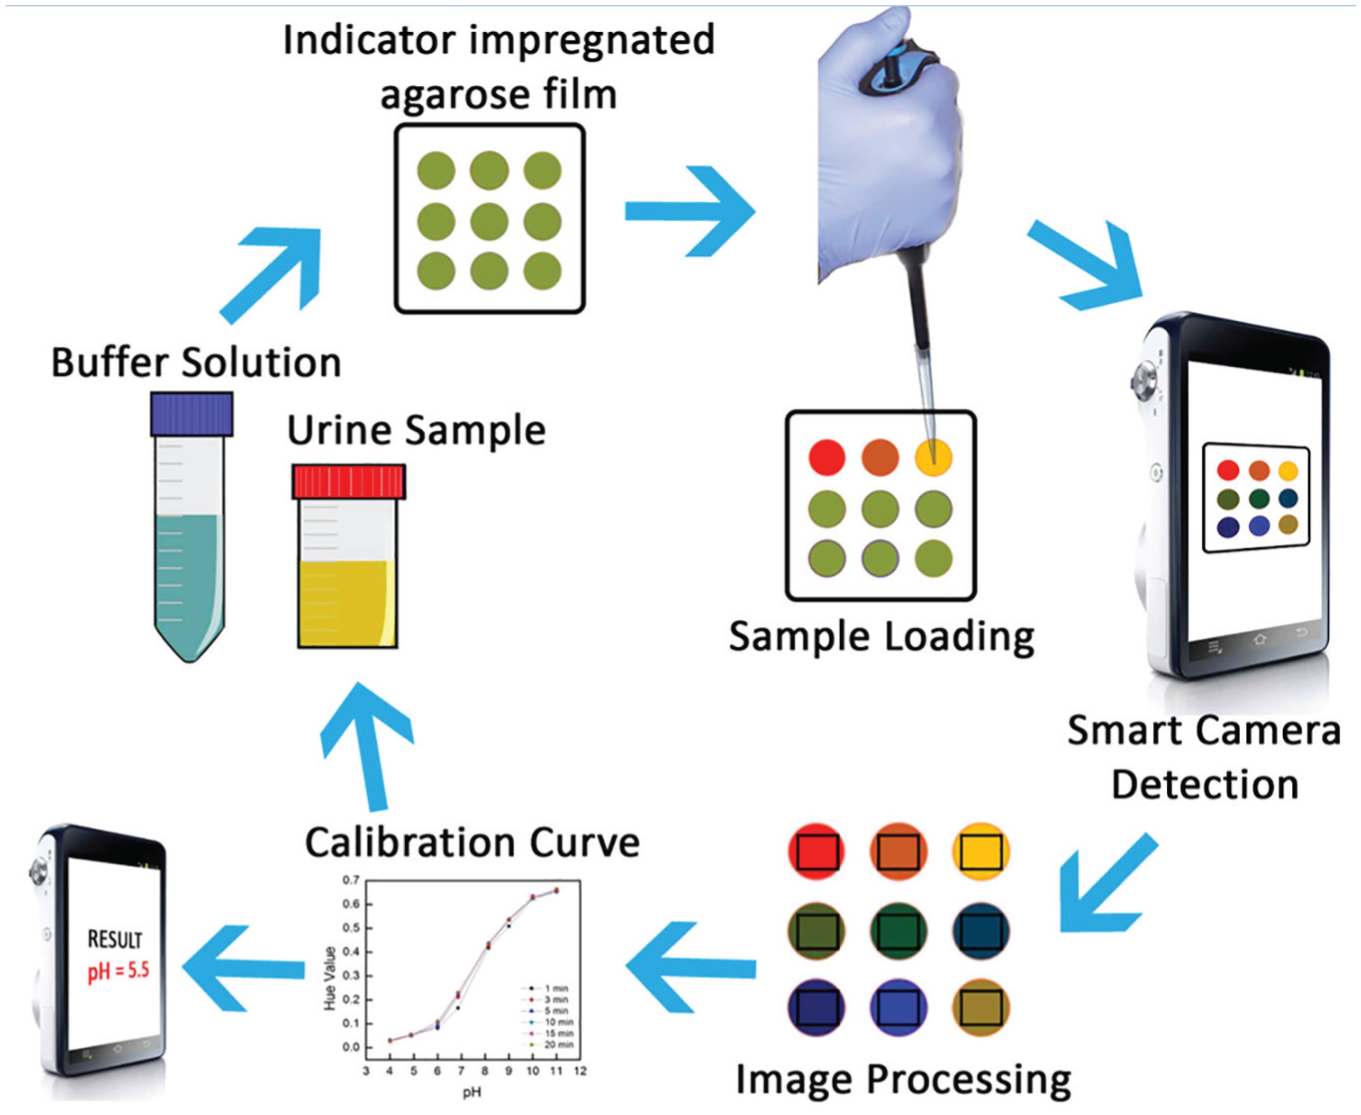
Schematic illustrating the methodology for the estimation of the pH of different buffers and urine samples using SAR-ASF.
(
The aforementioned procedure was applied to estimate the pH of six test samples, which were prepared in the lab, and six urine samples. Urine samples were collected from a pathological laboratory and used on the same day of collection; moreover, samples were stored at 4 °C. The pH values of test samples and urine samples were measured using a pH meter (Eutech) before loading a 35 µL sample onto an acrylic plate containing the ASF. Subsequently, we loaded the urine samples (35 µL) onto the analytical device and video was captured with a smart camera. The deviation of pH by using different volumes of the standard buffer has also been studied. The pH values obtained from the extracted hue values (using the standard calibration curve) for different wells having different volumes were almost the same, which was confirmed by calculating the standard deviation. To estimate the shelf life, five ASF cartridges were used for day 1 and the end of week 1, week 2, week 3, and week 4. We used pH 4 to pH 11.01 buffers to find the shelf life of ASF. pH values obtained from SAR-ASF at the end of day 1, week 1, week 2, week 3, and week 4 were compared with gold standard glass electrode pH meter values to obtain the relative error in measurement.
Results
We used pH 4.05, 5.05, 6.14, 7.01, 8.05, 8.95, 9.90, and 11.35 buffers to obtain a calibration curve for ASF as detailed in the previous section. The colors of wells for different pH buffers with repetition on five plates in the form of cropped images (75 × 75 pixels) are shown in Figure 4 .
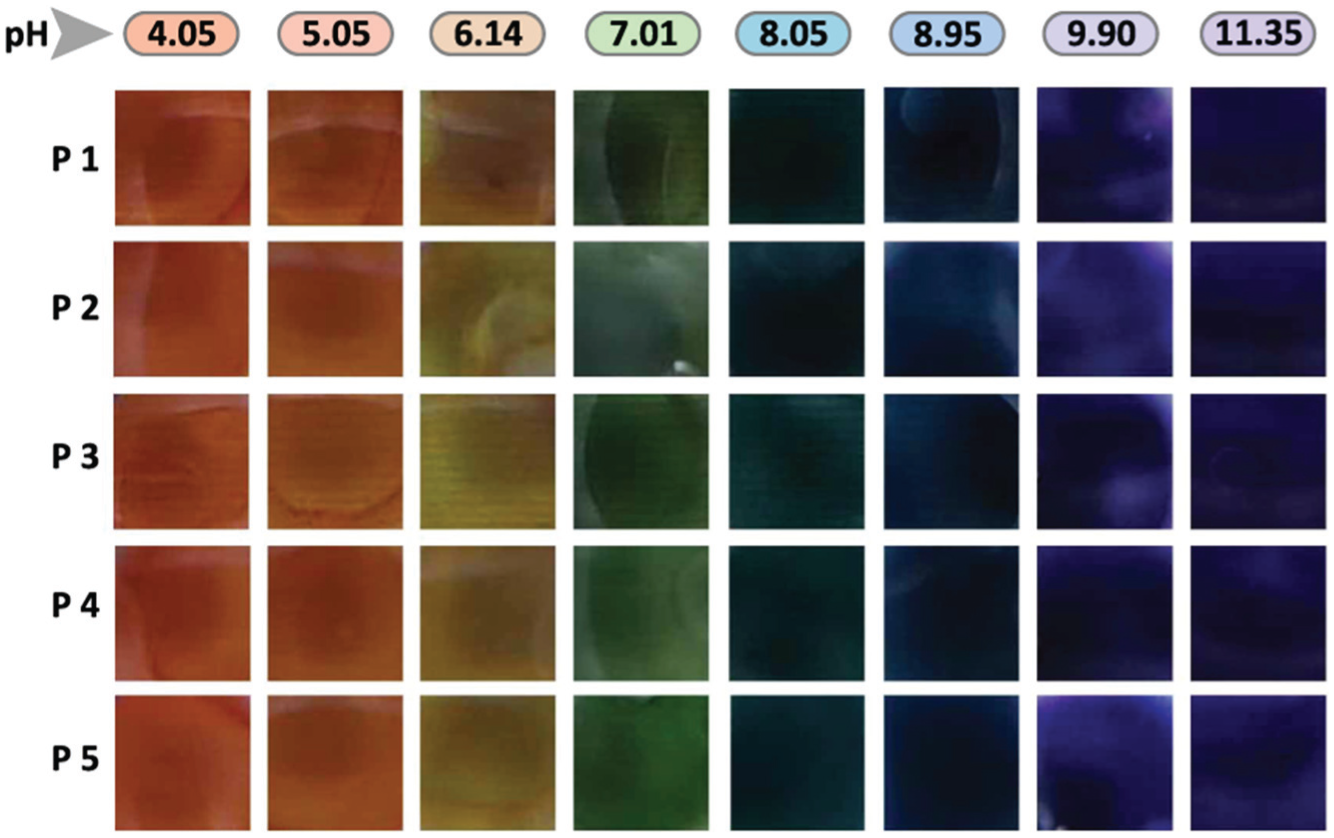
Cropped images (75 × 75 pixels) of ASF wells for eight different pH values and five plates (P1, P2, P3, P4, and P5) at t = 5 min. These results were used to obtain a calibration curve.
pH Calibration Curve on the Basis of Measured Hue Values
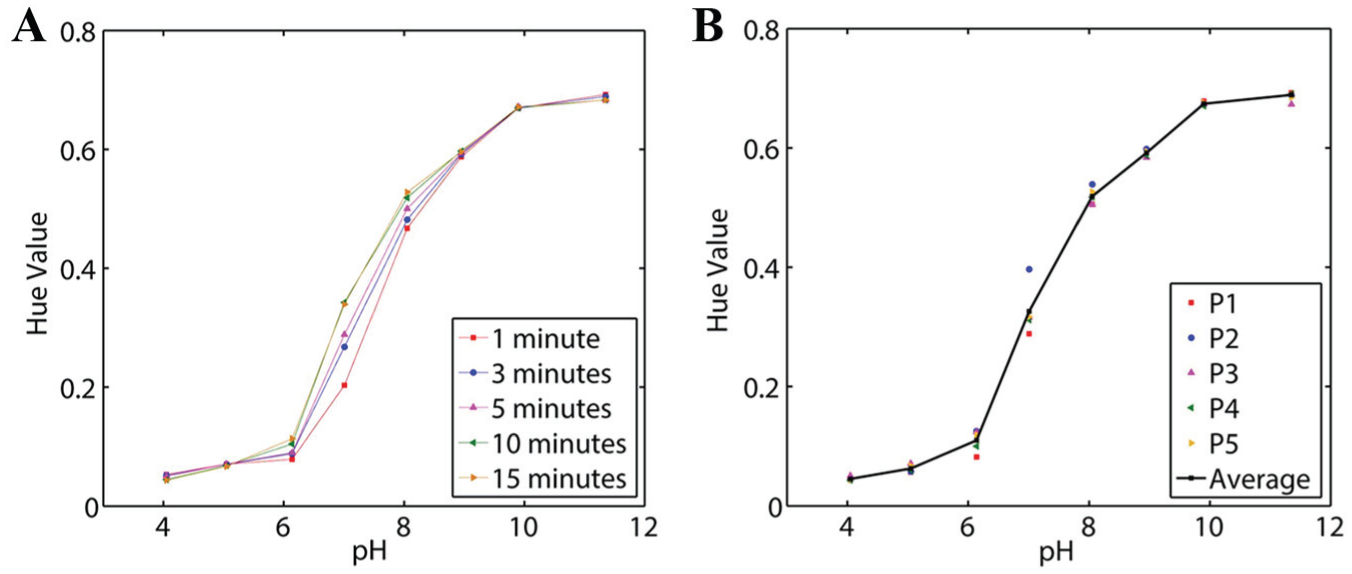
Hue values were plotted against pH at time t = 1, 3, 5, 10 and 15 min to see whether the hue values were changing over time ( Fig. 5A ). To obtain the optimum time after which a reading must be used, we had calculated the percentage change in hue values for t = 3, 5, 10, and 15 min with regard to t = 1 min. We found that the percentage change for most pH solutions was saturated after t = 5 min, so we used that as an optimum reaction time to reduce the measurement errors. We required the maximum contrast of hue value difference between two different pH values, as it increases the accuracy of the results obtained using the calibration curve. It was observed that the hue value contrast varied until t = 5 min and the hue value change was within 6% only between the t = 5 min and t = 15 min interval. Based on the average hue value data obtained, the calibration curve acquired using t = 5 min data is shown in Figure 5B , which was used subsequently for the estimation of unknown pH values.
(
Clinical Evaluation of the ASF
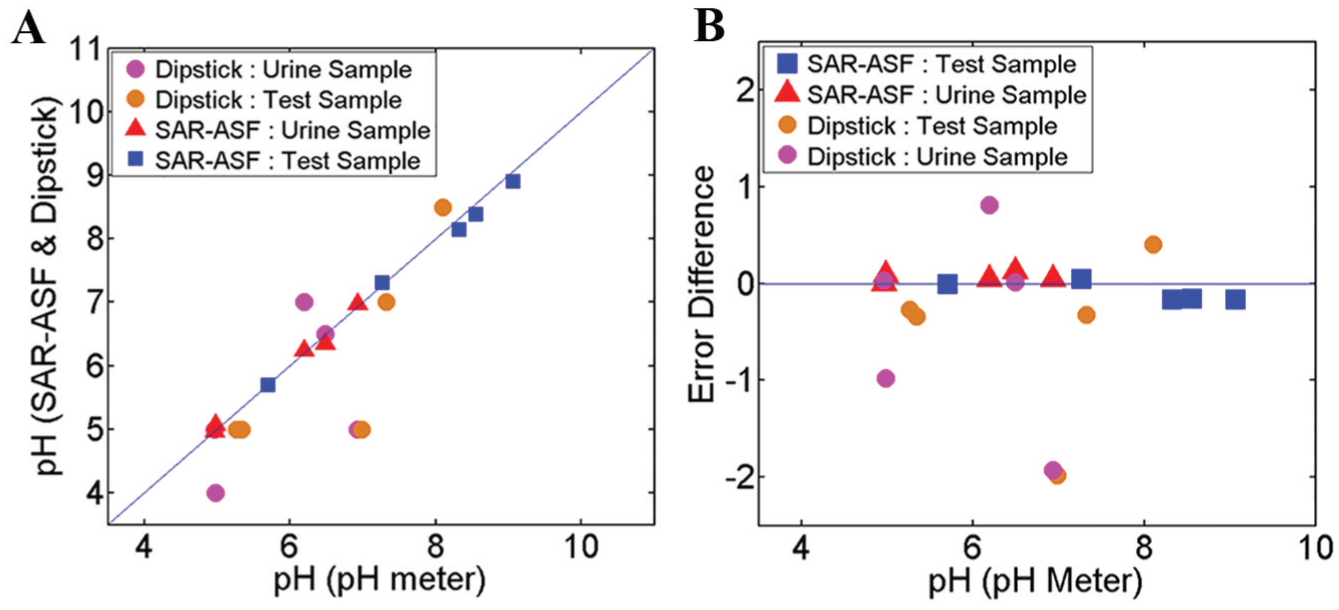
We measured the pH values of five test samples and five urine samples (in triplicate) using the calibration curve. Test samples were prepared using standard buffers of pH 4 and 7. We compared the pH values from the pH meter with the pH values obtained from the calibration curve to estimate the error associated with the SAR-ASF. Test sample pH values were 5.70, 7.26, 8.32, 8.55, and 9.06, which were measured using the gold standard electrode-based pH meter. The pH values obtained using SAR-ASF were 5.70, 7.31, 8.15, 8.39, and 8.90, respectively. We found that the percentage errors in measurement were 0%, 0.63%, −2%, −1.86%, and −1.76%, respectively.
Similarly, we performed clinical trials using urine samples (in triplicate) obtained from a pathological laboratory. The pH values of urine samples obtained using a pH meter were 4.97, 6.19, 4.98, 6.49, and 6.93, and when measured using SAR-ASF, they were 4.97, 6.24, 5.07, 6.36, and 6.98, respectively. Here, the percentage errors in measurement were 0.03%, 0.81%, 1.88%, 2.02%, and 0.76%, respectively. pH values obtained from the pH meter, SAR-ASF, and paper-based dipstick are plotted in Figure 6A for test samples, as well as for urine samples. The graph of error differences versus pH values obtained from the pH meter is plotted in Figure 6B . Error difference is defined as the incongruity between the experimental pH values obtained from the SAR-ASF system or paper-based dipstick and the pH values obtained from the gold standard pH meter.
Error difference = (x – y) x = Experimental pH values obtained from SAR-ASF or dipstick y = pH values obtained from the gold standard pH meter
(
Three volunteers interpreted the readings of the paper-based dipsticks for the same sample.
Study of Tolerance in pH Estimation against Variation in the Loaded Sample Volume
To check the pH values obtained using ASF, the test sample was subjected to volume variations of 5, 10, 15, 20, 25, 30, 35, and 40 µL. A standard buffer of pH 8.08 was chosen to find the change in volume of the pH values using an ASF cartridge. It was found that the average value obtained from all the volumes was 7.98, with a standard deviation equal to 0.08. There was no trend observed for the pH variation ( Fig. 7 ), which indicated that the pH value obtained using the ASF cartridges was independent of the sample volume loaded into the well. This property can be exploited for PoC diagnostics where the resources are limited to loading a precise volume of sample to obtain reliable test results. The above study revealed that pH estimation from SAR-ASF is independent of sample volume loaded into the well.
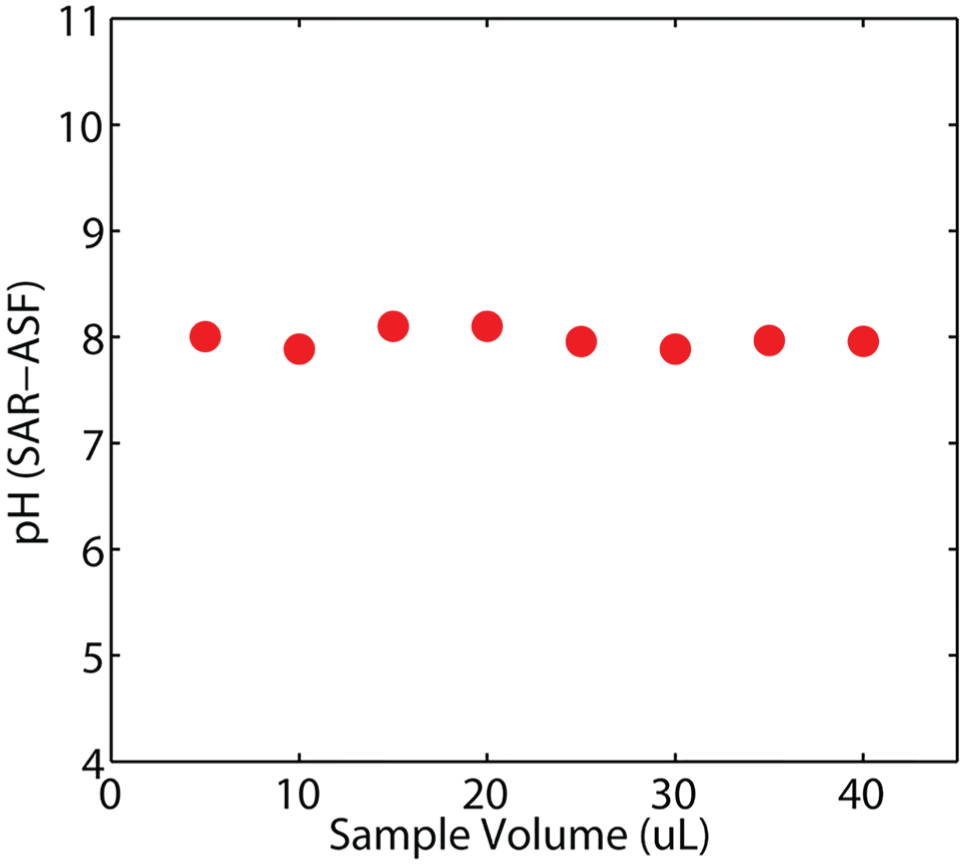
Plot between different volumes of standard buffer (8.08) and pH values obtained from SAR-ASF.
Shelf Life Estimation
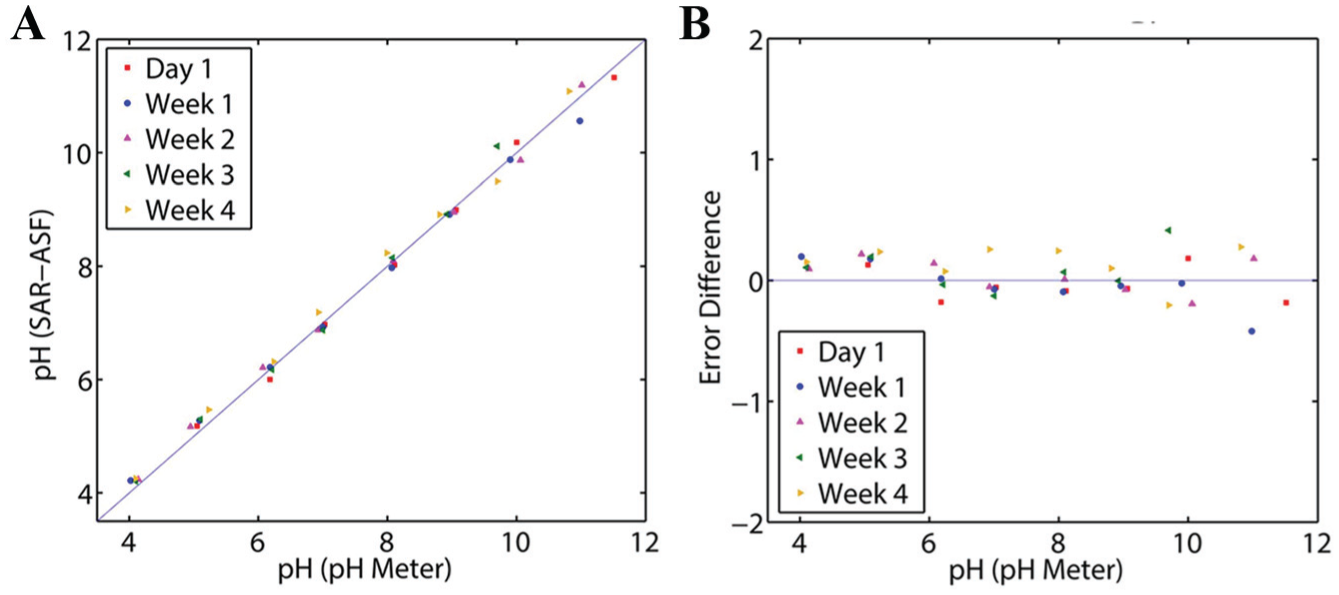
In order to assess the shelf life of ASF cartridges, they were stored up to 4 weeks. Here, shelf life means the time period until which ASF can be used with the same fidelity as obtained on day 1. ASFs were used for the measurement of pH of the standard buffer at day 1, week 1, week 2, week 3, and week 4. We examined the error between the pH values obtained from the pH meter and the extracted hue values through calibration curves and compared all of the error values for different times. A plot between pH values and the error difference in the pH values obtained from the pH meter is shown in Figure 8 . The error percentage for pH 4.05, 5.05, 6.14, 7.01, 8.05, 8.95, 9.90, 11.35 was also calculated, and it was less than 5%. Error values obtained at different times did not have any trend and were similar to the values obtained at day 1. This showed that the shelf life of ASF can efficiently be used for at least 4 weeks.
(
Discussion
The conventional paper-based dipstick method for the estimation of the pH of standard buffers or clinical samples showed a huge variation in terms of error percentage, that is, 20% or more, and the error difference was 2 in pH measurement. In the case of the paper-based dipstick, pH can be measured as 5, 6, 6.5, 7, 7.5, 8, and 8.5 with low fidelity to interpret accurate pH values. The glass electrode–based pH meter is one of the orthodox methods used in laboratories for the measurement of pH of standard buffers and clinical samples with minimum variation in error percentage (the accuracy of the pH meter is 0.01). The colorimetric estimation using SAR-ASF was done by smart camera enclosed in a custom-built 3D printed prototype with high fidelity, superior performance, and less error percentage than dipstick estimation. We observed red color for pH 4.0 and yellow color for pH 6.0 when using the universal indicator; hence, the hue value variation was not significant. We estimated the error percentage for five test samples (standard buffer) and five urine samples, in triplicate, which was within 2%. We rectified all the major external factors, such as blocking ambient light and fixing the distance and position of the smart camera from the acrylic plate by using a stand-alone custom-built 3D printed prototype. We also validated ASF cartridges with different volumes of the test sample and found that pH change is independent of the volume of sample, with a standard deviation of 0.08 for ASF cartridges. We also checked the shelf life of ASF cartridges by estimating the pH on day 1, week 1, week 2, week 3, and week 4 and found that the error percentage for pH 4.05, 5.05, 6.14, 7.01, 8.05, 8.95, 9.90, and 11.35 was less than 5%. Although the shelf life of the existing dipstick is 1–5 years, which is highly significant compared with the studied shelf life of the proposed device, adopting various strategies such as storing ASF at low temperature and placing it in vacuum casing may improve the shelf life of ASF to several months. The percentage error was less than 5% because we curbed the external conditions that interfere in the image processing. These external factors could be the ambient light condition, distance between the smart camera and acrylic plates, position of the smart camera, improper manual mixing of melted agarose and indicator, and so forth. These results and error percentage obtained are highly authentic, as has been verified and tested with repeated trials. The proposed ASF cartridges are cost-effective, at about $0.30, and the SAR-ASF costs around $3 (excluding the smart camera). The cost of a smart camera is approximately $280, but our proposed system is flexible enough to work with any camera. With the change in camera, calibration curve may change depending on the spectral sensitivity of the image sensor of the camera. After standardizing the system with the new camera intended to be used, our proposed device is expected to work in the same manner. We firmly believe that SAR-ASF is tailor-made for PoC diagnostics with its simplistic approach and portable, robust, and accurate quantitative pH estimation compared with conventional paper-based dipstick interpretation.
Conclusions
Colorimetric assays in healthcare are quite frequently conducted in both developed and developing countries, for example, paper-based dipstick urinalysis. Although dipstick assays are simple to use, they are error-prone with interpretation flaws and false-positive or false-negative results. Current research includes PoC diagnostics, which aims to have an error-free, cost-effective, multiplexed, robust, and reliable platform for different colorimetric assays. In this paper, a novel idea has been explored to achieve low-cost and easy-to-use colorimetric analytical devices. It consists of ASF for the estimation of pH of standard buffer solutions and urine samples. A smart camera was used to quantify the chromogenic change by capturing and processing the images to get an accurate pH value of the test samples. The percentage error in measurement of pH by proposed SAR-ASF was well within 2%. This proves the authenticity of SAR-ASF, as the results are close to those of the gold standard glass electrode–based pH meter, while the paper-based dipstick interpretation for the same clinical sample had an error of 27%. The proposed method has a wide scope and can potentially be used for the quantification of different biological analytes, such as glucose and proteins. The scheme of the proposed method can be easily extended for other analytes by impregnating ASF with chemical indicators that are specific to the chosen target analyte. As in the case of conventional paper-based dipsticks, wherein multiple reagent pads are impregnated with different chemical indicators, the proposed ASF architecture can incorporate multiple reaction chambers (impregnated with different chemical indicators) for multiplexed quantitative detection of various biological analytes. The proposed idea has a futuristic approach to be used as an automated, handheld, and portable tool for monitoring health and environment factors as well.
Footnotes
Declaration of Conflicting Interests
The authors declared no potential conflicts of interest with respect to the research, authorship, and/or publication of this article. We have acknowledged funding agency in the Funding section of the paper.
Funding
The authors disclosed receipt of the following financial support for the research, authorship, and/or publication of this article: This work was supported by the Department of Biotechnology, Government of India (DBT00411), as a part of the Innovative Young Biotechnologist Award (IYBA-2013) project.