
Abstract
Disposable, low-cost microfluidic cartridges for automated blood cell counting applications are presented in this article. The need for point-of-care medical diagnostic tools is evident, particularly in low-resource and rural settings, and a full blood count is often the first step in patient diagnosis. Total white and red blood cell counts have been implemented toward a full blood count, using microfluidic cartridges with automated sample introduction and processing steps for visual microscopy cell counting to be performed. The functional steps within the microfluidic cartridge as well as the surrounding instrumentation required to control and test the cartridges in an automated fashion are described. The results recorded from 10 white blood cell and 10 red blood cell counting cartridges are presented and compare well with the results obtained from the accepted gold-standard flow cytometry method performed at pathology laboratories. Comparisons were also made using manual methods of blood cell counting using a hemocytometer, as well as a commercially available point-of-care white blood cell counting system. The functionality of the blood cell counting microfluidic cartridges can be extended to platelet counting and potential hemoglobin analysis, toward the implementation of an automated, point-of-care full blood count.
Introduction
We present a microfluidic-based system to perform automated whole-blood sample preparation for white blood cell and red blood cell counting applications. The centralized and expensive nature of medical tests makes access to health care difficult for many people, particularly those in rural settings. Effective and low-cost point-of-care medical diagnostic tests are required to provide developing countries and rural communities with accessible health care solutions. 1 Such point-of-care solutions could be particularly beneficial for the implementation of blood cell counting tests, which form part of a full blood count test panel, and is often the starting point in the process of diagnosing a patient. 2 Full blood count tests require blood to be transported from clinics to laboratories for analysis using large, costly laboratory equipment. Thus, cost-effective point-of-care solutions to perform such tests would greatly benefit the developing world.
Lab-on-a-chip or microfluidic devices are often applied to point-of-care diagnostic solutions as they are low cost, compact, and disposable and require only small sample volumes.3–8 For such devices, various reagents are required for sample preparation and analysis, and for an integrated solution to be realized, various components such as automated sample introduction, on-chip reagent storage, and various fluidic processing steps are required. Microfluidics has evolved into a key enabling technology for many applications in the life sciences and diagnostics and more recently has seen a drive toward commercialization,9,10 particularly for point-of-care diagnostic applications. 11
A number of point-of-care medical diagnostic systems have been, and continue to be, developed, including commercial systems such as HemoCue (Brea, CA), a system that has shown to be highly successful for measuring hemoglobin at the point of care. The technology has been extended to white blood cell counting, but each test requires a separate stand-alone system. A number of microfluidic-based developments for point-of-care testing are in progress, 3 with a number of these focusing on blood cell counting or full blood count tests, but often make use of impedance measurements or other techniques using sophisticated peripheral detection requirements. Recent blood analysis systems that have been developed incorporate electrical or impedance measurements using microfabricated electrodes12,13 or fluorescence and light-scattering techniques. 14 A thorough review regarding microfluidics for hematology applications describes various cell counting techniques, including optical and impedance methods, as well as commercially available systems. 15
The initial focus of this work is on total white and red blood cell counts, using a microfluidic cartridge for sample processing. The results using the first iteration microfluidic device16,17 showed that the most simple—and thus low-cost—approach for microfluidic component implementation was not adequate compared with techniques based on manual cell counting principles. An improved microfluidic design has been developed to incorporate enhanced mixing and metering components, which together with this work provides the foundation on which to successfully implement automated, rapid, and low-cost blood cell counting tests.
Cell count estimates were obtained using automated microscopy analysis and were compared with a widely accepted manual method for cell counting using a hemocytometer. 18 In addition, the cell count results obtained using the microfluidic cartridges were compared with the gold-standard full blood count results obtained from a pathology laboratory using flow cytometry techniques and were also compared with the commercially available point-of-care white blood cell counting HemoCue system.
A microfluidic cartridge capable of preparing a blood sample for visual blood cell counting, requiring only a small drop of blood to be introduced to the device, has successfully been developed. Important functional blocks that were required included fluidic interfaces, 19 sample preparation, 20 and reagent storage 21 and were effectively implemented. Dilution factors in the processing steps are also crucial for obtaining accurate cell count results. The cell counting results from the cartridges are comparable to both automated and manual gold-standard blood cell counting methods. These results illustrate the potential of low-cost, disposable microfluidic cartridges to be used effectively for blood cell counting toward full blood counting applications at the point of care and ultimately in developing settings where the need for such tests is greatest.
Materials and Methods
Microfluidic Cartridges
Microfluidic cartridge designs were conceptualized based on manual blood cell counting sample preparation, where blood sample and reagent dilutions and mixing are required before visualizing the cells for counting. Computer-aided drawing (CAD) designs were first formulated, with sample cartridges milled out of polymethyl methacrylate (PMMA) material. The cartridge was sealed using a thin film to form the bottom layer of the device. The milled cartridges enabled the general fluidic functionality to be tested. Once the cartridges proved to be functional, larger numbers of cartridges were manufactured from polycarbonate using injection molding processes. The microfluidic cartridge consists of the molded part itself and two foil lids for covering the top and bottom side. After inserting functional elements such as a polytetrafluoroethylene (PTFE) membrane and a stirrer bar, the cover lid foils were bonded to the molded part. During the final postprocessing, a hydrophilic treatment was applied to the cartridge. All microfluidic cartridges were manufactured by microfluidic ChipShop GmbH (Jena, Germany). Blister pouches containing either a white blood cell or red blood cell reagent were also manufactured by microfluidic ChipShop GmbH. The upper dome of the blister pouch was filled with 250 µL of the required reagent, after which the blister was sealed using a stamping tool to attach the lower or pierceable foil. The blister pouch was then mounted to a microfluidic cartridge using a double-sided adhesive ring for each test to be carried out. Details regarding blister pouch manufacture are provided by Smith et al. 22
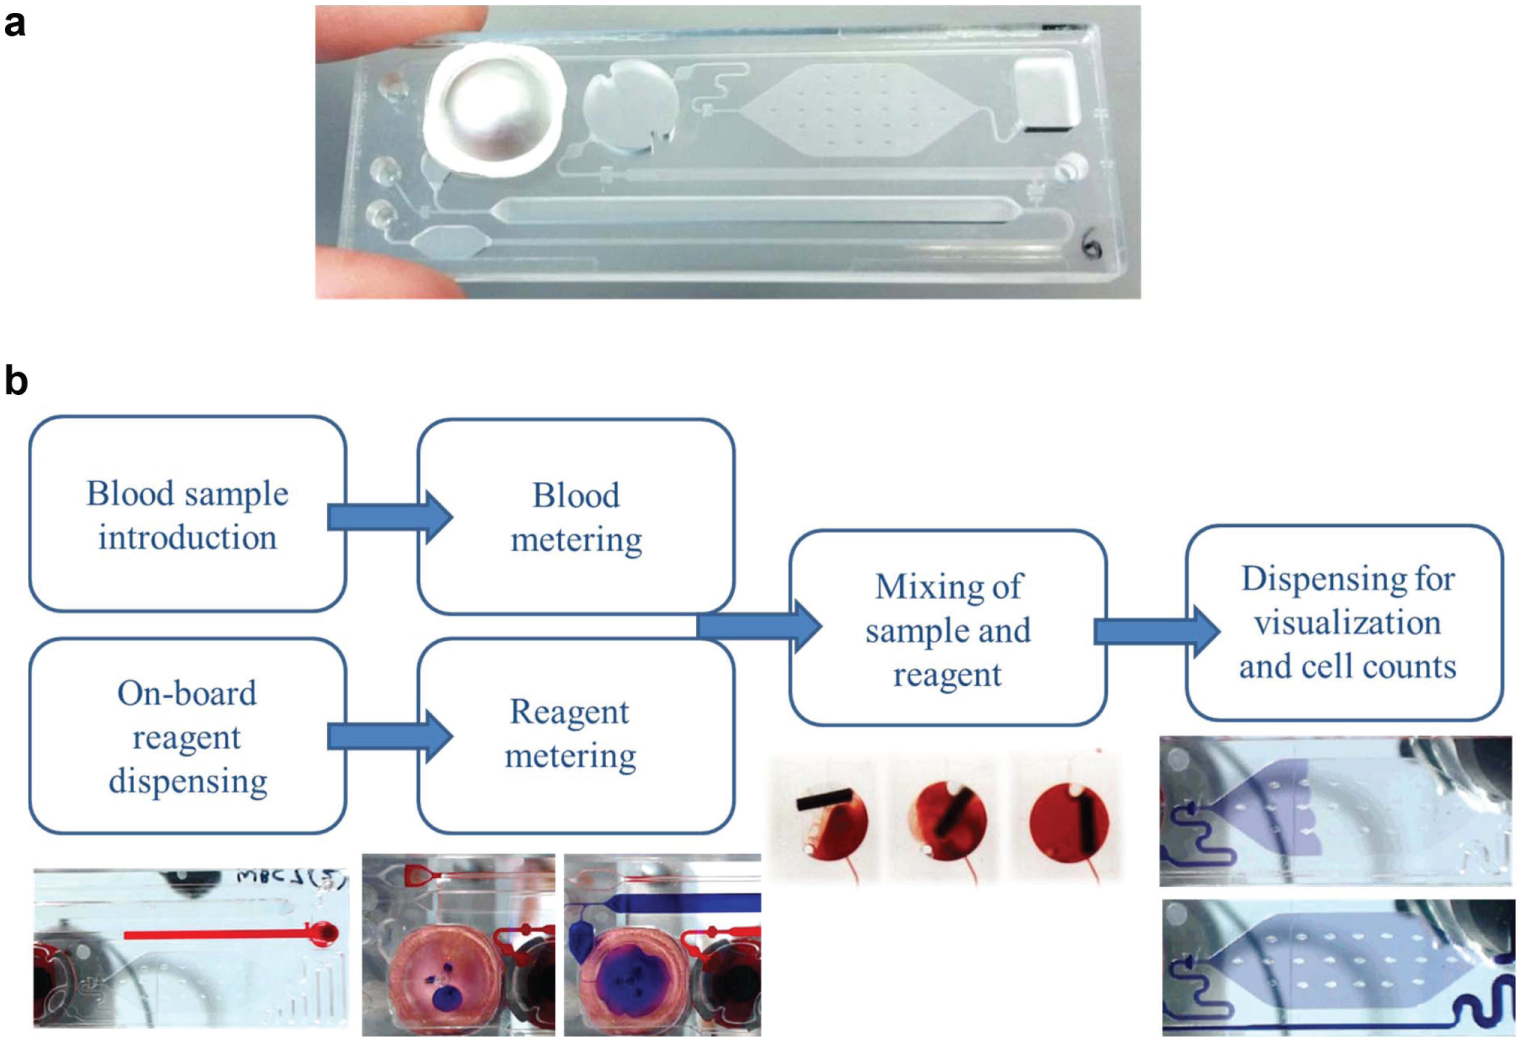
Figure 1a shows an example of the microfluidic cartridges that were designed and manufactured, with the blister pouch containing blood cell counting reagent mounted to the device. Microfluidic cartridge dimensions are 75.5 × 25.5 mm and are 3 mm thick. Figure 1b describes the high-level functional components of the cartridge to prepare a blood sample for visualization and blood cell counting. Figure 2 shows detailed schematics of the fluidic flow through the cartridge for each functional step. The numbering corresponds to the functional steps provided in Figures 3 and 4 , where the surrounding instrumentation required to perform the functional fluid steps is described in more detail.
(
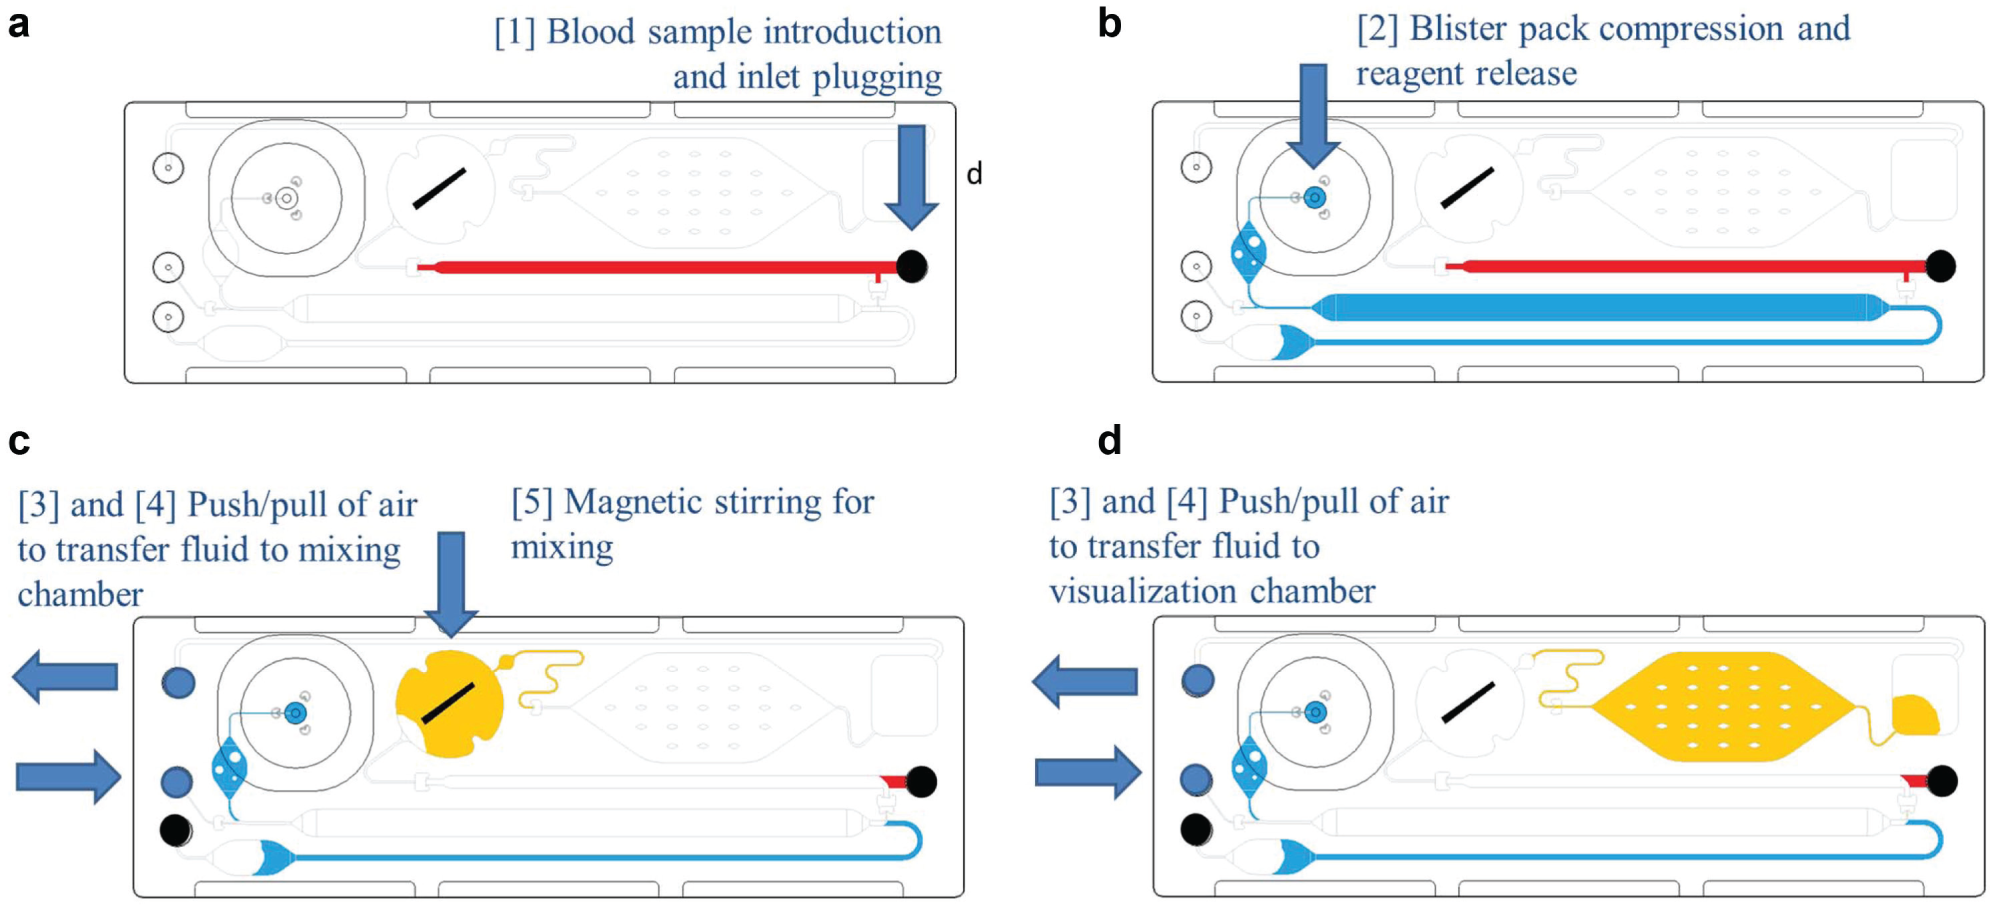
Fluidic functional steps performed in the microfluidic cartridge, illustrating (
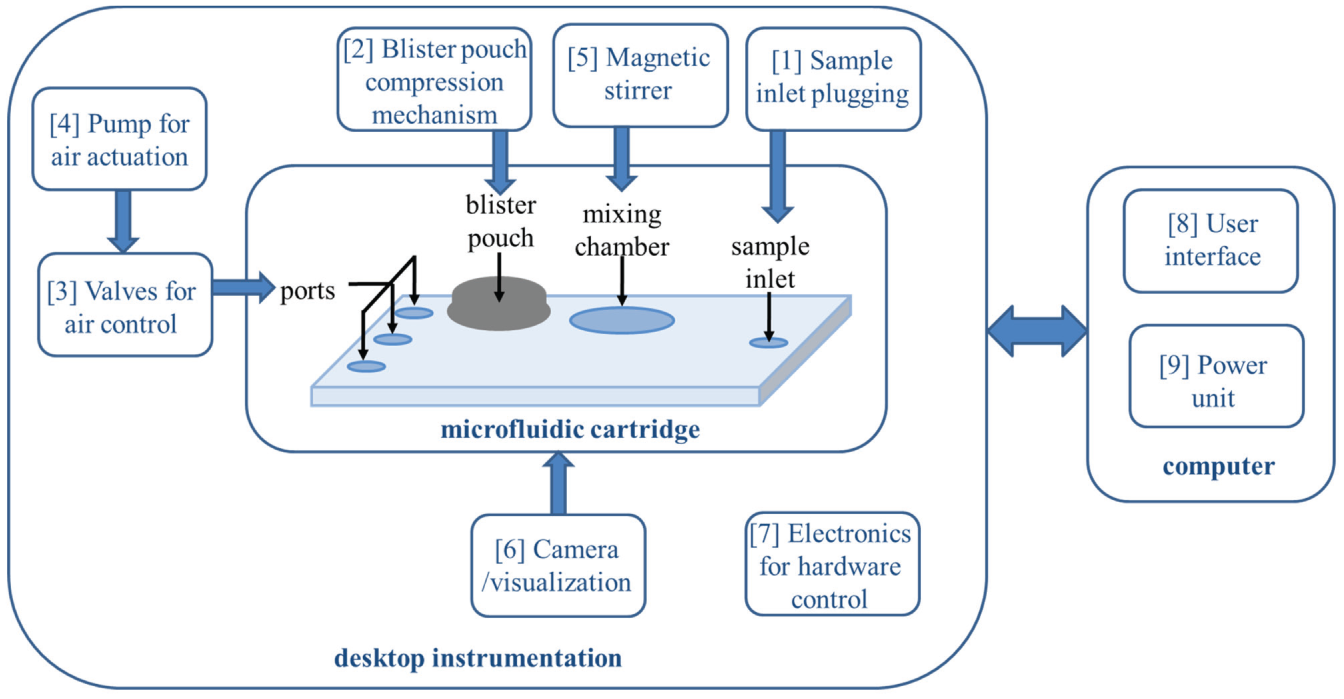
Functional steps implemented for control and testing of the microfluidic cartridges in an automated process. A desktop instrumentation setup houses the cartridge and enables functional steps 1 to 6 to be carried out through a control system (7) that interfaces with a computer to provide power to the system (8) and control of the microfluidic cartridge through a user interface.
(
Reagents
Blister pouches were filled with either a standard white blood cell lysing and staining reagent containing acetic acid and crystal violet or a standard red blood cell phosphate buffer solution (PBS) reagent. The white blood cell count test reagent was made up of crystal violet, glacial acetic acid, and deionized water. The red blood cell count test reagent consisted of a phosphate buffer. Solutions were stored at room temperature and are stable for long periods when stored away from direct sunlight or heat. All chemical components making up the blister pack diluents were purchased from Sigma Aldrich (Munich, Germany).
Experimental Setup
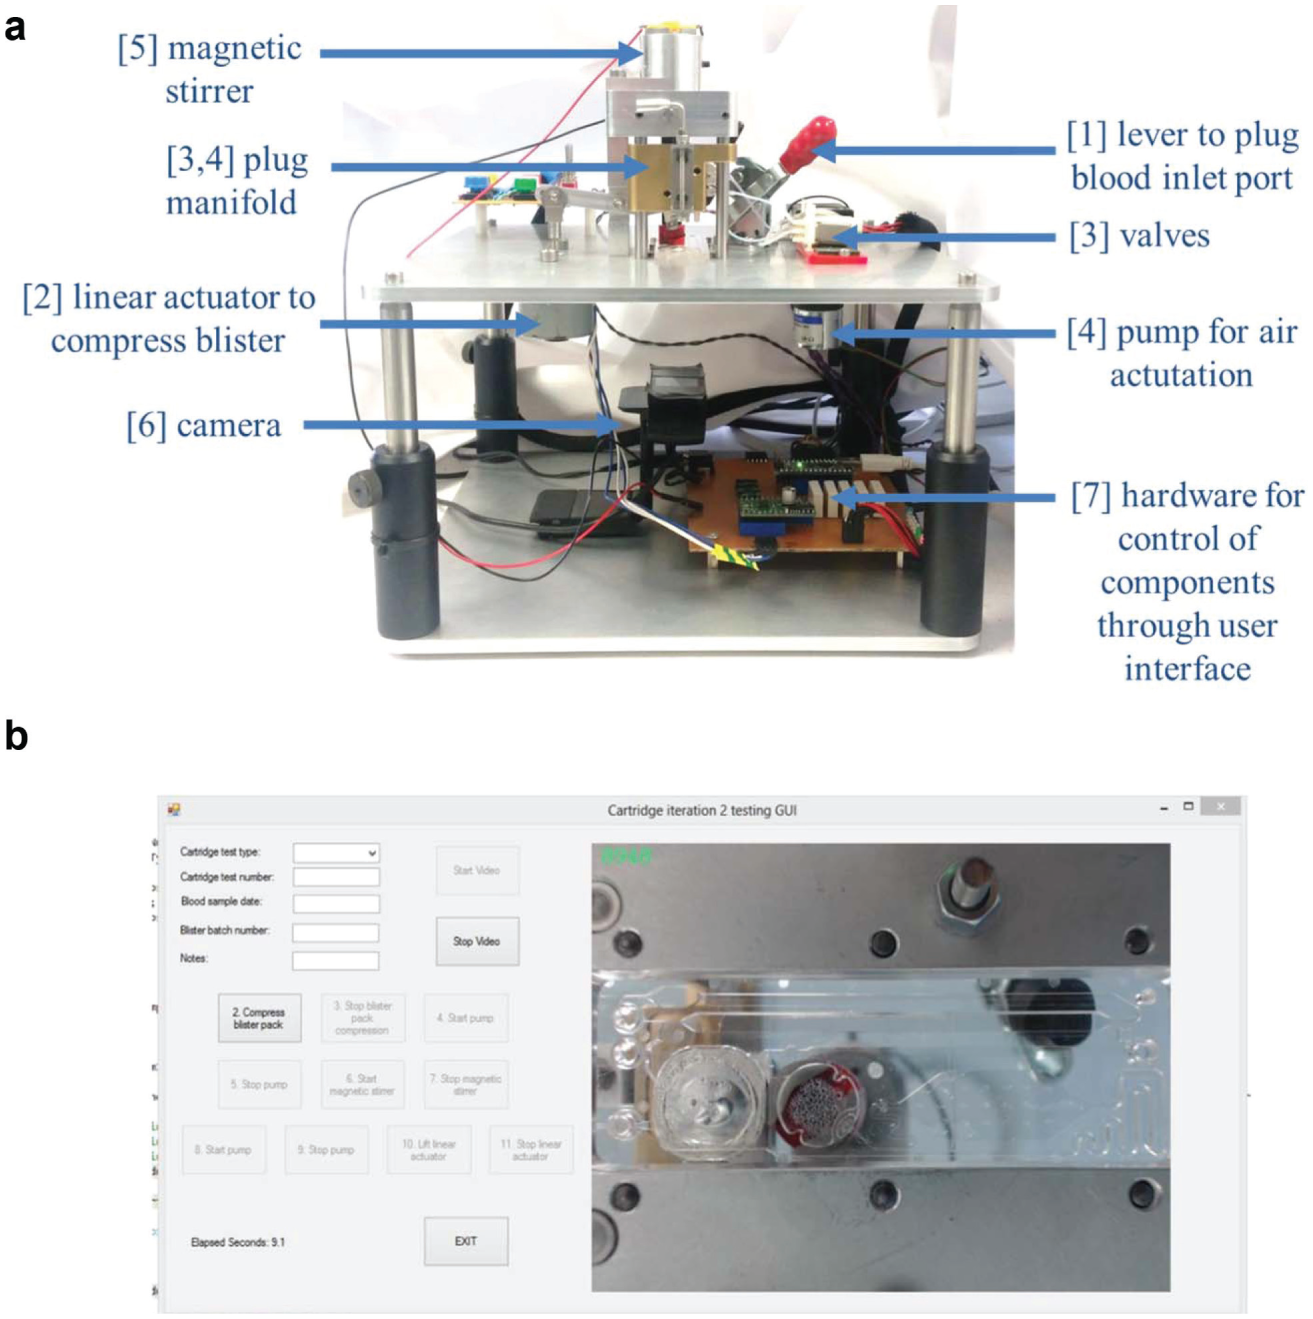
The microfluidic cartridges were tested using an experimental test setup, allowing for automated sample processing and testing of the cartridges. The various functional steps and components of the microfluidic cartridge test setup are shown in Figure 3 . Briefly, the sequence of steps is as follows: (1) the blood sample is inserted into the microfluidic cartridge and the sample inlet port plugged, (2) the blister pouch is compressed and reagent released into the microfluidic cartridge, (3) ports are plugged and/or vented in preparation for air actuation, (4) the pump is activated to transfer the sample and reagent to the mixing chamber, and (5) the magnetic stirrer is activated to mix the sample and reagent, after which (4) is repeated to transfer the fluid through to the visualization chamber. Figure 4 shows the assembled test setup and corresponding user interface that allows for control of the various components and visualization of the cartridge functionality through a webcam (C920; Logitech; BNS, Pretoria, South Africa). The components are numbered corresponding to the functional steps described previously and also correspond to the numbering in Figures 1 and 3 . The dimensions of the instrumentation shown in Figure 4a are 250 × 250 × 250 mm.
The cartridge is inserted above the webcam by sliding the cartridge into place on the experimental setup, which contains an opening above the camera for visualization of the cartridge. The plug manifold is lowered into the three ports of the microfluidic cartridge to ensure that the solenoid valves (S070; SMC; RS Components, Johannesburg, South Africa) and peristaltic pump (400F/A; Watson-Marlow Bredel S.A. (Pty) Ltd., Johannesburg, South Africa) are connected to the cartridge for control of fluidic and air flow.
The cartridge is then ready for testing, and a blood sample can be inserted into the sample inlet port. Capillary action allows for the blood sample to move into the cartridge and fill the blood metering channel, which takes approximately 30 s to 1 min to complete. The sample inlet port is then plugged manually using a toggle clamp that forms part of the experimental setup.
Next, the linear actuator motor (80910002; Crouzet; RS Components, Johannesburg, South Africa), controlled by a stepper motor driver (A4988; Pololu; Micro Robotics, Centurion, South Africa) and used to compress the blister pouch, is activated and takes approximately 30 s for full blister compression. The motor can apply a force of up to 58 N and compresses the blister at less than 0.5 mm/s via a rubber foot attached to the motor, similar in diameter to the blister pouch (13 mm). Complete emptying of the blister and subsequent filling of the blister reagent metering chamber take 1 min.
The pump is then activated to transfer the blood and blister reagent into the mixing chamber, with a flow rate of 500 µL/min, and takes between 25 and 30 s to complete. The magnetic stirrer bar inside the mixing chamber is then activated by a magnet attached to a DC motor (RE 280; MFA/Como Drills; RS Components, Johannesburg, South Africa), with complete mixing occurring within 30 s.
The pump is then reactivated to transfer the fluid into the visualization chamber, requiring 20 s for complete filling. The complete process from the time the blood is inserted until the blood cells can be visualized takes between 3 and 4 min. An Arduino Nano microcontroller (RS Components, Johannesburg, South Africa) is used to implement each step through the user interface on the computer.
For each cartridge test, a video file is captured, as well as a data file detailing the cartridge type, number, date, and so on, as well as time stamps for each hardware component when activated and when stopped.
Blood Cell Counting Test Comparisons
To allow for the functionality of the microfluidic cartridges for blood cell counting to be assessed, comparisons were made against a number of other blood cell counting tests. These tests include the results for total white blood cell counts and total red blood cell counts as carried out as part of a full blood count test at pathologist laboratories, as well as blood cell counts performed using the hemocytometer method, which is the widely accepted manual method of carrying out blood cell counts using microscopy. 18 For the white blood cell count comparisons, results using a HemoCue WBC machine were also recorded.
When a blood sample was drawn for testing purposes, two vials were collected. One vial of blood was sent to Ampath Laboratories (Pretoria, South Africa) for a full blood count to be performed. The acceptable reference range of the blood cell count results is provided along with the full blood count results. For a female adult patient, as in the case of the blood samples used for this study, the reference ranges should be between 3.92 and 9.88 × 10⁹ cells/L for a total white blood cell count and between 4.13 and 5.67 × 10¹² cells/L for a total red blood cell count.
For both white and red blood cell counts, hemocytometer tests were also carried out. A Neubauer improved cell counting chamber was used for the hemocytometer experiments. Each hemocytometer grid has four areas, where each is a block of 1 × 1 mm. Three hemocytometer counting grid tests were carried out for both white and red blood cell counts, giving a total of 12 images for each type of test.
For the total white blood cell count, a 100-µL sample of blood is added to a 1900-µL sample of white blood cell reagent (1:20 dilution). This is thoroughly mixed and dispensed into the hemocytometer. For red blood cells, a 100-µL sample of blood is added to a 900-µL sample of red blood cell reagent (1:10 dilution) and mixed thoroughly. From this solution, 50 µL is taken and added to another 950 µL of red blood cell reagent (1:20 dilution) and mixed thoroughly to give a 1:200 dilution.
For comparisons for the total white blood cell counts, five HemoCue WBC tests were also carried out. A small drop of blood was placed into the HemoCue cuvettes and placed into the machine for a test to be run, with approximately 2 min required per test. The results are displayed on the screen of the HemoCue WBC for total white blood cell counts.
Results
Automated cartridge results were carried out for 10 white blood cell counting and 10 red blood cell counting cartridges. The cartridges are placed into the cartridge rig test setup and the plug manifold is connected. The cartridge actuation is then controlled through the user interface and tests run for each cartridge.
For white blood cell counting tests, a 30 µL sample of blood is dispensed into the inlet port and the cartridge rig test is carried out, capturing a video of the process for each cartridge.
For red blood cell tests, a 30-µL sample of blood prediluted with red blood cell reagent in a 1:10 dilution is dispensed into the inlet port and the cartridge rig test is carried out, capturing a video of the process for each cartridge.
A manual cartridge test was carried out for one white blood cell counting and one red blood cell counting cartridge. This entailed using the diluted blood solutions for white and red blood cell counts as described in “Blood Cell Counting Test Comparisons.” The solution was dispensed into the cartridge, filling the visualization chamber. This is done to mimic a hemocytometer result (i.e., assuming dilution and mixing have been completed accurately). For both automated and manual cartridge tests, microscope images were captured across the visualization chamber for both white and red blood cell counting cartridges.
A visual comparison of microscope results for hemocytometer, manual cartridges, and automated cartridges was made for white blood cell counting and red blood cell counting cartridges, as shown in Figure 5 . Visually, the results compare well, and the cell concentrations appear to be very similar in all three cases for both the white and red blood cell cartridges. The cell distribution is also even, indicating that the automated cartridges work well in terms of mixing and dispensing the sample. In all cases the total magnification is 100×.
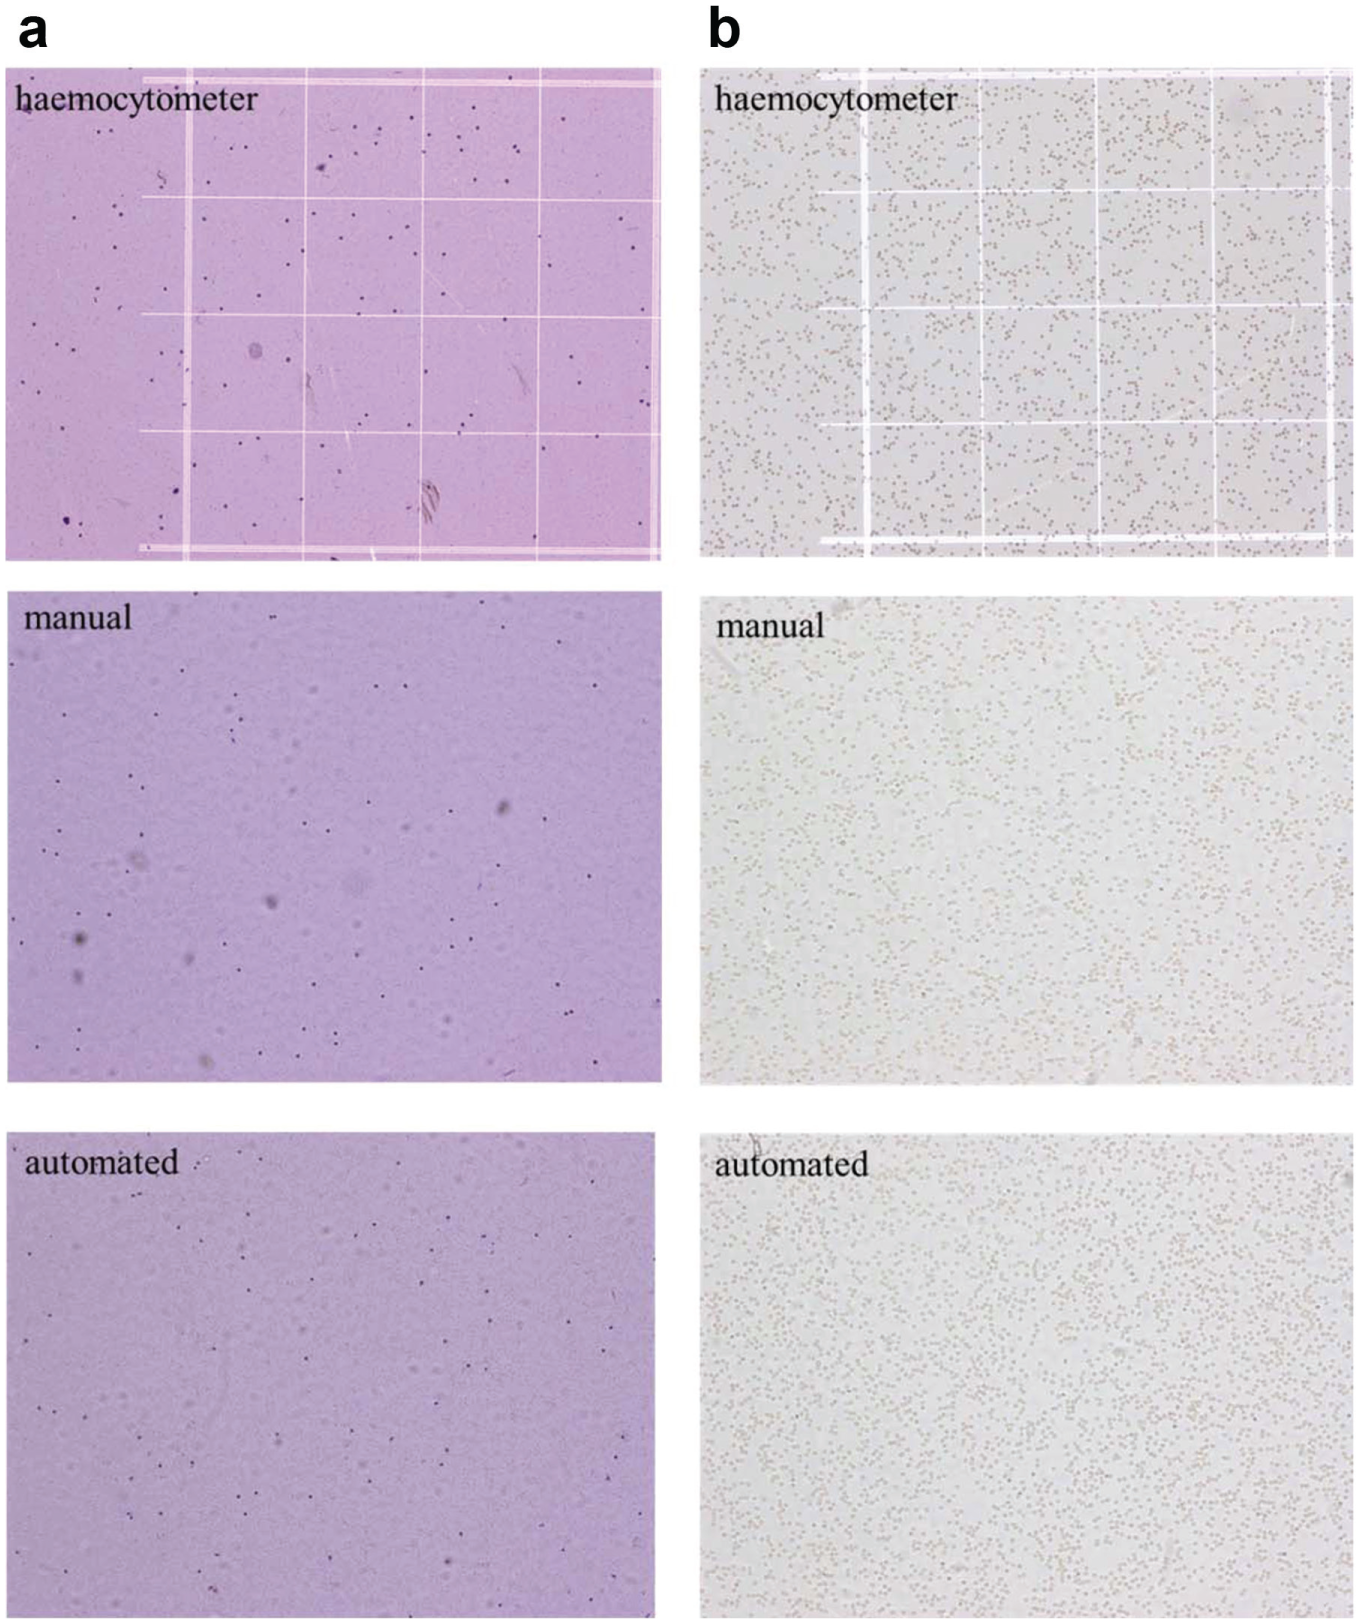
Visual comparisons of hemocytometer, manual cartridge, and automated cartridge viewing chamber microscopy results for (
Automated image processing was implemented on the microscopy images to obtain results for both white and red blood cell counting. Figure 6 gives an example of the image-processing software, where the cell detections are shown in green and an automated count of the cells in the image is returned. The image-processing method for the cell counting consisted of an Otsu-based segmentation on the saturation channel of the hue-saturation-value (HSV) color space image, 23 followed by morphological filtering and a count of the connected components. 24
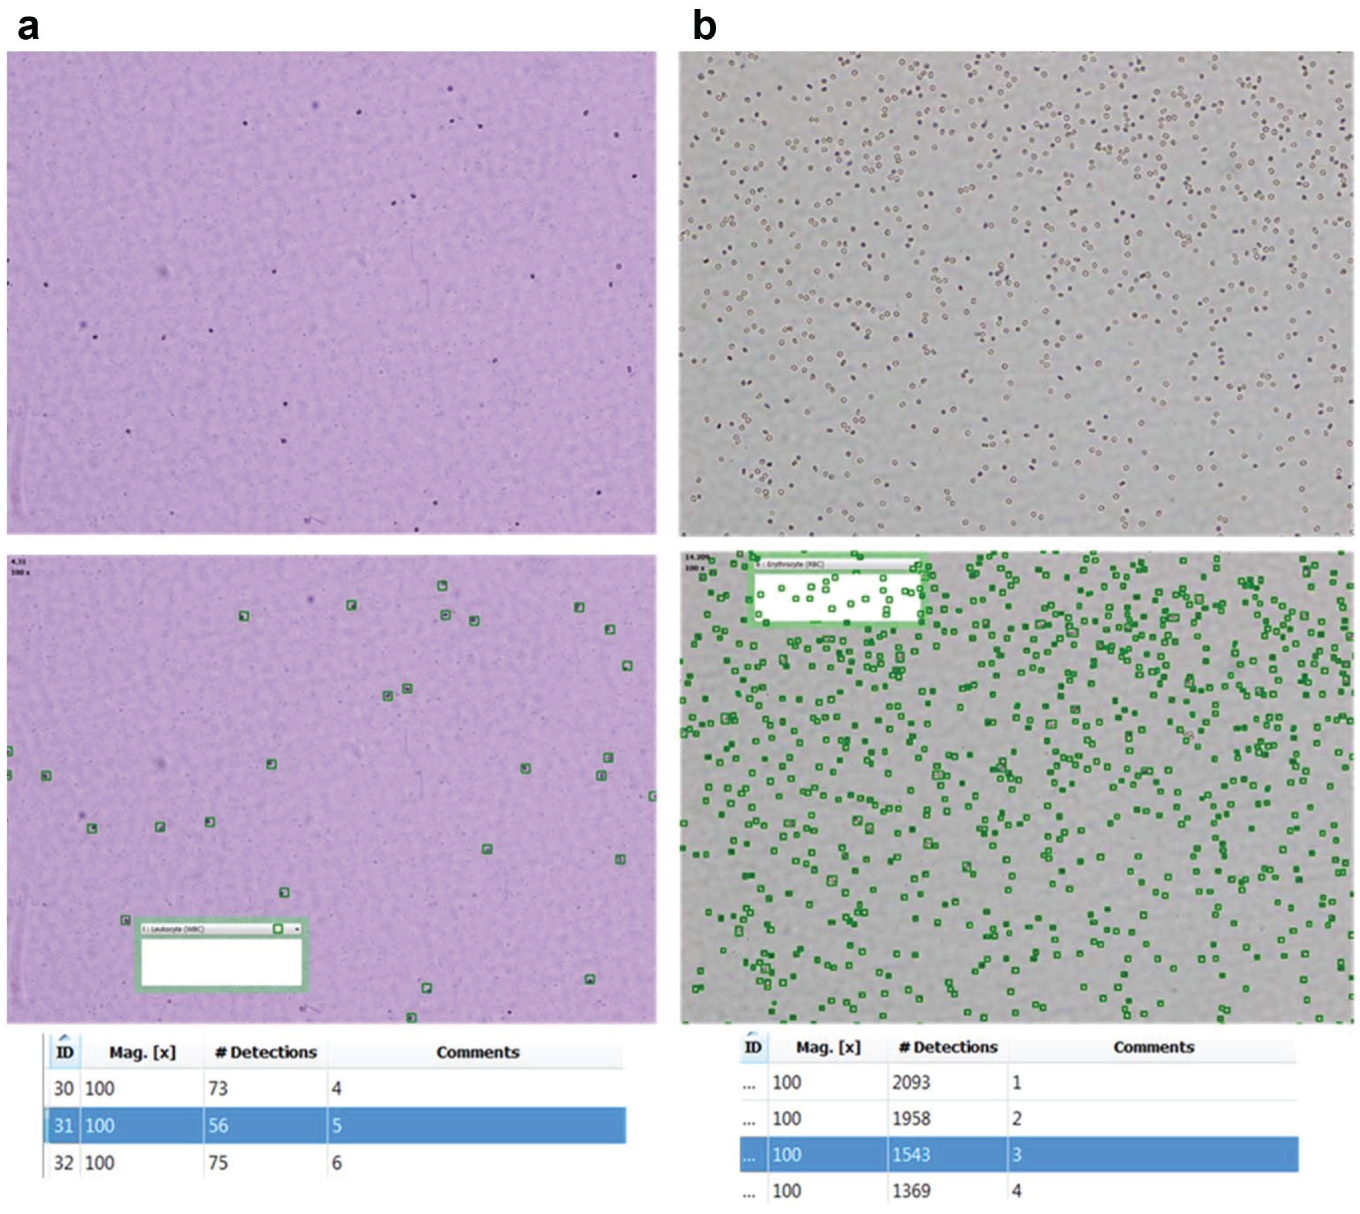
Automated cell identification and counting from microscope images for (
Cell counts per liter are calculated using the dimensions of the microscope image area captured and the depth of the chamber being imaged, which is 100 µm for both hemocytometer and cartridge results. Table 1 summarizes the blood cell counting results obtained for white and red blood cells for automated cartridge tests, manual cartridge tests, hemocytomter tests, and the full blood count gold-standard pathology tests. For the white blood cell counts, the HemoCue WBC test result average over five tests is also provided.
Blood Cell Counting Results of the Automated Microfluidic Cartridge Compared with Full Blood Count Pathology Results, Hemocytometer Results, Manual Microfluidic Cartridge Results, and HemoCue WBC Results.
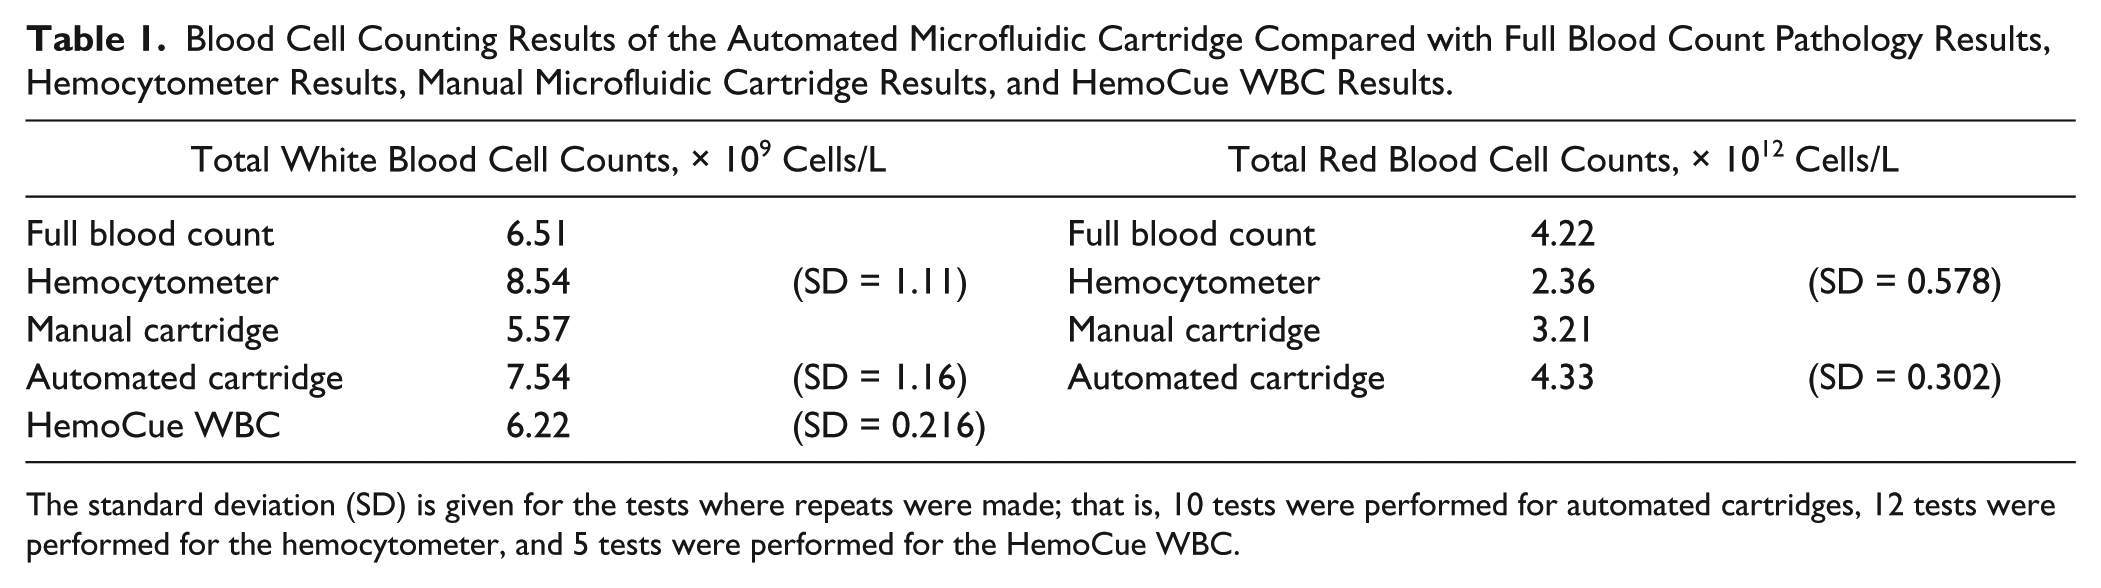
The standard deviation (SD) is given for the tests where repeats were made; that is, 10 tests were performed for automated cartridges, 12 tests were performed for the hemocytometer, and 5 tests were performed for the HemoCue WBC.
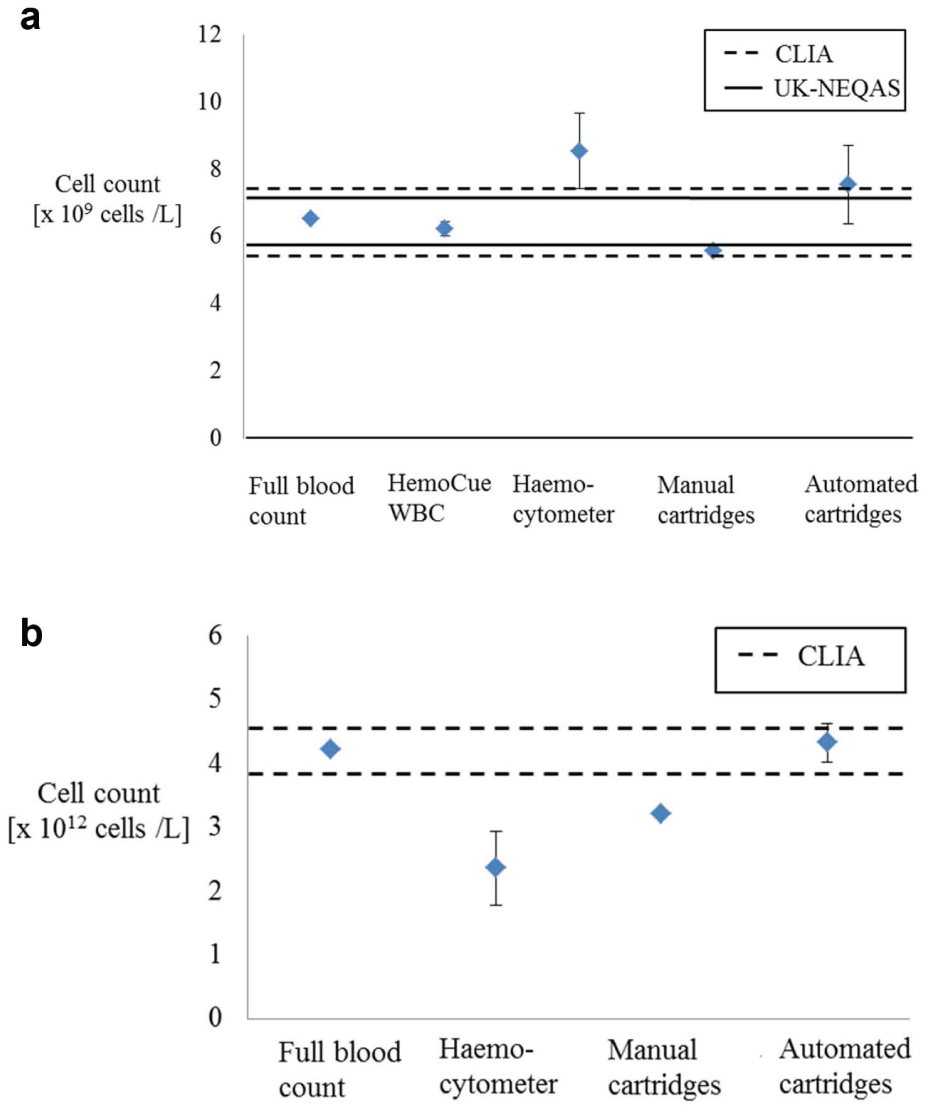
Figure 7 illustrates the comparisons of these blood cell counting test results for total white blood cell counts and total red blood cell counts, respectively, and indicates the acceptable ranges of error for these cell count results. Two internationally accepted performance limits can be used to determine the accuracy of the results and have been used previously in the validation of the HemoCue WBC equipment. 25 The performance limits were based on values from the Clinical Laboratory Improvements Amendments (CLIA)–88, which state that for white blood cell counts, an error range of up to 15% from the true value is acceptable, while for red blood cell counts, an error range of up to 6% from the true value is acceptable. For white blood cell counts, an additional performance limit from the United Kingdom National External Quality Assessment Service (UK NEQAS) can be used, which states that an error range of 8% to 10% from the true value is acceptable.18,25
(
For the white blood cell counts, the 10% UK NEQAS range was calculated using the full blood count pathology value of 6.51 × 10⁹ cells/L, giving upper and lower acceptable range limits of 7.16 × 10⁹ cells/L and 5.85 × 10⁹ cells/L, respectively. Similarly, for the CLIA-88 range, the 15% upper and lower limits were calculated as 7.48 × 10⁹ cells/L and 5.53 × 10⁹ cells/L, respectively.
For the red blood cell counts, the 6% CLIA-88 range was calculated using the full blood count pathology value of 4.22 × 10¹² cells/L, giving upper and lower acceptable range limits of 4.47 × 10¹² cells/L and 3.97 × 10¹² cells/L, respectively.
Discussion
The white blood cell and red blood cell counting results obtained using the automated microfluidic cartridges compare well to other blood cell counting methods—both automated and manual. For white blood cell counting results, the average automated microfluidic cartridge cell count results lie just outside of the acceptable CLIA-88 range of error of 15% from the true value of 6.51 × 10⁹ cells/L obtained from the pathology full blood count result. The average white blood cell count across the 10 cartridges was 7.54 × 10⁹ cells/L. For the 10 automated white blood cell cartridge tests that were carried out, the average percentage variation from the true result was 15.82%, which is just more than the acceptable CLIA-88 range of 15%. Of the 10 automated cartridges tested, 4 cartridges fell within less than 12% error.
It can be noted that although the automated microfluidic cartridges for the white blood cell counts fell just outside of the acceptable error range, the hemocytometer results performed more poorly compared with the acceptable error ranges. This is the widely accepted manual method of cell counting, indicating the difficulty associated with using manual counting methods for performing blood cell counting.
For red blood cell counting results, the average automated microfluidic cartridge cell count results are within the acceptable CLIA-88 range of error of 6% from the true value of 4.22 × 10¹² cells/L obtained from the pathology full blood count result. The average red blood cell count across the 10 cartridges was 4.33 × 10¹² cells/L. For the 10 automated red blood cell cartridge tests that were carried out, the average percentage variation from the true result was 2.61%, which lies well within the acceptable CLIA-88 range of 6%. Of the 10 automated cartridges tested, 6 cartridges fell within less than 6% error.
It is likely that the red blood cell counting results performed better than the white blood cell counting results as more cells are counted to obtain a red blood cell count, and thus the statistical sample size is larger.
The hemocytometer results for both the white and red blood cell counts did not compare well to the full blood count pathology result and in both cases fell outside of the acceptable error ranges set by CLIA-88. From this it can be seen that accuracy, particularly for white blood cells where fewer cells are counted to obtain a cell count, when using manual methods, remains a challenge.
The results of this work show a significant improvement in comparison to the first iteration microfluidic device 16 and previous version of the experimental setup, 17 where the percentage variations from the reference results were far removed from the acceptable CLIA-88 ranges.
The main challenges that needed to be addressed in terms of the cartridge functionality were the correct metering of the blood and blister reagent for accurate dilution factors to be achieved, as well as effective mixing to be implemented. The improved cartridge design addressed these aspects by implementing blood and blister reagent metering chambers, as well as an active mixing mechanism using a magnetic stirrer, as opposed to passive mixing, which relies on diffusion and was shown to be insufficient in the first version of the cartridge. Additional improvements that were made to the cartridge design included the use of capillary filling to introduce and meter the blood sample as opposed to manually inserting a specific volume of blood.
Improvements to the first version of the instrumentation design were also made by implementing more compact and lower cost components. The linear actuator used for plugging the blood sample inlet was also removed as the capillary filling replaced this functionality. The linear actuator to compress the blister, the camera, and the pump were all improved on in terms of cost and compactness.
Although the instrumentation is already fairly compact, a scaled-down instrumentation system could be implemented with relative ease by, for example, using a smaller camera or imaging system. The current system also contains additional electronics to allow for manual actuation of the components (i.e., when not using the user interface). These electronics could be removed and would assist in making the instrumentation more compact. A built-in microprocessor could be used instead of an external computer to provide an automated, stand-alone system. Industrially designed housing would also contribute to the miniaturization of the system toward realizing a deployable point-of-care device.
Automated white and red blood cell counting microfluidic cartridges have been presented as effective blood sample preparation tools for performing microscopy analysis to obtain blood cell counts. The automated cartridges were shown to perform closely to the acceptable error ranges of the test results when using the gold-standard pathology technique for full blood count testing as the true value.
Although only total white and red blood cell counts were investigated for this work, the white blood cell counting cartridges also allow for a three- or five-part differential white blood cell count test to be carried out using image processing, as the cartridge prepares and stains the white blood cells in the same way that would be required for visual analysis on a microscopy slide, allowing the different types of white blood cells to be identified visually. The image-processing algorithms to distinguish between the different types of white blood cells are currently in the process of being developed.
The presented system enables automated blood sample preparation to be carried out on a disposable cartridge, with a small volume of reagent contained on the cartridge in a blister pouch. The cartridge is thus low in cost, as it does not contain electrodes or complex fluidic circuitry as is often required for electrical cell counting techniques, and only a small volume of reagent is used. The imaging system consists of a lensless microscope system, making the detection instrumentation portable and low cost.
The use of the current microfluidic cartridges can be expanded on to be used for platelet counting by varying the blister pouch reagent used and could also be extended to hemoglobin testing by altering the blister reagent and the visualization chamber to accommodate spectrophotometric absorbance measurements. Implementation of the additional tests mentioned would allow for a full blood count panel of tests to be realized. Larger cartridge sample sizes should be tested for statistical analysis to be performed.
Costing of Cartridges and Instrumentation
For the manufacture of 100,000 cartridges with a similar format to the current design (i.e., one blister pouch, one magnetic stirrer bar), the cost per cartridge would be €2 to €3.50 per cartridge and €1 to €1.50 per cartridge for 1 million cartridges. The low cost of cartridges in the case of large-scale production would thus be a viable solution for low-resource environments.
Standard laboratory Coulter counters commonly used for performing full blood counts at centralized pathologist laboratories have been scaled down to produce benchtop systems for use at point of care. However, the costs of these systems are still high, particularly in terms of providing viable solutions in low-resource settings, varying in prices upward of a few thousand euros. Maintenance costs are also an important consideration for such systems and add to the associated costs of the overall system.
The cost of the current laboratory instrumentation setup that has been developed as part of this work is approximately €850. This includes the off-the-shelf webcam and peristaltic pump, which make up approximately half of the cost of the setup. Other components that make up the instrumentation are all less than €60 per item.
The current laboratory instrumentation for controlling the microfluidic cartridges was designed and manufactured to be practical and easy to set up for laboratory testing purposes. Alternative, lower cost, and more compact components are in the process of being investigated to lower the cost of the instrumentation further and to enable a truly feasible point-of-care system for low-resource settings to be realized.
The effectiveness of the white and red blood cell counting results that have been showcased, combined with the potential future applications, paves the way for implementing a full blood count in an automated, low-cost, and compact system, ideally suited for point-of-care medical diagnostic applications as a complete screening tool.
Footnotes
Acknowledgements
We thank John Giani and Sipho Xungu for the design, manufacture, and assembly of cartridge test setup. We also thank all project partners for their contributions.
Declaration of Conflicting Interests
The authors declared no potential conflicts of interest with respect to the research, authorship, and/or publication of this article.
Funding
The authors disclosed receipt of the following financial support for the research, authorship, and/or publication of this article: Part of the work carried out at microfluidic ChipShop GmbH was financially supported by the European Union in an FP-7 grant under the project “Routine,” grant agreement no. 304941, by the Bundesministerium für Bildung und Forschung (BMBF) through the project “IMRA” (FKZ: 031A094C) and the project “MRCyte” (FZK 13N12018). The Council for Scientific and Industrial Research (CSIR) in Pretoria, South Africa, funded this project.