
Abstract
Portable microfluidic diagnostic devices, including flow cytometers, are being developed for point-of-care settings, especially in conjunction with inexpensive imaging devices such as mobile phone cameras. However, two pervasive drawbacks of these have been the lack of automated sample preparation processes and cells settling out of sample suspensions, leading to inaccurate results. We report an automated blood sample preparation unit (ABSPU) to prevent blood samples from settling in a reservoir during loading of samples in flow cytometers. This apparatus automates the preanalytical steps of dilution and staining of blood cells prior to microfluidic loading. It employs an assembly with a miniature vibration motor to drive turbulence in a sample reservoir. To validate performance of this system, we present experimental evidence demonstrating prevention of blood cell settling, cell integrity, and staining of cells prior to flow cytometric analysis. This setup is further integrated with a microfluidic imaging flow cytometer to investigate cell count variability. With no need for prior sample preparation, a drop of whole blood can be directly introduced to the setup without premixing with buffers manually. Our results show that integration of this assembly with microfluidic analysis provides a competent automation tool for low-cost point-of-care blood-based diagnostics.
Keywords
Introduction
Flow cytometry is a detection technique used to analyze single cells flowing in a stream of fluid, often employing optics-based detection systems.1,2 Its applications include cell counting, cell sorting, biomarker detection, and characterization of cells. Imaging flow cytometry uses complementary fluidics and optical imaging for high-throughput detection of cells. This technology has been extremely useful for analyzing blood cells. A recent trend in imaging flow cytometry is to use microfluidics as a complement to optics for high-throughput detection of cells. While these methods are automated to a great extent, manual intervention is still required for preanalytical steps such as mixing/dilution with buffers, staining of blood cells, and addition of anticoagulants, 3 precluding an automated end-to-end process (from leaving a drop of blood into setup to result generation).
Microfluidic flow cytometers have now been made compatible with cellphone cameras used as their imaging sensors,4,5 thereby increasing their affordability and portability. However, cellphone cameras have lower frame rates than commonly needed to capture rapidly flowing cells. This creates a bottleneck in the form of low-flow velocities and affects the throughput of cells being analyzed. 6 Lower flow velocities allow more time for cells to settle down out of suspension in their sample reservoirs or syringe pumps. This settling in turn results in nonuniform microfluidic loading of cells over time, leading to incorrect cell counts. To overcome this problem of cell settling, techniques such as physical agitation of cells, 6 magnetic stirring,7,8 and chemical methods 9 have been used in previous studies. While effective, these techniques were developed for use in laboratory settings and are difficult to implement in point-of-care settings, especially in resource-poor environments. Moreover, these techniques are not suitable for all assays. For example, chemical-based methods can change the inherent chemical composition of a cell suspension, which may not be appropriate for certain studies. Magnetic methods involve the oscillation of a steel ball in the sample syringe, which can damage fragile red blood cells (RBCs) due to mechanical impact. Physical methods such as manual rotation of a syringe are often not automated, requiring careful attention on the part of the microfluidic handler to rotate the syringe periodically.
Thus, we have identified two drawbacks in the context of microfluidic flow cytometric analysis: (1) the paucity of automatic sample preparation techniques suitable for integration into point-of-care diagnostic (POCD) devices and (2) cell settling, which is a consequence of lower frame rates (leading to longer interrogation times) in portable flow cytometric solutions. To overcome these issues, we present an innovative automated blood sample preparation unit (ABSPU) that enables upstream sample preparation integrated with downstream sample analysis for microfluidic flow cytometric assays. A single drop of whole blood (via a graduated capillary) can be directly introduced to our setup for sample preparation and subsequent analysis. The sample reservoir of the ABSPU setup is prefilled with an anticoagulant (e.g., ethylenediaminetetraacetic acid [EDTA]) and dilution buffers (e.g., phosphate-buffered saline [PBS]), as well as different staining dyes for the sample preparation steps of blood dilution/mixing and staining. Our apparatus comprises a 3D printed chassis, housing a miniature vibration motor that drives oscillation of a vial containing blood cells and buffer solution to prevent cell settling and enable mixing of blood sample with buffers. This vial is connected to a microfluidic flow cytometer. To flow cells across the channels in the microfluidic device, we adopted a negative differential pressure generated by a lockable syringe as our fluid pump.10,11 Using negative differential pressure eliminated the need to manually introduce samples in a syringe pump to further load them onto a microfluidic device. Microfluidic flow rates can be controlled by designing channels with appropriate hydraulic resistances. 12 This apparatus affords a portable solution for automated sample preparation of blood cells for microfluidic flow cytometry with the added benefit that it does not require electricity to drive any hydraulics.10,11,13,14
Materials and Methods
Sample and Reagent Preparation
Our ABSPU provides the capability of diluting/mixing or staining blood samples directly from a drop of whole blood, via a graduated capillary tube, introduced into a vial in our setup preloaded with buffers and anticoagulant. Nevertheless, for the purpose of validation (prevention of setting and staining), we have performed manual as well as semiautomated sample and reagent preparation steps.
Whole-blood samples were obtained via venipuncture as well as from pricks from healthy volunteers recruited from the health center at the Indian Institute of Science, Bangalore and collected in EDTA-coated Eppendorf vials at room temperature. RBCs were extracted from whole blood by centrifugation. Both whole-blood and RBC samples were diluted in PBS (1×, 10 mM) using the ABSPU. Analysis was performed within 12 h of sample collection. For staining of leukocytes in whole blood, an enriched sample of leukocytes was added to 2% methylene blue solution in PBS and vibrated in the ABSPU’s reservoir for 6 min before observation.
For the preparation of malarial parasite for the staining experiment, cryopreserved malarial parasite samples were thawed and subcultured with healthy whole blood of an O-positive donor. Then, 200 µL of malarial sample was added to a mixture of 1 mL whole blood and 8 mL Roswell Park Memorial Institute cell culture medium (RPMI-1640). This solution was subcultured up to 5% to 6% parasitemia level before staining. For staining, these subcultures were pelleted and resuspended in a 1% methylene blue solution in PBS and vibrated in the ABSPU’s reservoir for 5 min before observation.
Image Acquisition
To image cells in flow, a blue 3-W LED (HO-HBL-3R; Holmarc, Kochi, India) was used to illuminate the sample plane of the imaging system. An aspheric condenser lens (f = 20 mm, diameter = 1 inch) was used to focus the light and hence provide a uniform illumination at the sample plane of the imaging system. A generic 40× objective (NA = 0.65) was used as a magnifier for the imaging system. A tube lens was used to relay the image of the sample plane onto a camera (DMK 23U618; Imaging Source, Bremen, Germany). For the cell sedimentation experiment, a blue 3-W LED (HO-HBL-3R; Holmarc) was used to illuminate the sample plane and a white paper sheet was placed in the path of light to disperse the light. The Samsung Smart Camera (PK GC-100; Samsung, Suwon, South Korea) was used to take sample images to assess the extent of settling of cells. The in-built camera of the Nikon (Tokyo, Japan) Eclipse microscope was used to image leukocytes, which were stained in the ABSPU.
Design and Working of ABSPU
The off-chip agitator assembly comprises a small vibration motor (unbranded, voltage 5–12 V DC, 70 mA current, speed = 9000 ± 2000 rpm, size: 5 mm × 5 mm × 11.5 mm, restricted vibrational amplitude = 2 mm), a 2-mL Eppendorf vial (Sigma-Aldrich, St. Louis, MO) that serves as a sample reservoir that is agitated by the motor, and a 3D printed plastic casing that was designed on the Solidworks (Waltham, MA, USA) CAD design software. The Eppendorf vial is placed in the casing with some backlash in its chamber to allow sufficient movement of the vial to agitate the liquid as required. This assembly serves as a mini-vortex mixer and agitates the liquid in the vial. The vial and motor are placed in the housing such that they both make a 45° angle with the vertical. This enables better mixing in both the vertical and horizontal directions. The vial is connected to a microfluidic chip by a 1-mm outer diameter microfluidic tubing (Intramedic; Becton, Dickinson and Company, Franklin Lakes, NJ, USA). The compact size and small amplitude of vibration allow integration of the motor in the design for this small vortex agitator. This motor is actuated by an Arduino (Italy) Uno microcontroller that activates it for 30 s followed by inactivity of 3 min in the loop. The periods of inactivity also prevent overheating of the motor and thereby affecting the cells in the reservoir. In addition, the periods of inactivity also allow for imaging samples in an optofluidic setup without vibrational movements affecting the imaging quality. The period of activity is long enough to allow for complete mixing, and the period of inactivation is short enough that blood cells do not start settling down. The sample reservoir is prefilled with the requisite dilution of buffers (anticoagulant, dilution buffer, and staining dyes) depending on the downstream analysis to be performed. A drop of blood sample is added to this reservoir from a graduated capillary tube. The blood is pulled directly into the capillary from a blood collection vial or a finger prick.
Microfluidic Device Fabrication and Preparation
Microfluidic devices were fabricated using standard photolithography and soft lithography techniques for polydimethylsiloxane (PDMS) devices. 15 The design of the PDMS microfluidic device features radially parallelized channel geometry 16 optimized for high-throughput flow of blood cells. The master was fabricated in SU-8 material using photolithography with a height of 9 µm. Since the SU-8 master was replica molded into PDMS microfluidic devices, they too had a depth of 9 µm. Inlet and outlet holes were punched into these PDMS devices. The exposed sides of the devices were sealed by bonding onto glass coverslips using a plasma cleaner (Harrick plasma PDC-32G; Harrick, Ithaca, NY, USA). PDMS devices loaded with PBS buffer were degassed in a vacuum chamber to prevent formation of air bubbles due to negative pressure in the PDMS channels. 17
Integration with Flow Cytometric Setup
The ABSPU, which was connected to the microfluidic chip, was further integrated with an optofluidic flow cytometer setup with imaging and optics details as described before in the “Image Acquisition” subsection. The PDMS device was attached to a sample holding stage that was in line with a 40× microscope objective and a camera sensor. On the other side, an LED source illuminated the device. To drive the flow in this apparatus, negative differential pressure was generated by using a low-cost lockable syringe (VacLok, Merit Medical Systems, Inc, South Jordan, UT, USA). 10 This syringe was connected to the outlet of the microfluidic device. This arrangement is illustrated in Figure 1 .
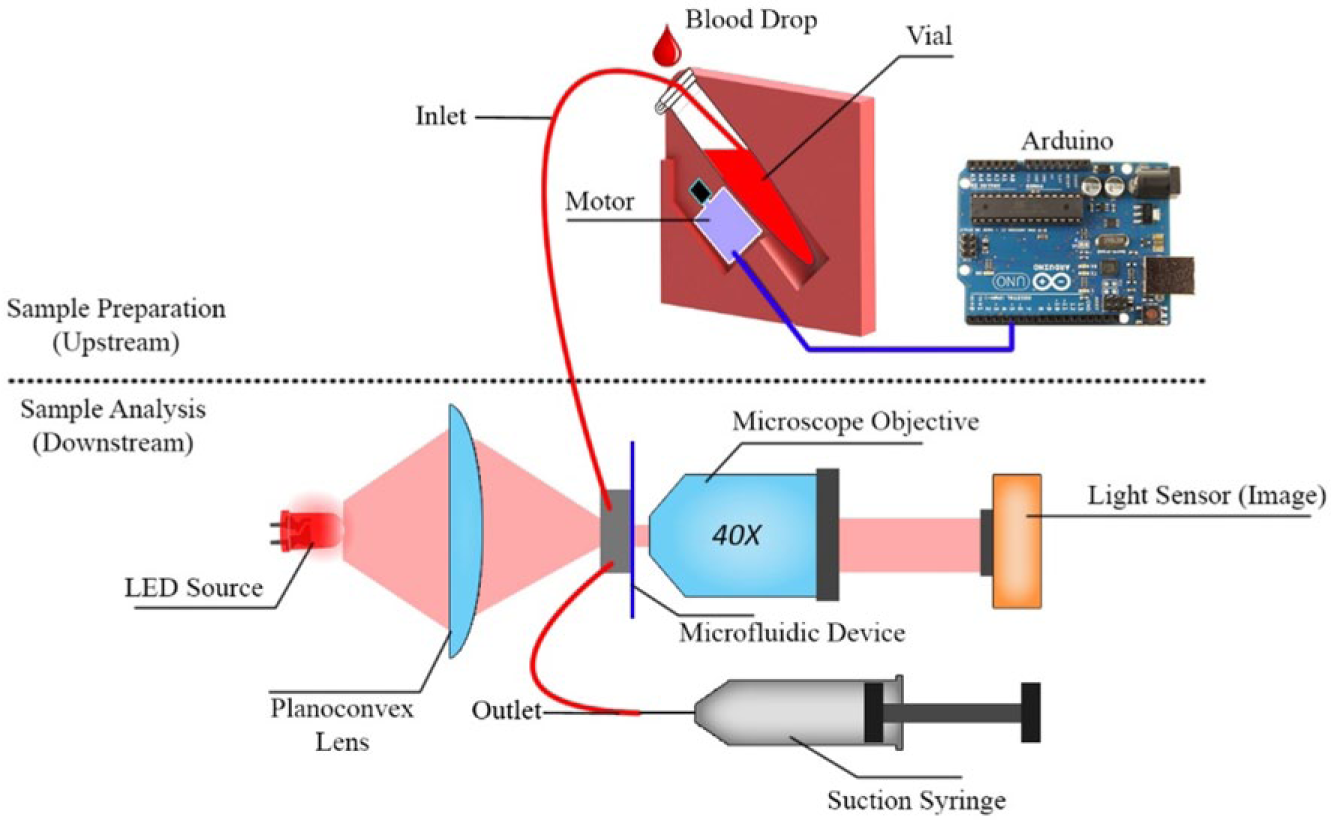
Illustration of the automated off-chip sample preparation setup integrated with a microfluidic flow cytometer. The vibrational motor and housing constitutes the upstream sample preparation, and the microfluidic flow cytometric imaging constitutes the downstream analysis.
Results and Discussion
Assessment of Cell Integrity
Typically, RBCs can withstand shear stresses up to 300 Pa without undergoing mechanical hemolysis. 18 High shear forces can cause damage in the form of morphologic changes and fragmentation/rupture of RBCs.18–21 Accurate measurements of parameters such as cell size, cell viability, and morphology necessitate that cells be in conditions as close as possible to what they were in vivo.
To test for the cell integrity, we conducted a study in which an RBC suspension with PBS was agitated in the sample preparation apparatus for variable time intervals, starting from 10 s and up to 30 min of continuous vibration. At the end of each interval, cells were examined for deformations, crenation, or lysis under the microscope at 40× magnification. Healthy RBCs appear round without projections or undulations of the membrane. Osmolytic effects, disease, and shear forces lead to typical morphological changes such as crenation, shape change, and lacerations in RBCs. We visually correlated with these identifiable features to determine whether cells had sustained any damage due to vibrations or turbulence.
Images of the cells under cover slip before and after agitation in the sample preparation apparatus are shown in Figure 2 . A healthy cell exhibits a circular shape with a biconcave center under the microscope. We observed that cells do not show signs of damage or crenation even after 30 min of continuous agitation in the sample preparation setup. These results demonstrate that the ABSPU does not subject cells to excessive shear or compression forces. Thus, it is risk free to use this apparatus for automated blood sample preparation for cytology studies.
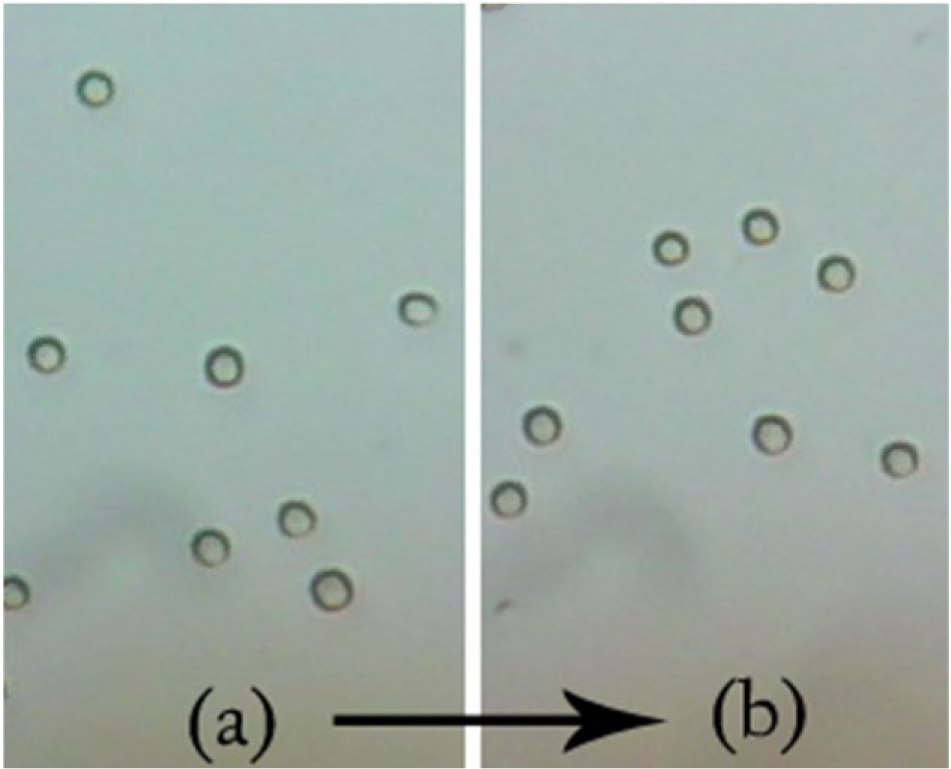
Differences between the samples at two time points: (
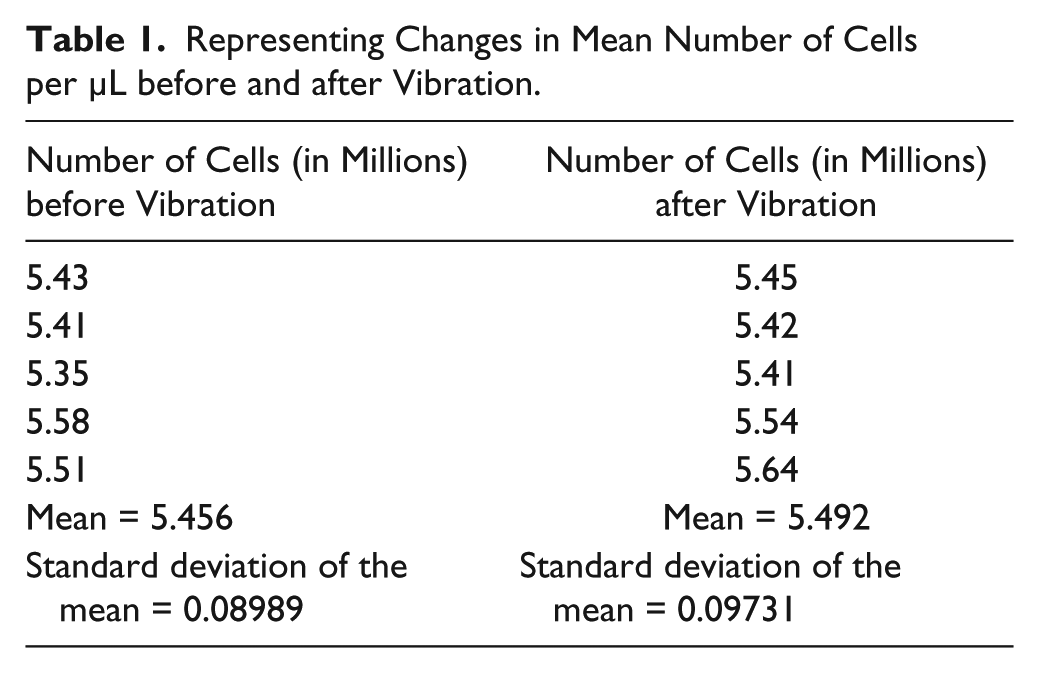
To show a more statistically significant measure of the fact that the cells did not rupture due to the motor, we conducted a before/after vibration cell count experiment using a flow cytometry–based Coulter counter. We assume that a decrease in cell counts after mixing will correspond to cell ruptures and thus an increase in cell debris released. The blood cell counts in five vials containing whole blood, from the same sample, diluted 26 times in PBS were measured through a Sysmex (Kobe, Hyogo Prefecture, Japan) XP-300 Automated Hematology Analyzer. Before aspirating the samples into the hematology analyzer for measurement, they were carefully mixed manually to prevent nonuniform blood cell distribution in vials. The cell counter estimates the whole-blood count from the diluted solution. The results providing the RBC counts (whole blood) in the vials before and after vibration with the ABSPU are shown in Table 1 . The mean of the number of cells observed before vibration in the ABSPU is 5.456 * 106 (SD = 0.08989 * 106, number of trials = 5), and the mean of the number of cells observed after vibration in the ABSPU is 5.492 * 106 (SD = 0.09731 * 106, number of trials = 5). Seeing that there was no significant change in the cell counts after subjecting the cells to the motor vibrations, we can say that there is not much effect on cell integrity because of the vibrations.
Representing Changes in Mean Number of Cells per µL before and after Vibration.
Prevention of Cell Sedimentation
A key function of the ABSPU is to enable the uniform distribution of blood cells in a dilution buffer before introducing the blood sample onto a microfluidic device. This is to maintain spatial homogeneity of the cell population in solution over time. RBCs settle under the influence of gravity if left undisturbed for a few minutes. This can lead to nonuniform loading of cells during the detection/analysis step of flow cytometry and thereby result in inaccurate cell counts.
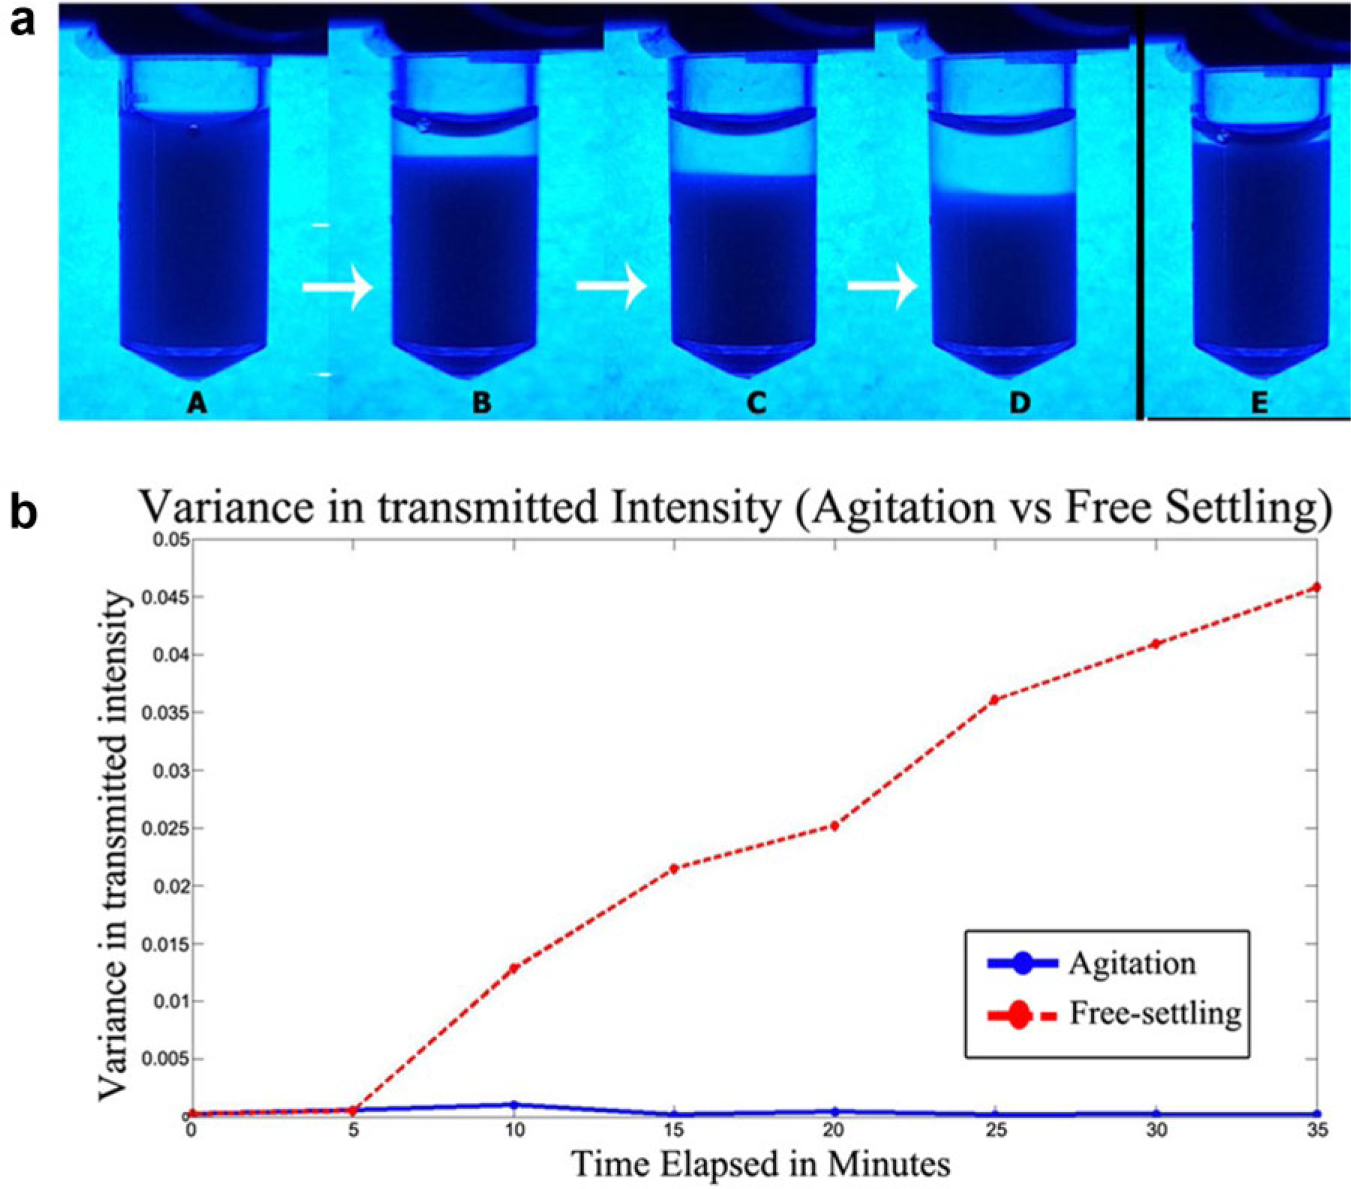
We tested the efficacy of our apparatus for the prevention of blood cell settling by assessing the cell density at different vertical levels of the test suspensions, at varying points in time, under two conditions: vibrational agitation and free settling. A transparent reservoir (Eppendorf vial) was illuminated with dispersed blue light from a 3-W LED, and the intensity of light transmitted through the solution, observed by a detector on the other end, was used as a surrogate measure for cellular content in that vertical plane. Hemoglobin in RBCs absorbs blue light (peak at 420 nm), resulting in the decreased intensity of blue light transmitted and vice versa. This is why we chose a blue LED, where highly absorbing areas in the vial appear darker. Higher variance in intensity over different points of observation indicates that the solution is less uniformly distributed, which in turn points to cell settling. We noticed that the intensity of light after dispersion was not uniform in a plane, and there existed a radial background illumination gradient, which could result in errors in the variance calculations. To mitigate this issue, the observed gradient was subtracted from the intensity variance values at corresponding pixel locations to computationally provide a uniform background illumination.
This study to observe diluted RBC sample behavior in suspension was performed under two conditions: first, with a transparent vial containing the suspension and the vibration motor agitating it, to simulate conditions in the ABSPU. The motor was programmed to run for 30 s followed by 3 min of inactivity in a loop. Second, a vial containing a diluted RBC sample underwent free settling. The extent of cell sedimentation under free settling, shown in Figure 3a (panels A–D), has marked contrast to that under the conditions of motor agitation for 30 min depicted in Figure 3a (panel E). A quantitative comparison was made between the variance of intensity of transmitted light captured under conditions of vibrational agitation and free settling by a camera sensor (Samsung Smart Camera PK GC-100) placed on the opposite side of the vials with respect to the light source. This variance was calculated along a thin vertical strip on the images of the vials taken by the camera. Figure 3b shows a plot of the intensity values obtained from images taken by the camera sensor in the experiment above. The variance of transmitted intensity over time was significantly higher under conditions of free settling compared to samples that underwent vibrational agitation. In fact, there was negligible variance of transmitted intensity in the latter case, indicating a well-mixed solution. This infers that low flow rate cell-counting apparatuses should use this setup to prevent cell sedimentation and mitigate errors in the number of cells counted per unit volume in the sample that is analyzed over time.
(
Flow Cytometric Integration
RBCs undergo rouleaux formation, aggregation, and settling if left undisturbed when suspended in a solution. This leads to nonhomogeneous spatial distribution over time in the vial containing the solution. In the case where this vial is used as a reservoir for a flow cytometer, this settling has negative implications as it leads to nonuniform cell count over time. As described earlier, our apparatus, as a result of agitation-based mixing, mitigates the issue of blood cell settling out of suspension.
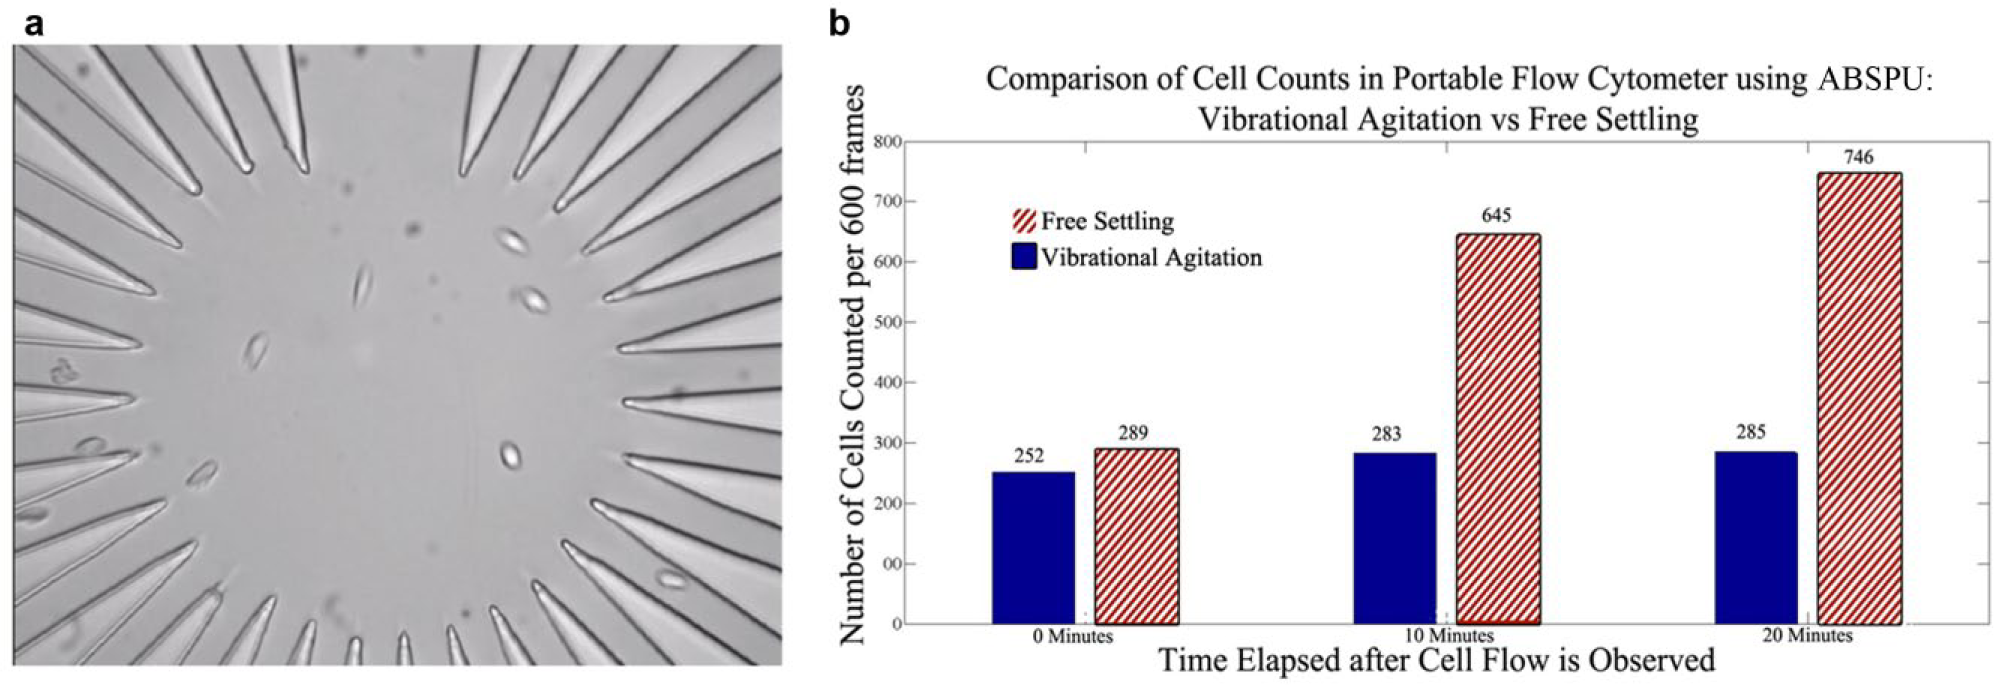
To validate this result in the context of flowing cells, as well as to present a proof-of-concept experiment for the apparatus’ integration with downstream cell analysis, we conducted an experiment where the agitation setup was used in conjunction with a microfluidic flow cytometer. We sampled diluted RBCs into the microfluidic flow cytometer at different time points after creating the blood suspension in the sample reservoir. These time points were 0, 10, and 20 min after cells were suspended in the ABSPU’s sample reservoir. This was also done under two conditions, with and without agitation by a vibration motor. In the case of vibrational agitation, the motor was programmed with a microcontroller to run for 30 s and subsequently be on a standby period for 2 min to allow imaging. This pattern was performed in a loop. Cells were pumped using negative differential pressure generated through the lockable suction syringe connected to the microfluidic device outlet. We conducted this experiment with the rationale that there will be increased variation in cell counts per unit time under the condition of free settling (no agitation). We sampled the cells through a polyethylene tubing, which siphoned cells from the bottom of the reservoir, and thus as the cells settled over time, we expected a higher number to be sampled into the tubing. The microfluidic flow cytometer was integrated with a high-throughput PDMS device with radially parallelized channel geometry as the cell imaging platform. 16 These cells were imaged on a monochrome camera (DMK 23U618; Imaging Source) at a magnification using a 40× cylindrical objective lens with a frame rate of 60 frames/s. Cells flowing in a video were counted using a MATLAB-based algorithm using background subtraction and edge detection. A snapshot of these flowing cells in the radially parallelized microfluidic channel can be seen in Figure 4a .
(
The results of this experiment are presented in Figure 4b , which clearly depicts the differences in counts between conditions of free settling versus motor agitation. In the free settling case, the number of cells counted per 600 frames increased by 123% after the first 10 min from 289 cells/600 frames to 645 cells/600 frames. This number increased further to 746 cells/600 frames for cells that had been free settling for 20 min. On the other hand, in the case of motor vibration of the reservoir, there were only slight differences in cells counts observed at 0, 10, and 20 min of suspension at 252 cells/600 frames, 283 cells/600 frames, and 285 cells/600 frames, respectively. It should be noted that the areas under observation for the cell counting in both the cases were identical with respect to the total channel area. However, this observational area was significantly less than the total channel area. Due to this reason, the results of this experiment do not reflect the total cell count flowing through the microfluidic channels. Our focus is to compare the cell count differences that are noticed using the ABSPU versus free-settling conditions, taking identical areas as regions of imaging, rather than estimate the total cell count. From the relative stability of cell counts per unit time achieved through agitation, it is evident that our sample preparation setup is effective in preventing blood cells to settle out of suspension.
Staining in the ABSPU
Cells are stained to enhance visualization of the cytoplasm or specific cellular components under the microscope. For example, leukocytes in whole blood are stained with methylene blue to enhance the visualization of their nuclei for use in imaging flow cytometry. 22 This may be done by mixing cells in solution with a staining dye in a vial for about 2 min and agitating it to spread the stain uniformly. Currently, most in-suspension staining protocols are done manually, requiring skilled personnel to prepare the stain and wash cells. While many staining-based microfluidic POCD analyzers have been proposed, most require in-suspension staining before loading, which is also performed manually. This requires highly skilled personnel, which is costly, and the quality of staining, which varies considerably, greatly influences the automated downstream analysis. 23 The advantage of our system is that it performs in-suspension staining automatically without requiring the skills of an expert technician. Thus, for other staining-based POCD analyzers, in-suspension staining protocols and tagging procedures that are used can potentially be automated with the use of our setup. Using the ABSPU, we successfully performed in-suspension staining of leukocytes as well as of RBCs infected with malarial parasite as described below.
Staining of Leukocyte Nucleus
With the ABSPU, we used the agitation of our motor to automate the staining process for leukocytes. In total, 10 µL of enriched leukocytes was stained by adding to 2% methylene blue solution (in PBS) for 6 min in a vial integrated with the ABSPU. This vial was agitated through motor vibration. The motor was programmed to run for every 30 s and then be on a standby period for 2 min in a loop for a total staining period of 6 min. This control was achieved using an Arduino Uno microprocessor. The sample was subsequently imaged on a glass slide with a bright-field Nikon Eclipse microscope. Figure 5 depicts two images of leukocytes, which were stained in the sample preparation apparatus. The lobed nuclei of the cells are clearly visible, indicating a well-stained cell. This result demonstrates that our apparatus can be used as an automated method for staining of cells. We expect incubation time as well as required stain concentration in the agitation assembly for staining to be shorter for samples such as malaria-infected cells, which require a lower staining dye penetration compared to leukocytes.
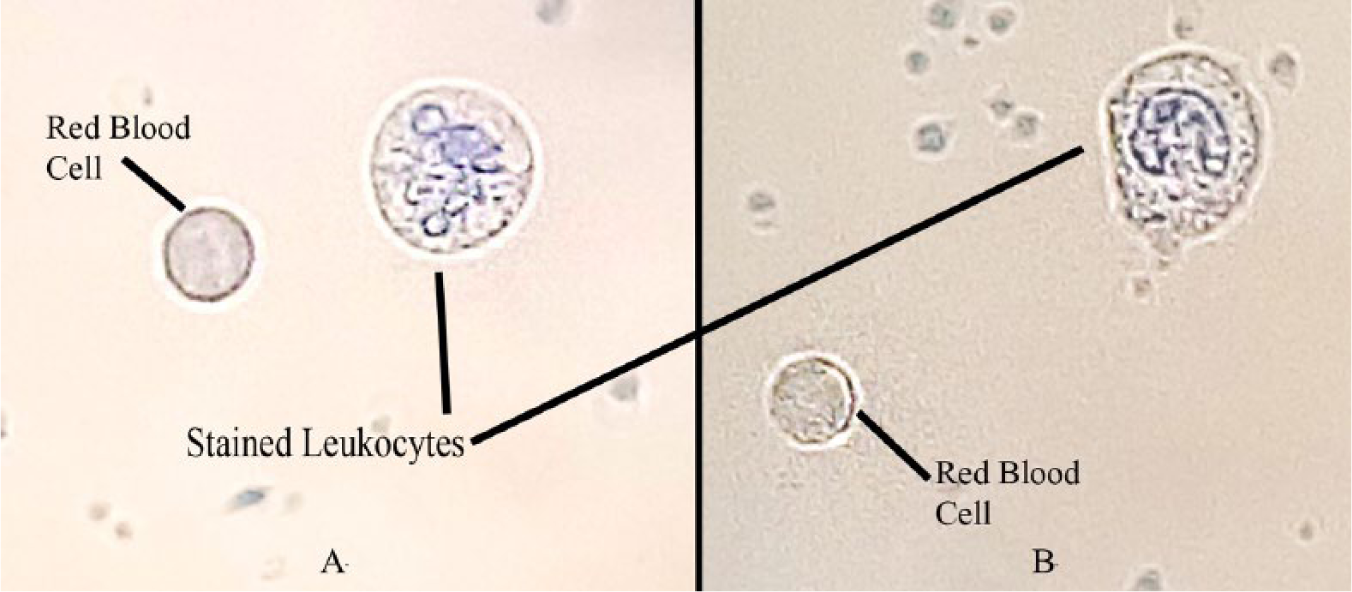
Leukocyte cells that were stained in the sample preparation apparatus. The lobed nuclei are clearly identifiable, indicating a well-stained sample.
Staining of Malarial Parasite
In addition to staining the nucleus of leukocytes with methylene blue, we also used ABSPU to stain cultured malarial parasite in RBCs as the hemozoin in the malarial parasite takes up methylene blue stain readily. 24 After adding 10 µL of cultured malarial parasite cells in RBCs to a 1% methylene blue solution (in PBS) in a vial integrated with the ABSPU, the vial underwent motor agitation for 5 min. The programming of the ABSPU motor was identical to that done for the leukocyte staining described above. Stained samples were imaged on a glass slide with a bright-field Nikon Eclipse microscope. Figure 6 represents images of stained RBCs infected by the malarial parasite. Parasite-infected cells contain a dark-stained spot, which represents parasite. Thus, healthy and infected cells can be easily differentiated. When integrated with microfluidic flow cytometry, this can be used as a semiautomated method for malaria diagnosis using only a single drop of blood. As demonstrated by these experiments, the ABSPU serves as an easy-to-use, automated staining unit for varied blood-based flow cytometric assays. The simple procedure entails adding a drop of blood sample to the sample reservoir prefilled with sample buffers and staining dyes in the ABSPU. The sample is then transported to the flow cytometry unit (microfluidic chip or conventional flow cytometric reservoirs) for analysis.
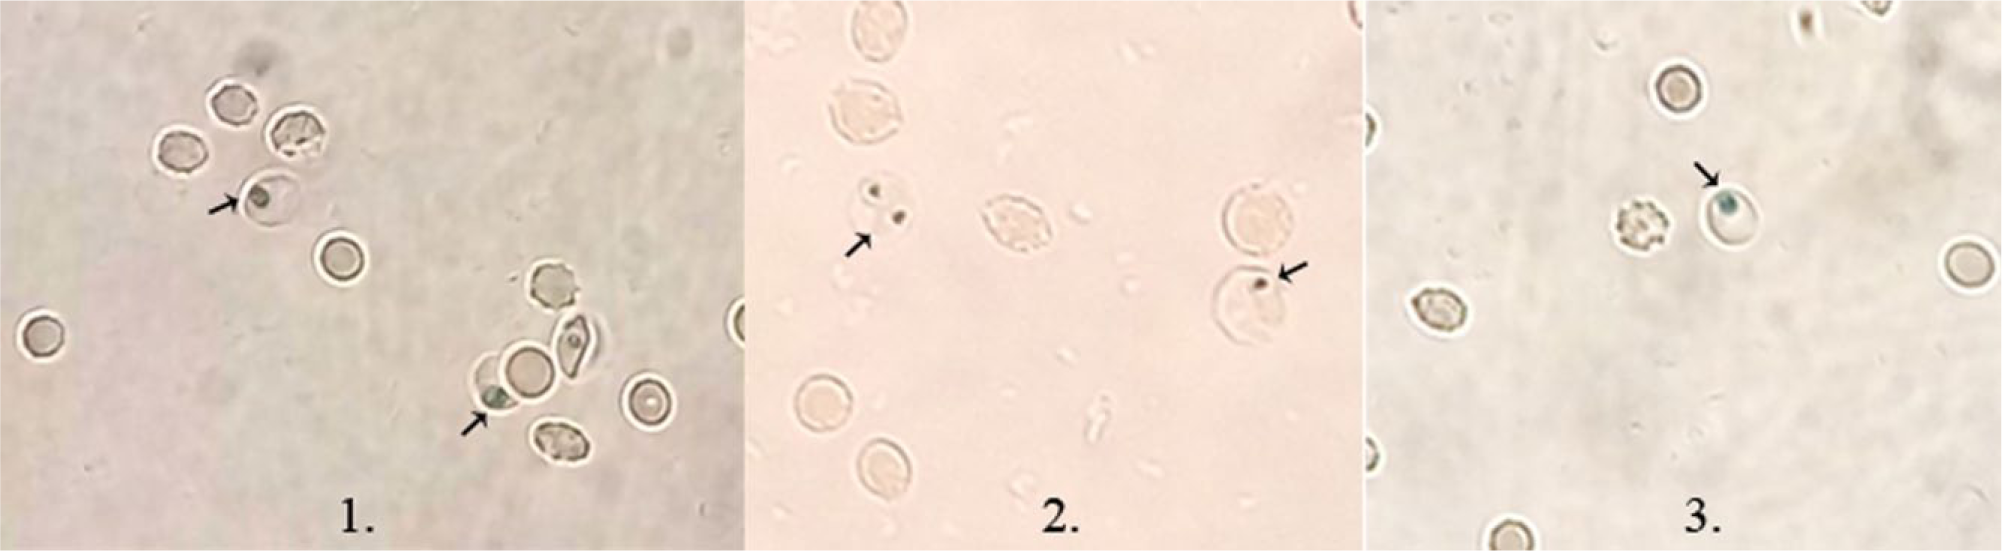
Images depicting cultured malarial parasites in red blood cells that can be identified by the dark spots on the round cells. The dark spots are a result of the methylene blue–based staining that was performed using the automated blood sample preparation unit. The parasite-infected cells are identified by black arrows on the image.
In conclusion, currently available portable blood-based flow cytometers have certain limitations, including a need for manual intervention for sample dilution, mixing, and staining, as well as cell sedimentation, which poses problems in low flow rate imaging flow cytometers. To overcome these limitations, we demonstrate a miniature, portable, automated off-chip apparatus for blood cell dilution and staining and to prevent settling of cells in suspension. This apparatus streamlines and automates both upstream sample processing and downstream flow cytometric analysis. As a low-cost and disposable apparatus, it is ideal for low-resource and point-of-care settings. We have demonstrated the efficacy of our apparatus for leukocyte staining and malarial parasite identification through imaging flow cytometry in the laboratory; further studies are needed to validate its efficacy and suitability in diverse clinical settings.
Footnotes
Acknowledgements
We thank Mr. Veerendra Kalyan and Ms. Albina Nirupa Lourdes for their insightful discussions on experiment design as well as Mr. Abhishek Pathak for his aid in preparation of blood samples. We also acknowledge Mr. Jayesh Adhikari for preparing illustrative schematics.
Declaration of Conflicting Interests
The authors declared no potential conflicts of interest with respect to the research, authorship, and/or publication of this article.
Ethical Clearance
All blood and malaria cell samples have been obtained with ethical clearance from the Institute Human Ethics Committee, Indian Institute of Science, Bangalore.
Funding
The authors disclosed receipt of the following financial support for the research, authorship, and/or publication of this article: This research was supported by the Innovative Young Biotechnologist Award (IYBA) 2013 by the Department of Biotechnology (DBT) of the Government of India.