
Abstract
Glioblastoma (GBM) is a lethal brain cancer with a median survival time of approximately 15 months following treatment. Common in vitro GBM models for drug screening are adherent and do not recapitulate the features of human GBM in vivo. Here we report the genomic characterization of nine patient-derived, spheroid GBM cell lines that recapitulate human GBM characteristics in orthotopic xenograft models. Genomic sequencing revealed that the spheroid lines contain alterations in GBM driver genes such as PTEN, CDKN2A, and NF1. Two spheroid cell lines, JHH-136 and JHH-520, were utilized in a high-throughput drug screen for cell viability using a 1912-member compound library. Drug mechanisms that were cytotoxic in both cell lines were Hsp90 and proteasome inhibitors. JHH-136 was uniquely sensitive to topoisomerase 1 inhibitors, while JHH-520 was uniquely sensitive to Mek inhibitors. Drug combination screening revealed that PI3 kinase inhibitors combined with Mek or proteasome inhibitors were synergistic. However, animal studies to test these drug combinations in vivo revealed that Mek inhibition alone was superior to the combination treatments. These data show that these GBM spheroid lines are amenable to high-throughput drug screening and that this dataset may deliver promising therapeutic leads for future GBM preclinical studies.
Introduction
Glioblastoma (GBM) is the most common primary malignant brain tumor in adults. The current standard of care for patients diagnosed with GBM is maximal safe tumor resection with optional implantation of BCNU polymer wafers (Gliadel), followed by combination temozolomide (Temodar) and radiation therapy. 1 Despite these treatments, the median survival time (MST) remains 14–18 months following diagnosis.2–5 There is a pressing need for new GBM therapeutics to improve patient outcomes.
Many pharmacological agents have entered clinical trials for GBM; however, only four drugs are currently FDA approved for GBM therapy. The failure of many GBM clinical trials is attributed to preclinical testing in cell and animal models that do not recapitulate features of human GBM, and therefore are poor predictors of how effective a drug will be in patients. Traditional adherent GBM cell lines, such as LN-229 and U-87MG, are grown in serum and do not resemble the characteristics of the primary tumor they were derived from when grown in vivo. Cells that produce spheriods when grown in serum-free media with added growth factors, hereafter known as oncospheres, more closely mirror the genetic and phenotypic expression patterns from the original tumor. 6 Finally, oncosphere cell lines implanted intracranially in mice show histological characteristics of human GBM, including areas of necrosis and an invasive growth pattern. 7
We have generated novel oncosphere cell lines, each derived from a human GBM or GBM variant that forms tumors in vivo with human GBM characteristics. 8 Here we report the genomic characterization of nine oncosphere cell lines. Two oncosphere lines were then used for a high-throughput cell viability drug screen of 1912 compounds, and identified cytotoxic compounds were further validated using a non-high-throughput format in additional cell lines. We found that certain compound mechanisms were effective in all cell lines, while others were active in some lines but not others. Pairwise drug combination screening of 30 compounds, giving 435 discrete drug combinations, revealed that PI3 kinase inhibition combined synergistically with many different compounds to reduce the viability of oncosphere cell lines. Finally, two drug combinations were tested in vivo to determine which could extend survival. This report is the largest screen of well-characterized compounds using GBM oncosphere lines and the first report of high-throughput drug combination screening utilizing GBM oncospheres.
Materials and Methods
Compounds, Antibodies, and Reagents
BIIB021 (S1175) and TAK-733 (S2617) were obtained from Selleck Chemicals (Houston, TX). Bardoxolone methyl (1772) was obtained from Axon MedChem (Groningen, The Netherlands). PD0325901 (P-9688) and GDC-0941 (G-9252) were obtained from LC Laboratories (Woburn, MA). Marizomib (SalA-100) was obtained from FIVEphoton Biochemicals (San Diego, CA). Neurocult NS-A Proliferation kit (05751) and heparin (07980) were obtained from StemCell Technologies (Vancouver, British Columbia). Basic-FGF (AF-100-18) and EGF (AF-100-15) were obtained from PeproTech (Rocky Hill, NJ). alamarBlue (DAL1100) was obtained from Thermo Fisher Scientific (Waltham, MA). CellTiter-Glo (G7573) and Caspase-Glo 3/7 (G8092) were obtained from Promega (Madison, WI). NF1 antibody (sc-67) and beta-actin antibody (sc-47778 HRP) were obtained from Santa Cruz Biotechnology (sc-67). PTEN antibody (9559T) and goat anti-rabbit IgG (7074P2) secondary antibody were obtained from Cell Signaling Technology (Danvers, MA). Phosphokinase antibody array (ARY003B) was obtained from R&D Systems (Minneapolis, MN).
Cell Lines and Culture Conditions
Methods for the creation, establishment, and validation of oncosphere cell lines have been previously published. 8 Br23C, JHU-0879, JHH-136, JHH-68, JHH-227, JHU-1016B, JHH-505, and JHH-520 were created by the Riggins and Gallia laboratories. All patients consented and samples were de-identified upon collection. Samples with a JHU designation were collected using an additional research protocol, which allowed for the collection of two vials of blood. HSR-GBM1 cells were a gift from Sara Piccirillo and Angelo Vescovi to the Riggins lab. All cell lines were grown as spheroids in Neurocult NS-A Proliferation media containing EGF, bFGF, and heparin. 8 LN-229 (CRL-2611) and U-87MG (HTB-14) were obtained from the America Type Culture Collection (Manassas, VA). Cells were maintained in Dulbecco’s Modified Eagle Medium (Thermo Fisher Scientific, 11965-092) containing 10% fetal bovine serum (Hyclone) and 1% penicillin/streptomycin (Thermo Fisher Scientific, 15140122). All cells were maintained in standard incubator conditions (37 °C, 5% CO2, 95% humidity).
Exome Capture and Next-Generation Sequencing
DNA was extracted from oncosphere cell lines using a DNeasy Blood and Tissue Kit (Qiagen). The STR profile of each sample was determined prior to sequencing to ensure that each sample was independent. For JHU-0879, JHH-136, JHH-68, JHH-227, JHU-1016B, JHH-505, and JHH-520, DNA was extracted from cells that were less than 15 passages away from the passage number used for in vivo tumor establishment previously published. 8 Early passage cells were not available for Br23C and HSR-GBM1, so the earliest available was used. JHU-0879 and JHU-1016B samples had matched normal DNA, which was extracted from whole blood using a DNeasy Blood and Tissue Kit (Qiagen, Venlo, The Netherlands). The amount of DNA in each sample was quantified using a nanodrop spectrophotometer (Thermo Fisher Scientific). Library construction was completed at Johns Hopkins Microarray Core Facility (Baltimore, MD) and exome capture was completed at the J. Craig Venter Institute (Rockville, MD).
Methods for sequencing, read mapping, variant identification, and assessment of copy number variation have been previously published. 9 Briefly, genomic DNA was fragmented and 200–300 base pair segments were selected for sequencing. The exome capture was done using the SureSelect All Exon 50 Mb Target Enrichment kit (Agilent, Santa Clara, CA) and sequencing was done using the Illumina HiSeq2000 platform. Image analysis and base calling were performed using Illumina’s Casava1.8.2 software.
Reads were mapped to the reference genome (GRch37) using the Burrows-Wheeler Aligner (version 0.5.9). Regions that could benefit from realignment were identified using the GATK Realigner Target Creator (version 1.0.5506). GATK (version 1.5) was used to realign reads covering localized indels, recalibrate quality values, and locate, filter, and annotate variants. JHU-1016B and JHU-0879 had whole blood available for sequencing, so somatic mutations were eliminated from the final analysis. Somatic changes, including point mutations and small indels, were called based on comparison between somatic and tumor sequences. For samples with no somatic material, case versus controls were compared. Only missense mutations were assessed for functional impact by PhyloP, SIFT, Polyphen, and Mutation Taster 10 programs. For evaluation of copy number alterations, amplifications were defined as case versus control log2 ratio greater than eight, meaning greater than four copies of the gene were present.
Immunoblotting and Phosphokinase Profiling Arrays
Oncospheres were dissociated into single cells and then pelleted by centrifugation at 300g for 5 min. Media was discarded and pellets were washed using phosphate-buffered saline (PBS) and centrifuged at 300g for 5 min. Following removal of PBS, an appropriate volume of ice-cold RIPA buffer containing protease and phosphatase inhibitors was added to the pellet. Following a 30 min incubation on ice, cells were centrifuged at 14,000 rpm at 4 °C for 15 min. Supernatant was collected and protein levels were quantified using a Pierce BCA assay kit (Thermo Fisher Scientific). For PTEN, 20 µg of denatured protein was loaded onto a NuPAGE 4%–12% Bis-Tris gel (Invitrogen, NP0322) and run at 100 V for 75 min using 1× MES buffer. Proteins were transferred to a polyvinylidene fluoride (PVDF) membrane at 30 V for 90 min at 4 °C. For NF1, 20 µg of denatured protein was loaded onto a NuPAGE 3%–8% Tris-Acetate gel (Invitrogen, NP03552) and run at 100 V for 75 min using 1× tris-acetate buffer. Proteins were transferred to a PVDF membrane at 30 V overnight at 4 °C. Membranes were blocked in 5% nonfat dry milk in a TBST (1× TBS/0.15% Tween 20) mixture for 60 min at room temperature with rocking. PTEN antibody and NF1 antibody were added at a 1:1000 dilution in 5% nonfat dry milk in TBST and incubated overnight at 4 °C with rocking. Membranes were washed three times with 1× TBST for 10 min with rocking. Horseradish peroxidase (HRP)-conjugated secondary anti-rabbit antibody was diluted 1:10,000 in 5% milk-TBST and incubated on each membrane for 60 min at room temperature with rocking. For phosphokinase arrays (R&D Systems), 190 µg of protein was applied to the antibody array according to the manufacturer’s instructions. Membrane proteins and antibody arrays were visualized using a Pierce Chemiluminescence kit (Thermo Fisher Scientific). Following visualization of PTEN and NF1, membranes were incubated in Restore Western Blot Stripping Buffer (Thermo Fisher Scientific, 21059) for 10 min at room temperature with rocking. Membranes were then blocked and washed as before, followed by the addition of beta-actin directly conjugated to HRP at a 1:10,000 dilution in 5% milk-TBST overnight at 4 °C with rocking. Film capture was used for PTEN, NF1, and beta-actin, while antibody arrays were visualized using a Bio-Rad Universal Hood II Gel Doc. Antibody arrays were quantitated using ImageQuant TL (GE Healthcare, Boston, MA) software.
Quantitative High-Throughput Single-Agent Drug Screening
The Mechanism Interrogation PlatE (MIPE) 4.0 is a collection of 1912 small molecules that target signaling pathway components that are altered in many different cancers. All MIPE 4.0 compounds are plated in an 11-point dose–response with a top concentration of 10 mM and a 1:3 titration and have been used for screening previously.11–13 High-base, solid-bottom, white Greiner plates (789173) were used throughout. JHH-136 and JHH-520 spheroids were dissociated into single cells and then plated at 500 cells/well in 5 μL of complete NeuroCult media using a Multidrop liquid dispenser (Thermo Fisher Scientific). LN-229 and U-87MG cells were plated at 500 cells/well in 5 µL of cell culture media. Immediately after plating, a Pintool dispenser (Kalypsys) was used to add 23 nL of MIPE titrated compounds to columns 5–48 and control compounds to columns 1–4. The final top concentration of MIPE compounds was 47 µM and the titration 1:3. Column 1 contained media only, column 4 contained DMSO, and columns 2 and 3 contained the proteasome inhibitor bortezomib at a final concentration of 9.2 μM. Plates were then incubated for 48 h with low-evaporation stainless steel cell culture Kalypsys lids in standard incubator conditions. For cell viability measurements, 3 μL/well of CellTiter-Glo reagent (Promega) was dispensed using an Aspect Automation dispenser with solenoid valves (Lee valves). After incubation for 15 min at room temperature, the luminescence signal was measured using a ViewLux CCD-based multilabel reader (PerkinElmer, Waltham, MA). Cell viability values were normalized to the DMSO-only control values as 100% activity and media-only controls as 0% activity. Dose–response data for each compound were fit to a four-parameter Hill curve using a grid-based algorithm developed in-house. Using the fits, we determined the potency (AC50) and efficacy (% max response) and area under the curve (AUC) parameters for each compound tested. In addition to the curve fit parameters, we assigned each fit a “curve class response” (CRC), which is a heuristic classification scheme that allows one to readily identify the quality and nature of a dose–response curve. Thus, a well-defined curve, with fully defined asymptotes, R2 > 0.9, and an efficacy greater than 80%, would be assigned a class of 1.1. Curves with a missing asymptote and poorer efficacy would be considered a class 2 curve, and curves with activity at a single dose point would be considered class 3 (or inconclusive). Finally, curves with no dose–response would be classified as class 4 (inactive). See Inglese et al. 14 for a more detailed description of curve classes.
Single-Agent Follow-Up Screening
BIIB021, bardoxolone methyl, and TAK-733 were selected for hit verification. Cells were dissociated during the log growth phase and plated at 1000 cells/well in 178 μL of complete Neurocult media into a clear-bottom, 96-well plate. Following an overnight incubation at standard incubator conditions, 2 μL of each compound was added to columns 3–10 at the following final concentrations: 10, 5, 1, 0.5, 0.1, 0.05, 0.01, and 0.005 μM. Columns 1 and 12 served as a no-treatment control, column 2 contained DMSO, and column 10 contained bortezomib at a final concentration of 2 μM. Plates were stored at standard incubator conditions for the duration of the experiment. alamarBlue reagent (20 μL) was added to each well and plate readings were taken at 0, 24, 48, 72, and 96 h using a PerkinElmer Wallac 1420 Multilabel Counter. For Br23C and JHH-227, plate readings were taken every 48 h due to slow in vitro growth rates. Each plate contained six replicates, and all values were normalized to the DMSO control. GraphPad Prism 5 (GraphPad Software, La Jolla, CA) was used to calculate IC50 values.
Drug Combination Screening
These methods have been described previously. 11 The initial drug combination screen was done in a 6 × 6 matrix format encompassing a grid of 36 wells, containing five concentrations of one compound in combination with five concentrations of a second compound in a 25-well grid, plus 10 additional wells of all five concentrations of single-agent compounds and 1 well with DMSO only. Thirty compounds were selected for pairwise matrix screening based on their single-agent activity, giving 435 discrete drug combinations. An appropriate volume of each compound was added to 384-well, black Greiner plates (788876). Each compound (10 nL/well) was acoustically dispensed in a 6 × 6 format into empty 1536-well, high-base, solid-bottom, white Greiner plates (789173) using an ATS-100 (EDC Biosystems). Plates were then covered with stainless steel cell culture Kalypsys lids and stored in standard incubator conditions. The following day, JHH-136 cells were added to drug combination plates as they were in single-agent screening at 1000 cells/well in 5 µL of complete Neurocult media. Plates were stored with stainless steel cell culture Kalypsys lids in standard incubator conditions for 48 h, and then 3 µL/well of CellTiter-Glo luminescent cell viability assay reagent (Promega) was added using an Aspect Automation dispenser with solenoid valves (Lee valves). The plates were then incubated for 15 min at room temperature and the signal was captured using a ViewLux (PerkinElmer). Follow-up drug combination screening was done in a 10 × 10 matrix format encompassing a 100-well grid, meaning nine concentrations of each compound were combined with nine concentrations of a second compound in an 81-well matrix grid, plus nine concentrations of each compound as a single agent and 1 well with DMSO only. Cell viability matrix screening was completed using a 10 × 10 format in duplicate for JHH-136 and JHH-520 using 46 discrete drug combinations with the same methods as above, and results were aggregated using the mean activity. Apoptosis assays were done in JHH-136 using a 10 × 10 matrix format. Cells were incubated for 8 or 24 h with compound, and then 3 µL of Caspase-Glo 3/7 luminescent apoptosis assay reagent (Promega) was added to the plates. After a 30 min incubation at room temperature, signal was captured using a ViewLux. As the caspase activation time points may vary between cell lines and compounds, the apoptosis data were gated between the DMSO control (caspase activation 0%) and the top 5% quantile (caspase activation 100%) of the entire assay.
Animal Drug Efficacy Studies
Animals were maintained using approved Institutional Animal Care and Use Committee (IACUC) protocols. Thirty-five female athymic nude mice (NCI-Fredrick) aged 4–6 weeks were anesthetized with a ketamine/xylazine mixture and fixed into a stereotactic frame. Five hundred thousand JHH-520 cells were intracranially implanted through a burr hole drilled 2 mm lateral to the sagittal suture and 1 mm anterior to the coronal suture at a depth of 3 mm below the dura, as previously described. 15 Surgical incisions were sealed with staples. Seven days postimplantation, animals were randomized into six groups and drug treatment was initiated. Groups were as follows: control (n = 6), GDC-0941 alone (n = 5), PD0325901 alone (n = 5), marizomib alone (n = 5), GDC-0941 plus PD0325901 (n = 7), and GDC-0941 plus marizomib (n = 7). Control animals received vehicle (0.5% CMC/0.2% Tween 80 in water) by oral gavage. GDC-0941 was diluted in vehicle and administered at a dose of 75 mg/kg by oral gavage. PD0325901 was diluted in vehicle and administered at a dose of 10 mg/kg by oral gavage. Oral drugs were administered once daily, 5 days/week, and continued until animals were sacrificed. Marizomib animals received 75 µg/kg of drug diluted in 1× PBS administered by intravenous tail vein injection starting on day 7 postimplantation and continued twice weekly with a 3-day rest between doses. Marizomib dosing was stopped after 19 treatments on day 70 postimplantation. Combination treatment groups received dual treatments at the same doses listed above within a 60 min window. All animals were weighed thrice weekly for the duration of the experiment. Animals were sacrificed upon signs of intracranial tumor burden and de-brained. Brains were fixed in 10% formalin solution for further analysis. Kaplan-Meier curves and statistical tests were performed using GraphPad Prism.
Results
Each Oncosphere Cell Line Has a Distinct Alteration Profile
Each oncosphere cell line was derived from an individual patient tumor. Therefore, we explored deleterious point mutations and copy number variation within each cell line. We assessed alterations in the GBM candidate cancer (CAN) genes because mutations in these genes are drivers of GBM cell growth. 16 Table 1 shows the CAN gene alterations present plus one additional oncogene, MYC. The full list of genomic alterations in all nine cell lines can be found in the supplemental data. Genomic alterations were not found in IDH1, CDK4, or PIK3CA. CDKN2A alterations were the most common, present in seven of nine lines (78%). Oncosphere cell lines lacking alterations in CDKN2A contained alterations in RB1, a tumor suppressor gene within the same pathway as CDKN2A. Of note, we report only two lines with high-level (>10 copies) EGFR amplification; however, many cell lines contained low-level (3–10 copies) EGFR amplification. We explored additional oncogenes and tumor suppressor genes implicated as drivers in other cancer types but found very few alterations ( Suppl. Table S1 ).
Genomic Alterations Present in GBM Candidate Cancer (CAN) Genes for Nine Oncosphere Cell Lines.
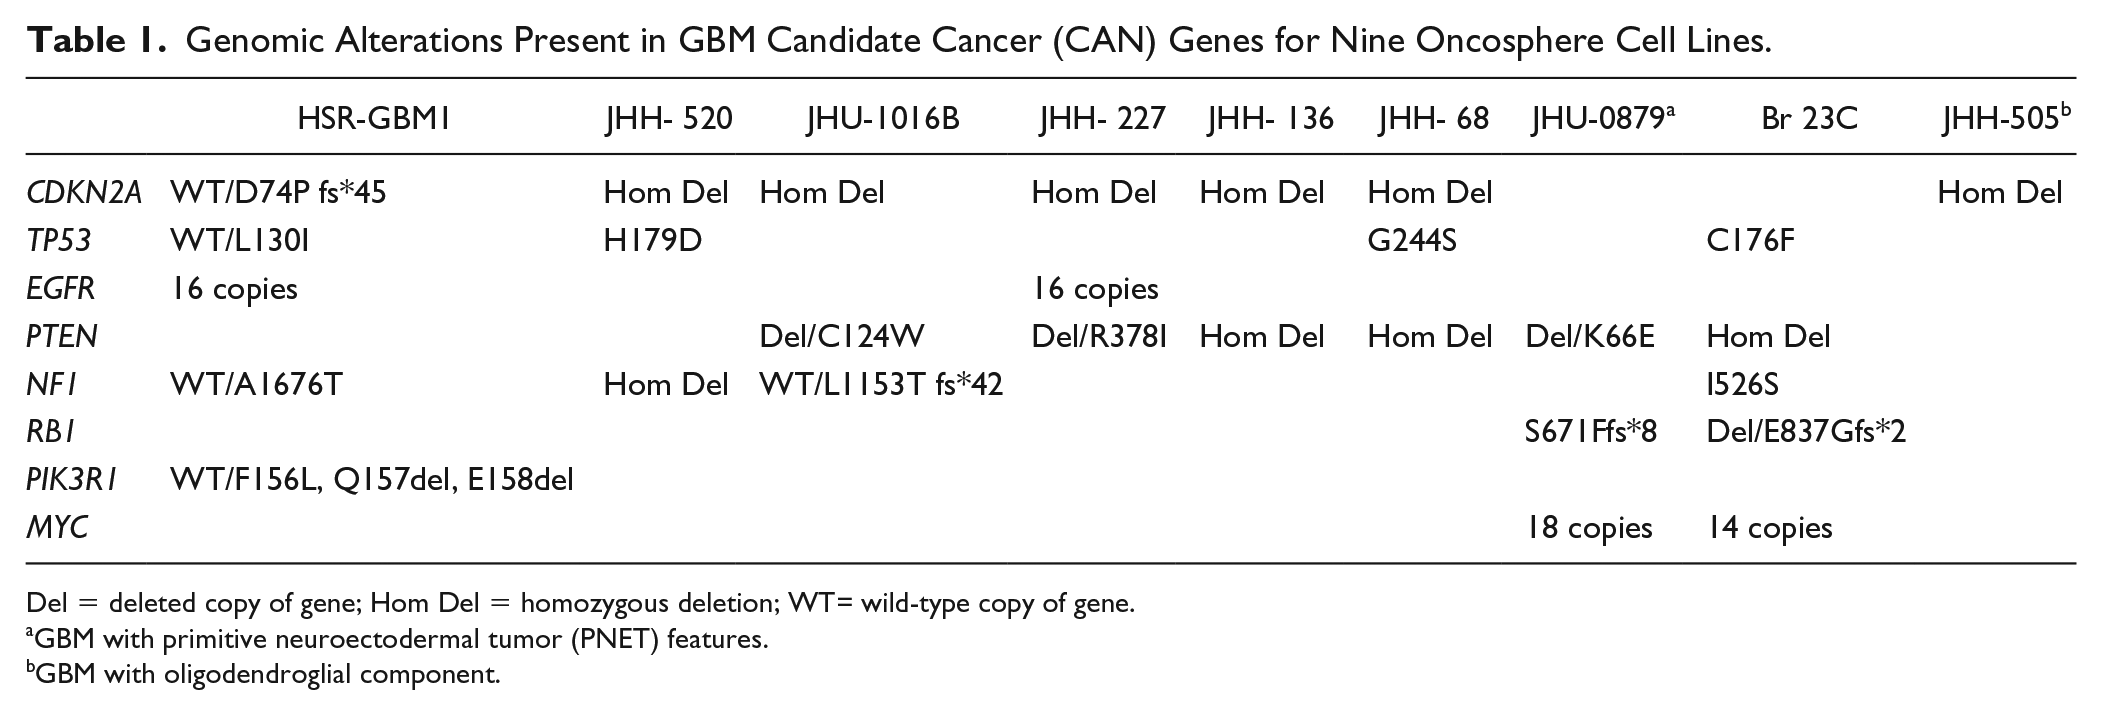
Del = deleted copy of gene; Hom Del = homozygous deletion; WT= wild-type copy of gene.
GBM with primitive neuroectodermal tumor (PNET) features.
GBM with oligodendroglial component.
Compared with previous sequencing studies utilizing GBM patient samples,16–18 our oncosphere panel had a 25%–36% increase in mutations in PTEN and NF1 ( Suppl. Table S2 ), which indicates that tumors with these mutations have a selective advantage for long-term in vitro growth. The Br23C sample had a matching patient xenograft, Br23X, which was generated from the same tumor tissue. Br23X was sequenced in a previous study, 16 so we compared CAN gene mutations for Br23C with those previously reported for Br23X ( Suppl. Table S3 ). We found that the mutations in PTEN, NF1, and TP53 were identical in the xenograft and cell line, while mutations in RB1 and MYC were present only in the cell line. These data are evidence that the alterations within the CDKN2A/RB1 pathway provide a selective advantage for long-term in vitro growth.
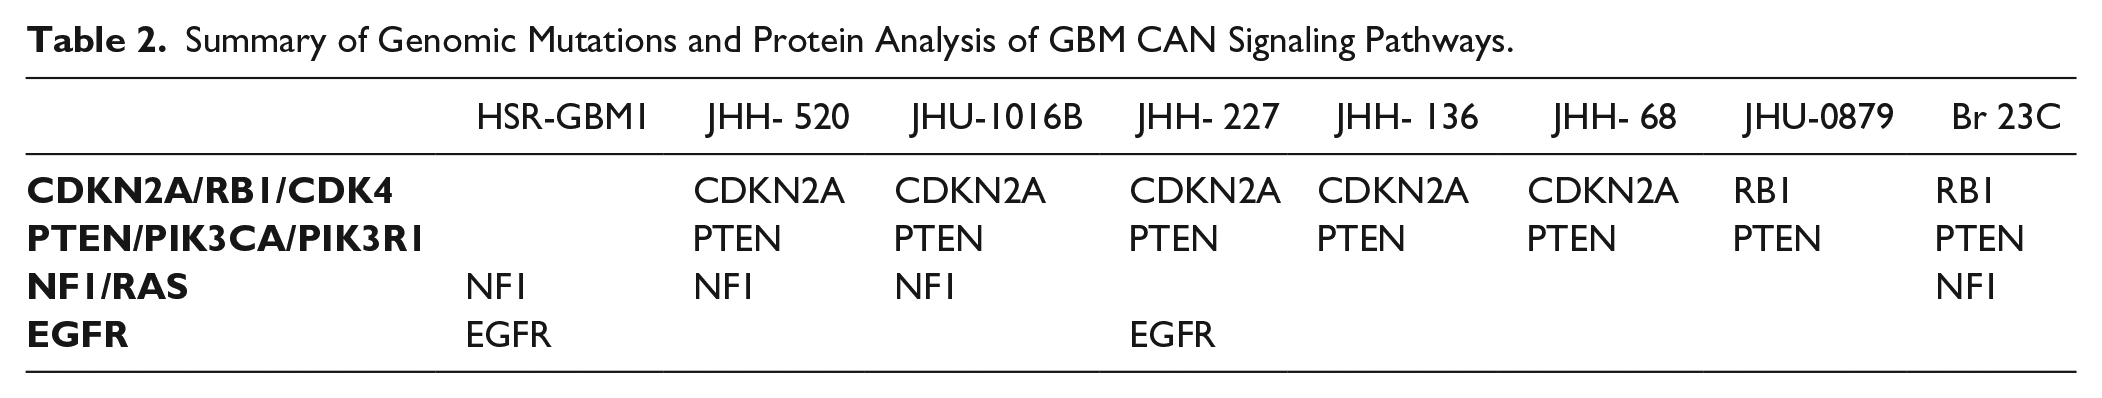
We then verified the presence or absence of PTEN and NF1 protein by Western blot in eight oncosphere lines ( Fig. 1A,B ). JHH-505 was excluded from analysis due to a low quantity of protein. Three cell lines had PTEN protein present, HSR-GBM1, JHU-1016B, and JHU-0879, while all others had no PTEN. Four cell lines had NF1 present, JHH-227, JHH-136, JHH-68, and JHU-0879, while all others had no NF1. Certain cell lines showed discrepancies between the mutation status and protein expression of PTEN and NF1. The genomic and protein expression data were combined to delineate which GBM driver signaling pathways were altered within each oncosphere line ( Table 2 ). The most commonly mutated pathways were the CDKN2A/RB1/CDK4 pathway and the PTEN/PIK3CA/PIK3R1 pathway, with seven of eight cell lines containing an alteration of one gene/protein in each of these pathways.
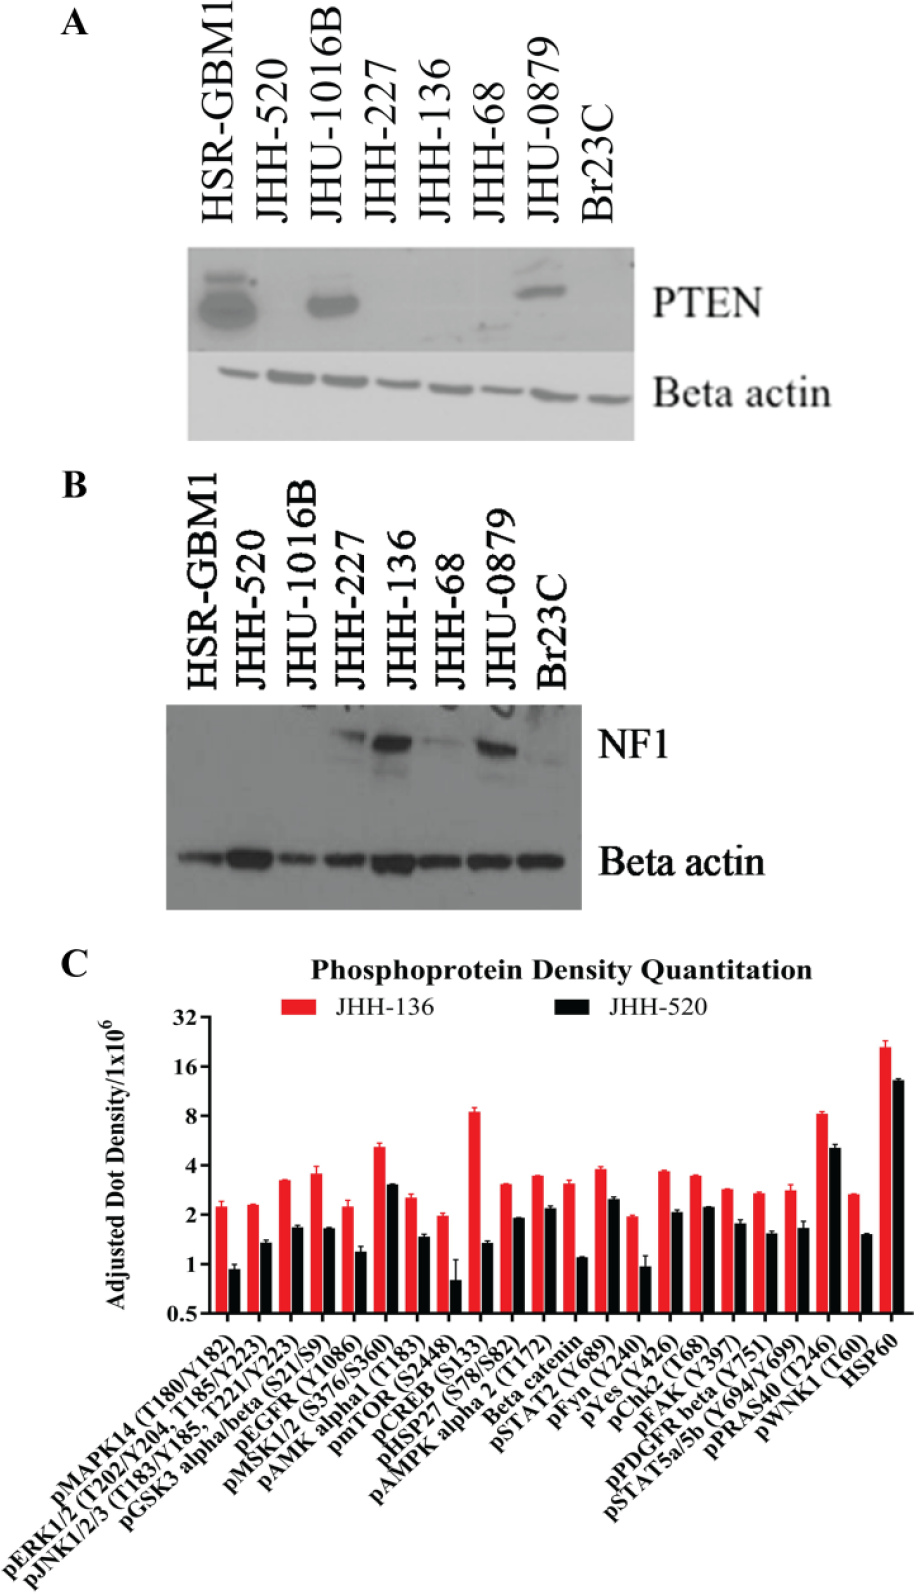
Protein expression profiling of PTEN and NF1 in oncosphere cell lines. (
Summary of Genomic Mutations and Protein Analysis of GBM CAN Signaling Pathways.
We selected two cell lines, JHH-136 and JHH-520, for phosphokinase profiling of 46 proteins to examine downstream kinase activation ( Suppl. Fig. S1 ). Of the 46 proteins examined, 17 proteins had significantly higher expression (p < 0.001) in JHH-136 than in JHH-520 ( Fig. 1C ). Many of these proteins are directly phosphorylated by phosphoAkt, such as mTOR and CREB, evidence that JHH-136 has higher activated Akt levels than JHH-520. Hsp60 was the most highly expressed protein in both cell lines. Taken together, these data show that our GBM oncosphere cell line panel contains cell lines with unique GBM driver pathway alteration profiles. These data paired with the in vivo characterization of these oncosphere cell lines 8 make them an excellent research and discovery tool for GBM therapeutics. We chose to use JHH-136 and JHH-520 in a quantitative high-throughput screen (qHTS) in order to examine differential drug sensitivities and possible novel therapeutics.
Oncosphere Cell Lines Show Differential Sensitivity to Single-Agent Compounds
We first sought to compare drug responses between oncosphere cell lines and adherent GBM cell lines. JHH-136, JHH-520, LN-229, and U-87MG were screened for cell viability using the MIPE 4.0 compound library. All single-agent screening data is available for download at https://tripod.nih.gov/matrix-client/?p=121. Figure 2A shows JHH-136 and JHH-520 spheroid morphology after 48 h in a 1536-well plate. Each compound in the MIPE 4.0 library was annotated with gene target, mechanism of action, and cellular process information to allow for aggregation of data to search for novel biological insight.
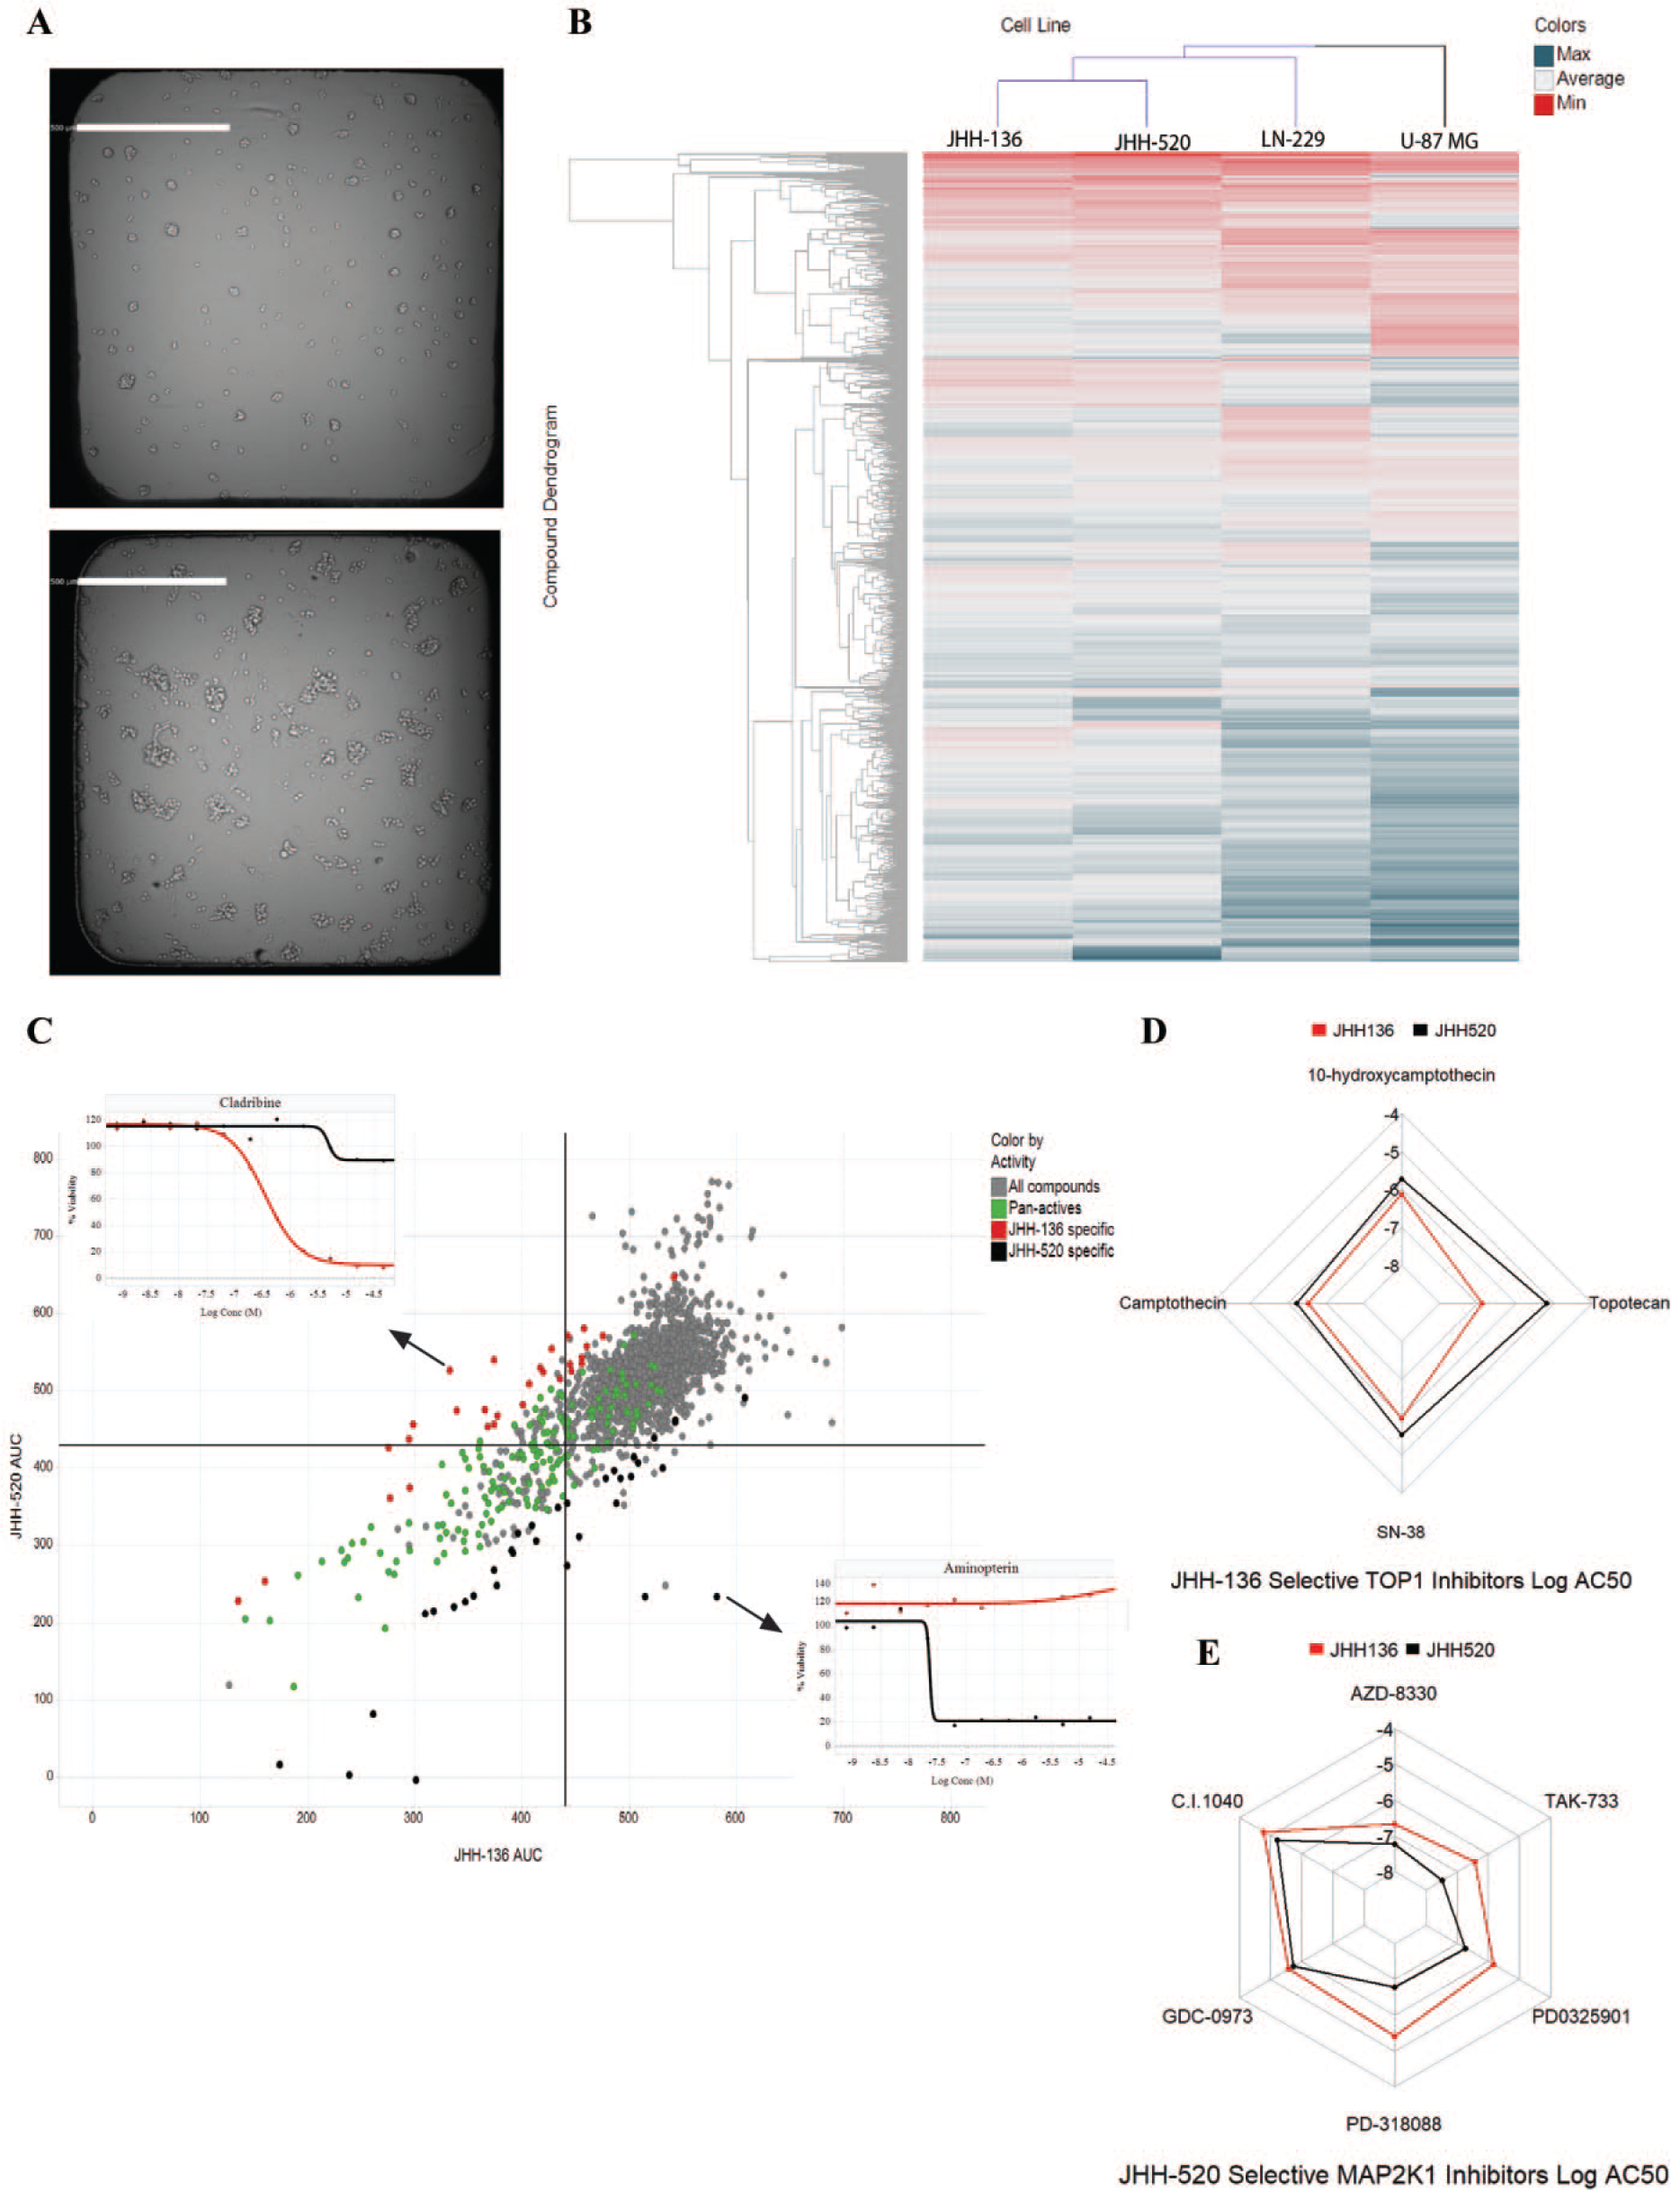
Single-agent screening data for JHH-136 and JHH-520. (
An unbiased hierarchical clustering of AUC values for all four GBM cell lines screened is shown in Figure 2B . LN-229 and U-87MG cluster separately from both oncosphere lines, indicating that cell growth conditions can affect drug response. To compare the oncosphere drug responses, a deltaAUC value was calculated for each compound by subtracting the AUC value in JHH-136 from JHH-520. This allowed for a more direct comparison of compound performance across each cell line. Pan-active compounds were defined as having a CRC of −1.1, −1.2, and −2.1 in both cell lines and a deltaAUC between −80 and 80 ( Fig. 2C , green circles), which yielded 160 compounds for the two oncosphere lines. Pan-actives were aggregated by gene target, and a target enrichment analysis (using Fisher’s exact test) was done in order to compare pan-actives to the MIPE 4.0 library targets overall, and a false discovery rate (FDR) was used for p value correction. Hsp90, HDAC1, PSMD1, CDK1, PIK3CA, and NFKB1 all were significantly overrepresented (adjusted p < 0.01). These targets are all directly involved in cell cycle regulation, global transcriptional regulation, and protein folding. The PIK3CA pathway was altered in both oncosphere cell lines screened, which explains the overrepresentation of this target. Overall, these mechanisms are critical for the growth of all GBM cells; therefore, we hypothesized that compounds with these mechanisms would have similar activity across multiple GBM oncosphere cell lines, regardless of their mutation profile.
To validate this hypothesis, we selected two pan-active compounds for testing across multiple oncosphere cell lines. The Hsp90 inhibitor, BIIB021, and bardoxolone methyl, an NF-kB inhibitor, were tested for viability against six oncosphere cell lines. Both compounds had similar submicromolar IC50 values, and all dose–response curves contained two asymptotes, as in the primary screen ( Suppl. Fig. S2 ). We also examined these two compounds in the high-throughput screen against LN-229 and U-87MG and found them to be active similarly to the oncosphere cell lines ( Suppl. Fig. S2 ). This is evidence that compounds targeting Hsp90 or NF-kB mechanistic classes may be good candidates for reducing GBM cell line viability regardless of genetic background.
Next, we examined actives specific to either JHH-136 or JHH-520 to determine if cell line genomic profiles correlated with drug sensitivity. To find highly specific actives for either cell line, we defined specific actives as compounds with a deltaAUC greater than 80 or less than −80 and having a maximum response (MAXR) lower than 60 in either cell line. Compounds with a negative deltaAUC were more active in JHH-136 than in JHH-520, and compounds with a positive deltaAUC were more active in JHH-520 than in JHH-136. Using these methods, 29 JHH-136-specific actives and 34 JHH-520-specific actives were identified ( Fig. 2C , red and black circles, respectively), and target-wise differential analysis was completed for each group of compounds to determine targets for which a statistically significant difference in AUC between cell lines existed.
For JHH-136-selective actives, proteasome and topoisomerase 1 (TOP1) inhibitors had a significantly (p = 0.0012 and 0.0059, respectively) lower AUC in JHH-136 than in JHH-520. The four compounds targeting TOP1 had a median deltaAUC of −125.404 ± 27.211 ( Fig. 2D ). Of these four compounds, three of them are camptothecin analogs and the fourth is camptothecin’s active metabolite, SN-38, indicating that JHH-136 is highly sensitive to this structural class of compounds. The compound with the most negative deltaAUC was cladribine ( Fig. 2C , inset), a nucleoside analog that targets adenosine deaminase (ADA), causing DNA replication arrest and DNA damage. 19 Given that both TOP1 and ADA are critical to DNA replication, these data show that JHH-136 is highly sensitive to compounds that interfere with DNA replication.
For JHH-520-selective actives, Mek (MAP2K1) inhibitors had a significantly (p = 0.0001) lower AUC in JHH-520 than JHH-136. The six Mek inhibitors had a median deltaAUC of 90.097 ± 8.247 ( Fig. 2E ). Aminopterin ( Fig. 2H ), an inhibitor of dihydrofolate reductase (DHFR), had the most positive deltaAUC ( Fig. 2C , inset). Two more DHFR inhibitors were highly specific to JHH-520, as well as two inhibitors of HPRT1, which indicated that this cell line was highly sensitive to blockade of purine synthesis and related pathways. Given the lack of NF1 protein present in this cell line, the sensitivity to Mek inhibition is expected. Since NF1 alterations were present in some GBM oncosphere cell lines, we hypothesized that Mek inhibitors would have variable activity across GBM oncosphere cell lines.
To test this hypothesis, TAK-733, a JHH-520-selective active, was screened against six oncosphere cell lines ( Suppl. Fig. S2 ). Activity was highly variable across all cell lines tested, with IC50 values ranging from 16 µM in HSR-GBM1 to 30 nM in JHH-520. Due to its compound inactivity, an IC50 value could not be calculated for Br23C. Taken together, these data are evidence that GBM cell lines with varying mutational profiles are sensitive to compounds that directly target critical cellular processes, such as cell cycle, transcription, and protein folding, and commonly mutated GBM pathway components, such as PI3 kinase. However, certain classes of compounds have activity only in certain cell lines with a specific mutation profile, such as Mek inhibitors in NF1 altered cell lines.
PI3 Kinase Inhibitors Are Synergistic in Combination with Mek Inhibitors
We next sought to determine if drug combination viability screening could reveal drug mechanisms that would be synergistic when combined. A high-throughput drug combination screening platform, which has been previously described, 11 was utilized for this purpose. Thirty compounds were selected for drug combination screening based on multiple criteria. Single-agent performance and enriched targets were taken into account. Weakly active and inactive compounds were also included if they had targets that were enriched in single-agent screens or had scientific evidence of blood–brain barrier (BBB) penetration. All 30 compounds were combined individually with each other, resulting in 435 discrete drug combinations; these were all screened in a 6 × 6 matrix format for cell viability. The full list of compounds and single-agent performance is given in Supplemental Table S4 . All drug combination screening data are available at https://tripod.nih.gov/matrix-client/?p=121. JHH-136 was used for the primary matrix screen, and multiple synergy metrics were assessed for all combinations. Hierarchical clustering of each combination by gamma synergy metric 20 revealed 14 compounds, which were highly synergistic when combined with each other ( Fig. 3A ). Within these 14 compounds, PI3 kinase, mTOR, and Mek inhibitors were present; specifically, combinations involving either GSK-2126458 or AZD-8055 were all highly synergistic with trametinib and TAK-733 ( Fig. 3B,C ). Additional synergistic combinations involved CNF-2024 and carfilzomib, an Hsp90 inhibitor and proteasome inhibitor, respectively.
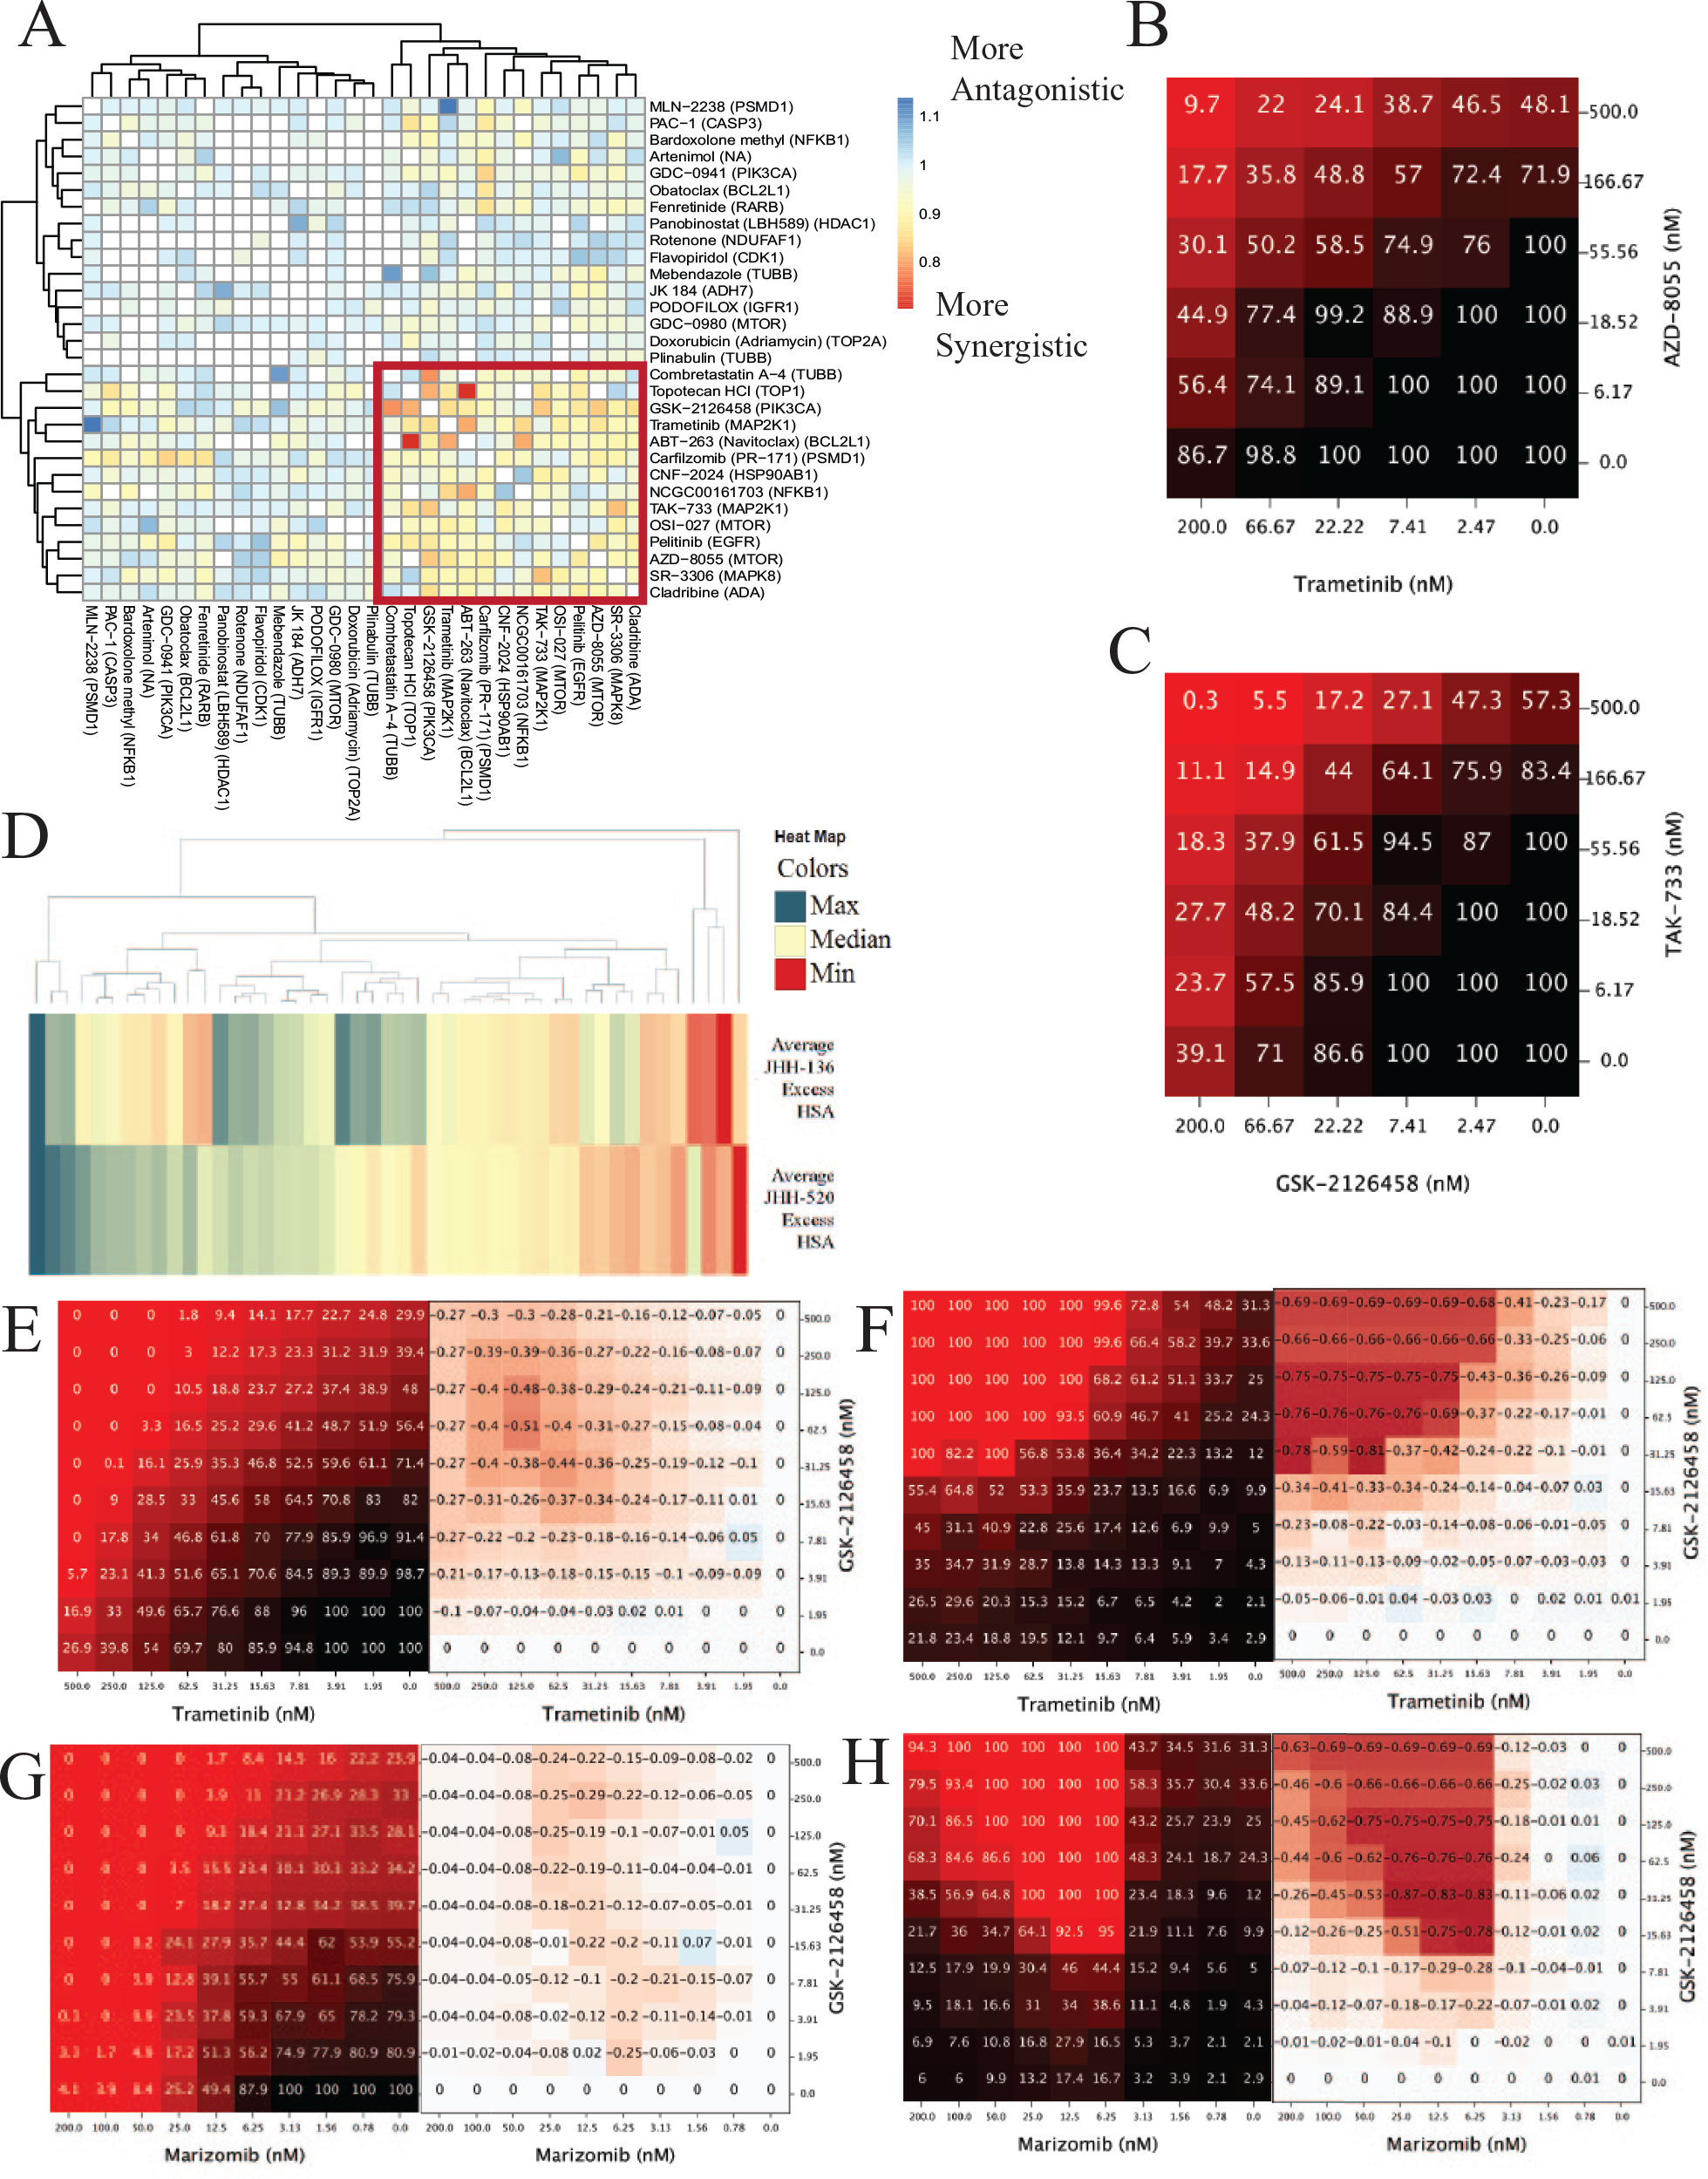
Drug combination screening data. (
We then selected 47 discrete combinations ( Suppl. Table S5 ) for an expanded cell viability combination screen in a 10 × 10 format to allow for more precise determination of the synergistic window of each combination. Marizomib, a BBB penetrant proteasome inhibitor, 21 was added for this screen, as well as other known BBB penetrant compounds. Combinations were tested for viability in JHH-136 and JHH-520, as well as apoptosis induction after 8 and 24 h of drug exposure in JHH-136. Hierarchical clustering of the excess Highest single agent (HSA) value for each drug combination ( Fig. 3D ) in each cell line revealed that overall, most combinations had similar synergy in both lines. The focused 10 × 10 drug combination cell viability data were rank ordered from most synergistic to most antagonistic using the gamma synergy metric for each combination in each cell line. Self-crosses were excluded from analysis, leaving 42 ranked combinations. Trametinib, a Mek inhibitor, combined with GSK-2126458 (PI3 kinase/mTOR) ( Fig. 3E ), AZD-8055 (mTOR), navitoclax (Bcl-2/Bcl-xL), CNF-2024 (Hsp90), or pelitinib (EGFR), was within the top 10 most synergistic combinations for both cell lines and also induced apoptosis after 8 h of compound exposure ( Fig. 3F ). These data are strong evidence that targeting Mek, PI3 kinase, mTOR, or Bcl-2 simultaneously causes a synergistic decrease in cell viability, as well as induction of apoptosis as early as 8 h after drug exposure. Proteasome inhibitors, such as carfilzomib and marizomib, had excellent synergy when combined with GSK-2126458 ( Fig. 3G ) and induced apoptosis at low-nanomolar concentrations after 8 h of drug exposure ( Fig. 3H ). Overall, the drug combination studies showed trends in which mechanisms can synergize to decrease GBM cell growth and induce apoptosis.
GDC-0941 Paired with PD0325901 and PD0325901 Alone Extend Survival In Vivo
Finally, we examined whether the in vitro data could be replicated in vivo. The JHH-520 cell line was an excellent candidate for in vivo experimentation. Animals implanted intracranially with this cell line develop highly invasive tumors with areas of necrosis and mitotic features, and implanted animals had an MST of 82 days. 8 We selected two drug combinations for testing in vivo, a PI3 kinase inhibitor paired with either a Mek inhibitor or a proteasome inhibitor.
GDC-0941 as a PI3 kinase inhibitor was a candidate, as it was tested in single-agent screening. There are reports that GDC-0941 penetrates the BBB; however, pharmacokinetic studies have not been reported that indicate maximal doses attainable in the brain. 22 Structurally, GDC-0941 and GSK-2126458, the compound tested in our combination studies, are dissimilar; however, they have a common target of the p110 subunit of PI3 kinase. Trametinib has minimal BBB penetration; 23 however, PD0325901 is a Mek inhibitor that is able to penetrate the BBB and has already been tested as a single agent in an intracranial GBM model. 24 Marizomib is reported to have better activity in GBM than bortezomib. 25 Given these data, we elected to test GDC-0941 with PD0325901 and GDC-0941 with marizomib in vivo using the JHH-520 xenograft model.
Control animals received vehicle only and treatment groups received either GDC-0941 alone, PD0325901 alone, marizomib alone, GDC-0941 plus PD0325901, or GDC-0941 plus marizomib. The control group had an MST of 92.5 days. The MST of GDC-0941 alone was 92 days, PD0325901 alone was 147 days, and the combination of GDC-0941 plus PD0325901 was 121 days ( Fig. 4A ). Only PD0325901 alone and the combination provided a significant improvement in MST over that of the control group (p = 0.0014 and p = 0.0020, respectively). The MST of marizomib alone was 77 days, while the combination of marizomib plus GDC-0941 had an MST of 102 days ( Fig. 4B ), neither of which was a significant improvement over the control groups (p = 0.2611 and p = 0.5677, respectively). All marizomib treatment groups had early toxicity issues, which likely caused a lower MST compared with the control group. Overall, the treatment groups with the longest survival were PD0325901 alone or GDC-0941 plus PD0325901, which is evidence that targeting PI3 kinase and Mek simultaneously or Mek alone can extend survival in a GBM animal model.
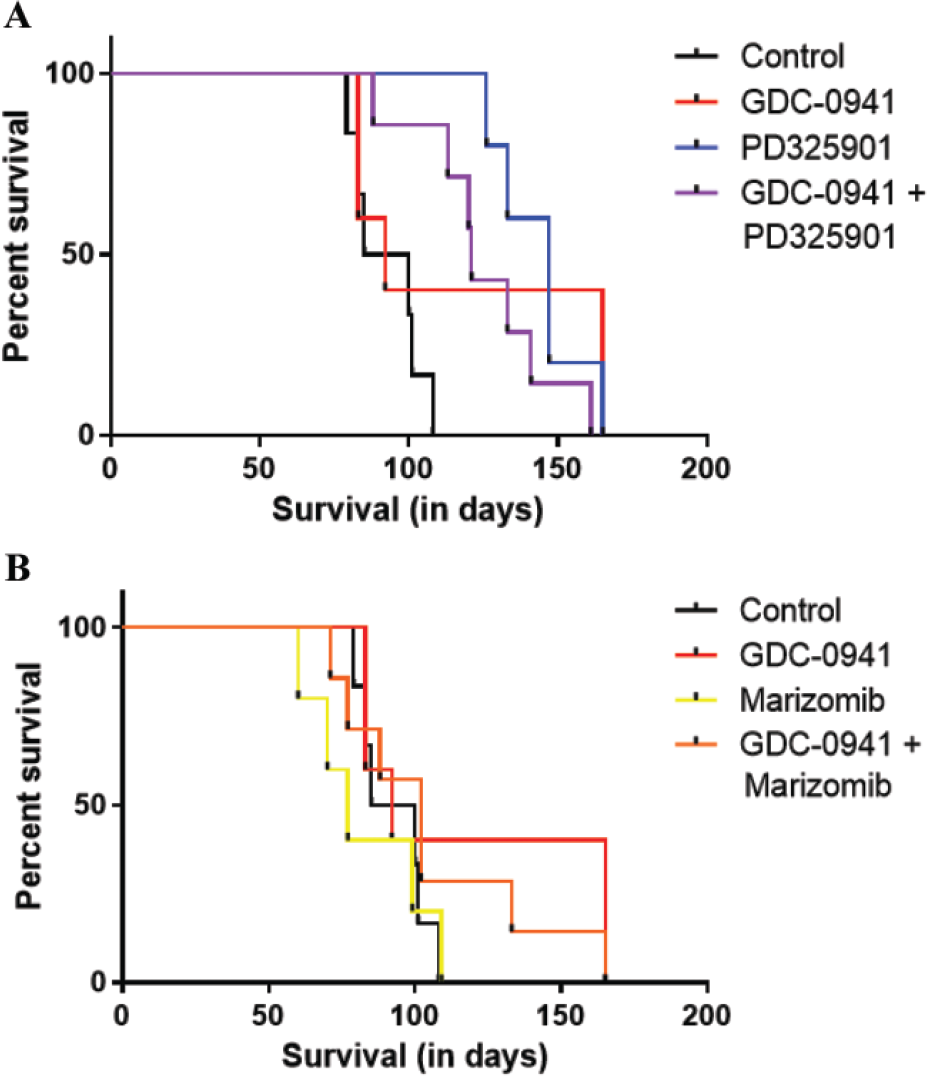
Orthotopic xenograft drug combination survival data. (
Discussion
Each Oncosphere Cell Line Is a Unique, Independent GBM Model
All oncosphere cell lines included within this study have been characterized in a previous publication, 8 which details clinical data, doubling times, and in vivo tumor formation with histological characteristics of human GBM. This study adds genomic mutation data to these well-characterized lines. Genetic alterations common in primary GBM tissues have been widely studied, and genes that drive GBM formation and growth have been determined.16–18 We found that our GBM oncosphere cell lines have alterations in GBM CAN genes at similar frequencies to studies using primary tissue. The most common alterations found were loss of CDKN2A and PTEN; the former results in uncontrolled cell growth and the latter causes overactive signaling through the PI3 kinase/AKT pathway. Only two of nine oncosphere lines contained high-level EGFR amplification, but at a lower frequency than reported in studies sequencing primary tumor samples. However, for our study we elected to consider cell lines with greater than 10 copies of EGFR as amplifications, while previous studies utilized a lower threshold. Multiple oncosphere cell lines, such as JHH-136 and JHH-520, contained three or four copies of EGFR evidence that this alteration is prevalent in GBM tumors and cell lines.
NF1 and PTEN alterations were present at a higher frequency than reports sequencing primary tumor samples. Our oncosphere panel also had some differences in mutation frequency compared with commonly used monolayer GBM cell lines.26,27 These differences between the GBM oncosphere cell line, primary GBM tissue, and monolayer GBM cell lines suggest a selection bias of oncosphere cell culture methods. However, evidence has shown that long-term growth in serum-containing media can increase the frequency of certain mutations, 6 therefore it is challenging to compare mutation frequencies between monolayer GBM lines grown in serum-containing media for more than 50 years 28 with oncosphere cell lines with a short culture time in non-serum-containing media. When protein expression was verified by Western blot, we found a few inconsistencies with the sequencing data. These could be explained by alterations in antibody recognition sequence, epigenetic silencing mechanisms, mutations not considered in regulatory regions, or other unforeseen mutational affects resulting in a loss of protein expression.
Previous studies show that GBM oncospheres grown in serum-free conditions better maintain the parental tumor genomic mutation and RNA expression profile than adherent cell lines grown with serum. 6 Additionally, our GBM oncosphere cell lines can form intracranial tumors, which contain features of human GBM, such as invasive growth and areas of necrosis. 8 U-87MG, LN-229, and other adherent GBM cell lines lack the ability to form tumors in vivo that show the pathological hallmarks of human GBM, such as invasive tumor growth, which makes them a poor model for preclinical studies used to inform clinical trials. Taken together, oncosphere cell lines are highly representative of the histology and disease progression of GBM patients, yet it remains unclear if they are a better model for preclinical studies. We hope that through widespread use of our GBM oncosphere cell lines, there can be preclinical studies done to inform successful clinical trials to improve treatment options for GBM patients.
Drug Efficacy Can Be Dictated by the Characteristics of the Model Tested
Our qHTS study, using a focused collection of compounds with clinical relevance in cancer, revealed a number of different drug classes that were effective at stopping GBM cell growth. We utilized two oncosphere cell lines with two different mutation profiles for screening and found multiple targets, such as Hsp90 and proteasome inhibitors, that were enriched in the list of compounds that were active in both cell lines tested. Topoisomerase inhibitors were the only dominant drug class that was selectively active in JHH-136, indicating that targeting DNA replication and mitosis was cytotoxic to this cell line. Mek inhibitors were the dominant class of compounds that were active only in JHH-520, showing that targeting signaling pathways was effective for this cell line. This effect was likely due to the absence of NF1 protein in the JHH-520 cell line. The high activity of classes of compounds in a single cell line could be caused by differences in protein expression or activated signaling pathways that were not assessed in this study. An additional observation was that some compounds, specifically inhibitors of nicotinamide phosphoribosyltransferase or Mek, were inactive or weakly active in the adherent GBM cell lines tested, yet were highly active in one or both oncosphere cell lines. This indicates that screening studies using only adherent cell lines may be excluding efficacious compounds.
The drug combination studies revealed synergistic effects that were common across cell lines, as well as some that were selective. PI3 kinase inhibition paired with inhibition of Mek, proteasome, or Bcl-2 was synergistic in both oncosphere cell lines. However, JHH-136 had multiple top-ranked synergistic combinations involving pelitinib, an EGFR inhibitor, yet these combinations were additive in JHH-520. We believe that these differences in single-agent and combination-drug response between cell lines are due to the differences in genomic mutation and protein expression profile of JHH-136 and JHH-520. Further exploration of the cellular mechanisms that explain these compound synergies will be necessary. In making this full screening dataset public, we hope others will utilize these data as a starting point for further preclinical investigation.
Translation of the in vitro results to in vivo experiments was not straightforward. PD0325901, when dosed as a single agent, had the best MST. PD0325901 has already been tested as a single agent in an intracranial GBM model and showed a survival benefit. 24 The cause of the lack of synergy in vivo between GDC-0941 and PD0325901 is likely due to pharmacokinetic issues related to GDC-0941. A recent study testing buparlisib in combination with PD0325901 showed that the combination had a better MST than the single agent in subcutaneous glioma xenografts; however, for the same combination tested using orthotopic xenografts, PD0325901 was superior to the combination, 29 similar to the data presented here. This is evidence that more effort should be focused on the development of a BBB penetrant PI3 kinase inhibitor. Marizomib, a proteasome inhibitor produced by a marine bacterium, Salinispora tropica, has conflicting reports about its ability to cross the BBB21,25 and has been tested in GBM in combination with HDAC inhibitors. 21 In our testing, treatment groups containing marizomib did not show a survival benefit, most likely due to toxicity issues and the complexity of the BBB penetration of the compounds at the doses tested. Taken together, our panel of GBM oncosphere cell lines is suitable for use in high-throughput screening and drug combination studies; however, there remains the issue of translating in vitro efficacy into in vivo efficacy.
Supplemental Material
Supplemental_Material_for_Mutation_Profiles_in_Glioblastoma_3D_Oncospheres_Modulate_Drug_Efficacy_by_Wilson,_et_al. – Supplemental material for Mutation Profiles in Glioblastoma 3D Oncospheres Modulate Drug Efficacy
Supplemental material, Supplemental_Material_for_Mutation_Profiles_in_Glioblastoma_3D_Oncospheres_Modulate_Drug_Efficacy_by_Wilson,_et_al. for Mutation Profiles in Glioblastoma 3D Oncospheres Modulate Drug Efficacy by Kelli M. Wilson, Lesley A. Mathews-Griner, Tara Williamson, Rajarshi Guha, Lu Chen, Paul Shinn, Crystal McKnight, Sam Michael, Carleen Klumpp-Thomas, Zev A. Binder, Marc Ferrer, Gary L. Gallia, Craig J. Thomas and Gregory J. Riggins in SLAS Technology
Footnotes
Acknowledgements
We would like to thank Dr. Natalia J. Martinez and Steve Titus for usage of the U-87MG and LN-229 cell lines, Jonathan M. Keller for qHTS assistance, Dr. Qi Zhao and Dr. Ewen Kirkness for DNA sequencing and data analysis, Dr. Aleksandra Michalowski for assistance with data analysis, and Dr. Matthew Hall for critical reading of the manuscript.
Declaration of Conflicting Interests
The authors declared no potential conflicts of interest with respect to the research, authorship, and/or publication of this article.
Funding
The authors disclosed receipt of the following financial support for the research, authorship, and/or publication of this article: This work was funded by NIH Intramural Research Program at NCATS, the Virginia and D. K. Ludwig Fund for Cancer Research (G.J.R.), and the Department of Neurosurgery at Johns Hopkins School of Medicine (G.L.G.).
Supplemental material is available online with this article.
References
Supplementary Material
Please find the following supplemental material available below.
For Open Access articles published under a Creative Commons License, all supplemental material carries the same license as the article it is associated with.
For non-Open Access articles published, all supplemental material carries a non-exclusive license, and permission requests for re-use of supplemental material or any part of supplemental material shall be sent directly to the copyright owner as specified in the copyright notice associated with the article.