
Abstract
PCR is the most sensitive molecular diagnostic available for infectious diseases. The goal for low-resource settings is a simple, inexpensive instrument. Toward this goal, we previously published a self-contained sample preparation instrument that uses magnetics and prearrayed reagents in thin tubing to extract nucleic acids and perform isothermal amplification and detection of extracted biomarkers. To incorporate PCR thermal cycling, after biomarker is magnetically extracted from a patient sample, the section of tubing containing the extracted biomarker and PCR reagents is alternately positioned within two constant temperature blocks. This instrument was evaluated initially by extracting and amplifying a 140 bp fragment of the IS6110 sequence of tuberculosis from TE buffer. The mean cycle threshold for 5 × 10⁶ copies of IS6110 was 25.5 ± 1.5 cycles (n = 4), which was significantly different from negative control samples (34.0 ± 2.6 cycles; n = 3). Using a more clinically relevant sample, we extracted and amplified Plasmodium falciparum DNA from malaria-infected human blood cultures. The average cycle threshold for 1% parasitemia samples was 24.7 ± 1.5 cycles (n = 3) and significantly different from negatives (31.5 ± 2.1 cycles; n = 3). This approach integrates biomarker extraction, PCR amplification, and detection in a simple, linear tubing design with potential for use as a low-resource instrument.
Introduction
Diagnosis of diseases such as malaria, tuberculosis, and HIV/AIDS continues to be a major global health challenge.1,2 Instrumentation innovations for rapid molecular diagnosis of infectious diseases in low-resource settings could have a major impact on global health.2–5 Our lab has previously described a simple, self-contained instrument to achieve biomarker extraction and isothermal amplification and detection. 6 In this design, sample containing biomarker is combined with magnetic binding beads and introduced into reaction tubing preloaded with solutions for DNA extraction and isothermal amplification. As an alternative to microfluidic designs, this instrument uses magnetics and tube positioning to extract biomarkers from a sample and deliver them to an isothermal reaction segment of the tubing. The reaction segment containing the amplification reagents is positioned within a heat block, and intercalating dye fluorescence is measured. This simple instrument was designed to capitalize on the single temperature heat source required for isothermal amplification. However, primer design for isothermal amplification is more complicated than it is for PCR, and isothermal multiplexing is more challenging. Therefore, PCR remains the gold standard for molecular diagnostics. This report describes modification of our original design to incorporate sample preparation and PCR in a simple, self-contained instrument.
The main challenge for PCR instrumentation is reproducible temperature change in the PCR reaction tube in order to achieve the desired temperature for each step in the PCR cycle. Commercially available thermal cyclers typically use designs in which PCR tubes are inserted into the instrument, and the temperature around them is changed.7,8 Tube mounts typically consist of either a metal block heated by a Peltier or similar device or an air chamber that heats and cools by convection using temperature-controlled air. In these designs, the heat transfer rate is proportional to the temperature difference between the tube surroundings and the reaction in the tube. Because it is not economically feasible to immerse temperature sensors into each PCR reaction, reproducibility is achieved in most commercial instruments by the incorporation of temperature sensors inside the instrument. These sensors are used to provide feedback control of heating and cooling instrument components. The instrument manufacturer then uses a calibration procedure to estimate how the internal instrument temperature relates to the reaction tube temperature.
A second challenge for PCR instrumentation is achieving reproducible temperature change as rapidly as possible. Because the rate of heating or cooling is directly proportional to the difference in temperature between the PCR reaction solution and the surroundings, the rate slows as the difference decreases. Designs based on the use of metal block tube holders typically achieve heating and cooling rates of 1 to 3 °C per second. 9 However, the maximum rates of temperature change for commercially available air chamber models can exceed 15 °C per second during heating and 20 °C per second during cooling. 9 Faster cycle times are achieved by heating or cooling the outside of the tube beyond the desired reaction temperature and using predetermined calibrations of actual reaction temperatures to time the switch from heating to cooling and vice versa.7,8 Because these designs do not directly measure the reaction temperature, instrument calibration and the timing of the temperature changes are critical, because overheating beyond the denaturing temperature inactivates the polymerase enzyme, whereas cooling significantly below the annealing temperature increases nonspecific amplification.
Originally, Mullis and colleagues achieved temperature cycling by physically moving the PCR reaction tube into and out of constant temperature baths.10,11 Here, we integrate sample preparation with PCR instrumentation in which thermal cycling is achieved by incorporating two fixed temperature stations and moving the reaction tube, similar to Mullis’s original design. The main advantage of the fixed temperature approach is simpler instrumentation design, because the temperatures of the heat sources are held constant. This reduces the need for complex heating and cooling instrument components and, if the fixed driving temperatures are chosen appropriately, eliminates the possibility of overheating or overcooling the PCR reaction. This report describes the incorporation of a second heat block into our original extraction and isothermal amplification instrument to evaluate the performance of this approach. 6
Materials and Methods
Tubing for Extraction and PCR Amplification of Tuberculosis Target
Sample containing biomarker, biomarker extraction solutions, and PCR reagents was preloaded inside of fluorinated ethylene propylene (FEP) tubing (0.32 cm outside diameter, 0.23 cm inside diameter).6,12 Target biomarkers consisted of 140 base pair fragments of the IS6110 sequence of tuberculosis. 6 A 67 bp amplicon of the IS6110 sequence was amplified using 0.2 µM forward primer (5′ ACC AGC ACC TAA CCG GCT GTG G 3′) and 0.2 µM reverse primer (5′ CAT CGT GGA AGC GAC CCG CCA G 3′). 12
Chamber 1 ( Fig. 1 ) consisted of 100 µL TE buffer, 5 µL IS6110 DNA at a concentration of 106 copies/µL, 300 µL binding buffer (4M guanidine thiocyanate, 25 mM sodium citrate pH 7.0), and 20 µL Dynabeads MyOne Silane magnetic beads (~6 × 10⁸ beads; Life Technologies 37002D, Carlsbad, CA). Chamber 2 contained 300 µL of precipitation buffer (80% ethanol, 5 mM potassium phosphate, pH 8.5) followed by 300 µL 70% ethanol in chamber 3. The reaction chamber consisted of 0.5 µL KAPA2G Fast Hot Start polymerase (Kapa Biosystems, Wilmington, MA), 10 µL 5x KAPA2G buffer, 3 µL 25 mM MgO2, 1 µL 10 mM E2c dNTP mix, 2 µL 10 µM primers, 1.25 µL 20 µM SYTO 82, and 30.25 µL water. Fluid chambers were separated by air valves. Twenty microliter mineral oil adjacent to the reaction chamber prevented evaporation during PCR. Both ends of the tubing were sealed with polypropylene screws wrapped with Teflon tape. A leader section was added to the reaction chamber end of the tubing ( Fig. 1 ). The leader section consisted of a 13 cm section of tubing with a tapered polypropylene screw on the leading end to guide the tube as it moved through the instrument.
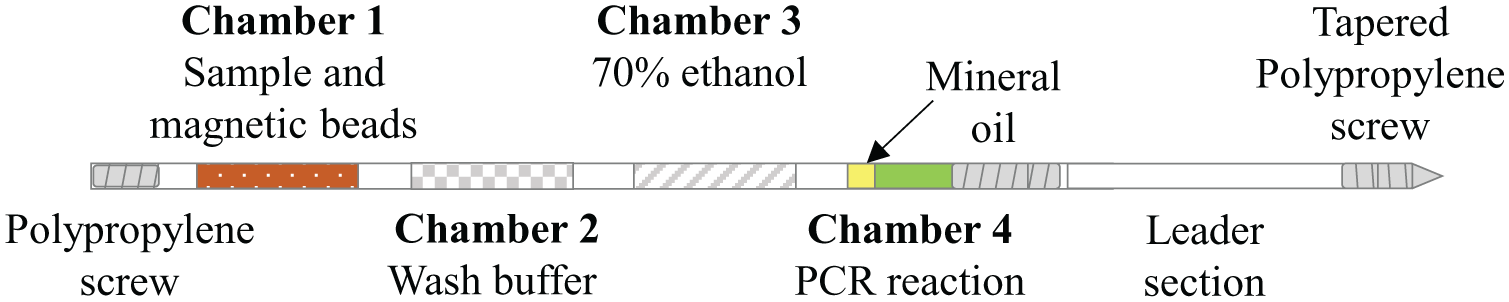
Combined sample preparation and PCR reaction tube. Fluorinated ethylene propylene tubing was filled with sample, extraction solutions, and PCR reagents and then sealed at each end with polypropylene screws wrapped in Teflon tape. A leader section (right) was added to guide tube positioning during processing.
The sensitivity of the two-step reaction to annealing was determined by gradient PCR using Light Cycler (Roche, Basel, Switzerland) over the temperature range of 51 to 74 °C using 5 × 10⁶ copies of IS6110 DNA as target and PCR reaction components as described above for reaction tubing. A melt curve was run on each reaction product to determine the specificity of the target amplification.
Tubing for Extraction and PCR Amplification of Malaria Target
Sample containing biomarker, biomarker extraction solutions, and PCR reagents was preloaded inside of FEP tubing. 13 An 84 bp amplicon of Plasmodium falciparum DNA coding for the 18S rRNA was amplified using 0.2 µM forward primer (5′ ACA TGG CTA TGA CGG GTA ACG 3′) and 0.2 µM reverse primer (5′ TGC CTT CCT TAG ATG TGG TAG CTA 3′). 13
Chamber 1 ( Fig. 1 ) contained the surrogate malaria blood sample obtained from PATH. Prior to loading into the tube, a 100 µL sample of malaria-infected human blood culture (1% parasitemia, 5% hematocrit) was combined with 300 µL lysis buffer (4 M GuSCN, 10 mM Tris HCl pH 8.0, 1 mM EDTA, 0.5% Triton X-100) in a 1.5 mL microcentrifuge tube and incubated at room temperature for 10 min with occasional vortexing to lyse red blood cells. Next, 100 µL of 100% isopropanol and 7.5 × 10⁸ silica-coated magnetic beads (25 µL suspension of Dynabeads MyOne Silane beads) were added to the sample and incubated for 3 min at room temperature before loading into the tubing ( Fig. 1 , chamber 1). Chamber 2 contained 300 µL wash buffer (80% ethanol, 640 mM GuSCN, 1.6 mM Tris pH 8.0, 160 µM EDTA, 0.08% Triton X-100), followed by 300 µL 70% ethanol in chamber 3. The reaction chamber contained 0.5 µL KAPA2G Fast Hot Start polymerase (Kapa Biosystems), 10 µL 5x KAPA2G buffer, 3 µL 25 mM MgO2, 1 µL 10 mM E2c dNTP mix, 2 µL of each 10 µM primer, 2 µL 20 mM EvaGreen (Biotium Inc., Hayward, CA), and 29.5 µL water. Fluid chambers were separated by air valves. Twenty microliters of mineral oil above the reaction chamber prevented evaporation during PCR. Both ends of the tubing were sealed with polypropylene screws wrapped with Teflon tape. A leader section was added to the reaction chamber end of the tubing ( Fig. 1 ) to enable tube movement through the instrument.
The sensitivity of the two-step reaction to annealing temperature was determined by gradient PCR using Light Cycler (Roche) over the temperature range of 55 to 65 °C using 5 × 10⁶ copies of synthetic P. falciparum target DNA. 14 A melt curve was run on each reaction product to determine the specificity of target amplification.
PCR in the integrated instrument was compared with PCR in a commercial PCR machine (Rotor-Gene Q; Qiagen, Hilden, Germany). DNA was extracted from PATH samples containing 1% parasitemia using the integrated instrument as described below or using DNeasy Blood and Tissue Kit (Qiagen). DNA was eluted into the PCR reaction mixture in the extraction tubing as described above or into the TE buffer using DNeasy Blood and Tissue Kit for use as PCR template. DNA eluted directly into the PCR reaction was amplified in the tube in the integrated instrument or removed from the tubing and amplified in a Rotor-Gene Q using a 1 min hold at 95 °C and 45 cycles of 95 °C for 15 s and 62 °C for 30 s.
Instrumentation
Components of the PCR cycling instrument were mounted vertically in a three-dimensional (3D) printed housing ( Fig. 2 ). The vertical alignment of the tubing keeps the oil valve above the PCR reaction and prevents evaporation during heating. The housing was designed using SolidWorks and printed with VisiJet M3 black by a ProJet 3510 HD Plus (3D Systems, Rock Hill, SC). Two permanent neodymium magnets (0.75 in × 0.5 in × 0.25 in; Super Magnet Man, Birmingham, AL) were mounted N-S on either side of the tubing. Assay tubing was held in position by a groove created in two adjacent rollers ( Fig. 3A ). A servomotor (SGMAH-02B; Yaskawa America Inc., Waukegan, IL) rotated one roller ( Fig. 3A ), whereas the second roller was passively rotated via interlocking teeth. Two copper heat blocks were held against two Peltier thermoelectric heaters (VT-31-1.0-1.3; TE Technology, Traverse City, MI). The heat blocks contained a channel for the tubing to pass through as well as type K thermocouples used to set and record the heat block temperatures ( Fig. 3B ). In addition, a channel in the lower block allowed an ESElog fluorescence detector (Qiagen) to measure reaction fluorescence in the tubing. The ESElog excited at 520 nm and read at 570 nm for SYTO-82 and excited at 470 nm and read at 520 nm for EvaGreen. An angled entry on the tube loading port ( Fig. 2 ) was created above the heat blocks and below the magnets for inserting the tubing into the device. Importantly, this prevented heating of the reaction chamber during the extraction phase of the assay. At the end of the extraction phase, the tube motion algorithm positioned the tip of the tubing above the loading port, and during subsequent downward motion, the tube stiffness automatically biased the tubing to pass through the heat blocks during PCR amplification ( Fig. 4 ). Labview software VIs were written to turn the rollers that positioned the tubing during extraction and PCR and to collect fluorescence and temperature data as a function of time.
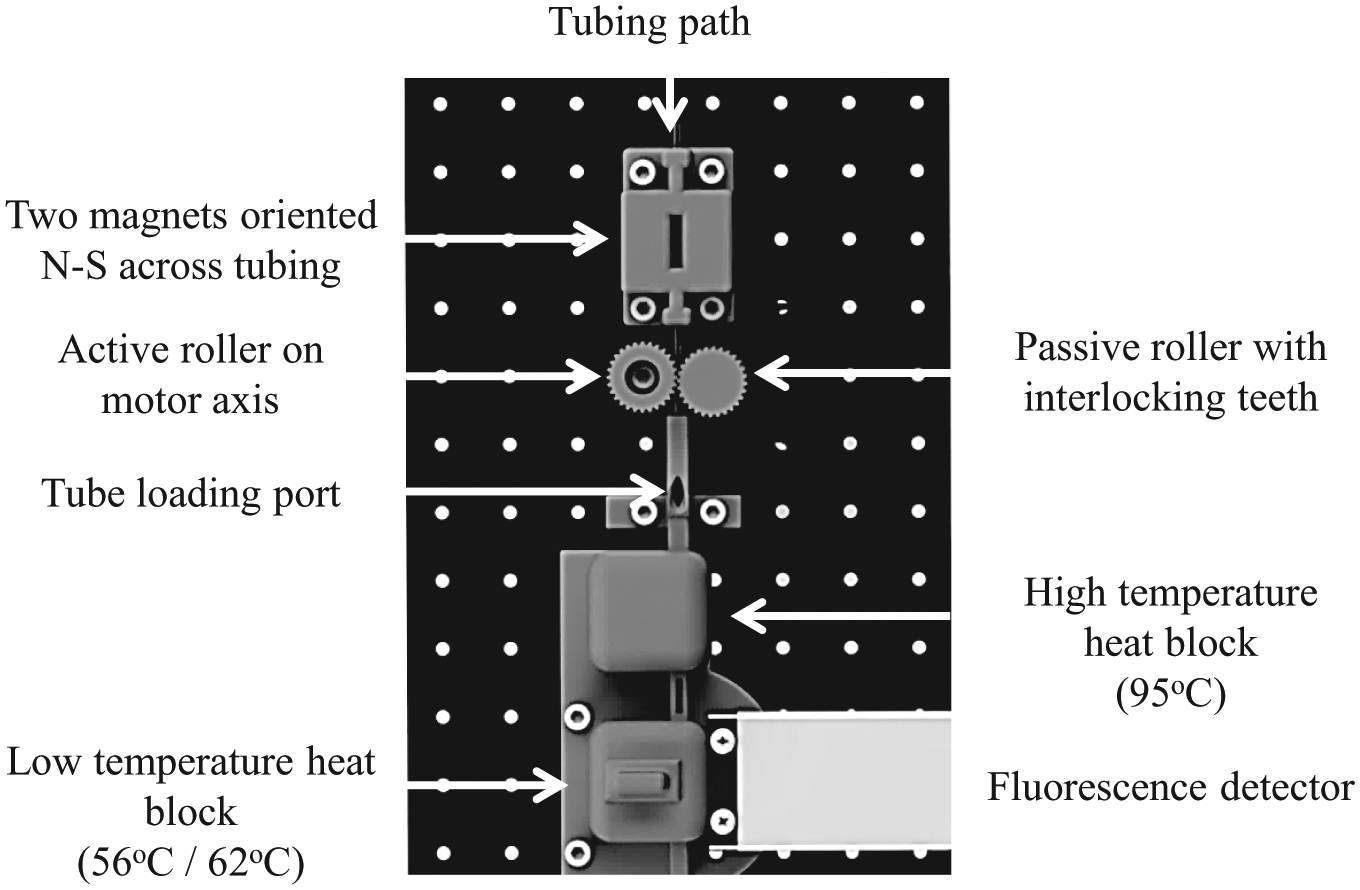
Vertical layout of 3D printed components (gray) and fluorescence detector. Tubing for integrated biomarker extraction and PCR is inserted at the tube loading port and is moved under stepper motor control past the magnets (top) for biomarker extraction then through the heat blocks and fluorescence detector (bottom) for PCR amplification.
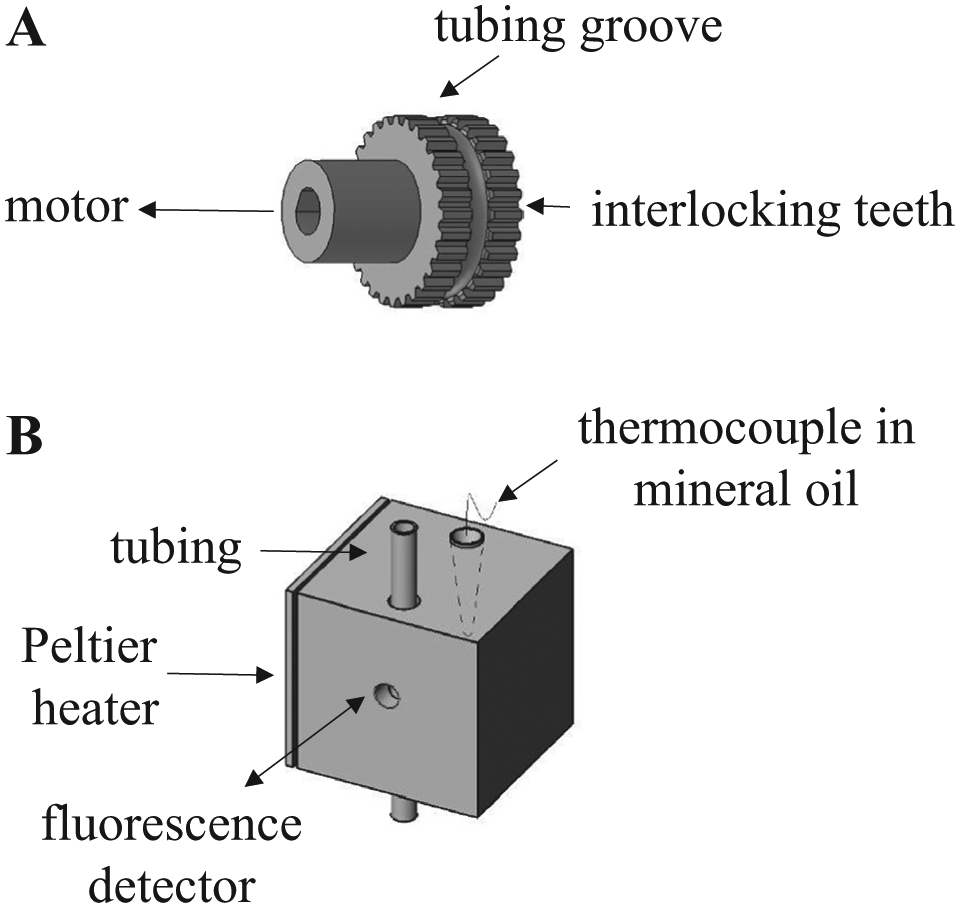
Details of the tube positioning roller and the heater/detector block. (A) Two adjacent rollers with interlocking teeth gripped the tubing and positioned it during the extraction and amplification phases of the assay. A motor actively rotated one roller, while the other roller rotated passively via interlocking teeth to position the tubing in the instrument. (B) Each copper block contained a channel for the tubing to pass through as well as a thermocouple in mineral oil to monitor the block temperature. In addition, the low-temperature block had a channel that allowed the fluorescence detector to measure the fluorescence of the PCR reaction through the wall of the transparent tubing.
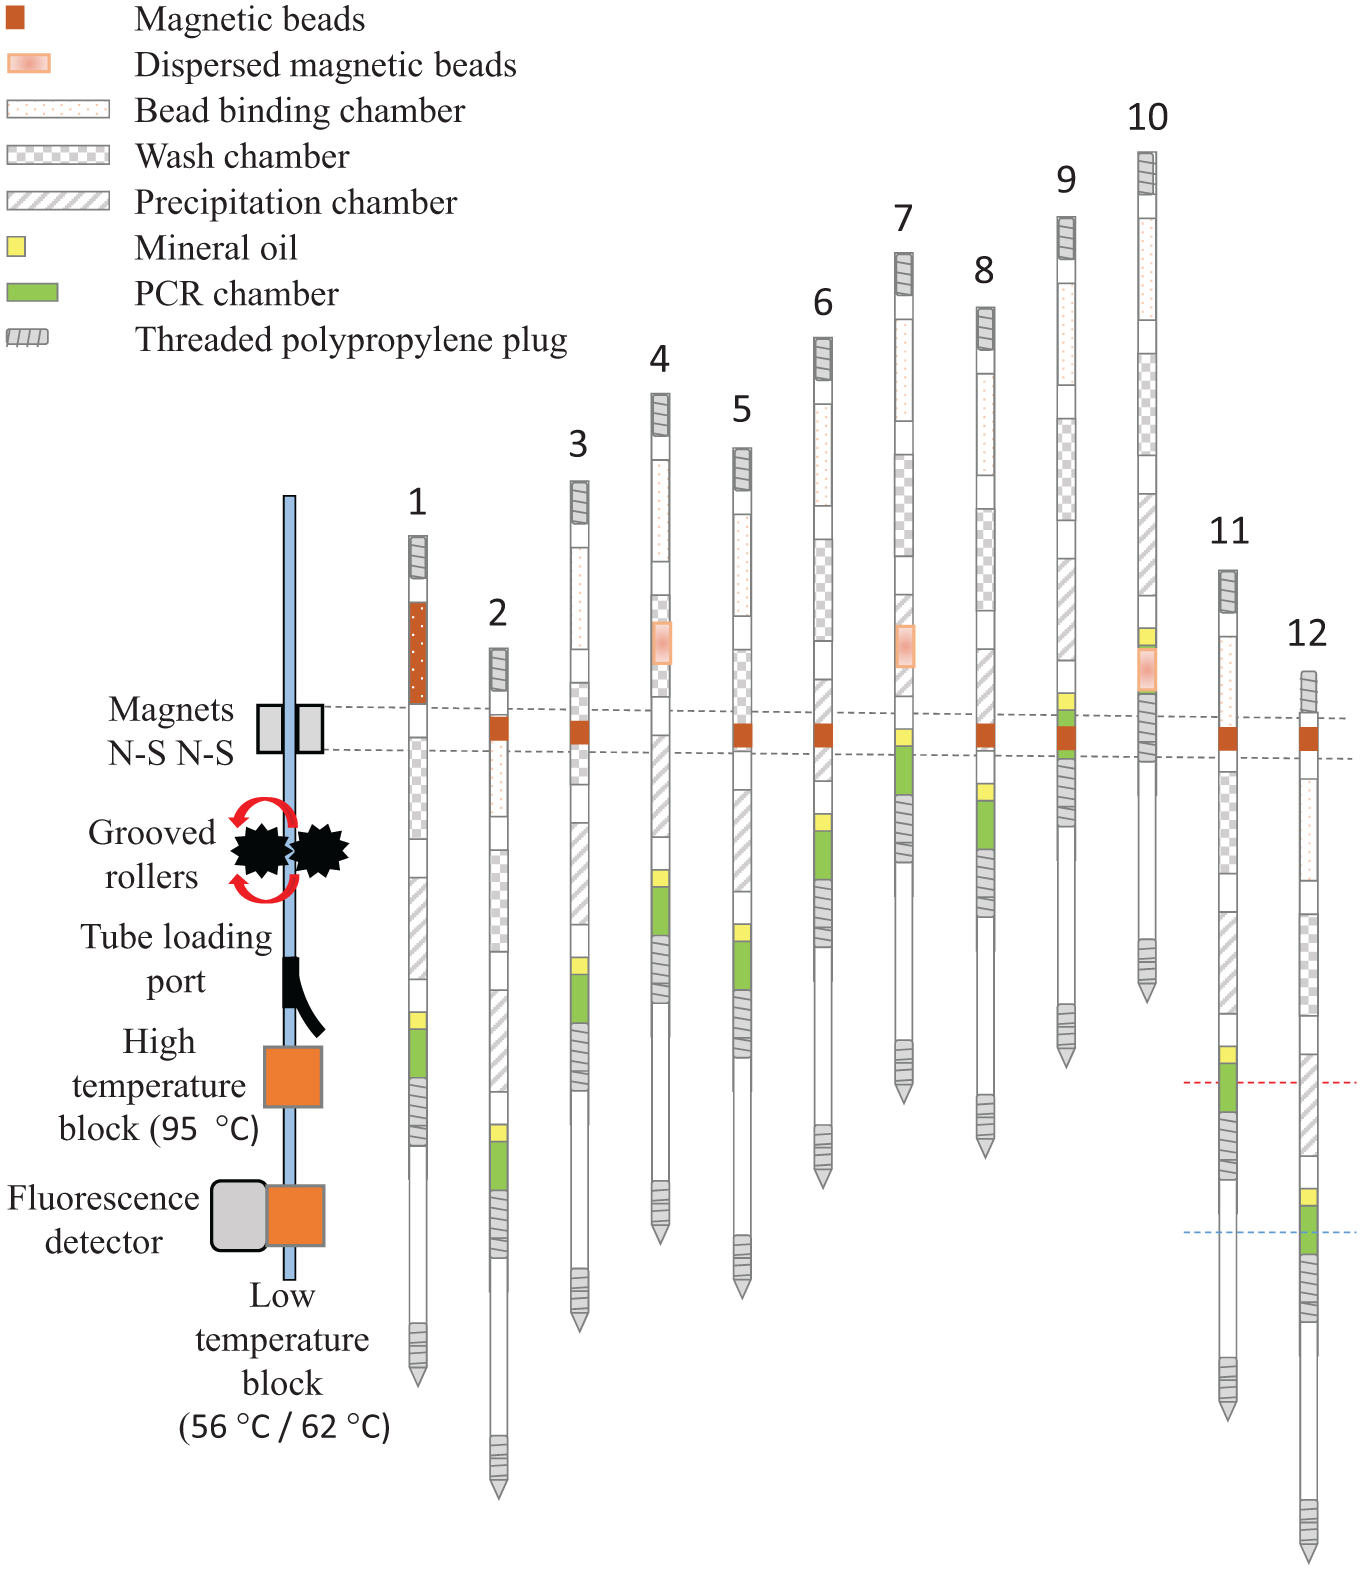
PCR movement map. Rotating grooved rollers ( Fig. 3A ) move the tubing between two magnets to transfer the beads through the three processing solutions for biomarker extraction (positions 1–10) without passing through the heat blocks. The rollers then raised the tubing leader section above the loading port before redirecting the tubing through the heat blocks and alternately positioning the tubing between the heat blocks (positions 11 and 12) for 45 cycles to perform PCR.
Heat Block Dwell Time Determination
To determine the dwell time that the reaction chamber required to reach the desired temperatures in the heat blocks, a 50 µL water chamber capped with 20 µL of mineral oil was loaded into a mock reaction length of tubing. The dynamics of the temperature were measured using a Fluke 52II thermometer and a type K thermocouple. The thermocouple was inserted inside of the tubing, and the tip of the thermocouple was placed in the water chamber. The blocks were brought to 95 °C and 62 °C for PCR amplification of TB target and to 95 °C and 56 °C for the malaria target ( Fig. 5A , C ). The tubing containing the thermocouple was loaded into the instrument, and the water chamber was cycled between the blocks (4 min in each block). The maximum rate of PCR reaction heating was 1.7 °C per second, and the maximum rate of cooling was 2.0 °C per second. These ramp rates are similar to the static chamber metal block ramp rates reported. 9 These temperature versus time curves were used to determine the dwell times at each of the temperature blocks. For amplification of TB targets, the reaction chamber dwell time chosen for the 95 °C block was 75 s and for the 62 °C block was 50 s. Similarly, for amplification of malaria targets, the reaction chamber dwell time in the 95 °C block was 75 s and in the 56 °C block was 60 s. We verified the appropriateness of these dwell time estimates for each reaction by repeating these direct temperature measurements for multiples cycles using mock reaction tubes ( Fig. 5B , D ).
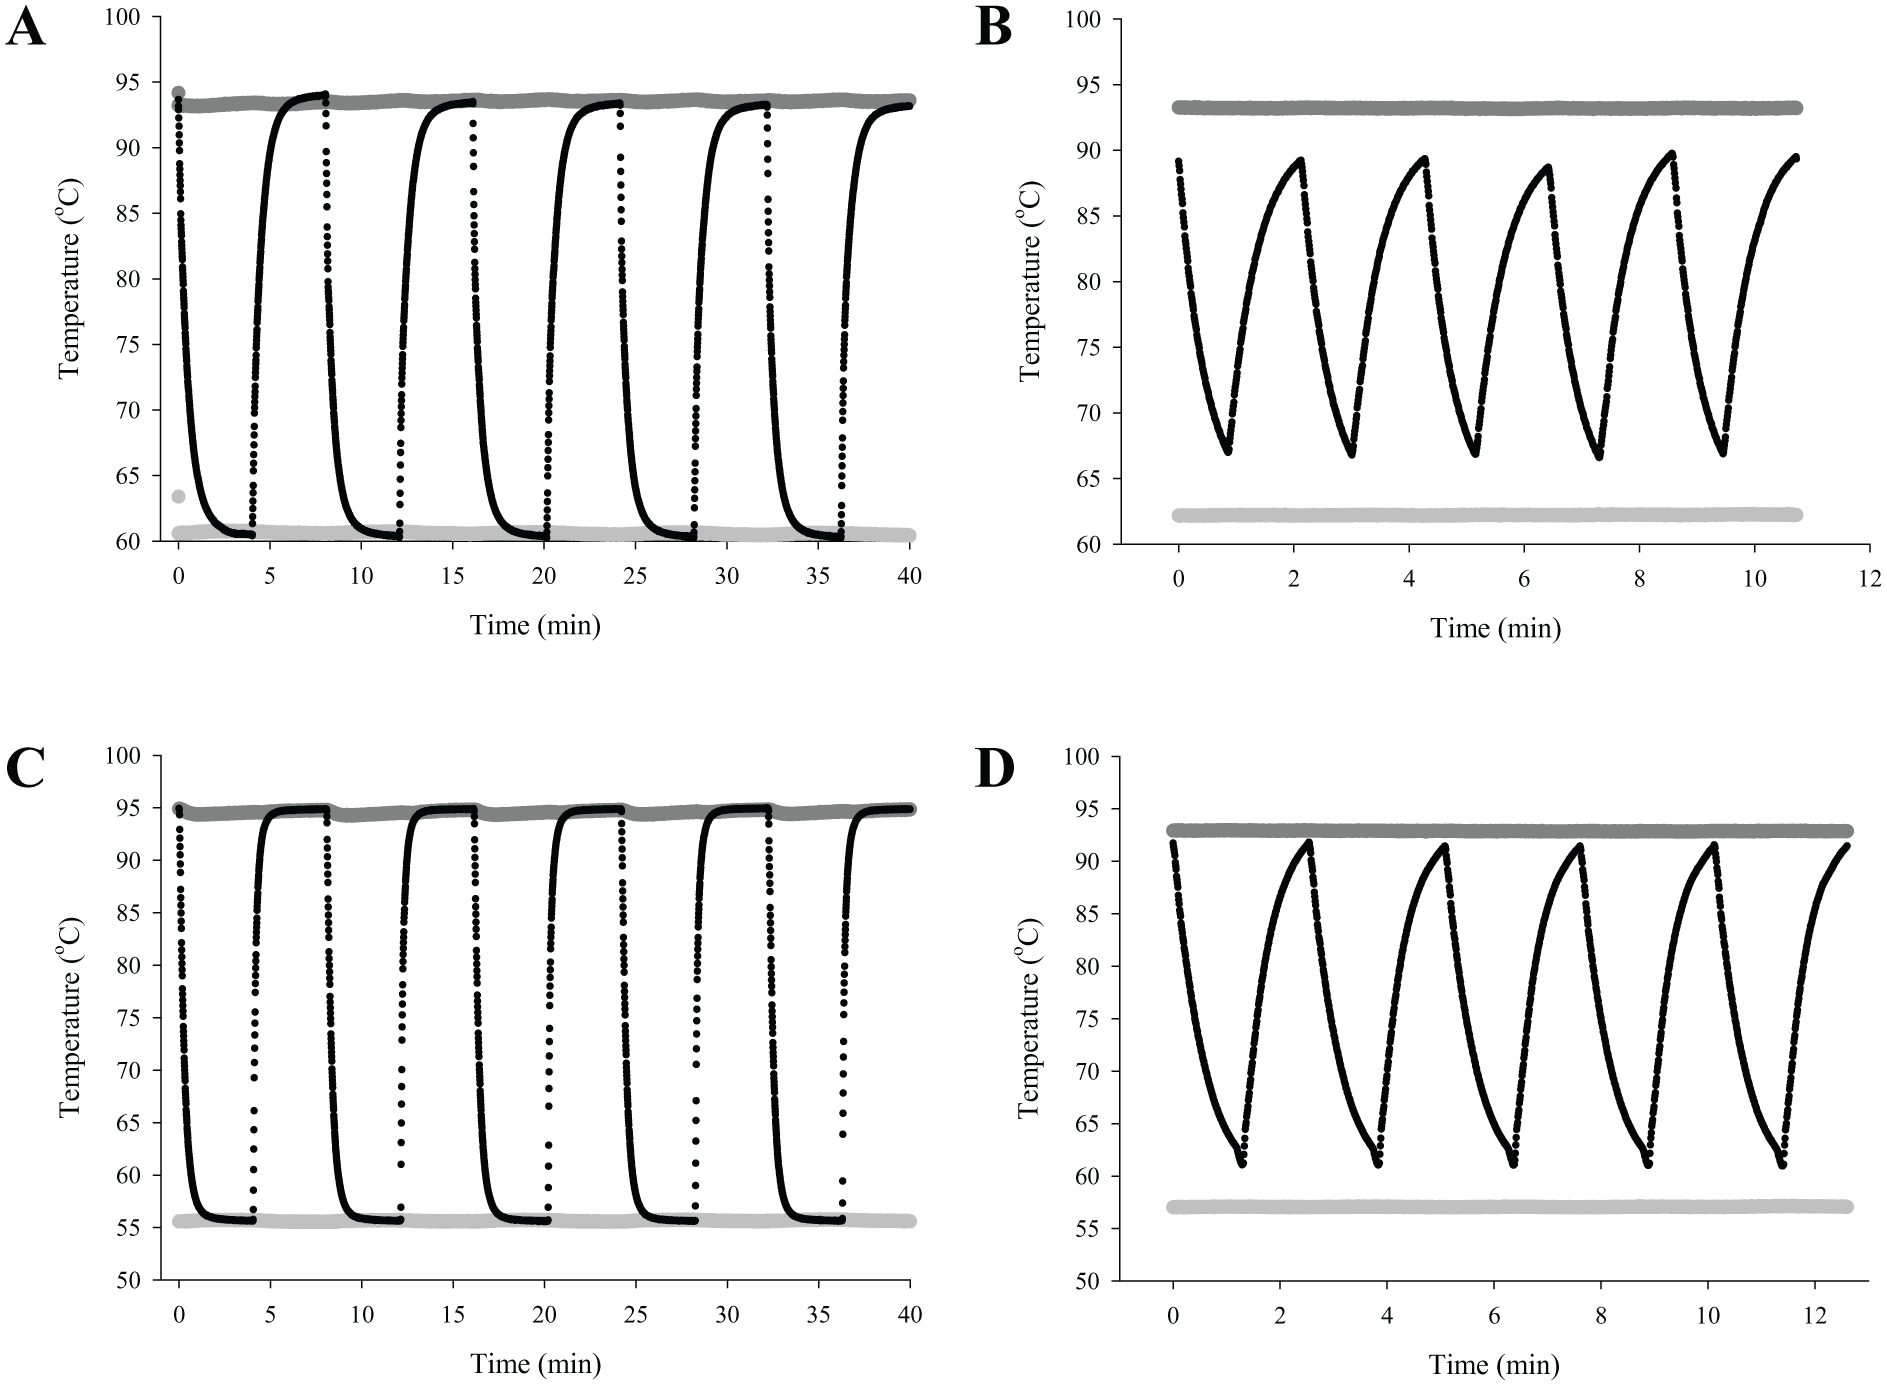
Temperature profiles in reaction tubing. Three thermocouples were used to record the temperatures in the high-temperature block (upper, dark gray), low-temperature block (lower, light gray), and in a water chamber within the tubing as it was alternately positioned (A) in the 95 °C and 62 °C blocks and (C) in the 95 °C and 56 °C blocks for 4 min each. PCR cycle times were selected based on (A) and (C), and the PCR temperature profiles were verified for amplification of (B) TB targets and (D) malaria targets.
Biomarker Extraction and Amplification
The target biomarkers were extracted by a previously described method.6,13 Briefly, the tubing was inserted into the device with the sample chamber positioned above the magnets ( Fig. 4 , position 1). The tubing was lowered to position the sample chamber between the magnets and collect the biomarker-bound magnetic beads at the edge of the chamber ( Fig. 4 , position 2). The tubing was slowly raised to transport the beads through the air valve into chamber 2 ( Fig. 4 , position 3) then quickly raised to pull the beads away from the magnets and disperse the beads within each chamber ( Fig. 4 , position 4). The procedure was repeated to move the magnetic beads from one solution to the next ( Fig. 4 , positions 5–8) until the beads with bound DNA biomarkers were delivered to the reaction chamber ( Fig. 4 , position 9).
After the beads were dispersed within the PCR solution ( Fig. 4 , position 10), the tubing was lowered in order to withdraw the beads from the PCR reaction and position the reaction chamber with extracted DNA target within the 95 °C heat block ( Fig. 4 , position 11). The PCR chamber was held in the 95 °C heat block for 90 s for polymerase activation, before it was lowered to the cooler block to begin amplification cycling ( Fig. 4 , position 12). For TB IS6110 amplification, the reaction chamber of the tubing was cycled between the 95 °C block for 75 s and the 62 °C block for 50 s for 45 cycles. For P. falciparum 18S rRNA DNA sequence amplification, the reaction chamber of the tubing was cycled between the 95 °C block for 75 s and the 56 °C block for 60 s. It took about 1 s to move the PCR reaction between the two temperature blocks.
Data Analysis
During thermal cycling, the PCR chamber was cycled between the 95 °C heat block and the low-temperature heat block set at either 56 °C or 62 °C. To maintain the simplicity of the instrument, the tube-positioning sequence and fluorescence detection were started simultaneously, and fluorescence was recorded every 3 s at the low-temperature heat block regardless of tube position. This design resulted in fluorescence measurements of leader tubing when the PCR reaction chamber was in the 95 °C block and as the PCR reaction cooled in the lower-temperature block. To calculate Ct from the fluorescence data file, the maximum fluorescence during each cycle was identified. The first 13 min measured the constant fluorescence background signal ( Fig. 6 ). After 13 min, the PCR reaction chamber entered the lower-temperature block, and we observed an increase in fluorescence as the temperature of the reaction mixture cooled from its initial temperature of about 95 °C to the primer anneal temperature, either 56 °C or 62 °C. Because our PCR reaction contains an intercalating dye, when the reaction chamber was positioned within the low-temperature block, this increase in fluorescence within each cycle is due to annealing of DNA strands during cooling ( Fig. 6 , inset). As the rate of cooling decreased, the rate of annealing decreased. Therefore, the increase in fluorescence between data points decreased as the maximum fluorescence was approached. The maximum fluorescence within a cycle was determined by comparing each data point to those immediately before and after ( Fig. 6 ). Some points were identified as outliers if the increase in fluorescence between the maximum point and the previous data point was greater than the increase between the previous two points, and these were not included in further analysis. For example, the highest data point shown in the inset was excluded. The increase in maximum fluorescence between the cycles was presumed to be due to polymerase amplification and product formation. Once the intracycle peaks were identified ( Fig. 6 , gray), the fluorescence values were plotted as a function of cycle number, starting at the end of the extraction phase of the assay. Background fluorescence present in the first five cycles was averaged and subtracted. Then fluorescence versus cycle number was plotted on a log scale. The cycle threshold was determined from the linear portion of the log plot.
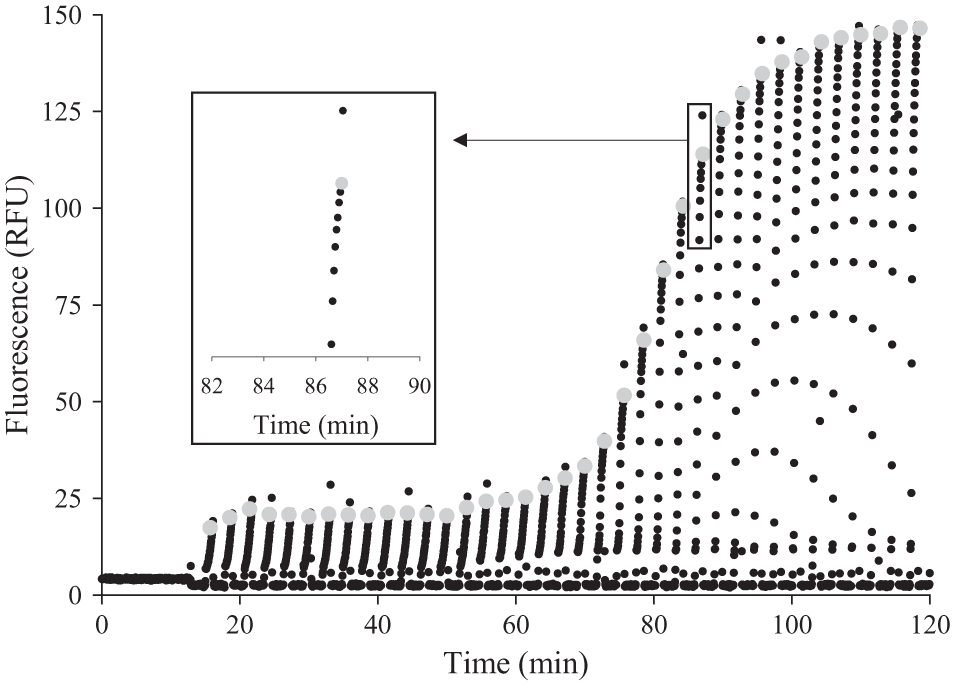
Fluorescence data collected at the low-temperature heat block at 3 s intervals throughout the assay. During extraction, 0 to 13 min, the tube does not pass in front of the detector. Gray circles indicate the fluorescence from each cycle used in cycle threshold analysis. The inset shows an increase in fluorescence within a cycle and selection of peak cycle fluorescence eliminating outlier data points.
The average Ct was calculated from three independent trials. Statistical significance between amplification times of target and control samples was determined by t test. A p value of 5% was used to determine significant differences in Ct.
PCR efficiency was calculated for the integrated instrument and Rotor-Gene Q. Background fluorescence was subtracted, and the fluorescence at each cycle was divided by the fluorescence of the previous cycle during the geometric amplification phase of the reaction. 15
Results and Discussion
The overall goal of the approach described here is a simple PCR instrument design with reproducible PCR reaction performance. We showed that this approach can be used to extract and amplify DNA from a simple buffer solution and a more complex blood sample. Amplification of 140 bp fragments of IS6110 DNA extracted from TE buffer resulted in a mean cycle threshold of 25.5 ± 1.5 cycles (n = 4). Negative control samples containing only TE buffer crossed the amplification threshold significantly later at 34.0 ± 2.6 cycles (n = 3). Having shown that we could achieve extraction of target DNA spiked into a simple buffer matrix and amplification of the extracted target within the extraction tubing, we moved to a more complex sample matrix. We were able to extract P. falciparum DNA from malaria-infected human blood cultures provided by PATH and amplify the target by PCR. The average cycle threshold for 1% parasitemia samples was 24.7 ± 1.5 cycles (n = 3), which was significantly different from the negative samples, 31.5 ± 2.1 cycles (n = 3).
Instead of heating and cooling the PCR reaction at a fixed location, we took a different approach and physically moved the reaction chamber between two fixed temperature blocks. In this approach, the temperatures at the surface of the PCR reaction chamber are alternately set to match the temperatures required during each of the phases of the PCR reaction. After 75 s in the 95 °C block, the temperature in the reaction tubing was within 2 °C of the target temperature ( Fig. 5C , D ). Similarly, after 50 s in the 62 °C block, the reaction tubing temperature was within 2 °C of the target block setting for the annealing and extension phase of the TB reaction ( Fig. 5C ). After 60 s, the PCR reaction was within 2 °C of the 56 °C target temperature for the malaria target amplification ( Fig. 5D ). These selected temperatures were well within the range of the annealing and denaturing temperatures over which Ct was invariant as determined by a block gradient PCR machine. Using 5 × 10⁶ copies of IS6110 as TB target and annealing temperatures ranging from 51 to 74 °C, the average Ct was constant at 16.3, and there was no change in product melt temperature. For 5 × 10⁶ copies of synthetic malaria target, the average Ct was 24 for annealing temperatures ranging from 55 to 65 °C, and there was no change in product melt temperature. As shown in Figure 5A and C , longer dwell times produced slightly higher reaction temperatures, but the temperature changed much more slowly as the reaction temperature approached the block temperature. Therefore, these optimal times were used for PCR, resulting in cycle times of 2.1 min for TB target amplification ( Fig. 5B ) and 2.8 min for malaria target amplification ( Fig. 5D ). With this design, it is not possible to achieve reaction temperatures that are lower than the low-temperature set point or higher than the high-temperature set point. Thus, this design both minimizes nonspecific primer binding during the lower temperature phase of the reaction and limits degradation of the polymerase during the high-temperature phase of the reaction. Setting the time for each of the reaction phases to longer than the time for heat transfer achieves reproducible cycling without requiring careful dynamic calibration or monitoring of the reaction solution.
More complex instruments adopt some version of higher-temperature gradients to reduce the overall reaction time. Although not the main focus of our study, a comparison of the overall reaction time for parallel reactions run in a Qiagen Rotor-Gene Q thermal cycler showed that this was indeed the case for this instrument. The thermocouple setup used to determine the dwell times inside of the copper blocks was placed inside of the Rotor-Gene Q housing and confirmed that the instrument reached temperatures higher and lower than the desired reaction temperatures. For the malaria studies in which the PCR protocol temperatures were set at 95 °C and 56 °C, the actual air temperatures peaked at 126 °C during the heating phase and at 44 °C during the cooling phase. This increased the speed of the reactions. The 25 cycle PCR reaction in the Rotor-Gene Q took a total of about 42 min, and 25 cycles in the fixed temperature block design was about 61 min. Reactions on the Rotor-Gene Q were about 30% shorter. In this sophisticated, state-of-the-art instrument, a careful calibration system is used to guard against the effects of overheating or overcooling of the PCR reaction. This approach could be incorporated in the fixed temperature block instrument described here, but we chose not to, primarily because this builds in another potential failure mode. In settings where robust performance is a high priority, longer cycle times seem like a reasonable tradeoff to eliminate this potential failure.
In summary, the heating and cooling aspects of the integrated instrument are simpler than most commercial instruments. In our design, two heat blocks are held at constant, preequilibrated temperatures, and the PCR reaction chamber is alternately positioned within them by simple motor motion. In commercial instruments, to reduce overall cycle times, the temperature around the PCR reaction chamber undergoes carefully calibrated changes to overshoot and undershoot the two desired reaction temperatures. Although many commercial instruments have a shorter reaction, the reduced thermal complexity of our fixed temperature design may be a more suitable alternative for low-resource settings.
Parallel to experiments in the integrated instrument, malaria target DNA was extracted from malaria blood cultures with a commercial DNA extraction kit followed by PCR in a Qiagen Rotor-Gene Q thermal cycler. Using a DNeasy Blood and Tissue Kit (Qiagen), malaria target was extracted from blood in about 20 min. In the Rotor-Gene Q, after a 1 min hold at 95 °C, the reaction was cycled for 15 s at 95 °C and 30 s at 62 °C. Including temperature transitions, the actual cycle time was 1.65 min. Allowing 25 cycles for a positive sample to amplify resulted in a total assay time of 62.25 min. In the integrated biomarker extraction and fixed temperature amplification instrument, malaria samples were prepared in 10 min, target extraction was accomplished in 13 min, followed by a 90 s hold at the 95 °C heat block, and 25 cycles of 2.8 min each results in a total assay time of 94.5 min. The simple fixed temperature design requires increased cycle times and results in an increase in total assay time.
Comparison of PCR efficiency in a Rotor-Gene Q and the integrated extraction instrument showed that they performed similarly. P. falciparum DNA was extracted from 1% parasitemia samples in the integrated instrument. The extracted DNA was then amplified in the extraction tubing in the integrated instrument ( Fig. 7 , black) or removed from the tubing and amplified in the Rotor-Gene Q ( Fig. 7 , white). Target amplified in the integrated instrument in 24.7 ± 1.5 cycles (n = 3) and in the Rotor-Gene Q in 25.7 ± 2.3 cycles (n = 3). The efficiency in the integrated instrument was 1.45 ± 0.02 (n = 3), and the efficiency in the Rotor-Gene Q was 1.53 ± 0.02 (n = 3). Buffer salts and other contaminants carried into the PCR reaction mixture could be responsible for the decreased PCR efficiency observed with DNA target extracted from blood cultures. Synthetic DNA target in TE buffer amplified in the Rotor-Gene Q yielded an efficiency of 1.91 ± 0.03 (n = 3), close to the ideal doubling of PCR amplification. To increase the PCR efficiency of the extracted target, adjustments could be made to the extraction phase and, possibly, in the cycling parameters themselves. Still, reproducible results were achieved with this simple PCR instrumentation design.
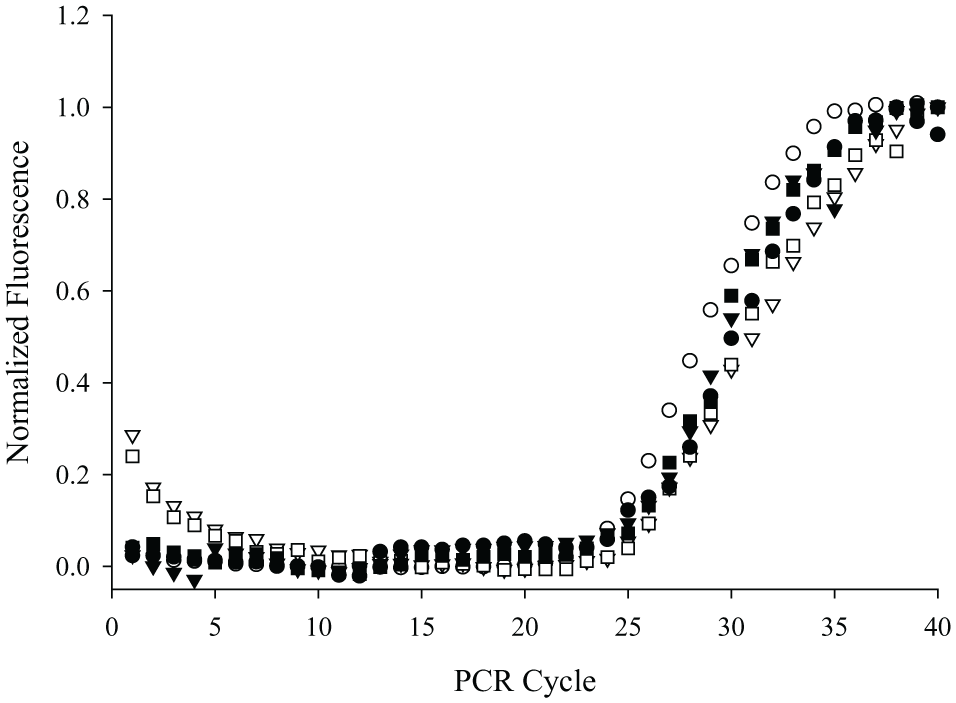
PCR reaction profiles for amplification of P. falciparum target DNA extracted in the integrated device. Extracted DNA was eluted into the PCR reaction mixture and amplified in the Rotor-Gene Q (white) or in the integrated device (black). The PCR efficiency in the integrated extraction instrument is comparable to a Rotor-Gene Q as shown by the reaction profiles.
The main disadvantage to this approach is that the overall PCR reaction time is longer, but with design improvements, we expect much shorter times could also be achieved. For example, one of the limitations of the current design is the poor contact between the copper blocks and the PCR reaction chamber wall of the tubing. Because the tubing is repositioned during each phase of the PCR reaction, the holes in the copper blocks are drilled to a diameter somewhat larger than the tubing to allow easy passage of the tubing during repositioning. We found that the joints between segments of the tubing created some slight bulging in tube diameter ( Fig. 1 ), and the smallest hole that worked effectively was 0.393 cm in diameter. This left a small air space of about 0.073 cm between the surface of the copper block and the outer surface of the tube. The thermal conductivity of air is at least 10 times less than the tubing material and the water in the PCR reaction and thousands of times less than the copper block. In our previous design incorporating isothermal amplification, this had little impact on the overall time for amplification, because only a steady state needed to be achieved within the reaction mixture. However, for PCR amplification, this thin layer of air is the rate-limiting feature for thermal transfer, and improvements that reduce the thickness of this layer will significantly increase the rate of thermal transfer and lower the overall time of the PCR reaction. Reducing the diameter of the hole in the copper block is one method to achieve this, but to reduce the thermal resistance of the air layer to the range of the FEP tubing would require that the hole in the copper block be only about 1% larger than the outer diameter of the tubing, about 30 µm in this case. 16 This is probably not feasible, because it would likely significantly increase the drag on the tubing as it moved through the blocks and require a better method of coupling the grooved rollers to the smooth FEP tubing. Feasible alternatives include flexible, vertical wire ribs inside of the copper blocks or a clamping design that brings the copper block into complete contact only when the tube is not moving.
The design of the tube itself could also be changed to shorten the overall PCR reaction time. For example, the characteristic time for thermal diffusion to occur is given by (characteristic length)2/thermal diffusivity. 16 This describes the relative ease of energy transfer in similar systems in which a shorter characteristic time correlates with more rapid energy transfer. In a typical tapered round PCR reaction tube, such as the Rotor-Gene Q tubes, the characteristic length, defined here as the shortest distance between the center of the reaction and the outside of the tube, is in the millimeter range, approximately 0.2 cm. The thermal diffusivity of water is about 0.00143 cm2/s and the tube material (polypropylene) is about 0.00096 cm2/s. Neglecting this small difference in thermal diffusivity, to a first approximation, the characteristic time for thermal diffusion is about (0.2)2/(0.00143) or 28 s. The FEP tubing used in this report has an overall diameter of 1/8 in, so the characteristic thermal diffusion distance is about 0.16 cm. Assuming similar heat transfer diffusivities between FEP (0.00137 cm2/s) and water, this yields a similar characteristic time for thermal diffusion of about 18 s. The similarities in thermal diffusivities between water and the tube material suggests that using a thinner tube wall would reduce heating and cooling times but not by very much.
Tube geometry would likely have a bigger impact on the time for heat transfer, because heat transfer is proportional to the cross-sectional area available for heat transfer. Assuming a reaction volume of 25 µL, FEP tubing with a diameter of 1/8 in would have approximately 30 mm2 of surface area available for heat transfer. By contrast, a flat rectangular tube, such as that used in the Cepheid Smart Cycler, has approximately 50 mm2 of surface area, which would increase the rate of heat flow by greater than 60%. This calculation illustrates that for the same sample volume, one method of shortening the overall PCR cycle time is adopting a different tubing geometry. This more favorable geometry could be applied to the prototype instrument to achieve faster overall PCR times without risk of overshooting the required PCR target temperatures.
Inexpensive components and a simple design make this instrument well-suited for low-resource environments. The block temperatures are set before the experiment and are not changed during the experiment. Motor motion and fluorescence detection are started simultaneously. The amplification and detection stages follow the extraction stage in a linear design that reduces hands-on time by a technician and the need for additional equipment. The fixed temperature design ensures that the temperatures in the tubing do not exceed the working range of the PCR reaction. Eliminating the need to monitor the temperature altogether would further simplify the design. To our knowledge, this demonstration of target biomarker extraction and amplification by alternate positioning at two fixed temperature stations is the first of its kind in PCR instrumentation. This approach integrates extraction, amplification, and detection of pathogen DNA in a simple design with potential for use as a low-resource diagnostic tool.
Footnotes
Acknowledgements
Thank you to Megan Elizabeth Pask for logistical support, Jared Haselton for software development, Mitch Lutz for gear design, and Austin Hardcastle for Rotor-Gene Q temperature measurements.
Declaration of Conflicting Interests
The authors declared no potential conflicts of interest with respect to the research, authorship, and/or publication of this article.
Funding
The authors disclosed receipt of the following financial support for the research, authorship, and/or publication of this article: This work was funded in part by a grant from the Bill and Melinda Gates Foundation, Opp 1028749.