
Abstract
Cancer therapy is increasingly becoming individualized, but there are also big gaps between the molecular knowledge of individual cancers we can generate today and what can be applied in the clinic. In an attempt to bridge this knowledge gap between cancer genetic and molecular profiling and clinically useful information, an individualized systems medicine program has been established at the Institute for Molecular Medicine Finland (FIMM), University of Helsinki, and the Helsinki University Hospital. Central to this program is drug sensitivity and resistance testing (DSRT), in which responses of primary cancer cells to a comprehensive clinical oncology and signal transduction drug collection are monitored. The drug sensitivity information is used with molecular profiling to establish hypotheses on individual cancer-selective targeting drug combinations and their predictive biomarkers, which can be explored in the clinic. Here, we describe how acoustic droplet ejection is enabling DSRT in our cancer individualized systems medicine program to (1) generate consistent but configurable assay-ready plates and determine how this affects data quality, (2) flexibly prepare drug combination testing plates, (3) dispense reagents and cells to the assay plates, and (4) perform ultra-miniaturized follow-up assays on the cells from DSRT plates.
Keywords
Introduction
For decades, researchers have used both cell lines and primary cancer cells in vitro to test the “individualized” activity of anticancer drugs and, thereby, try to predict which cancer patient may respond to one drug but not another. These efforts have included the establishment of the very well-known NCI-60 cell line drug testing platform, as well as other large-scale cell line panels for testing.1,2 However, the clinical translation of such in vitro/ex vivo chemosensitivity-driven personalized therapy approaches has historically proven challenging. 3 The difficulty in translating these studies is likely due, in part, to the fact that they primarily have been focused on conventional (cytotoxic) chemotherapy, whose activity in vitro is dependent on growth rates and cellular stress, characteristics that do not translate well to the in vivo situation. The translatability of in vitro/ex vivo viability-based drug responses to conventional cytotoxic chemotherapy could be further complicated by the possibility that the in vivo mechanism of action of these drugs may not be primarily linked to broad cell growth or toxicity effects, 4 which traditionally has been the drug response parameter studied.
The intense focus on development of oncogenic signaling-targeting agents in oncology drug discovery over the last couple of decades has, on the other hand, resulted in an extensive “toolbox” of approved and investigational agents that target what is expected to be more cancer-specific signals in the cells. Our results suggest that responses to these targeted agents are often easier to translate from in vitro/ex vivo settings to the clinic. 5 At the same time, the emergence of next-generation sequencing and the capability of accurately and cost-efficiently analyzing cancer genomes and transcriptomes have sparked massive initiatives of sequencing cancer genomes (such as The Cancer Genome Atlas, http://cancergenome.nih.gov; the International Cancer Genome Consortium, https://icgc.org/), which have generated tremendous information about the genomic characteristics of cancer. Together, these developments have driven a revival of drug sensitivity testing with the idea that we now effectively can identify genomic markers that predict personalized therapies.6–8 However, because links between genomic alterations and drug responses in most cases are considerably more complicated than the presence of “mutation X” leads to sensitivity to “drug Y,” these efforts are still far away from having a significant impact in the clinic. We believe that to effectively translate the rapidly expanding knowledge about cancer genomics to the clinic, integrated efforts are needed in which links between comprehensive molecular profiling, drug sensitivity testing, and clinical translation are studied on the same patient cases.
To address this challenge, a cancer individualized systems medicine program was started between the Institute for Molecular Medicine Finland (FIMM) at the University of Helsinki and the Helsinki University Central Hospital Comprehensive Cancer Center, initially focusing on hematological malignancies. 5 The goal of the consortium was to establish a system in which the detailed molecular and phenotypic studies of the cells of individual cancer patients could be used to identify therapeutic strategies that could guide the personalized treatment of the patient at hand. The system was further intended to generate a fundamental novel understanding about the biology and evolution of the cancers studied and, thereby, strategies for how future patients with cancers of similar molecular background could be treated. A core component of the individualized systems medicine program was the establishment of a robust and standardized chemosensitivity profiling platform that we call drug sensitivity and resistance testing (DSRT). The need for highly standardized and quality-controlled drug testing was emphasized by recent reports of severe inconsistencies between different pharmacogenomic data sets, likely emerging from different operational, detection, and analysis platforms.9–10 As a robust and simple primary end point measure, we assessed drug sensitivities using an algorithmic solution that is derived from an area under the dose response curve that we call the drug sensitivity score (DSS). 11 The DSS measure was shown to be more robust than commonly used parameters such as half-maximal response concentrations and the direct area under the dose response curve. Furthermore, differential DSS, in which patient DSS values are compared to healthy control DSS values, indicates which drugs are selectively effective against the patient’s cancer cells. The DSRT platform 5 has been used with hundreds of cancer patient samples to give clinicians information about potentially effective personalized cancer therapies and identified unexpected opportunities of repurposing and expanded uses of approved and investigational drugs.5,12 Here, we describe the technical aspects of the DSRT platform and emerging developments to generate more and detailed data out of small amounts of primary cell material using acoustic droplet ejection (ADE) for multiplexing and ultra-miniaturization.
ADE in Drug Sensitivity Testing
Acoustics Instrumentation at FIMM
At the FIMM High Throughput Biomedicine Unit, a Labcyte Access robotic system is used for creating assay plates with chemicals and/or siRNAs, as well as other low-volume ADE-dispensing applications ( Fig. 1 ). Components connected to this automation system are a Labcyte Echo 550 acoustic dispenser (2.5 nL droplet) with Screener 2 and Omics 2 calibration, a Labcyte Echo 525 acoustic dispenser (25 nL droplet) with Omics 1 calibration (Labcyte, Inc., Sunnyvale, CA), an XPeel plate peeler (Brooks Automation, Chelmsford, MA), a PlateLoc plate sealer (Agilent Technologies, Santa Clara, CA), a V-spin centrifuge (Agilent Technologies), and a Deerac LX bulk filler with four liquid channels (Labcyte, Inc.).
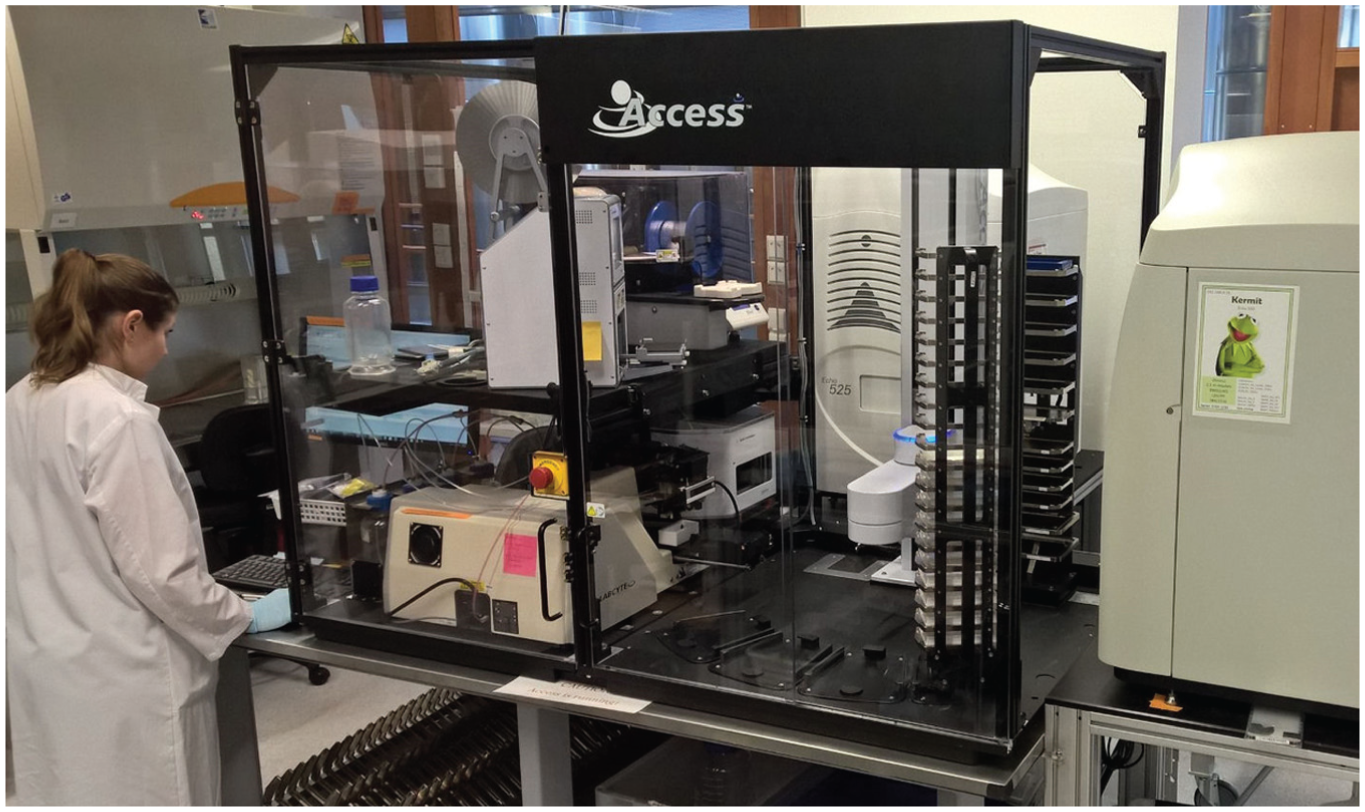
Labcyte Access system at the Institute for Molecular Medicine Finland (FIMM).
Compound Handling
Compounds used for the individualized systems medicine program drug sensitivity testing at FIMM are by default dissolved in DMSO to a 1000× stock concentration (in relation to highest tested concentration). In cases in which the compounds are not soluble or stable in DMSO, water is used to dissolve them. Each compound in the collection is tested at a 10,000-fold concentration range centered on a relevant cellular on-target concentration, and the stock concentration therefore varies from compound to compound; the most commonly tested range is 1-10,000 nM 5 . Therefore, from here on when concentrations are described, they refer to setting up the 1-10,000 nM concentration testing range, unless otherwise specified. Master stocks are stored in tube racks under nitrogen gas at room temperature (StoragePod system; Roylan Developments Ltd, Leatherhead, UK). To create a working set of compounds, they are pipetted manually on deep-well 384-well plates and then split to acoustic-grade daughter plates by automated pipetting. Dilutions are made by acoustic dispensing from plate to plate. A five-point log10-dose response curve can be achieved with three source plate concentrations (10 mM, 1 mM, and 10 µM; Fig. 2 ) and a nine-point half-log curve with four (10 mM, 1 mM, 100 µM, and 10 µM). For 1536-well assay plates, a 1 µM source concentration is also needed. Transfer volumes are 2.5 or 25 nL for 25 µL assay volume on a 384-well plate, resulting in a maximal DMSO concentration of 0.1%. For a 1536-well plate, transfer volumes are 5 or 15 nL for an assay volume of 4 µL, resulting in a maximal DMSO concentration of 0.38%.
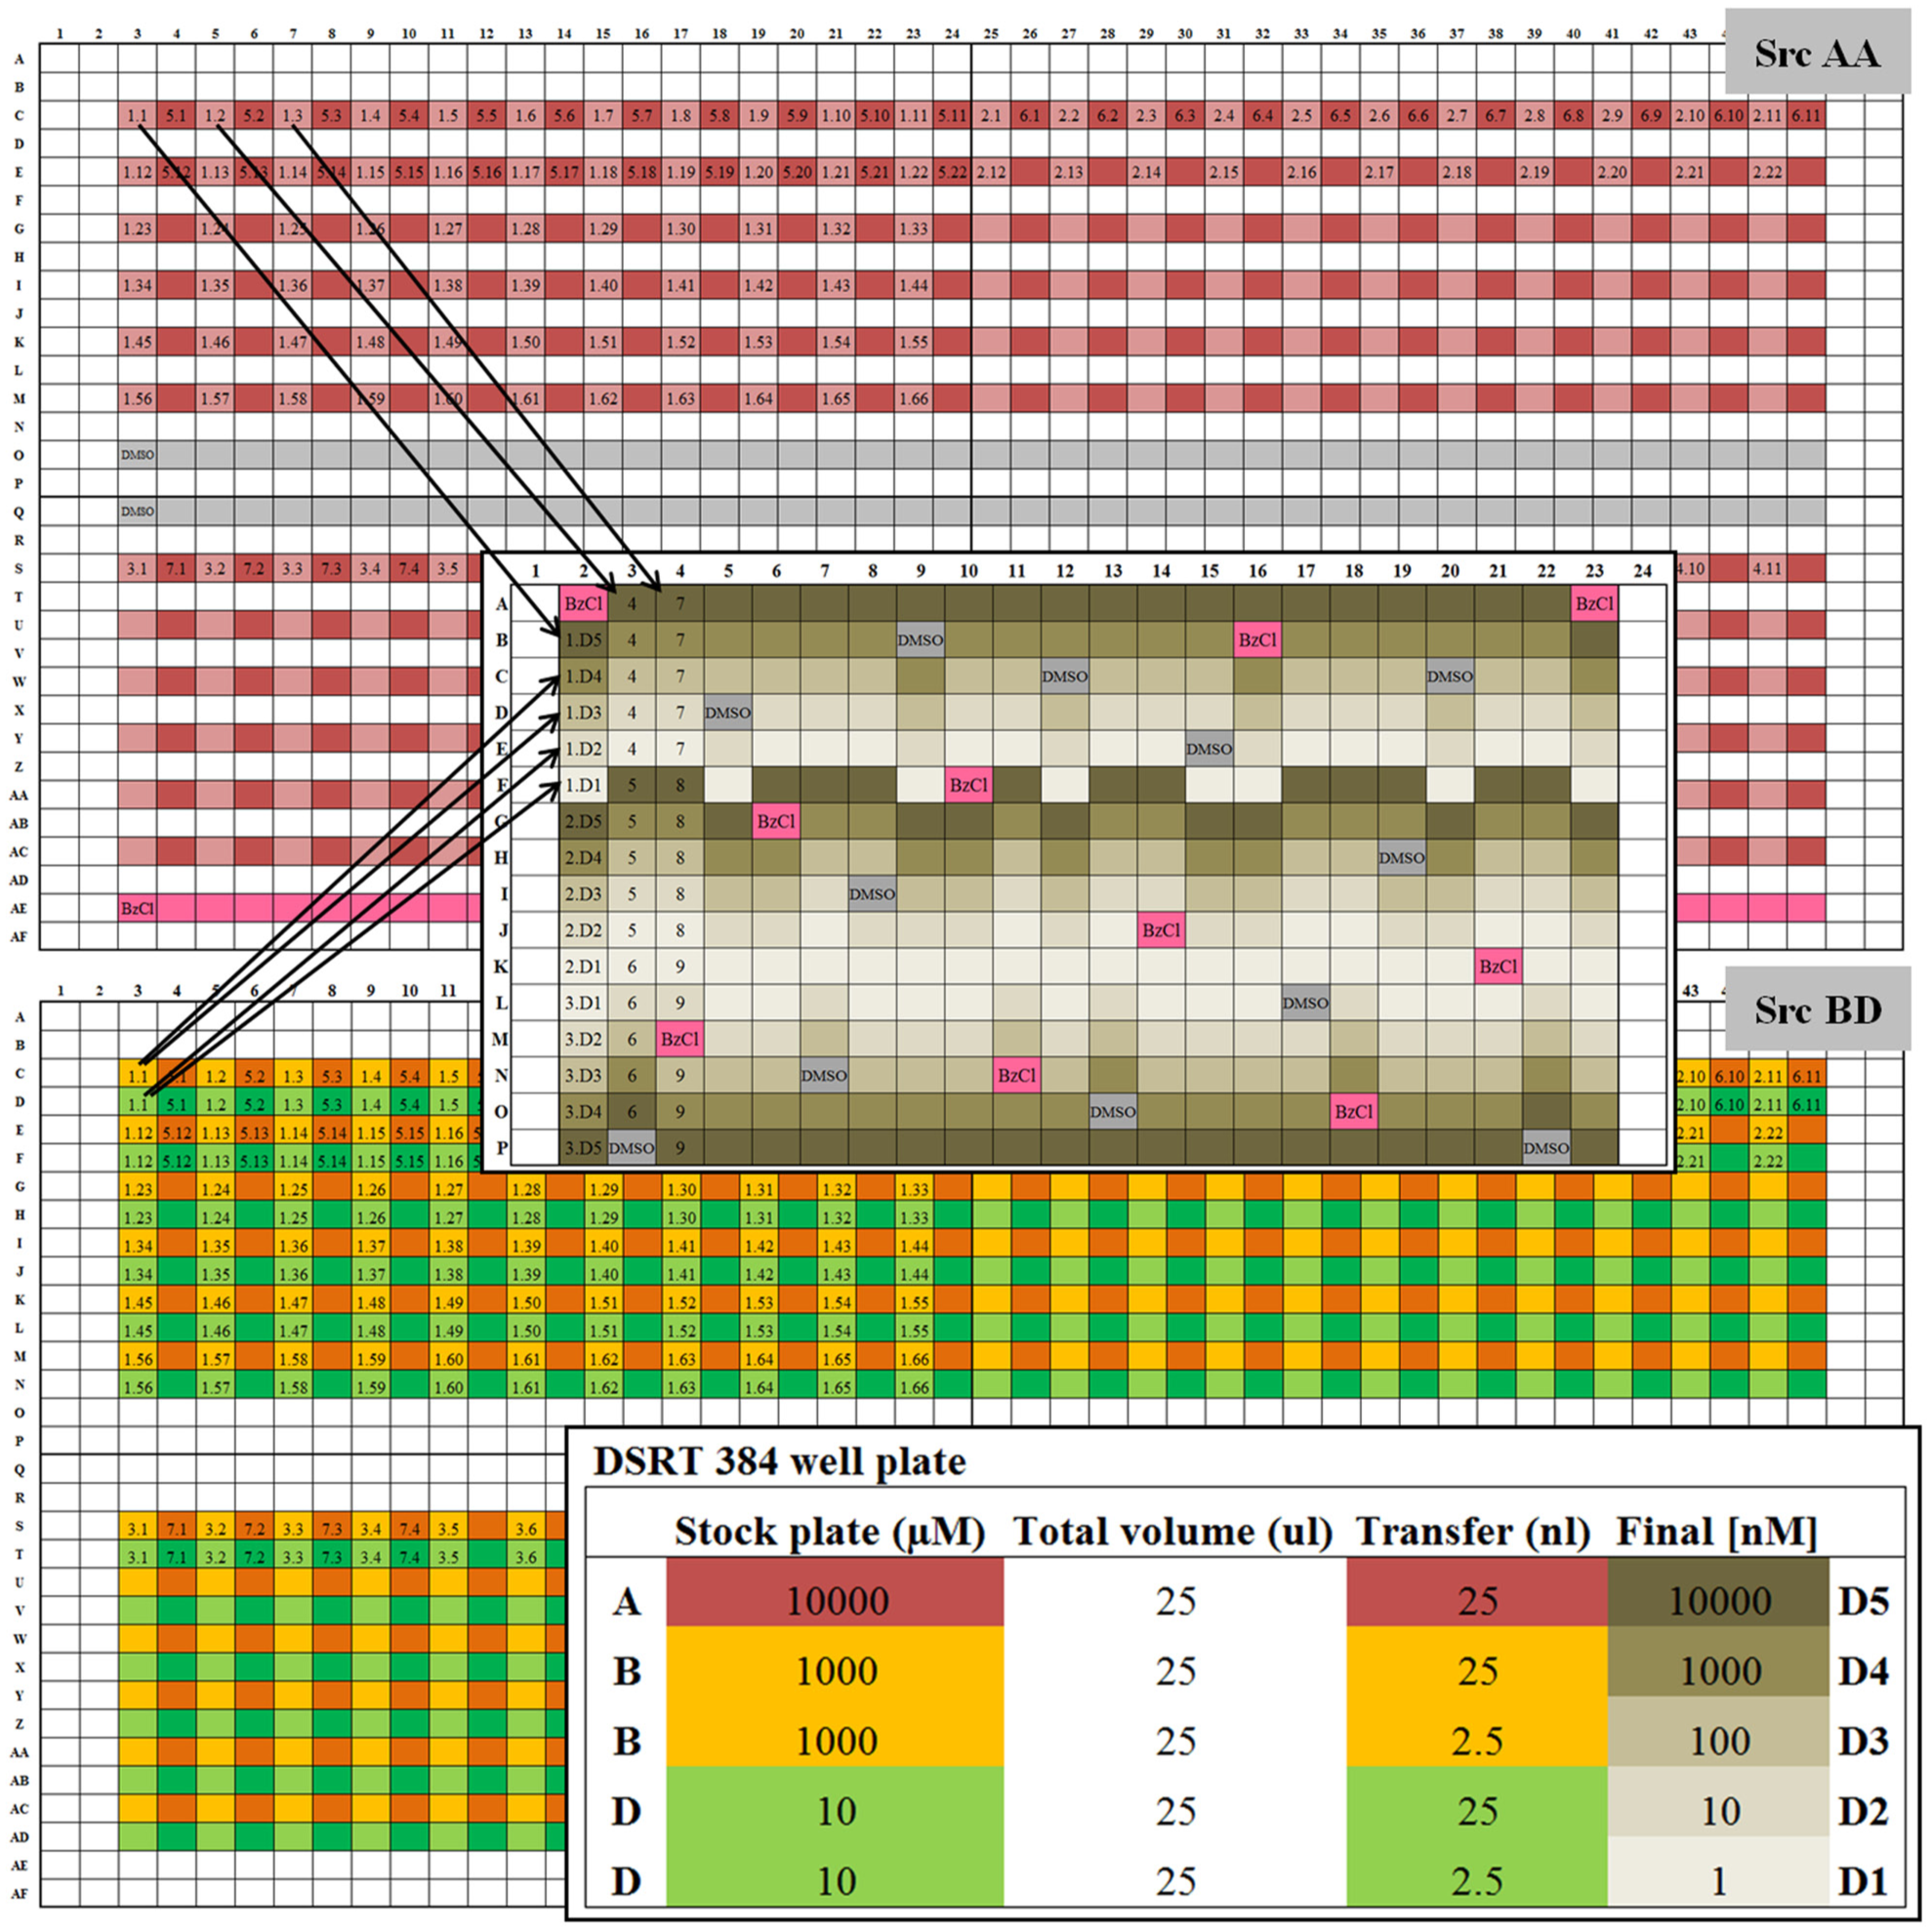
Design of compound source plates and dispensing strategy into a 384-well assay plate. All 461 compounds fit on one 1536 source plate. The two dilutions (
Small-volume source plates (384- and 1536-well low-dead-volume plates) are used for standard plating of all compounds in the collection. Hydration of DMSO on the source plates can be more easily controlled on the small-volume plates than on standard plates. Standard-volume polypropylene plates are used for hit picking, combinations, and custom drug plating, as the transfer volumes from individual wells are higher. To store, source plates are heat sealed under nitrogen gas at room temperature. Plate copies stored for a longer term are kept under nitrogen gas at −20 °C.
In the current version of the FIMM oncology collection (version 4A, FO4A), the 461 drugs have been grouped by drug target classes so that only the plates with a wanted subset of compounds can be selected at a time. The dilutions on the source plates have been grouped by usage ( Fig. 2 ). Stock concentration (A: 1000× tested top concentration, e.g., 10 mM) is on one plate, and the dilutions needed for five-point curves (B: 100× tested top concentration; D: 1× tested top concentration) are on a second plate. Dilutions needed for nine-point curves and 1536-well plates (C: 10× tested top concentration and 1 µM; E: 0.1× tested top concentration) are on a third plate ( Fig. 3 ). This setup enables simple protocols to be used for making the dilutions and minimizes the plate swapping during transfer.
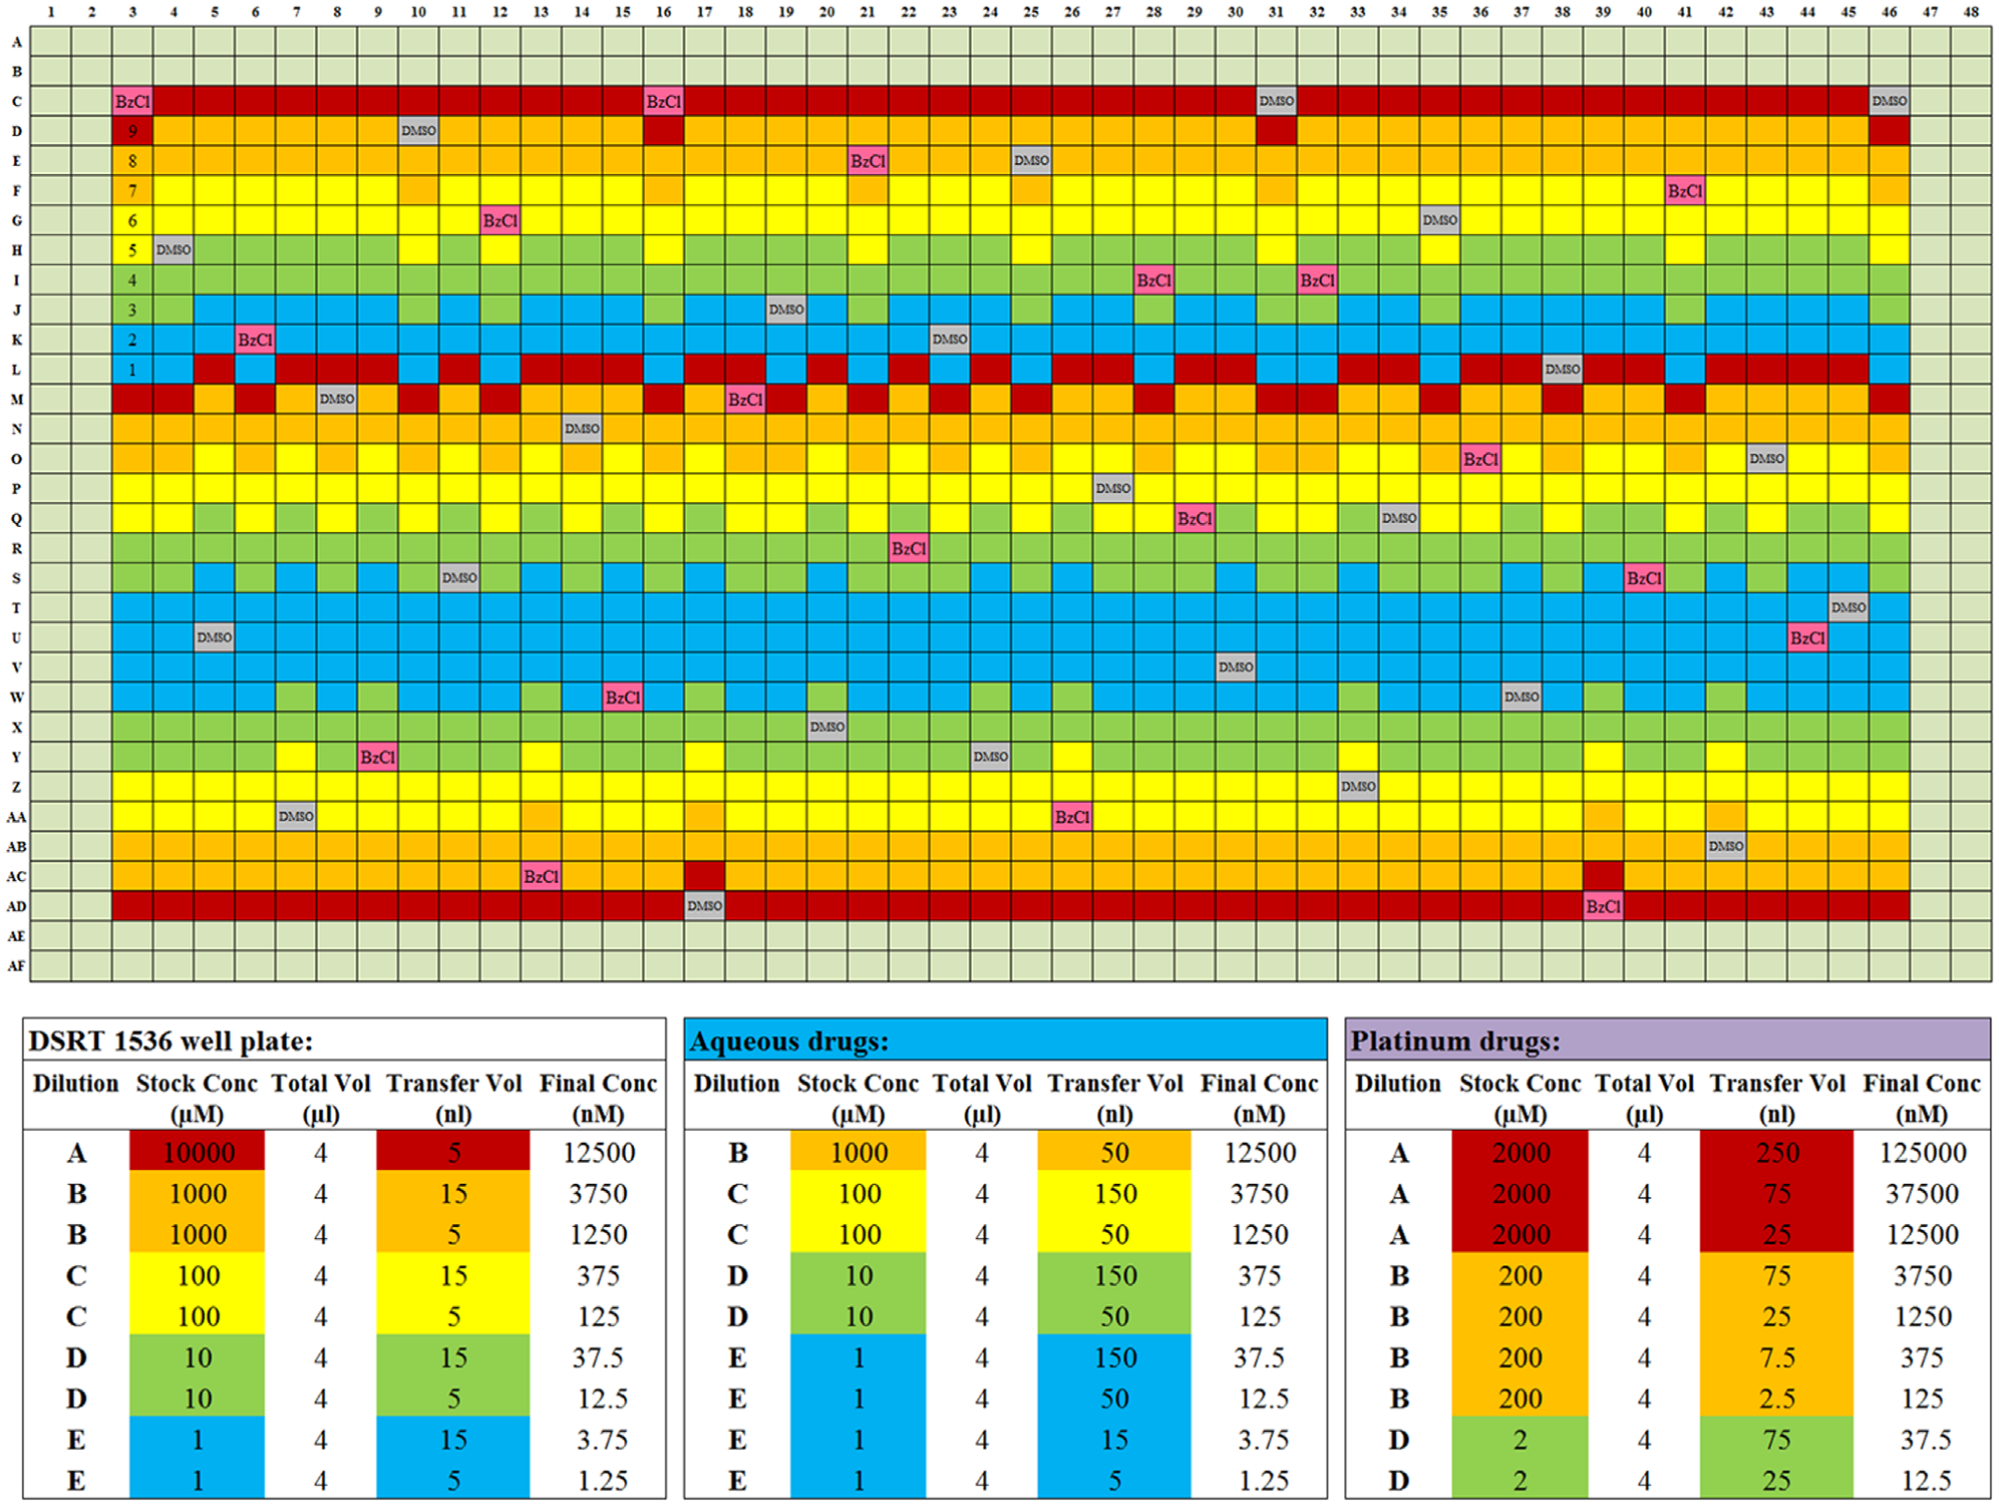
Design of 1536-well assay plate and dispensing strategy of the compounds to reach a nine-point dose response curve. All five stock concentrations are needed to create a nine-point dose response curve while keeping the DMSO percentage low. The strategy for aqueous compounds is different from the DMSO soluble compounds, as water evaporates more easily. The platinum-containing compounds are labile and poorly soluble in water, so yet another strategy is applied for them.
Seventeen compounds in the FO4A collection are dissolved in water, of which three are platinum drugs. These compounds have a separate standard-volume source plate, which is stored at −20 °C. Water evaporates fairly quickly from the plates. Therefore, we use 10-fold larger volumes from 10-fold bigger dilutions, as the evaporation is proportionally smaller in more dilute liquid ( Fig. 3 ). Transfers are done using the Echo 525 instrument, so the time of transfer is not increased. The platinum-containing compounds are more poorly soluble and unstable, so they are freshly dissolved each month as a 2 mM A-concentration instead of 10 mM, which ensures that activity is retained. To reach the range in which they show activity, the transfer volumes are 1.25 µL and 125 nL.
For hit confirmation, project-specific customized plates can be made with custom-picked drugs, concentrations, and layouts. If the IC50 value has to be refined, the nine-concentration curve can be dispensed. To test drug combinations, we have created a layout on the 384-well assay plate where a given pair of drugs is plated against each other in a series of one blank and seven half-log dilution concentrations, creating an 8 × 8 matrix ( Fig. 4 ). The first drug is running from left to right and the second from top to bottom. The upper-left corner well of each matrix contains DMSO only, and the bottom-right corner contains the positive cell–killing control. Six pairs can be accommodated on one 384-well plate. We have created a script in-house (by Liye He and Laura Turunen) in which two input text files are fed to the program: one containing the source plate information and the other with the drugs that should be paired, as well as the range for each compound. The output file is a comma-separated file (.csv) that can be used with the Echo Cherry Pick software on the Labcyte Access system without further modifications needed. The script also gives information on the total consumption of the liquids from the source plates, so that we can ensure that the stocks will not run out during the run.
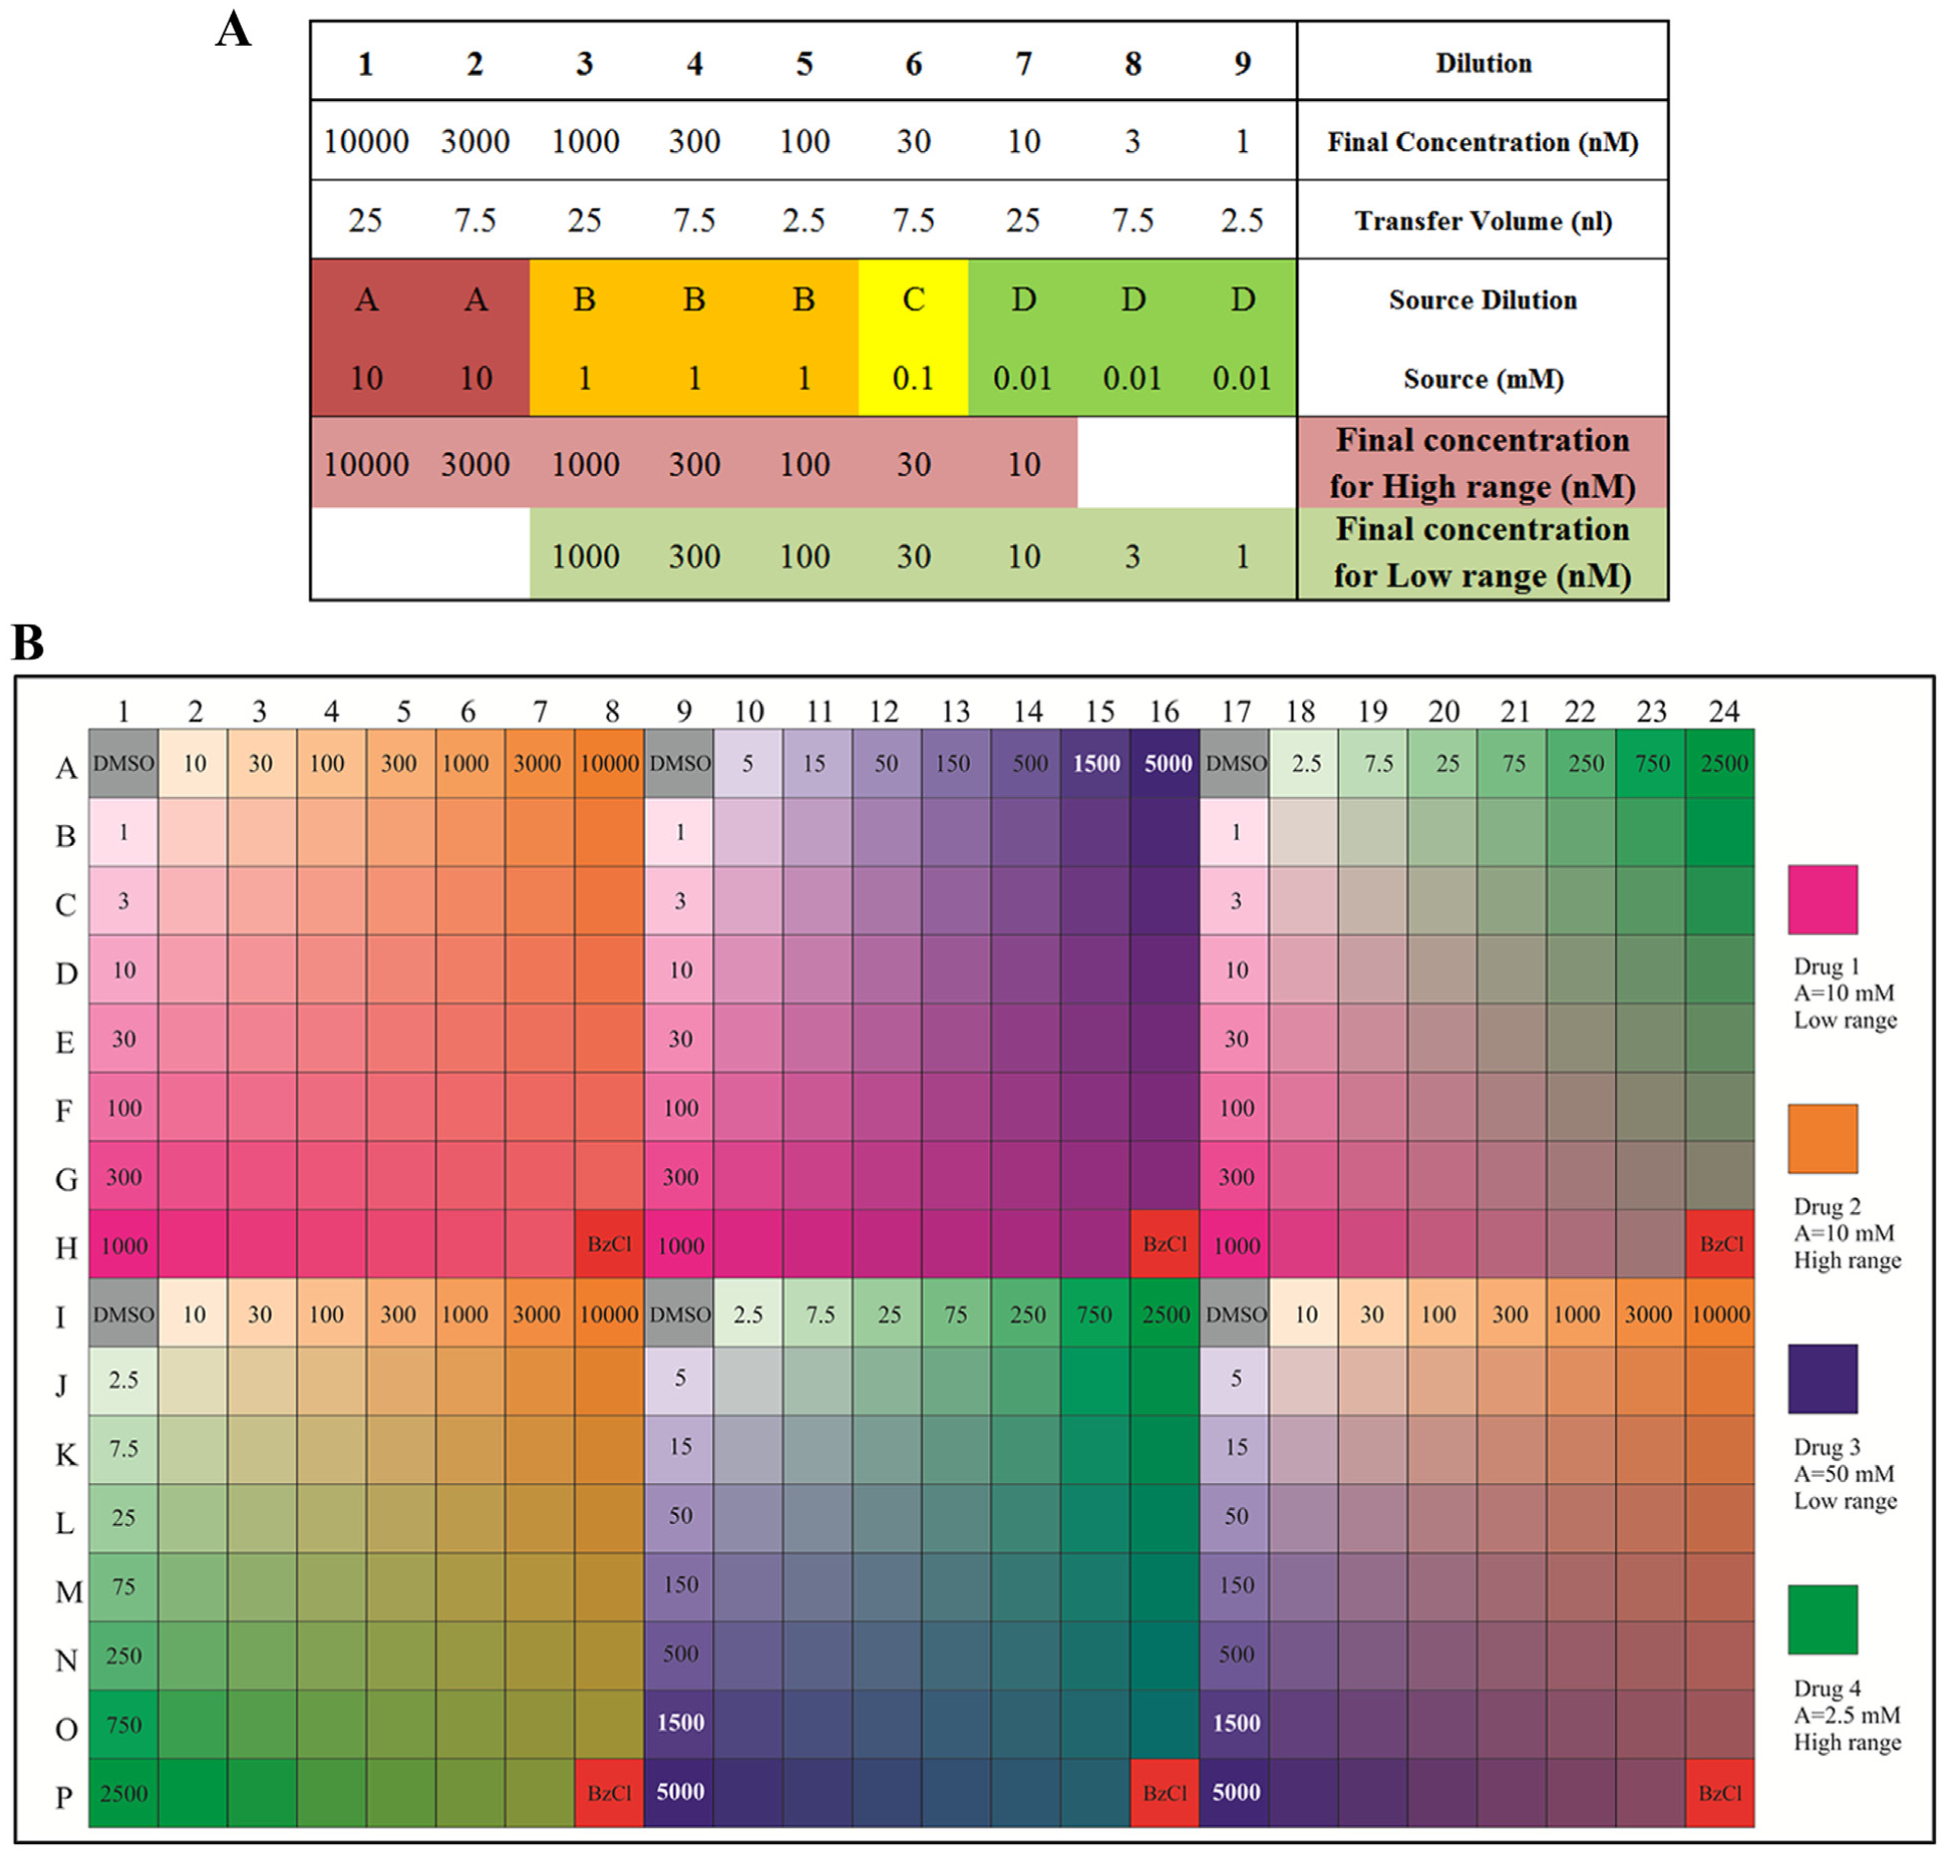
Concentrations, dispensing volumes, and layout for drug combinations. (
Quality Control and Implications of Using ADE
Because the FIMM oncology collection is used in several hundred experiments each year and the experiments are performed by multiple users, a system for quality controlling the experiments and the compound collection is critical to ensure that the data from different screens are comparable.
ADE provides a unique opportunity in designing in a fast and precise manner any type of layout for compound screening. The current FO4A oncology collection version contains 461 compounds in seven assay plates. Each plate in the FO4A version contains 66 compounds in five concentrations and 10 positive and 12 negative control wells distributed across the whole plate ( Fig. 3 ). This layout allows monitoring of QC parameters for column, row, and edge effects and Z′-factor 13 to ignore data from bad-quality plates. The scattered controls allow normalization of results if the plate QC statistics are just below the criteria for acceptance. 14 Z′-factor, often used as the standard quality metric for screening, is calculated each time using screening data management software studies (Dotmatics, Bishops Stortford, UK). An evaluation of edge effects and other plate effects, as well as signal-to-background ratio (should be >15 for CellTiter-Glo readout and >2 for CellTox Green readout), coefficient of variation (CV; <10%), Z′-factor (>0.5), and strictly standardized mean difference (SSMD) 15 (>8), is applied to flag or exclude questionable plates or data sets. In addition to standard barcoding of the plates, we have also applied in-plate barcoding with the positive cell–killing control, benzethonium chloride (BzCl; Fig. 5 ), which allows visual and automated identification of the different plates within one assay plate set.
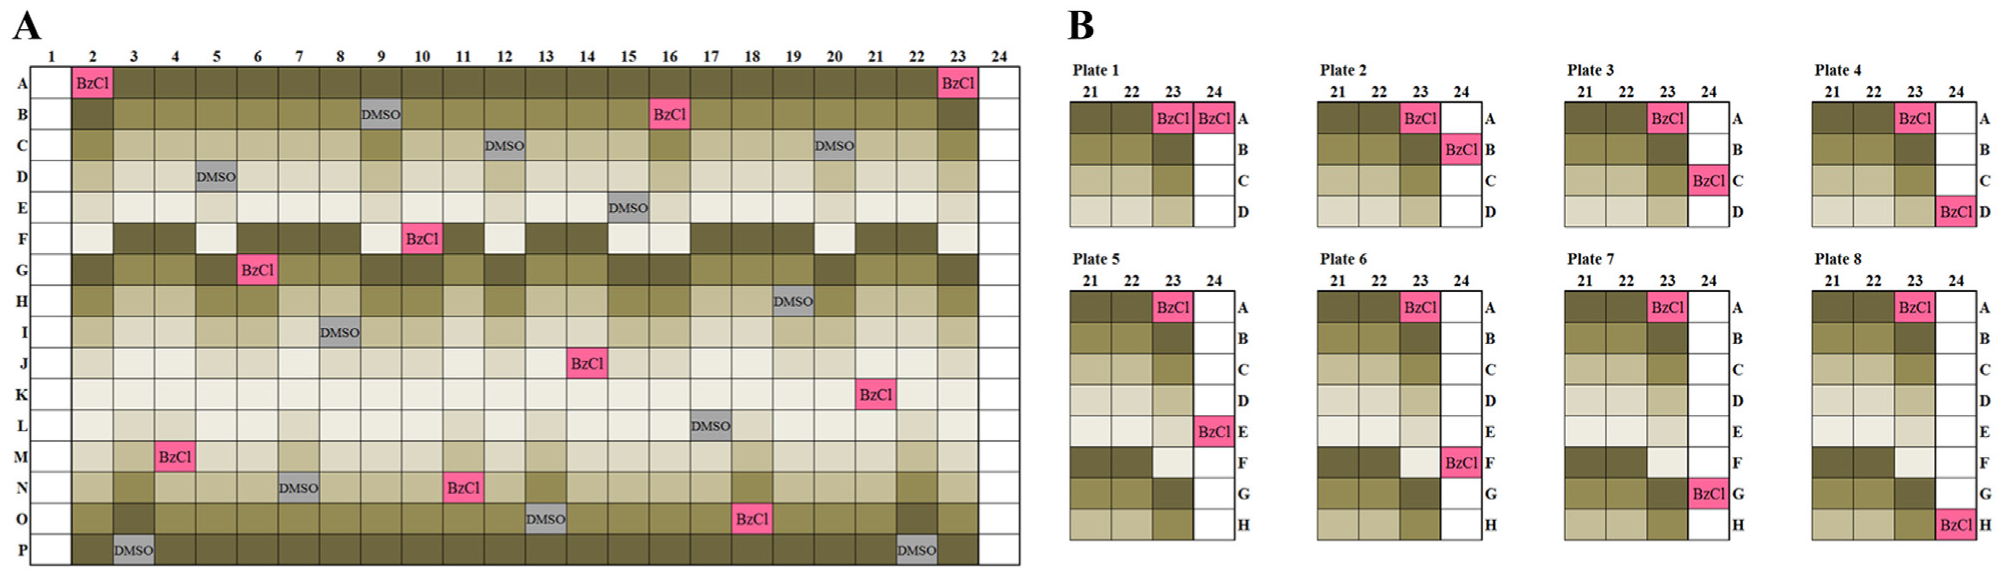
The Institute for Molecular Medicine Finland (FIMM) oncology collection assay plate layout. (
For quality control of the compounds, we screen a panel of four assay-ready cell lines (IGROV-1, MOLM13, DU4475, and HDQP1) every second month that together exhibit a broad range of responses to the majority of the compounds in the collection. By comparison of drug responses over time, any changes in drug activity are tracked, and if needed, stability of the compounds is tested by mass spectrometry. The analysis of two different intraday screens of the same cell line shows a very high correlation ( Fig. 6 ), and correlations of screens performed every second month have varied between 0.93 and 0.97, even with a fully automated noncurated analysis.
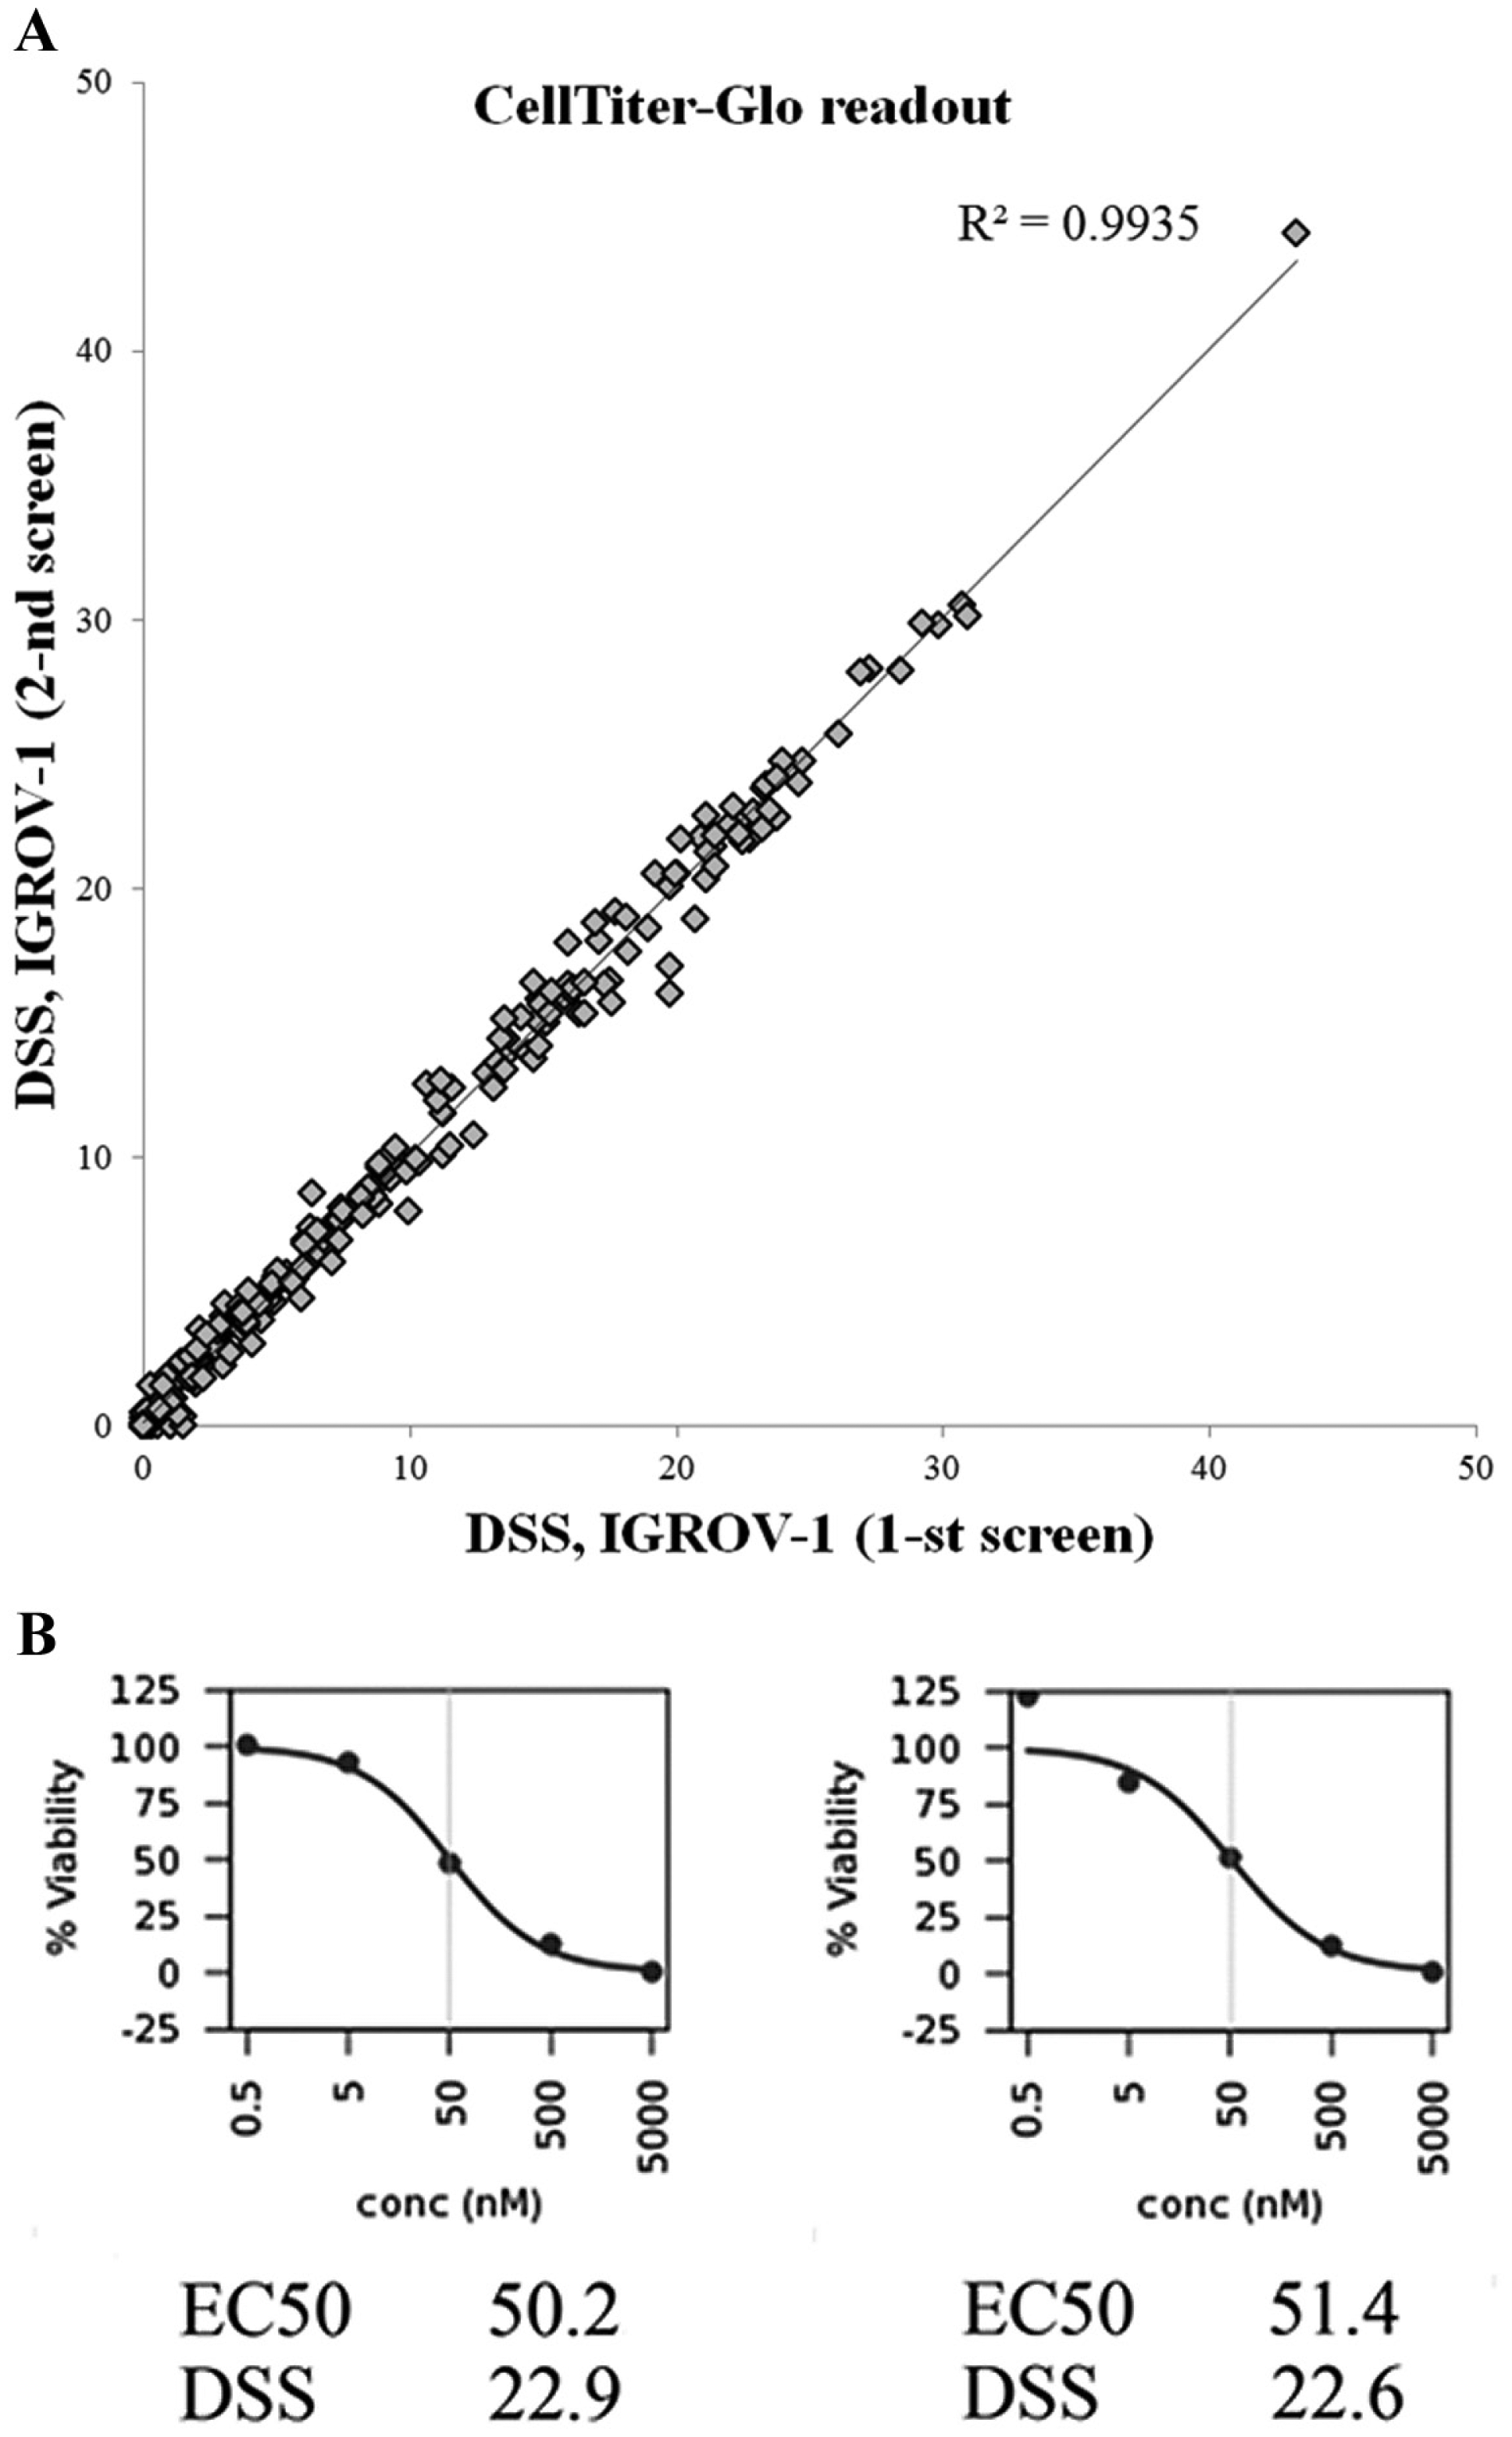
High reproducibility of screens. (
A very strong correlation between the results is also seen with primary cells derived from bone marrow of two healthy controls ( Fig. 7A ). When the drug responses of acute myeloid leukemia (AML) patient primary cells are compared with those of a healthy control, a greater disparity is seen ( Fig. 7B ), primarily in the form of the cancer cells exhibiting stronger responses to a number of anticancer agents in the screen.
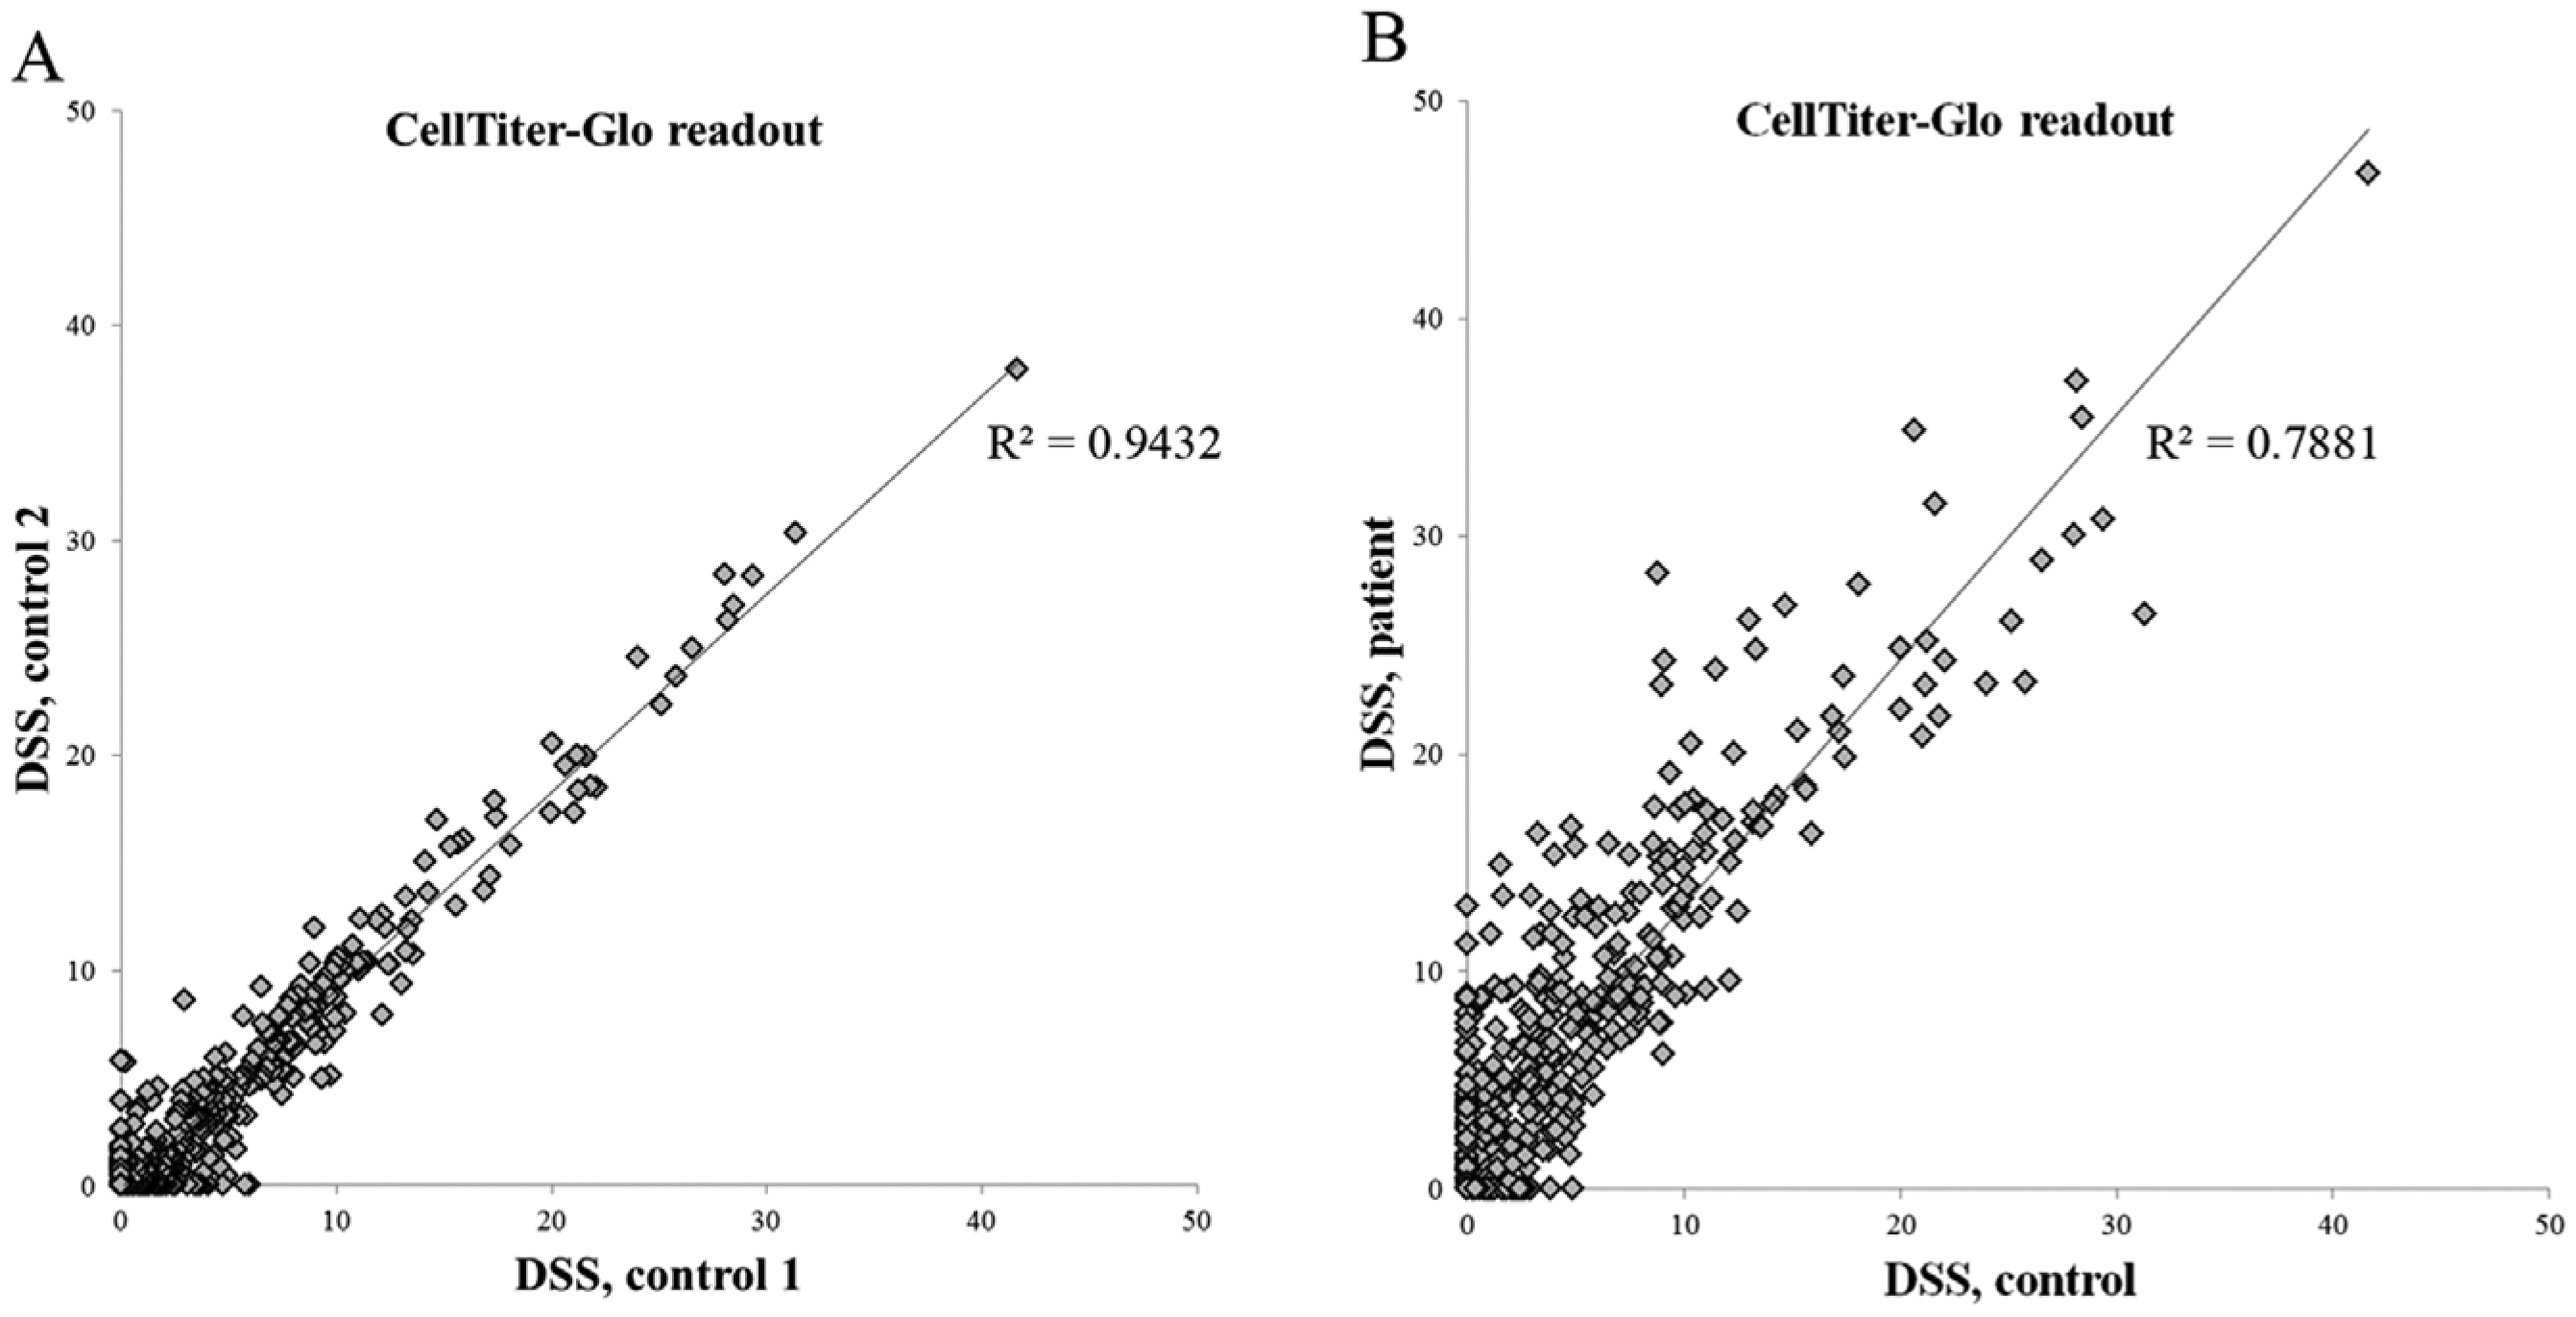
A comparison of drug sensitivity score (DSS) values between primary samples. (
Finally, the change in viable and dead cell numbers during the assay incubation is tracked as a QC metric. For this, we run two separate plates with cells in negative (DMSO) and positive cell–killing control (BzCl) wells only. The first plate is analyzed on the day of cell plating by CellTiter-Glo and CellTox Green reagents (Promega, Madison, WI), whereas the second plate is analyzed at the end point of the screen. We calculate the average standard population deviation and CV for both control groups for each plate. The average of the controls is normalized using the average of wells containing only medium and the detection reagent. The normalized values are next compared by dividing the 72 h value by the 0 h value. This ratio of negative controls for CellTiter-Glo is an indication of the change in viable cells during the 72 h incubation. Similarly, the ratio of positive controls for CellTox Green indicates the extent of cell death during the incubation.
Dispensing of Reagents and Cells Using ADE
The relative number of dead cells can be detected using a nonmembrane permeable DNA-binding dye that is added to the cell culture. Many commercial reagents of this kind exist, 16 of which we use CellTox Green reagent (Promega). In the standard protocol, CellTox Green is added to the assay plates in 5 µL of cell culture medium prior to adding cells in 20 µL of medium at a final dilution of 1:2000. The addition of the CellTox reagent at the beginning of the assay gives more solid signals than adding it at the end of the assay, likely because it stabilizes the DNA of dead cells, and the presence of CellTox Green during the 72 h incubation does not affect cell growth and viability as judged by the CellTiter-Glo readout. As an alternative to adding the CellTox Green in the medium, we pretransfer the CellTox Green reagent into the assay plates in a ready-to-use format. We prepare regular assay plates with compounds into which we also added 12.5 nL of CellTox Green using Echo 550 with DMSO calibration on the preplated compounds ( Fig. 8 ). The assay plates were stored under nitrogen gas in storage pods (StoragePod system; Roylan Developments) for 30 d. The addition and storage of the CellTox Green reagent to the assay-ready plates does not affect either compound integrity, as judged by cellular responses, or the CellTox Green assay performance.
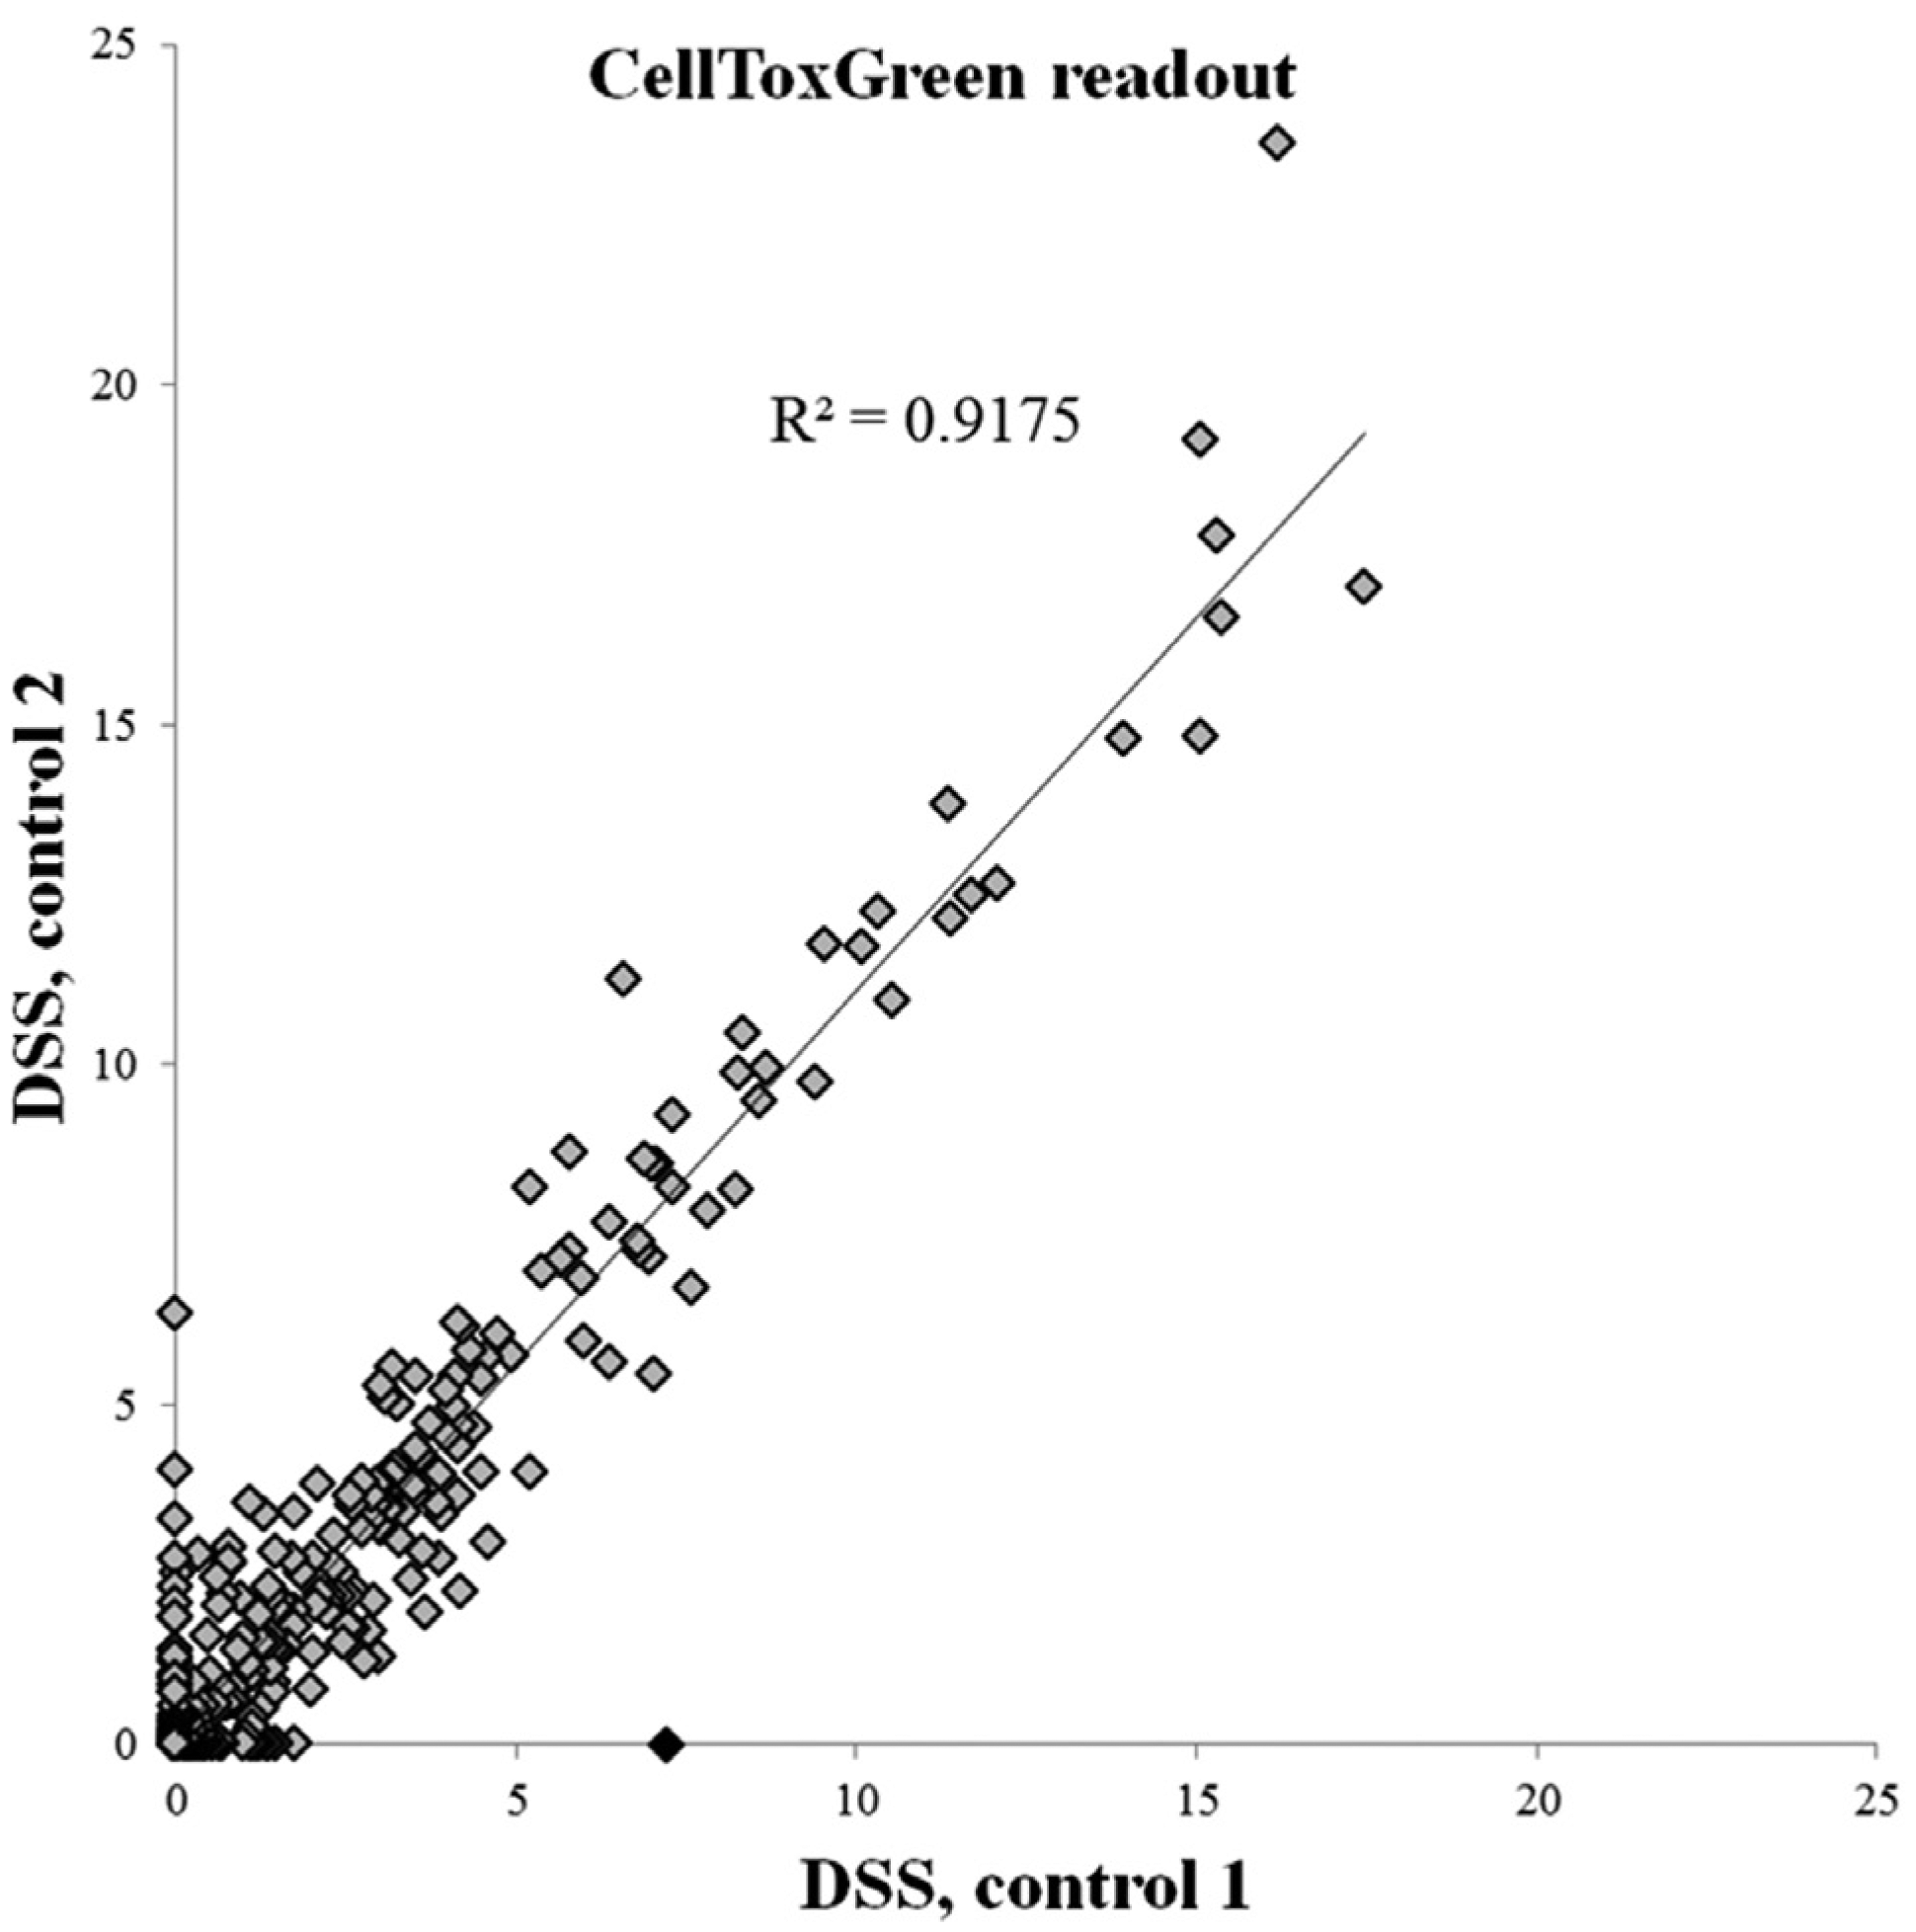
Cell toxicity readout using CellTox Green data from two K562 cell line screens was analyzed with an automated, noncurated analysis pipeline using the internally developed Breeze analysis platform. Correlation of the results between the independent screens is 0.9175.
Peristaltic dispensers are typically used for seeding cells into the assay plates. A MultiDrop Combi dispenser (Thermo Fisher Scientific, Waltham, MA) with a standard cassette has thus far been the most widely used technique for cell seeding, but despite intensive priming, some striping plate effects are sometimes seen in the assay plates. The use of a BioTek MultiFlo FX dispenser with a random access dispenser single-channel 5 µL cassette (BioTek Instruments, Winooski, VT) has allowed us to obtain significantly better and more consistent results for cell and reagent dispensing.
However, even with the single-tip peristaltic dispensing, losses of cells to priming can be a big problem when dealing with precious primary cell samples. In these cases, cell transfer with ADE is a powerful approach to get the most out of small numbers of cells. In a trial experiment, we prepared HeLa cells in regular culture medium at a concentration of 1.0 × 10⁷ cells per milliliter; 66 µL of cell suspension was carefully pipetted into a well in an acoustic-grade Labcyte 384-well polypropylene source plate. The plate was then rapidly placed into an Echo 525 acoustic dispenser, and cells were transferred using the aqueous buffer calibration into a 384-well tissue culture–treated plate (No. 3712, Corning, Corning, NY) prefilled with 25 µL growth medium. Well A1 in the destination plate was used for priming 4 µL of cell suspension (160 × 25 nL) from the source well to achieve consistent dispensing from the source well into subsequent wells, after which 100 nL (4 × 25 nL), corresponding to 1000 cells/well, was transferred to all other wells of the destination plate. The destination plate was incubated 16 h in a cell culture incubator, after which cell viability was measured with CellTiter-Glo. The results showed that a uniform number of cells can be dispensed using ADE with a plate CV of 5.6% (excluding the priming well A1). The raw signal declined slightly throughout the dispensing from the first to the last dispensed well (RLU from 14,309 to 13,587; Fig. 9 ), indicating that cells were slowly sedimenting in the source well during the dispensing. The Echo 525 at FIMM was recently upgraded to be compatible with six-well reservoir source plates. This is expected to further improve the cell-dispensing capacity thanks to increased speed of droplet ejection, better mixing of the cells in the source well, and the possibility of dispensing to multiple destination plates from a single source well.
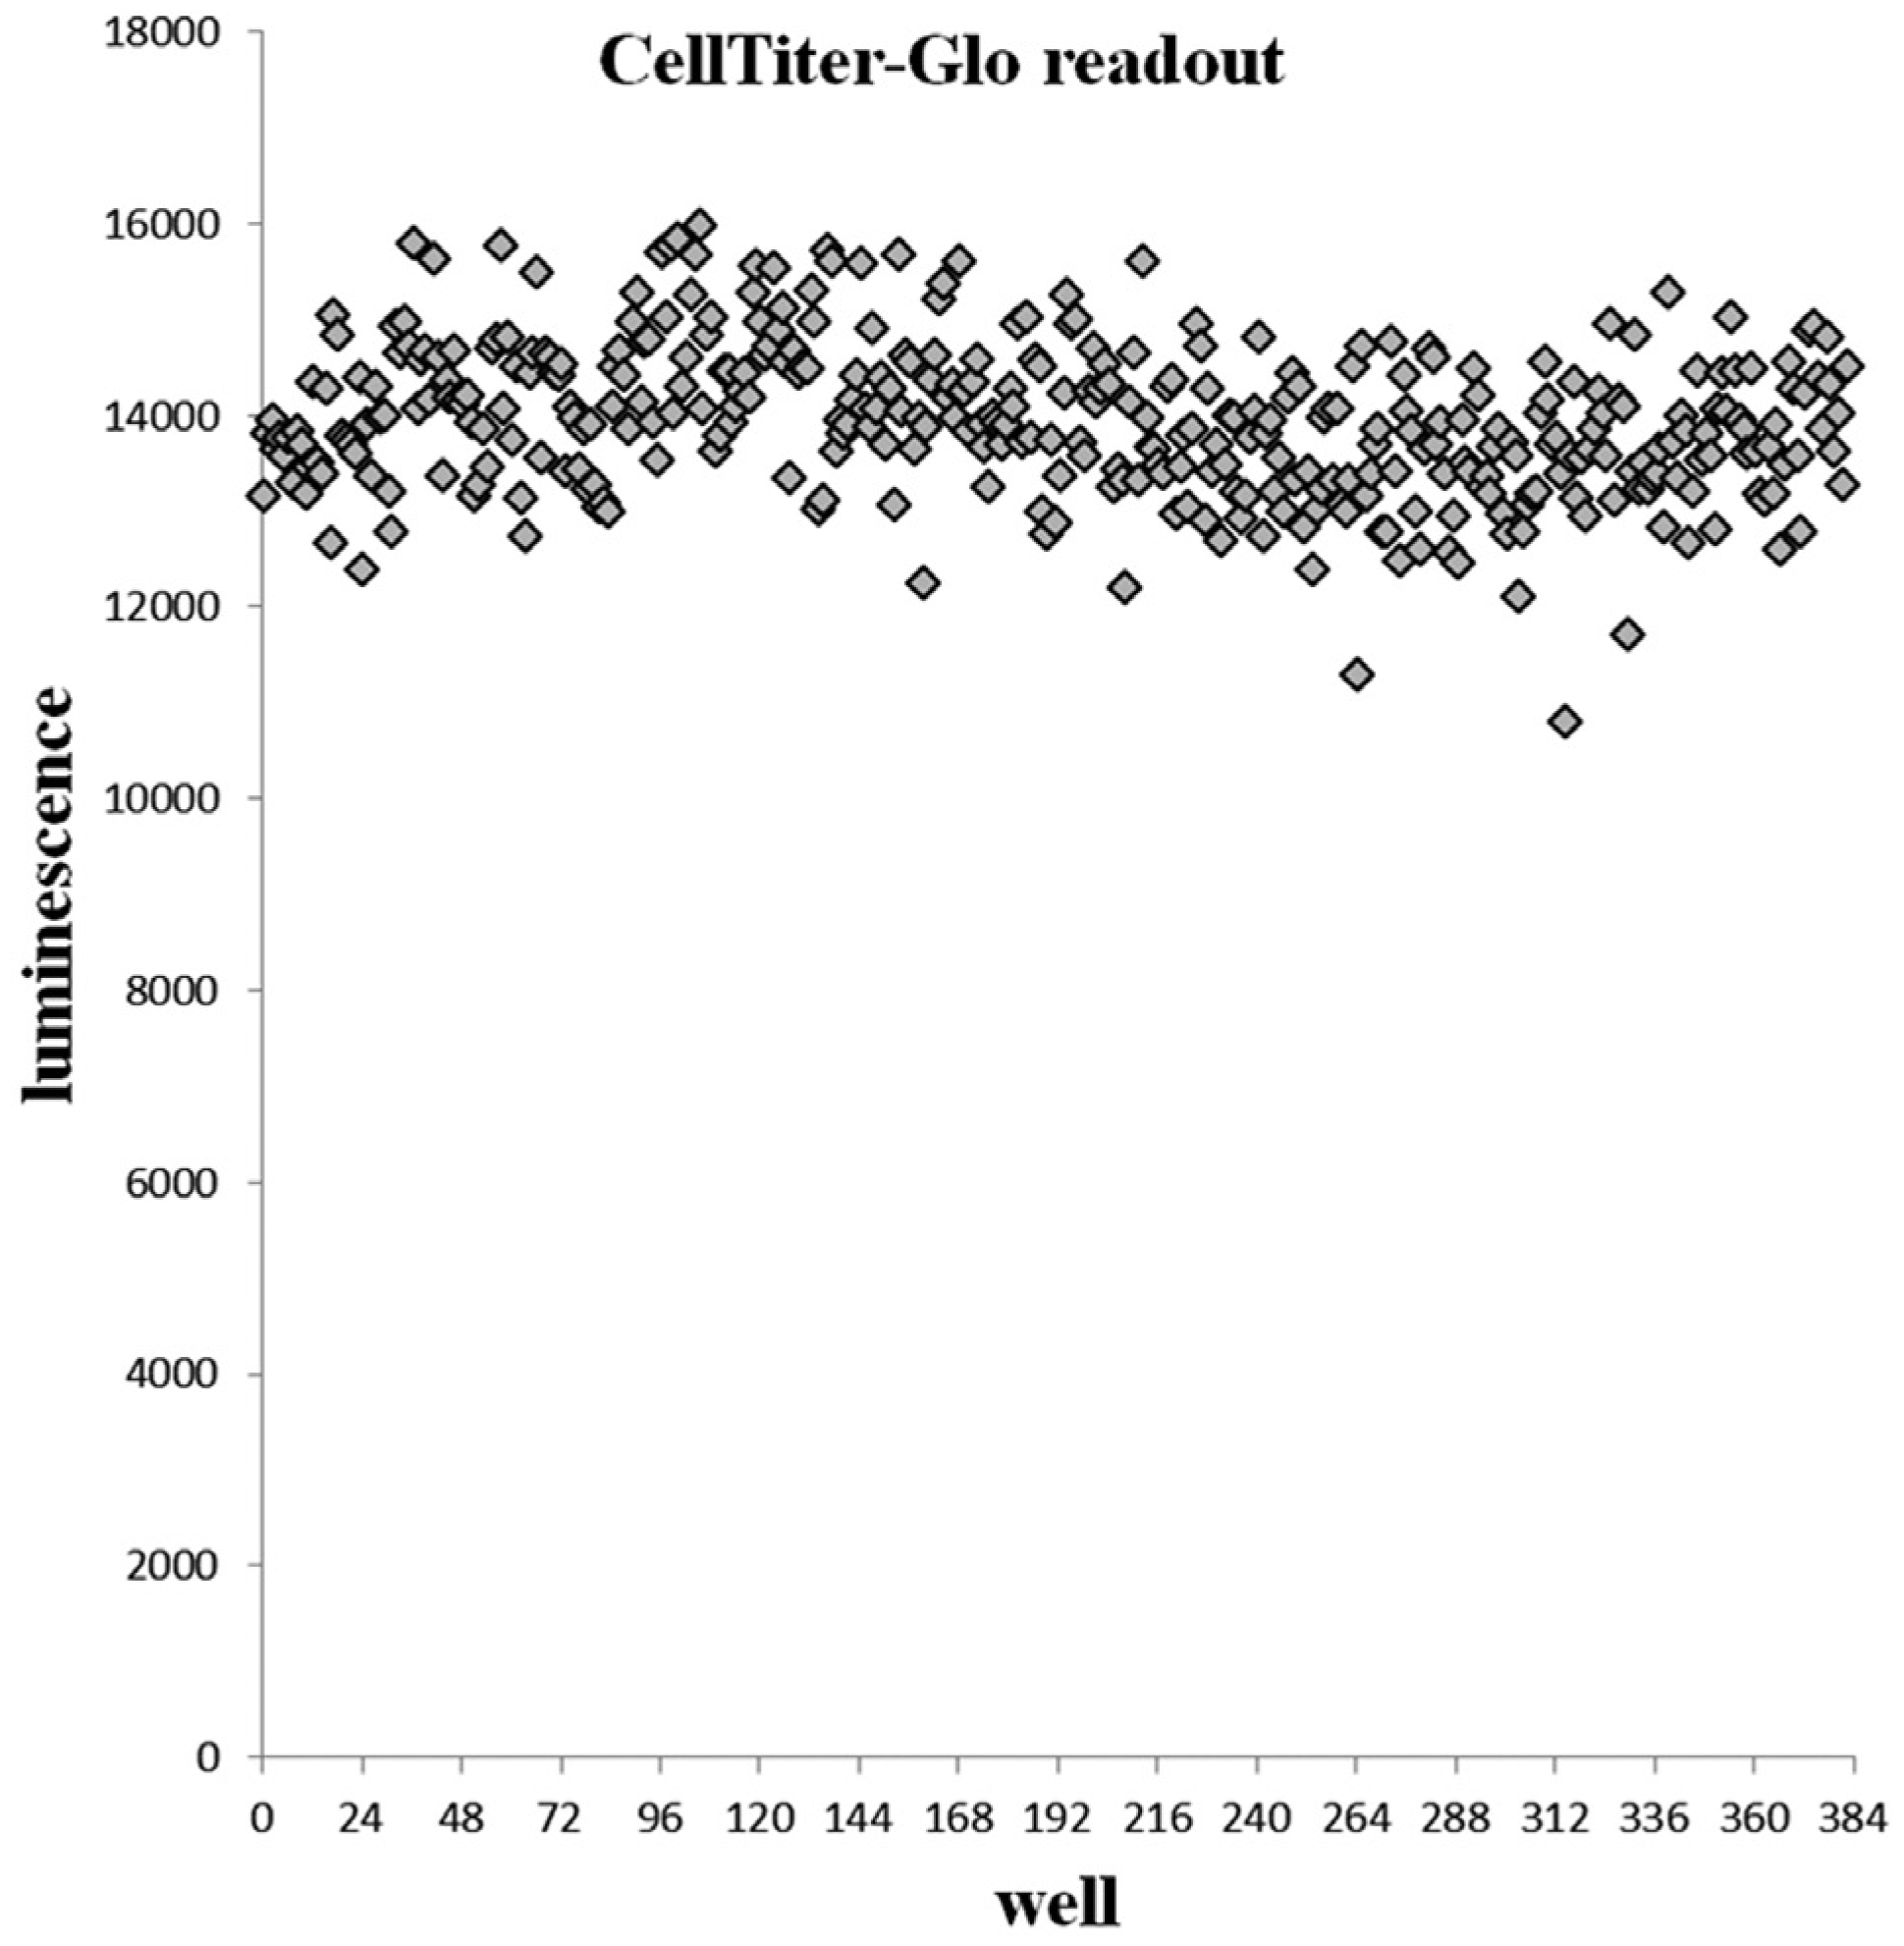
Assessment of viable cells after cell seeding by Echo525 in a 384-well plate as measured by CellTiter-Glo. The wells are sorted according to cell seeding order.
Use of ADE for Follow-Up Assays
Beyond measuring cell health as a DSRT readout, following protein markers indicative of signaling events or other cellular responses can be a powerful way to understand drug responses. To do this, we have explored both reverse-phase protein array (RPPA) 17 and ultra-miniaturized homogeneous antibody-based lysate detection assays from lysates in DSRT plates using ADE.
For RPPA, we have been dispensing arrays of lysates on slides using the Echo Array Maker software. To prepare the lysates for a DSRT-based RPPA, we set up a standard DSRT assay in Labcyte acoustic-grade, tissue culture–treated polypropylene, standard-volume plates and incubate the cells for 72 h. At the end of the assay, the growth medium is aspirated using a BioTek EL406 washer dispenser (BioTek Instruments), and 20 µl of lysis buffer (100 mM Tris pH 8.0, 0.2% sodium dodecyl sulfate, 10 mM DTT) is added as previously described. 18 Plates are then sealed and heated for 20 min at 95 °C and centrifuged. At this point, the assay plates can be used for array dispensing onto a nitrocellulose-coated slide (Sartorius Unisart; Sartorius, Göttingen, Germany) or stored at −20 °C for later use. It is possible to fit spots from five 384-well plates on one slide (total, 1920 spots; spot-to-spot distance, 785 µm) using 2.5 nL droplets. If larger amounts of protein are needed in each spot, several droplets can be dispensed on top of each other on the same spot, as the previous spot has time to dry out before the next dispensing round. There have been some challenges in getting the droplets to form a straight grid. Technical solutions have been to prime the lysate wells by dispensing 200 nL (80 × 2.5 nL) from each well before dispensing to the actual array and to set a separate calibration for the tissue culture–treated standard-volume source plate, as it has become apparent that the lysate preparation treatment affects the acoustic properties of the plate. The advantages of using ADE for array printing compared to conventional pin tool printing are the accuracy of volume transferred and possibility to rearrange or multiply samples on the array to any format. Throughput for contact printing is higher, but in cases in which only a few slides per sample are needed, cherry picking of the samples to be analyzed is preferred, or resorting of the positioning of the spots is beneficial, the ADE printing is a feasible option. To quality control for lysate transfers, the printed slides are stained with FastGreen FCF dye, 19 and protein content is quantified with an InnoScan 710IR microarray scanner (Innopsys, Carbonne, France). A dilution series of a control lysate is always included on each array to ensure that protein and antibody detection is in a quantitative range. Fast Green FCF fluorescence signals in repeat transfers of the same lysate exhibit CVs below 5%, and antibody-based detection of protein epitopes exhibit CVs of 10% or less, showing the transfer volume accuracy.
For ultra-miniaturized homogeneous antibody-based lysate protein marker detection assays based on time-resolved FRET or AlphaScreen/AlphaLisa detection methodologies, DSRT assays are run like normal, but at the endpoint, cells are lysed with the appropriate lysis buffer for the detection assay. In preliminary testing for measuring a phospho-ERK in DSRT lysates, we transferred 500 or 1000 nL of cell lysate out of DSRT plates, as well as the other assay reagents, for detection with a phospho-ERK homogeneous time resolved fluorescence (HTRF) assay (Cisbio Bioassays, Codolet, France) in total volumes of 1 or 2 µL in a 1536-well plate. For both 1 and 2 µL assay volumes, solid signal windows were detected. Similarly, we have successfully miniaturized a biochemical HTRF assay using ADE. The EPIgeneous methyltransferase (Cisbio Bioassays) assay is recommended by the manufacturer to be run using 20 µL reaction volume. Using ADE for all liquid transfer steps, we miniaturized the assay to 1 and 2 µL reaction volume using 1536-well plates (No. 3729, Corning) with solid results that allowed for running a screen for inhibitors of a previously unexplored methyltransferase.
One challenge in combining cell viability and cytotoxicity readouts with ultra-miniaturized protein marker assays is that the lysis conditions in assays such as CellTiter-Glo are not compatible with the follow-up assays. Hence, with standard assay reagents, we are forced to use a separate plate set for the protein marker assays, which both incurs extra costs and forces us to use more cellular material, which often is a limitation when working with primary material. However, new, sensitive nonlytic and nontoxic cell viability assays such as RealTime-Glo (Promega) open up the possibility of using the same cell material for both the viability/toxicity readouts and the protein marker assays. Our testing has shown that the RealTime-Glo and CellTiter-Glo readouts of assays with our oncology compound collection are highly correlated. 20
Conclusions
A key component of the individualized systems medicine personalized cancer medicine program at FIMM is a standardized and highly controlled drug sensitivity testing platform, and ADE plays a critical role in this operation. Accurate standard dispensing of drugs to predrugged assay plates and the flexibility of preparing custom drug plates on a project-specific basis are operations that could not be done at the scale we need to without ADE. Finally, we increasingly rely on ADE liquid handling for running the drug sensitivity assays, in terms of both the dispensing assay reagents and especially in the possibility to perform ultra-miniaturized, and therefore cost-effective, follow-up assays following total protein and phosphoprotein markers. These follow-up assays make it possible to monitor inhibition of specific cancer signal pathways and cellular reprogramming in the response to drug treatments, allowing for identification of mechanisms of adaptive drug resistance and building theories on selective and effective personalized drug combination strategies.
Footnotes
Declaration of Conflicting Interests
The authors declared no potential conflicts of interest with respect to the research, authorship, and/or publication of this article.
Funding
The authors disclosed receipt of the following financial support for the research, authorship, and/or publication of this article: This work was supported by Biocenter Finland/University of Helsinki research infrastructure funding (salary support for E.K., J.S., and L.T.) and by the Academy of Finland (to K.W., grant 277293).