
Abstract
Assessment of synergistic effects of drug combinations in vitro is a critical part of anticancer drug research. However, the complexities of dosing and analyzing two drugs over the appropriate range of doses have generally led to compromises in experimental design that restrict the quality and robustness of the data. In particular, the use of a single dose response of combined drugs, rather than a full two-way matrix of varying doses, has predominated in higher-throughput studies. Acoustic dispensing unlocks the potential of high-throughput dose matrix analysis. We have developed acoustic dispensing protocols that enable compound synergy assays in a 384-well format. This experimental design is considerably more efficient and flexible with respect to time, reagent usage, and labware than is achievable using traditional serial-dilution approaches. Data analysis tools integrated in Genedata Screener were used to efficiently deconvolute the combination compound mapping scheme and calculate compound potency and synergy metrics. We have applied this workflow to evaluate interactions among drugs targeting different nodes of the mitogen-activated protein kinase pathway in a panel of cancer cell lines.
Keywords
Introduction
Combinations of drugs have been a key element of cancer therapy since the discovery of chemotherapy, 1 and they are a vital component of drug therapies for other diseases. Combining two targeted inhibitors reduces the probability of acquired resistance leading to treatment failure; this is best illustrated by the necessity of combination antiretroviral therapies2,3 and is now emerging as an important factor in targeted therapies for cancer. 4 Although drug combinations can achieve enhanced or prolonged therapeutic responses by additively inhibiting two pathways or processes, the greatest value can come from situations in which the two drugs act synergistically.
Synergy is broadly defined as an effect that is greater than predicted if the two drugs acted independently and thus displayed only an “additive” effect. 5 In the simplest embodiment, synergy can be demonstrated if the combined effect of two drugs is greater than additive effect expected if there was no functional interaction.5,6 Experimental determination of synergy in cellular assays can serve several purposes. One is to qualitatively determine whether the two treatments act independently or interact, to gain insight or formulate hypotheses into the mechanisms of the agents.7,8 Novel therapeutically effective combinations of marketed and experimental drugs can be identified (e.g., 9,10), providing a basis for further validation with in vivo efficacy models and ultimately clinical trials.
We wished to study the combined effects of inhibitors of mitogen-activated protein kinase kinases (MEKs) and extracellular signal-regulated kinases (ERKs) on a panel of cancer cell lines. The Ras–MAPK (mitogen-activated protein kinase) pathway is critical in many cancers as a mediator of the oncogenic effects of receptor tyrosine kinases (RTKs), mutant Ras, or mutant B-RAF, and several drugs targeting RAF or MEK kinases have been approved, along with many in clinical development.4,11,12 However, the presence of ERK-driven negative-feedback loops suggests that partial inhibition of the ERK enzyme, either directly or through MEK inhibition, could result in enhanced upstream activation of the pathway and reduction of the efficacy of inhibitors.13,14 The model thus predicts that partial inhibition of MEK and ERK together should have a synergistic effect. We therefore sought to determine whether MEK and ERK inhibitors acted synergistically, and whether the degree of synergy was dependent on the genetic background and mutational status of different cancer cell lines. This study therefore required not only a qualitative discrimination between additive and synergistic effects, but also a robust quantitation of the degree, or “strength,” of synergy.
Using a simple fractional effect multiplicative model (Bliss independence 15 ), synergistic interaction can in theory be demonstrated with a single, partially effective dose of each drug. However, this relies on prior knowledge of the precise target dose, maximal effect, and steepness of the dose–response curve for each drug for each different cell line. Therefore, when testing combinations of drugs for synergistic effects, the simplest practical approach is to use the same dose–response workflows as for single-compound assays. In the simplest experimental design, cells are treated with a dose–response series of one drug in the presence or absence of a minimally efficacious dose of the second drug ( Fig. 1A ). Synergistic interactions are detected as a leftward shift of the dose–response curve relative to the single agent alone. Fixed-ratio dosing in which three dose–response series are tested, each drug alone and the two drugs mixed at a single ratio and then serially codiluted ( Fig. 1B ), is widely used; a 2010 review states that the Chou–Talalay Combination Index (CI), based on constant-ratio dosing, has been cited in more than 3900 publications. 16 To determine the presence and degree of synergy, tests such as Bliss independence or the combination index of Chou and Talalay 17 can be used. However, for this synergy metric to be meaningful, and allow comparison between different cell lines or drugs, the compounds are required to be dosed at a constant ratio matching the ratio of their respective single-agent EC50s. Regardless of the analysis method, the most sensitive region for differentiating interacting effects from the no-interaction model is around the EC50 of both drugs. 5 If these conditions are not met, comparison of apparent drug–drug interaction effects has limited meaning. However, this requirement is extremely challenging to meet in cases such as testing a pair of drugs against a panel of cell lines of different sensitivities. The ideal, but impractical, case would require that the single-agent EC50 for each drug and each cell line are known, and that a different mixture of the two drugs is prepared and serially diluted for each cell line to match the potencies of the two drugs.
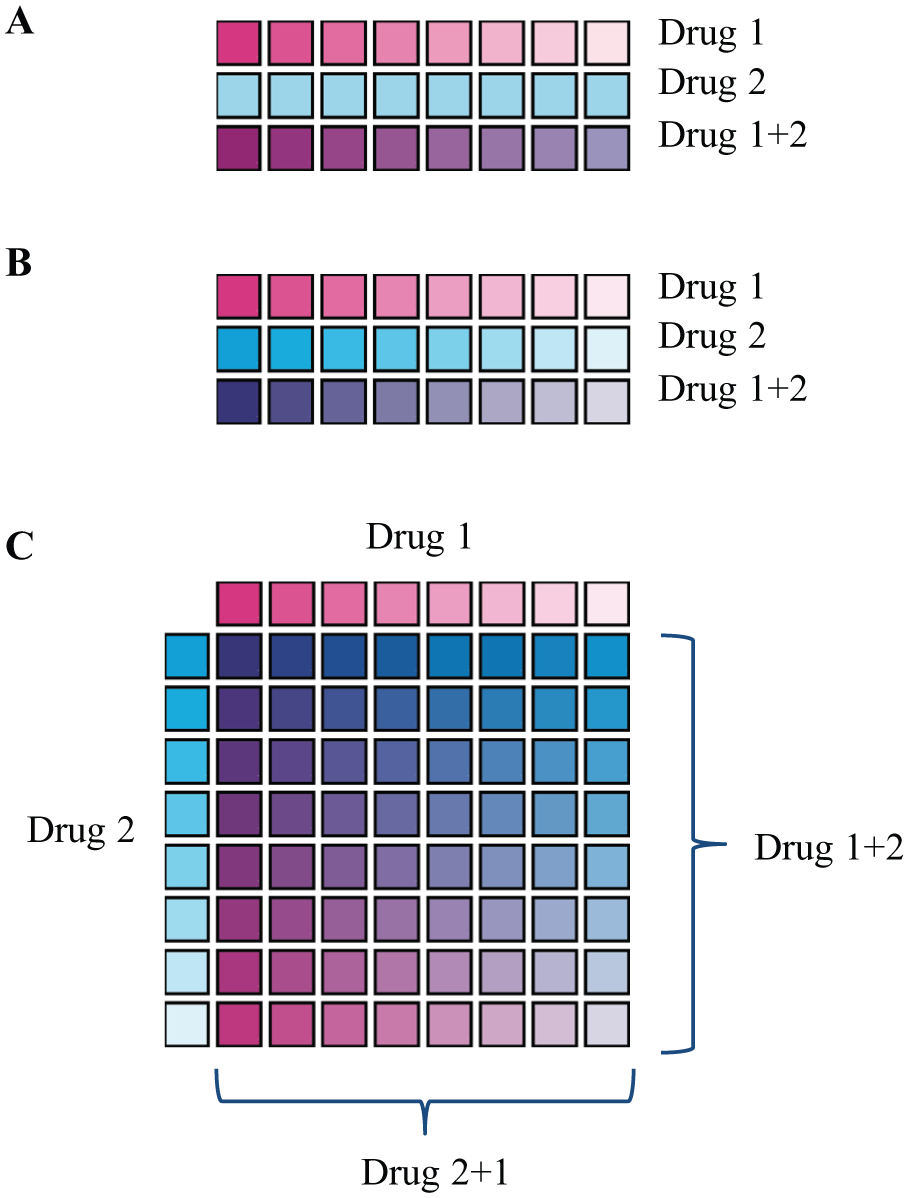
Schematic of an alternative compound dilution and dosing scheme for analysis of interactions. (
The solution to this problem, and the ideal experimental design, is thus to test each pair of drugs in a dose matrix format, in which the EC50 dilution curves of each drug are overlaid to provide combinations at multiple different doses and ratios ( Fig. 1C ). This ensures that at some point on the dose–response surface, the ratio of the two drugs will be optimal for sensitive detection of interactions. Furthermore, the matrix format yields full dose–response curves of each drug at different constant concentrations of the other drug along the rows and columns, whereas the diagonal can provide a fixed-ratio dose response. By fitting along the rows and columns of the matrix, the data and the expected additive models can be parameterized. 5 For example, the Loewe additivity model and isobologram analysis use differences in fit parameters between observed and expected effects, which can be applied to generate a synergy score. Tests for Bliss independence can likewise be applied to fitted values rather than individual data points.
Although this is highly preferred from a data point of view, matrix dosing has presented many challenges in implementation in medium-high-throughput formats using pipetting-based serial dilutions and compound transfers (discussed below). In contrast, acoustic dispensing (ADE) enables the transfer of precise nanoliter volumes of reagents, including compounds dissolved in DMSO, to any well in an assay plate. Dose–response curves can thus be produced without serial dilution, removing constraints on the physical layout of the sample on the plate. Figure 2 illustrates a simple way of reorganizing a dose matrix into a footprint compatible with a 384-well assay plate. Avoiding tip-based serial dilution has also been shown to improve the accuracy and precision of dose–response curves.18,19 In addition, there are several other advantages to acoustic transfer, including cost savings on labware and reduced sample requirements. 19
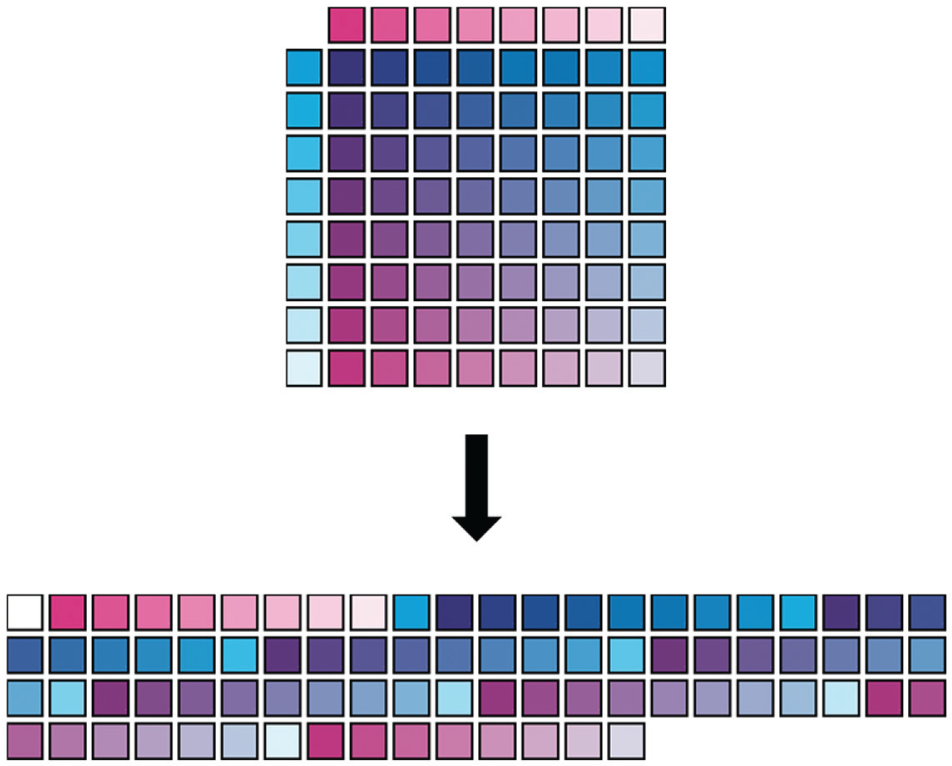
Transformation of a 9×9 dose matrix scheme (Drug 1, magenta; Drug 2, cyan; intensity proportional to log concentration) to fit efficiently in a 384-well assay plate.
Another technical challenge when carrying out combination experiments with a full dose matrix design is the ability to analyze the complex dataset. Required steps include mapping each well to two sample IDs and concentrations, fitting two series of dose–response curves along the rows and columns of the matrix. Then, it is necessary to calculate the expected values for each well and/or curve based on the chosen no-interaction model and the difference between expected and observed values. Data analysis tools integrated in Genedata Screener (Genedata, Basel, Switzerland) are used to efficiently deconvolute the combination compound mapping scheme and calculate compound potency and synergy metrics.
Experimental Methods
Cell Assays
All cell lines were obtained from the ATCC (Manassas, VA). Cell line identity was verified internally by short tandem repeat (STR) profiling. Cells were maintained in growth medium comprising RPMI (Invitrogen; Carlsbad, CA), 10% fetal bovine serum (Sigma-Aldrich; St. Louis, MO), and 1× GlutaMAX (Invitrogen). Exponentially growing cells were harvested by trypsinization and seeded in 384-well plates in growth medium at a density of 2000 cells/well in 50 µl. Plates were incubated at room temperature for 20 min to allow uniform distribution, then 37 °C for 2 h prior to compound addition.
For compound treatment, a single source plate (P-05225; Labcyte, Sunnyvale, CA) was set up with two concentrations (200-fold and fourfold the top final concentration) in 100% DMSO of each of the three drugs as well as DMSO-only wells for backfill ( Fig. 3B ). A .csv pick list file was created with headers specifying barcode, row, and column for both source and destination plates as well as the transfer volume in nanoliters. This file is used in the Echo cherry-pick application to direct compound and DMSO transfers by the Echo 555 liquid handler (Labcyte). For each well, a total of 250 nl compound/DMSO was transferred to 50 µl of cells, resulting in a final DMSO concentration of 0.5%. Because this protocol consumes 6.2 µl/plate from the Compound 1 high-concentration source well, three destination plates could be generated before replenishment of the source plate.
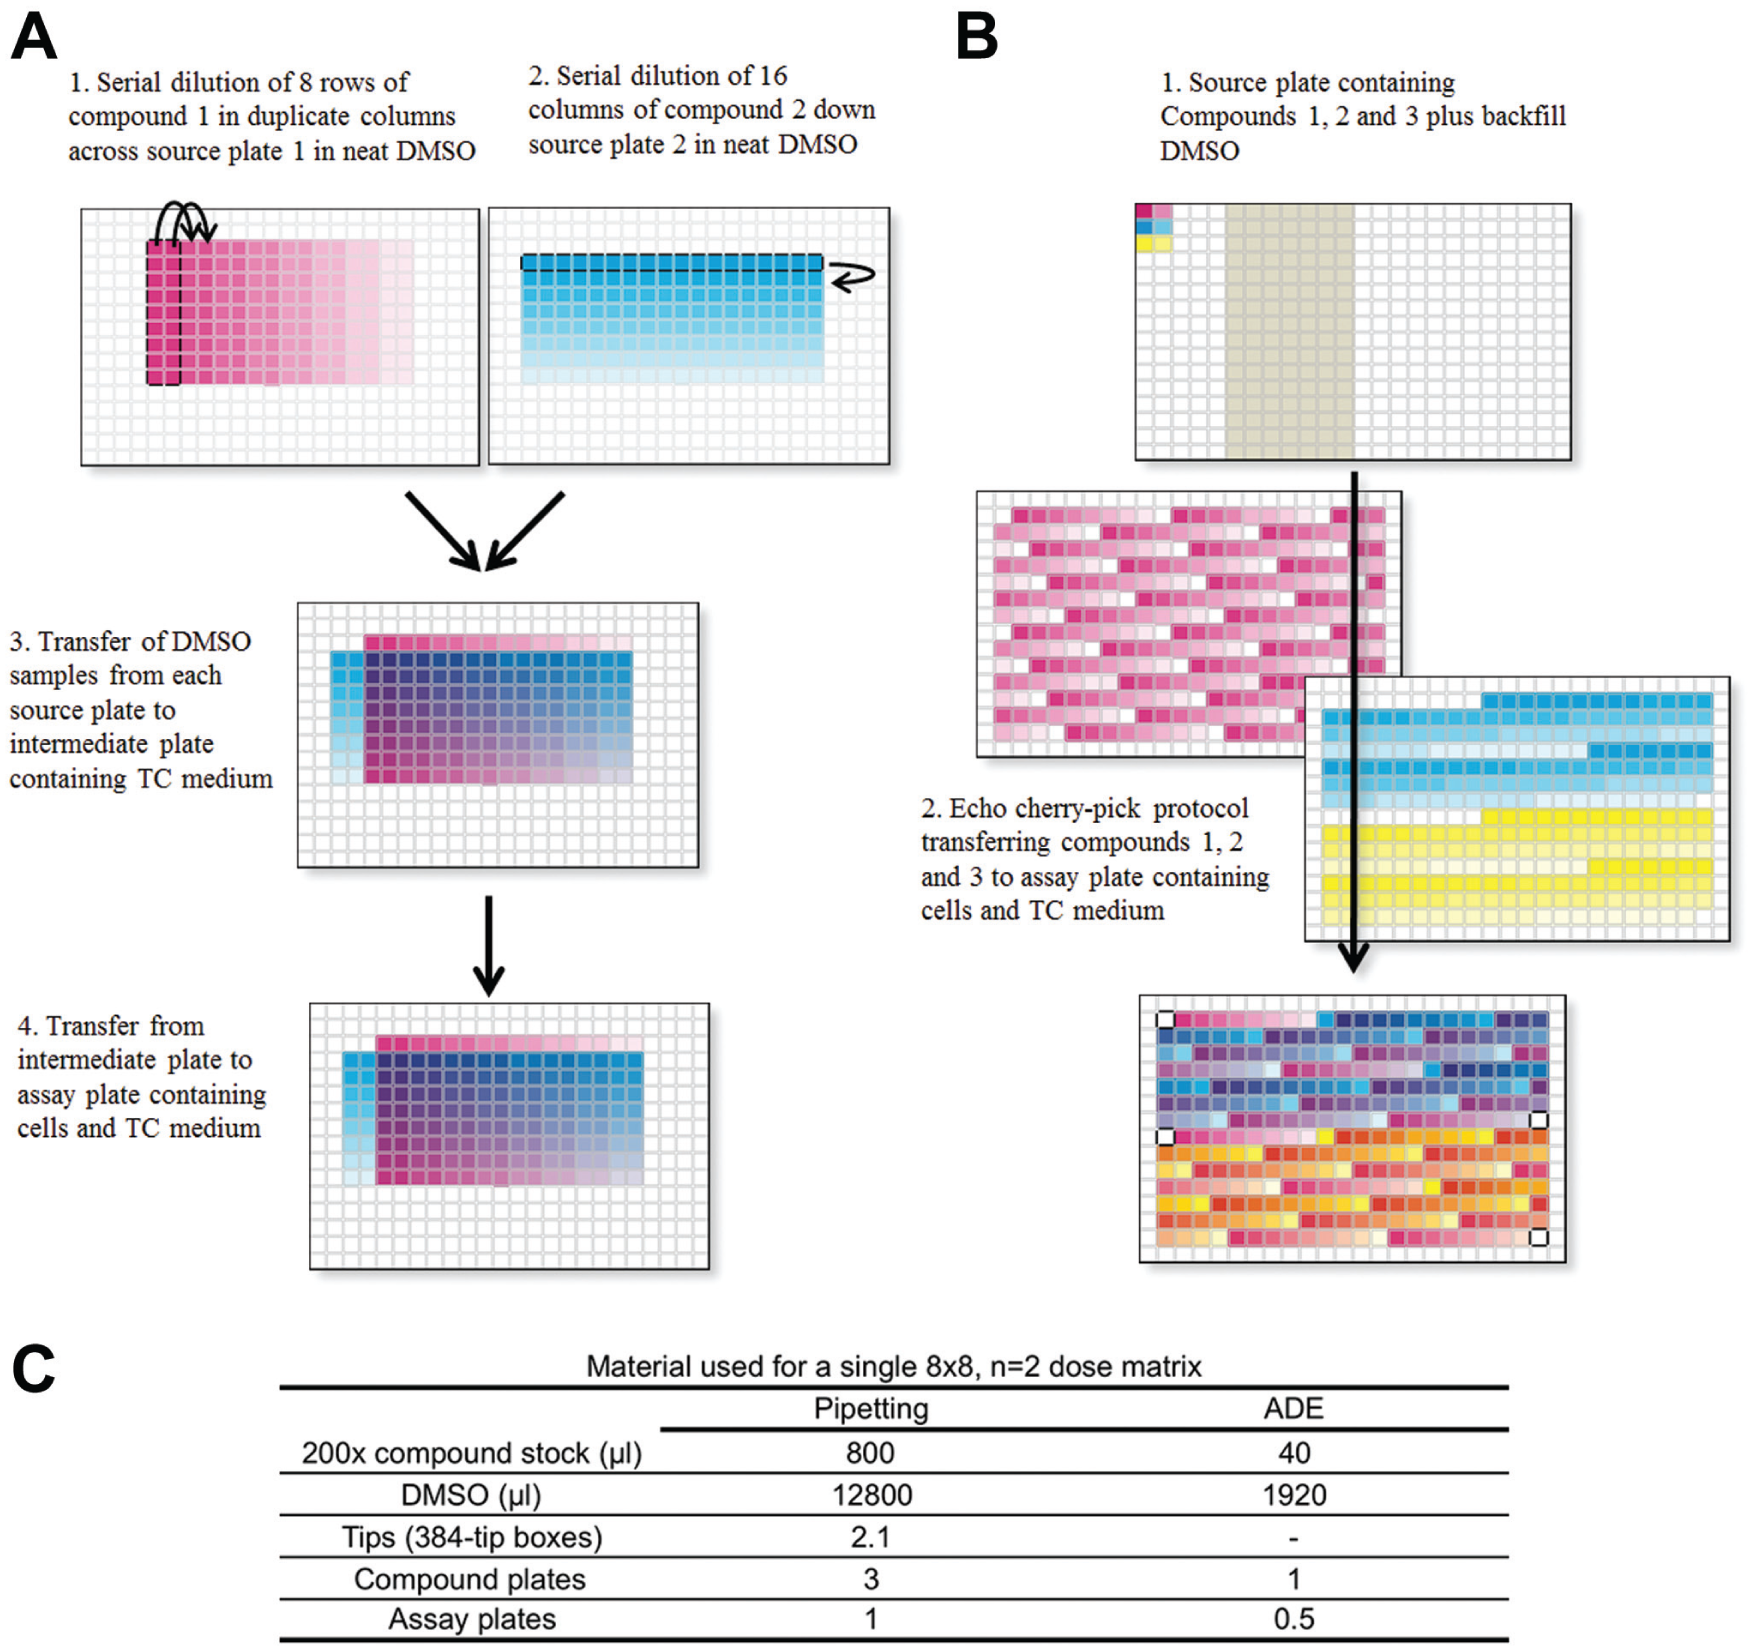
Comparison of pipetting-based and acoustic-dispensing workflows for generation of an 8×8 n = 2 dose matrix. (
Approximately 48 h after compound addition, 5 µl of 200 µM 5-ethynyl-2′-deoxyuridine (EdU) in growth medium was added to all wells, and plates were returned to the incubator. After 30 min, cells were fixed by the addition of 25 µl of 6% formaldehyde in phosphate-buffered saline (PBS), incubation at room temperature for 30 min, washing 3× with PBS, and then permeabilization with 0.5% Triton X-100 for 20 min. Incorporated EdU was labeled with Alexa Fluor 647 azide (Life Technologies, Madison, WI) according to the manufacturer’s instructions, and cells were then stained with 5 µg/ml Hoechst 33342. EdU-labeled cells were detected using an Opera high-content imaging system (Perkin Elmer, Waltham, MA). The number of EdU-positive cells (based on per-cell mean intensity greater than a user-defined threshold) and total number of cells based on Hoechst staining were quantitated per well using the Columbus image analysis package (Perkin Elmer).
Data Analysis
Data for the percentage of EdU-positive cells were entered into Genedata Screener and normalized as a percentage change from DMSO control well values. Compound IDs and concentrations were applied using a compound mapping table (cmt) file derived from the Echo transfer log file. Dose–response curves were fitted with Genedata Screener using a four-parameter Hill fit with automated outlier detection and all parameters floating with a constraint on maximal effect ≥−100% activity. Based on these fits, the predicted additive response for each matrix was calculated according to the Loewe additivity model implemented in Genedata Screener Compound Synergy Extension. Synergy scores were determined as a weighted sum of the values in excess of the predicted additive effects. 20 Because the data were initially normalized and fit such that decreases in signal corresponded to negative percentage activity, the sign of the synergy score was converted from a negative value to positive for further analysis.
Results and Discussion
Design of Optimal Layouts Enabled by Acoustic Dispensing
We wished to assess combinations of ERK and MEK kinase inhibitors for antiproliferative efficacy on a panel of cancer cell lines. Because we did not have prior knowledge of EC50s for the individual inhibitors against each of the cell lines, it was necessary to dose the inhibitors as a two-way serial dilution matrix.
Before using acoustic dispensing, our initial experimental design for a two-way serial dilution dose–response matrix in 384-well format used the Agilent Bravo pipetting system. The process is shown in Figure 3A . Serial dilutions requires two separate source plates, transfer to an intermediate dilution plate, and then transfer to the assay plate to generate one dose matrix per plate. This format provided duplicate 9×9 matrices for a single compound combination, including single-agent curves, using 172 wells of the 384-well plate. This process had several limitations: (1) time; (2) compound and reagent usage, as summarized in Figure 3C ; (3) intermediate dilution greatly increases the chance of compound precipitation; and (4) inefficient use of plate space. A further disadvantage inherent in this physical format is that it is aligned with the plate geometry, with single-agent curves lying closest to the edge of the plate and thus most susceptible to edge effects. Therefore, any positional effects related to the proximity to the edges of the plate would directly overlay and confound analysis of the dose–response matrix.
To avoid these issues and increase efficiency, we evaluated the use of direct acoustic transfer. 21 This method avoids the requirement for pipetting-based serial dilution and transfer, and the need for an intermediate source plate, but an even more important consideration is that it removes constraints on the physical sample layout; serial dilutions no longer need to be in adjacent wells ( Fig. 2 ). This freedom not only avoids the potential for positional artifacts to be aligned with dose–response curves, but also eliminates the waste of space arising from the need to fit a 9×9 or 9×18 grid on a 16×24-well plate. Figure 3B shows the experimental design that we implemented using the Echo cherry-pick application. A potential remaining issue with this layout is the location of all DMSO-only control wells near the perimeter of the plate, which could cause edge effects to interfere with accurate normalization. However, taking advantage of the flexibility with which layouts can be modified using ADE, a revised layout with control wells dispersed throughout the plate is a practical solution for future work. The use of acoustic dispensing also provided the advantage of avoiding potential artifacts arising from pipetting-based compound transfer and dilution 19 and the potential for compound precipitation during an intermediate dilution step.
This protocol was used to transfer compounds from source plates containing two dilutions of neat DMSO stock of each compound, along with DMSO-only wells for backfill. A single pick-list file was used that directed the transfer of each compound as well as the addition of DMSO to maintain a final concentration of 0.5% in all wells. The compounds were directly transferred by ADE to 384-well plates containing cells seeded in 50 µl of growth medium. As has been previously discussed, it is possible to invert cell assay plates containing 50–60 µl of growth medium and transfer DMSO without spillage of contents or damage to the cell monolayer. 22 The resulting assay plate contained dose–response matrices starting at up to 25 µM for each compound with 0.5% DMSO.
Cell Panel Profiling of ERK and MEK Inhibitor Combination Effects
The assay setup and data analysis workflows described above enabled a combination screening platform to test a set of ERK–MEK combinations against a panel of cancer cell lines. Cells transformed by activating mutations of B-RAF or Ras are known to undergo a cytostatic, rather than cytotoxic, response to treatment with MEK and ERK inhibitors.23,24 A robust assessment of synergy using the additivity–independence models described above requires that the assay readout has well-defined values for Emin (no drug control) and Emax (maximal-effect control). To sensitively detect inhibition of proliferation, we used EdU labeling of newly synthesized DNA combined with click chemistry-mediated labeling 25 rather than a metabolism-based measurement such as adenosine triphosphate, which does not accurately measure the magnitude of antiproliferative effects. 24 Image-based quantitation of the fraction of EdU-positive cells, which eliminated error arising from variations in cell number dispensed per well, further increased the quality of the data.
Cells were treated with combinations of different ERK and MEK inhibitors using the acoustic-dispensing scheme described above. Each experiment also included a sham control (discussed below), in which the same MEK inhibitor was used in both axes of the dose matrix. After 48 h of compound treatment and a 30-min EdU pulse, high-content imaging and analysis were used to determine the fraction of EdU-labeled cells. These data, normalized with respect to DMSO-only wells, were used for dose–response and synergy analysis.
Data were analyzed using Genedata Screener compound synergy extension (CSE) software module. A key step in the data analysis is the ability to map two compound IDs and concentration values to each well, which is achieved by transforming the Echo transfer log to a Genedata .cmt format file. The Genedata CSE software performs four-parameter EC50 fits for each dilution series (
Fig. 4A
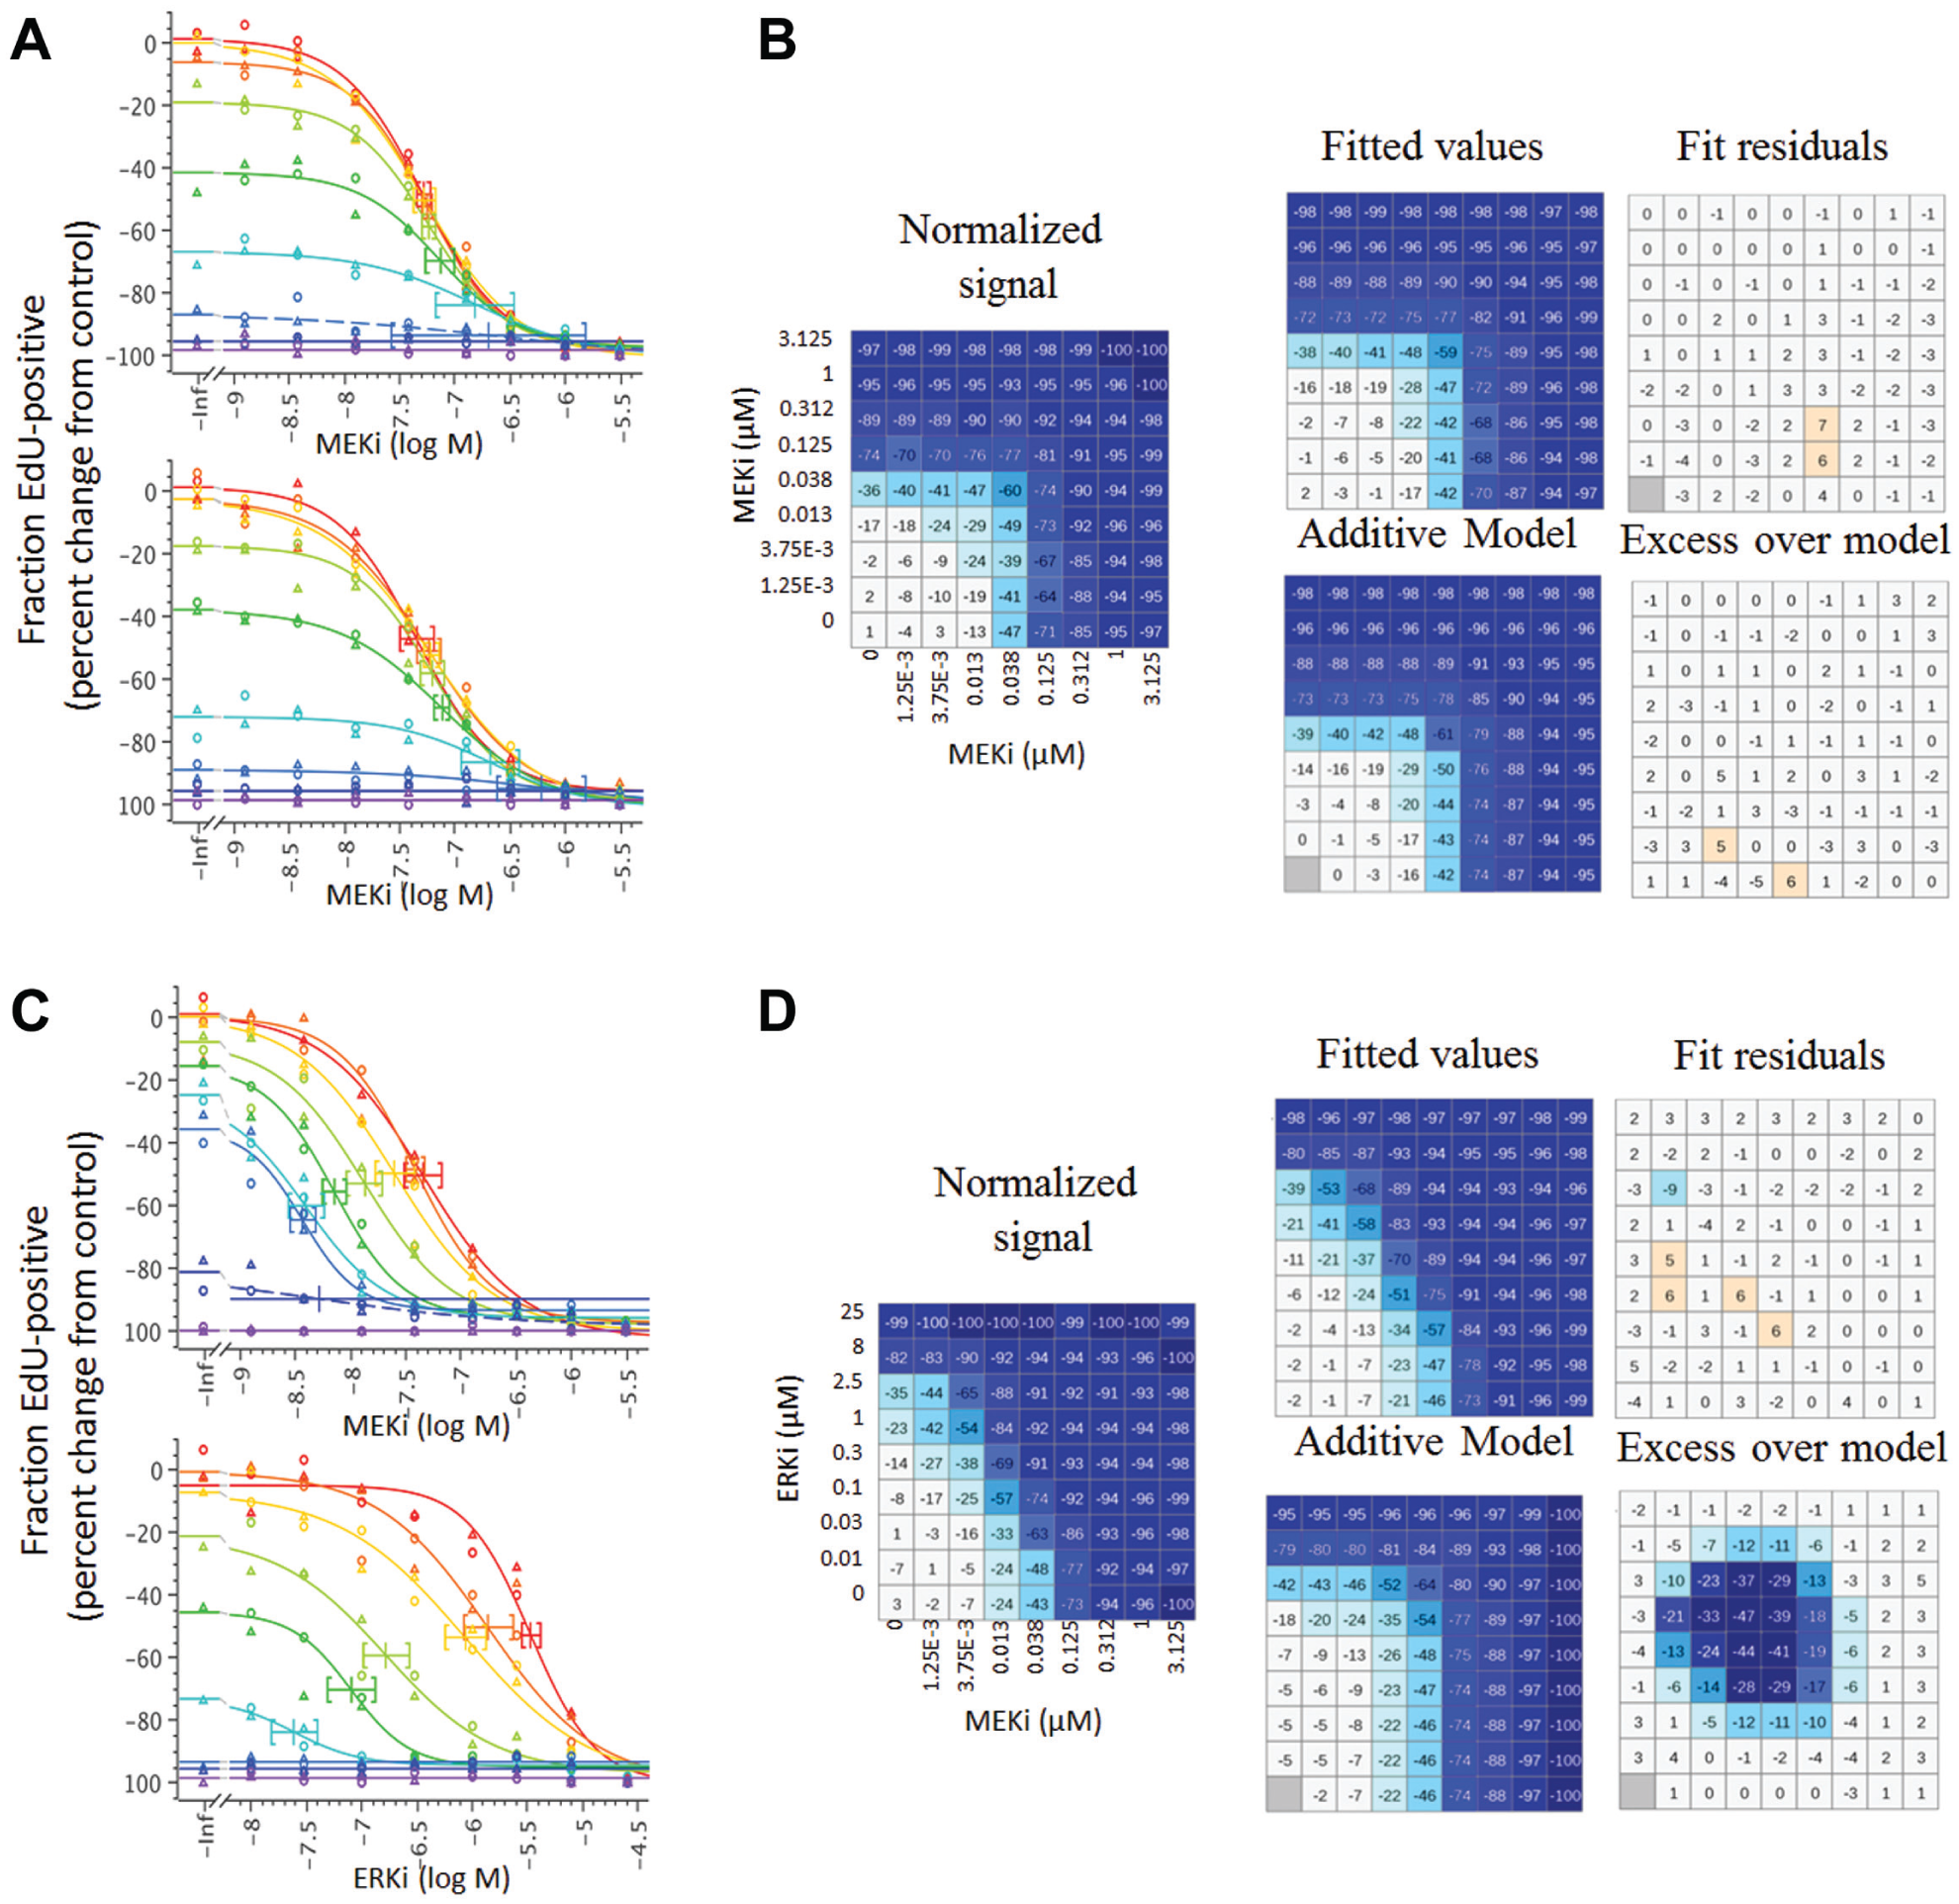
Example of synergy analysis for sham control (
The key validation and QC control for the determination of synergy is the behavior of the sham control. By definition, a compound combined with itself shows strictly additive effects, and thus any valid synergy metric should equal zero. Figure 4A shows curves and synergy analysis for an example of the sham control, compared to a synergistic ERK inhibitor–MEK inhibitor combination ( Fig. 4B ). Figure 5 shows the resulting synergy scores, generated using the Loewe additivity model, for the MEK inhibitor sham control in the panel of cell lines tested. Although different cell lines have varying sensitivities and responses to the MEK inhibitor, the control data conform very closely to the predicted values for compound additivity. In contrast, when MEK and ERK inhibitors are combined, the observed effects were in many cases significantly greater than predicted, resulting in positive synergy scores ( Fig. 5 ). The reproducibility of synergy scores was determined by independent replication of a subset of cell lines, and, as illustrated in Figure 5 , the effects were reproducible.
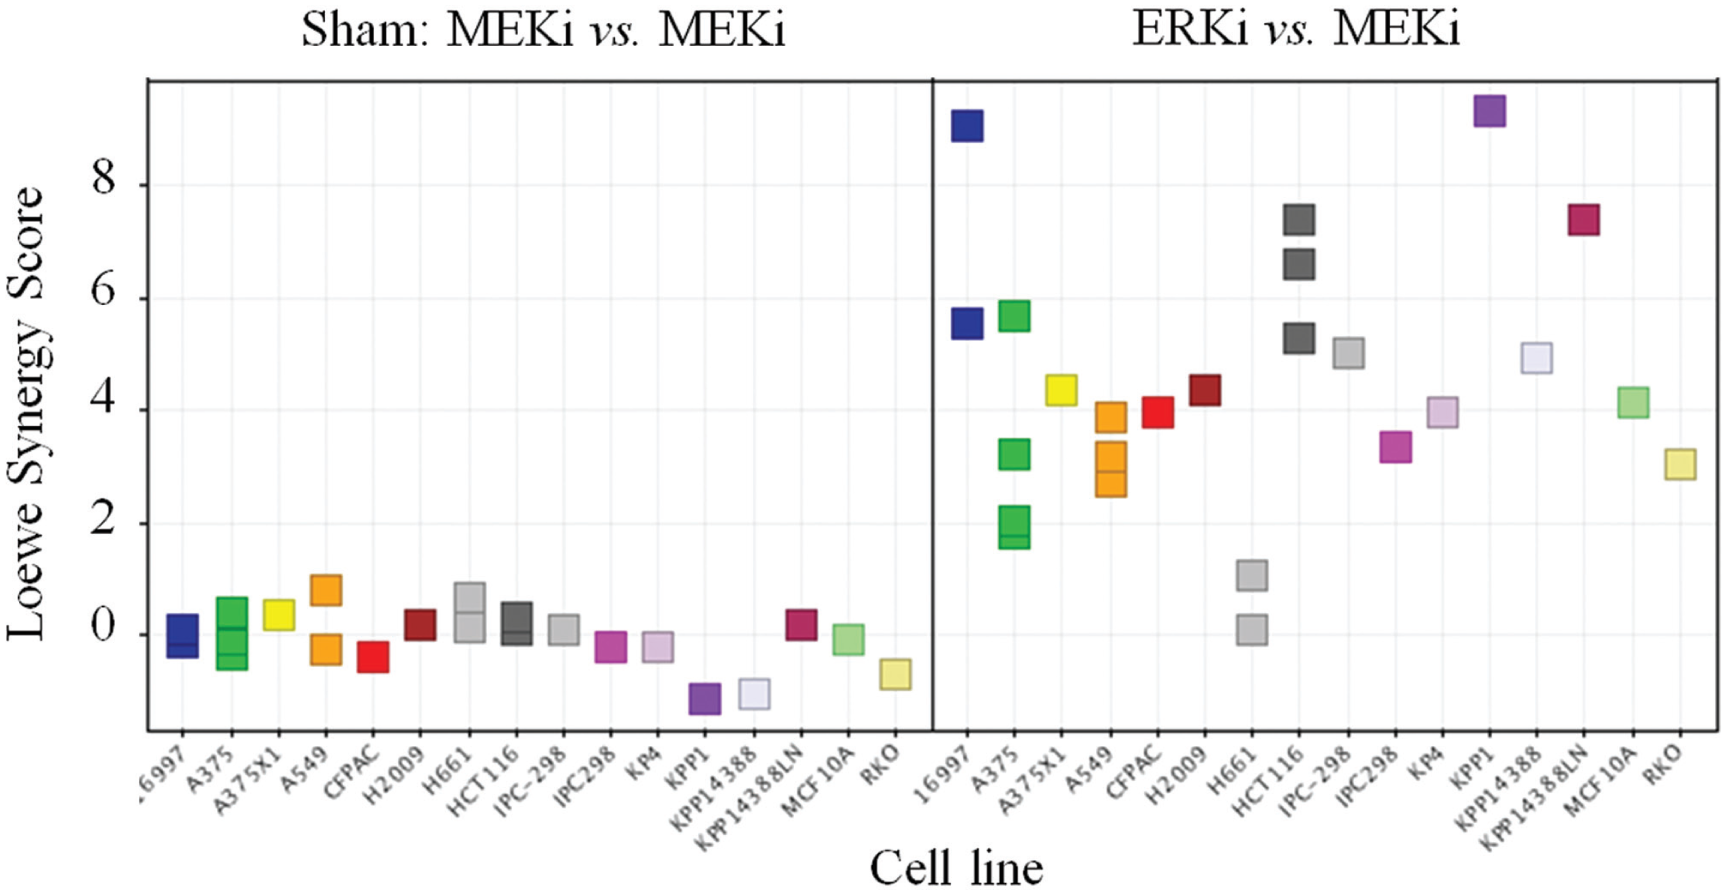
Synergy assessment for combined ERK and MEK kinase inhibitors in a panel of 16 cell lines. The left panel shows synergy scores (see Methods) for each cell line tested with the sham control combination of MEK inhibitor combined with itself. The right panel shows synergy scores for the combination of ERK inhibitor and MEK inhibitor. Replicate points are from experiments run on different days.
This cell panel screen confirmed previous empirical observations of synergistic actions, and provided robust quantitative measures of the degree of synergy, which varies according to the cell line tested. These data are enabling further studies of the mechanisms of synergistic activity of on-pathway combinations of targeted agents for mechanistic understanding and potential diagnostic hypothesis. The throughput enabled by automation of compound transfer, proliferation assay, and data analysis has enabled routine high-throughput screening of other drug combinations.
Conclusions
Assessment of drug combinations for synergy is an extremely important component of drug discovery and development. The logistics of experimental setup of two-drug treatment schemes has in the past significantly limited the use of robust experimental designs. Consequently, studies of compound synergy are often nonquantitative or unreliable, and there has been little consensus on the optimal practically achievable experimental design and data analysis methods.
Acoustic dispensing is in many ways the key to unlocking the potential of high-throughput dose matrix assays. Combined with robust and scalable data analysis tools, it is now possible to develop large, quantitative datasets of compound–compound interactions. This will be of value in understanding the biological effects of targeted drugs, and the identification of both drug combinations and patient populations for clinical development of better therapeutics in cancer and other areas.
Footnotes
Disclosures
All authors are employees of Genentech, a member of the Roche Group. All authors own stock in Roche Inc.
Declaration of Conflicting Interests
The authors declared no potential conflicts of interest with respect to the research, authorship, and/or publication of this article.
Funding
The authors received no financial support for the research, authorship, and/or publication of this article.