
Abstract
The hemagglutination inhibition (HAI) assay quantifies the level of strain-specific influenza virus antibody present in serum and is the standard by which influenza vaccine immunogenicity is measured. The HAI assay endpoint requires real-time monitoring of rapidly evolving red blood cell (RBC) patterns for signs of agglutination at a rate of potentially thousands of patterns per day to meet the throughput needs for clinical testing. This analysis is typically performed manually through visual inspection by highly trained individuals. However, concordant HAI results across different labs are challenging to demonstrate due to analyst bias and variability in analysis methods. To address these issues, we have developed a bench-top, standalone, high-throughput imaging solution that automatically determines the agglutination states of up to 9600 HAI assay wells per hour and assigns HAI titers to 400 samples in a single unattended 30-min run. Images of the tilted plates are acquired as a function of time and analyzed using algorithms that were developed through comprehensive examination of manual classifications. Concordance testing of the imaging system with eight different influenza antigens demonstrates 100% agreement between automated and manual titer determination with a percent difference of ≤3.4% for all cases.
Introduction
Influenza hemagglutinin (HA) is a virus surface glycoprotein that readily binds to sialic acid receptors on the membranes of red blood cells (RBCs). Sufficient quantities of HA will cause RBCs to clump together, or agglutinate. However, RBC binding is inhibited when influenza antibodies bind to antigenic sites on the HA molecule. This property was exploited by Hirst 1 and Salk 2 in developing the hemagglutination inhibition (HAI) assay to identify influenza field isolates. HAI antibody titers are recognized as a relevant surrogate marker of protection in populations vaccinated with the current flu vaccines. The HAI assay is also strain specific, straightforward to perform, reliable, and relatively inexpensive. For these reasons, the HAI assay is presently the method of choice to measure antibodies against the HA protein and is a pivotal serology test advised by health authorities to assess flu vaccine immunogenicity.3–6 With increasing testing requirements related to major influenza vaccine initiatives, there is a need to improve the efficacy and throughput of HAI systems and methods.7–9 The need is further warranted when considering the testing requirements of the multitude of different pathogenic hemagglutinin-containing viruses, including adenoviruses, enteroviruses, reoviruses, myxoviruses, poxviruses, and flaviviruses, which cause a wide spectrum of human and animal illnesses, from influenza and rubella to smallpox and Dengue hemorrhagic fever.10,11
The main steps of the HAI assay include mixing a standardized dose of four hemagglutination units (HAU) with serially diluted antisera in microtiter plates and then, following the serum–antigen incubation, addition of RBCs to determine the degree of agglutination, and hence specific binding of antibody to the HA molecule. The results at the assay endpoint are typically read manually through visual inspection of the RBC streaming patterns. This subjective readout is one of the main drivers for automation of the procedure because it requires highly trained analysts to tediously inspect potentially thousands of patterns per day. In addition, once analysts record the sample titer values, the assay plates are typically discarded without generating a permanent image. This lack of raw data or visual record prevents postassay data review.
The reading step of some HAI assay variations requires keeping the plates flat and comparing RBC “buttons” to “halos,” which represent nonagglutinated and agglutinated states, respectively. However, regulatory agencies often recommend HAI assays that require tilting the plates for the reading step to determine the highest serum dilution that results in complete inhibition of hemagglutination. 12 This RBC streaming affords an additional parameter by which to assess the agglutination state of the wells within the assay plate and effectively increases assay sensitivity. Tilting, however, introduces further complexity to the assay in that the development rate is significantly increased compared to flat-plate imaging. This requires analysts to assess rapidly varying RBC patterns within a narrow read window, which can lead to increased assay variation.
Tilting also introduces a number of design considerations for an automated imager. For one, all of the plate wells must be imaged simultaneously as opposed to individually to capture their streaming RBC patterns at the same point in time. The imaging system must therefore be able to capture all wells in a single image with minimal parallax distortion. The time post tilting at which the images are taken must also be closely monitored to coincide with the optimal read time as defined by the assay control wells. This time can be on the order of minutes, so to satisfy throughput requirements, multiple plates need to be tilted and developed simultaneously. The need to image plates while tilted further complicates the optical train and plate-handling system.
We describe an HAI imaging solution called the High-Throughput Imaging and Visualization Equipment (HIVE) T670, which is a standalone system that eliminates analyst subjectivity by automating the assay readout using computer vision and image processing and automatically assigns titer values for any sample, independent of the virus strain of interest. The automated HIVE was developed to reduce the potential for human error in the manual reading method, create a visual record (electronic documentation) of the HAI results, and reduce the labor hours for the HAI reading step. The system creates an archive of HAI plate images to serve as raw data that can be evaluated post assay, with a throughput capability that exceeds manual analysis. The key areas of focus for developing the HIVE hardware were the optical train and the plate-handling system. In specific, the HIVE was designed to (1) process up to 100 plates per hour; (2) tilt assay plates during imaging for increased sensitivity; (3) integrate with industry-standard plate-handling devices to facilitate loading and unloading; (4) perform full-plate imaging for true kinetic analysis; and (5) have a small footprint and fit on a standard lab bench. The integrated software was designed to provide real-time image processing for immediate analysis and titer determination from the acquired images.
Materials and Methods
Hemagglutination Inhibition Assay
The HAI assay was performed in 96-well V-bottom microtiter plates (Nunc #249570) in two independent assay runs. A panel of 30 paired sera samples was obtained from healthy adult volunteers before and after vaccination with the 2012–2013 NH influenza vaccine. On day 1, nonspecific inhibitors were eliminated from the test sera by treating with a neuraminidase solution and incubating in a water bath for approximately 18 h at 37 °C (±1 °C). On day 2, the sera samples were heat-inactivated for 30 min at 56 °C (±1 °C), and nonspecific agglutinins were adsorbed from the sera using turkey red blood cells (TRBCs) (Lampire, catalog #7720058). After a 2-h incubation period at 2–8° C, the TRBCs were removed through centrifugation. On day 3, titration of the influenza antigen was performed to ensure a target value of 4 HAU/25 µL for use in the HAI assay. Influenza antigens for this study included A/Texas/50/2012 [H3N2], A/California/07/2009 [H1N1], A/Victoria/361/2011 [H3N2], A/Victoria/210/2009 [H3N2], B/Massachusetts/02/2012, ether-treated B/Massachusetts/02/2012, B/Brisbane/60/2008, and ether-treated B/Brisbane/60/2008. Once the antigen titer was verified, the treated sera samples were serially diluted in PBS and combined with the 4 HAU/25 µL antigen. Serum-only (i.e., no antigen present) virus and RBC control wells were also established at this point for later use as a gauge for the optimal read time. After a 1-h incubation at 37 °C (±2 °C), a TRBC suspension was added to all wells and the plates were incubated for an additional 1 h at ambient temperature.
Titer Determination
Following the final assay incubation, manual and automated titer determination were conducted in parallel by gently tilting the plate to 70° on the HIVE Imager. For manual titer determination, an analyst monitored a live video feed from the HIVE to assess the agglutination state in real time and recorded titers for each sample dilution once the RBC control wells (negative controls) exhibited streaming to the edge of the well, which produced a “foot” pattern. Nonagglutinated well patterns streamed at the same rate as the RBC controls and had clear supernatant. Agglutinated well patterns did not flow at the same rate as the RBC control due to hemagglutination. The HAI titer was assigned as the reciprocal of the highest serum dilution that exhibited complete inhibition of hemagglutination. The Lower Limit of Quantitation (LLOQ) of the assay is 10. If the first serum dilution exhibited hemagglutination, the serum antibody titer was reported as <10. If the last serum dilution exhibited complete inhibition of hemagglutination, the serum antibody titer was reported as ≥10,240. Assay validity criteria included evaluation of positive control reference sera to ensure it titrated within a preestablished range and evaluation of serum-only controls to ensure they did not exhibit signs of agglutination in the absence of virus. The HIVE performed automated titer determination by simultaneously capturing digital images of the same HAI plates and then performing image analysis.
HIVE T670 Imager
The HIVE T670 is a standalone system for automatic HAI titer determination ( Fig. 1 ). It images HAI plates using a high-resolution charge-coupled device (CCD) camera attached to a telecentric lens that provides a low-distortion image with minimal parallax error and sufficient field of view to encompass the entire plate. Plates are imaged from the bottom while tilted at a 70° angle and transilluminated by a highly uniform LED backlight. An adjustable turning mirror positioned between the lens and the HAI plate reduces the overall footprint of the instrument by folding the optical path. The HIVE T670 can process up to six HAI plates simultaneously using six individually addressable tilting plate holders mounted to a rotating carousel that cycles plates from a load–unload position to an imaging position and back. An integrated plate stacker transfers plates to the load–unload position at a rate of up to 100 plates per hour under normal operating conditions. All motion and camera operations are controlled via the image acquisition component of the HIVE software that schedules and performs runs based on user-provided input parameters.
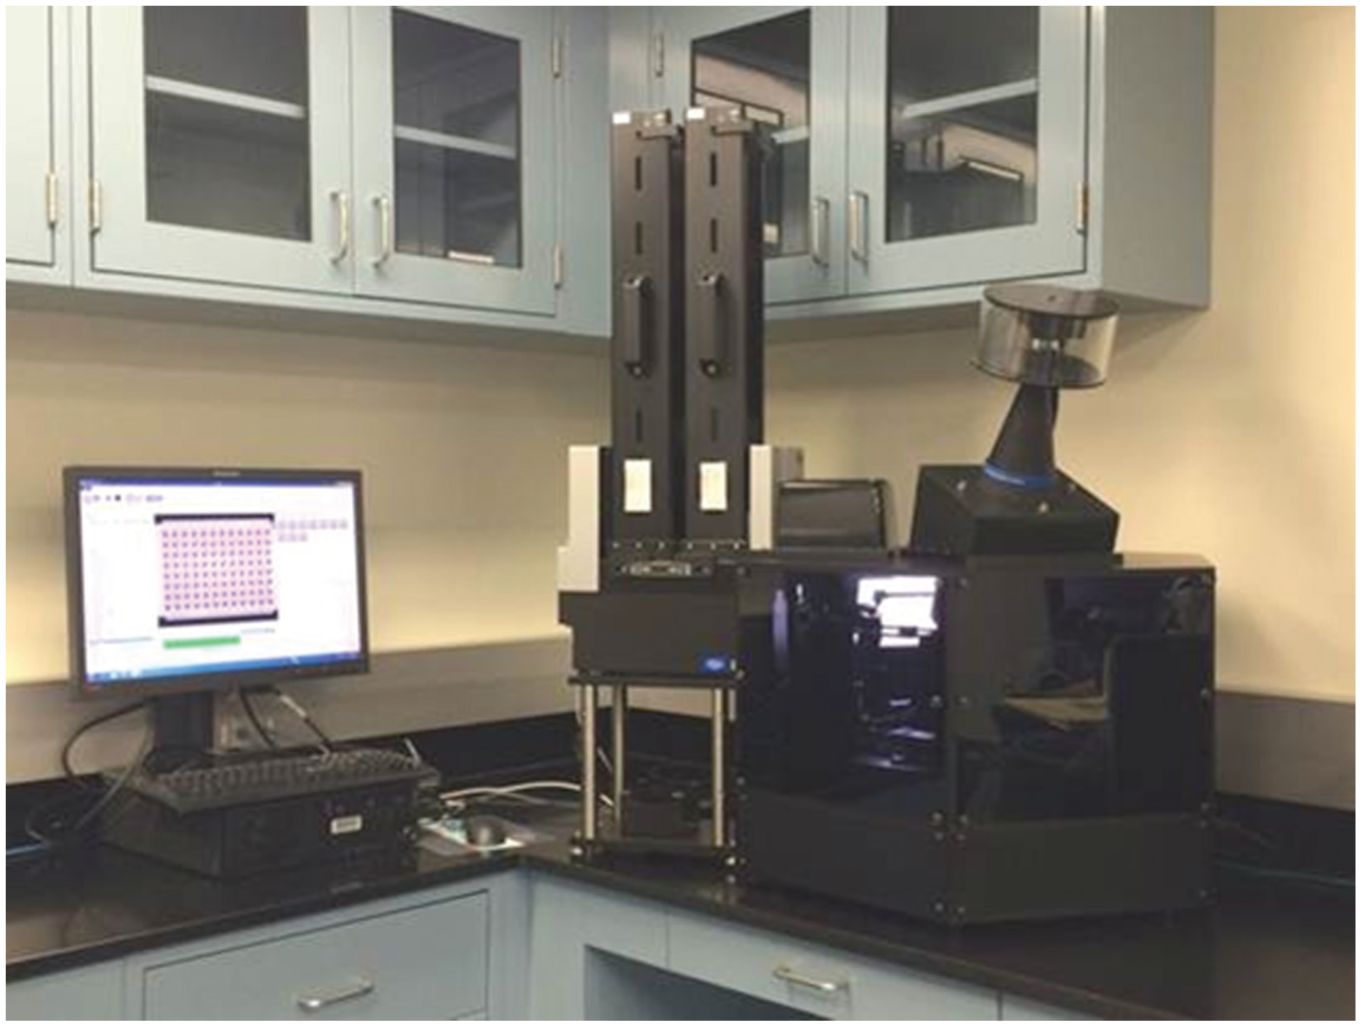
HIVE T670 Imager.
HIVE Software
The HIVE software is a complete package for acquiring and analyzing HAI plate images as well as managing related data and generating reports. Automated titer determination was accomplished using two main subcomponents of the software, namely, the image acquisition and image analysis interfaces.
Image Acquisition
The image acquisition component of the HIVE software acquires whole-plate images at user-specified time points and saves the images along with their metadata in a relational database. Image acquisition run timing is carefully controlled by an integrated scheduler. The scheduler accepts user input on desired plate-imaging kinetics such as development time, imaging time window, imaging interval, and number of plates, and a schedule containing the optimal motion control operations to achieve the user’s request is generated. The generated schedule is then used to control the motion and imaging hardware during a run. The development time, imaging time window, and imaging interval used for this study were 120 s, 30 s, and 10 s, respectively, for all plates and samples. This produced three kinetic images for each plate at approximately 100, 110, and 120 seconds post tilting to ensure the RBC stream was captured at the optimal read time.
Image-Processing Algorithm
The image-processing algorithm segments and evaluates each individual well pattern in the whole-plate image and determines its agglutination state. Once the agglutination state is determined for each well on the plate, titer values are assessed for the corresponding samples. A sequential timeline for the process steps in the image-processing algorithm and a flow chart describing the process is shown in Figure 2 .
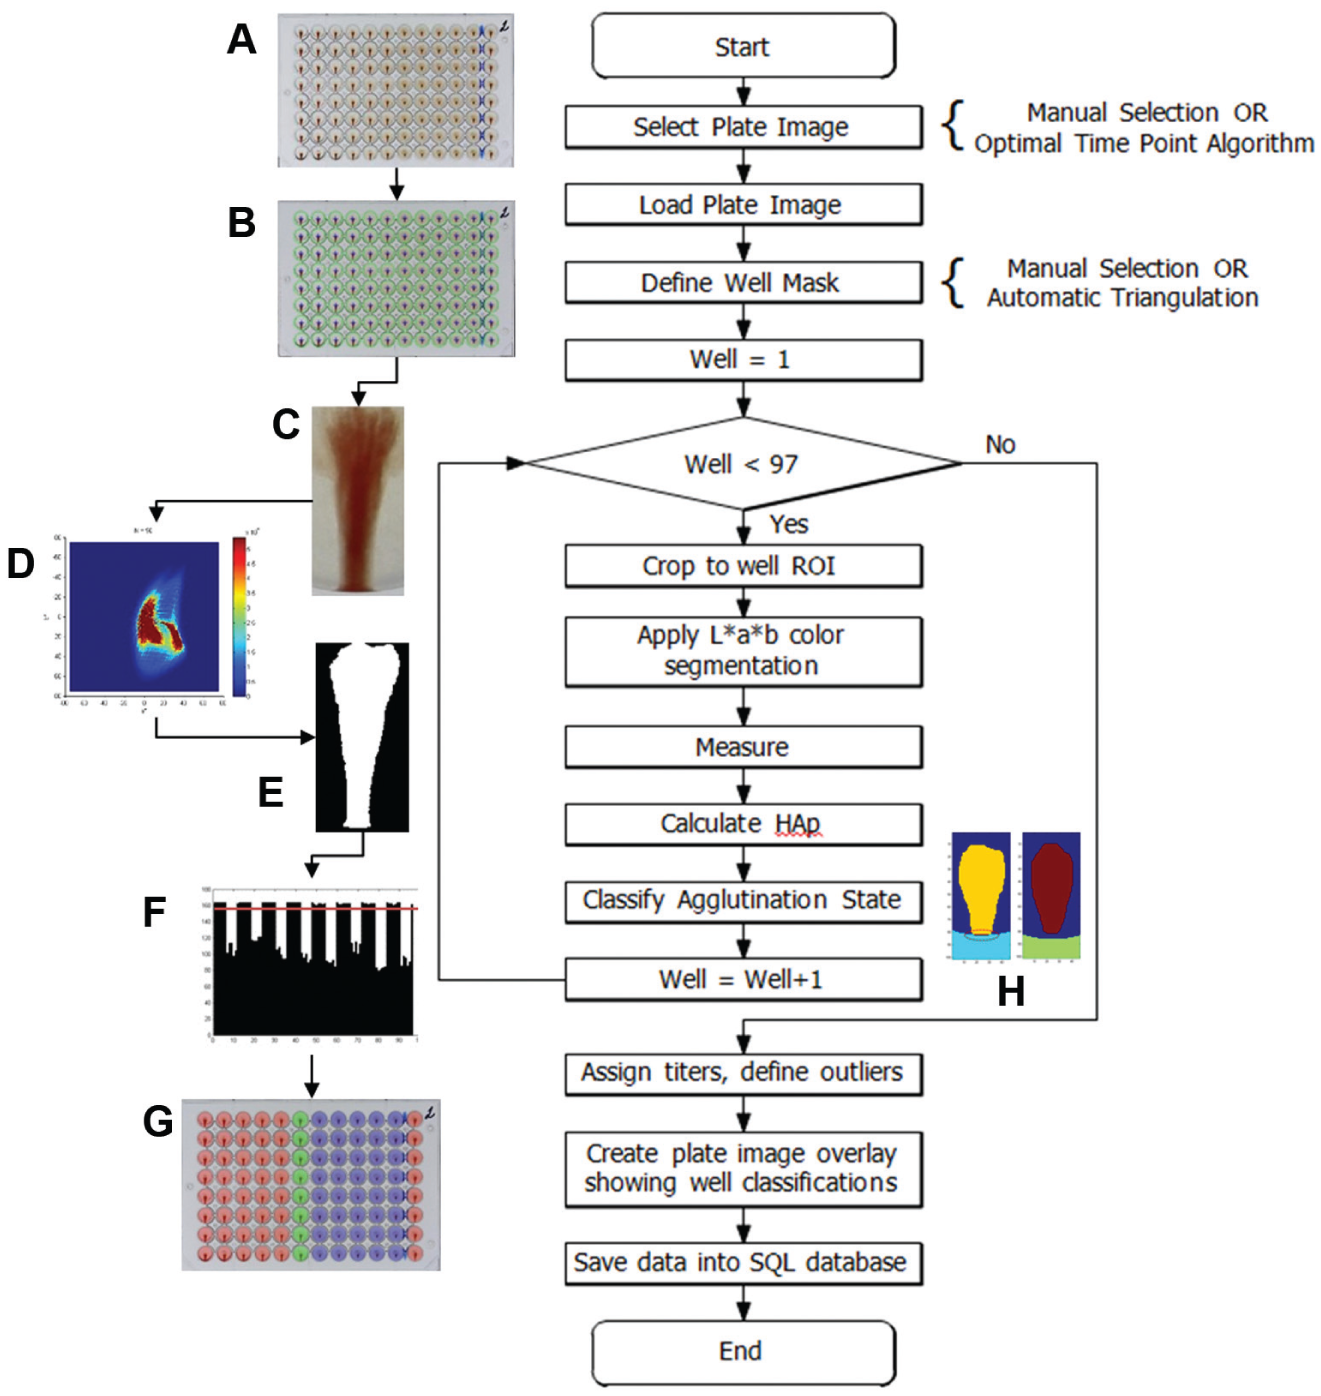
Image-processing algorithm for a 96-well hemagglutination inhibition (HAI) plate. (
Kinetic Image Selection
The first step was to select the image for processing. In this study, HAI plates were imaged at three time points (approximately 100, 110, and 120 s) after tilting to capture the RBC streaming kinetics. The image to be analyzed was selected from this collection of kinetic images using an algorithm that determines the image that was acquired closest to the optimal read time. This optimal time point algorithm automatically determines the optimal image using image processing to analyze and compare the control well patterns to a reference pattern. Once the optimal plate image was determined, it was loaded into the image-processing algorithm for further analysis.
Defining Well Locations
The locations of individual wells in the whole plate image were determined by an image-processing algorithm ( Fig. 3 ) that iteratively calculates the centroids and radii of wells A1, A12, and H12 by applying a circular Hough transform to a region containing the well.13,14 The algorithm also inherently compensates for slight shifts or rotations of the plate during image acquisition. The found centroids and radii were then used to calculate the radii and centroids of the remaining wells on the plate.
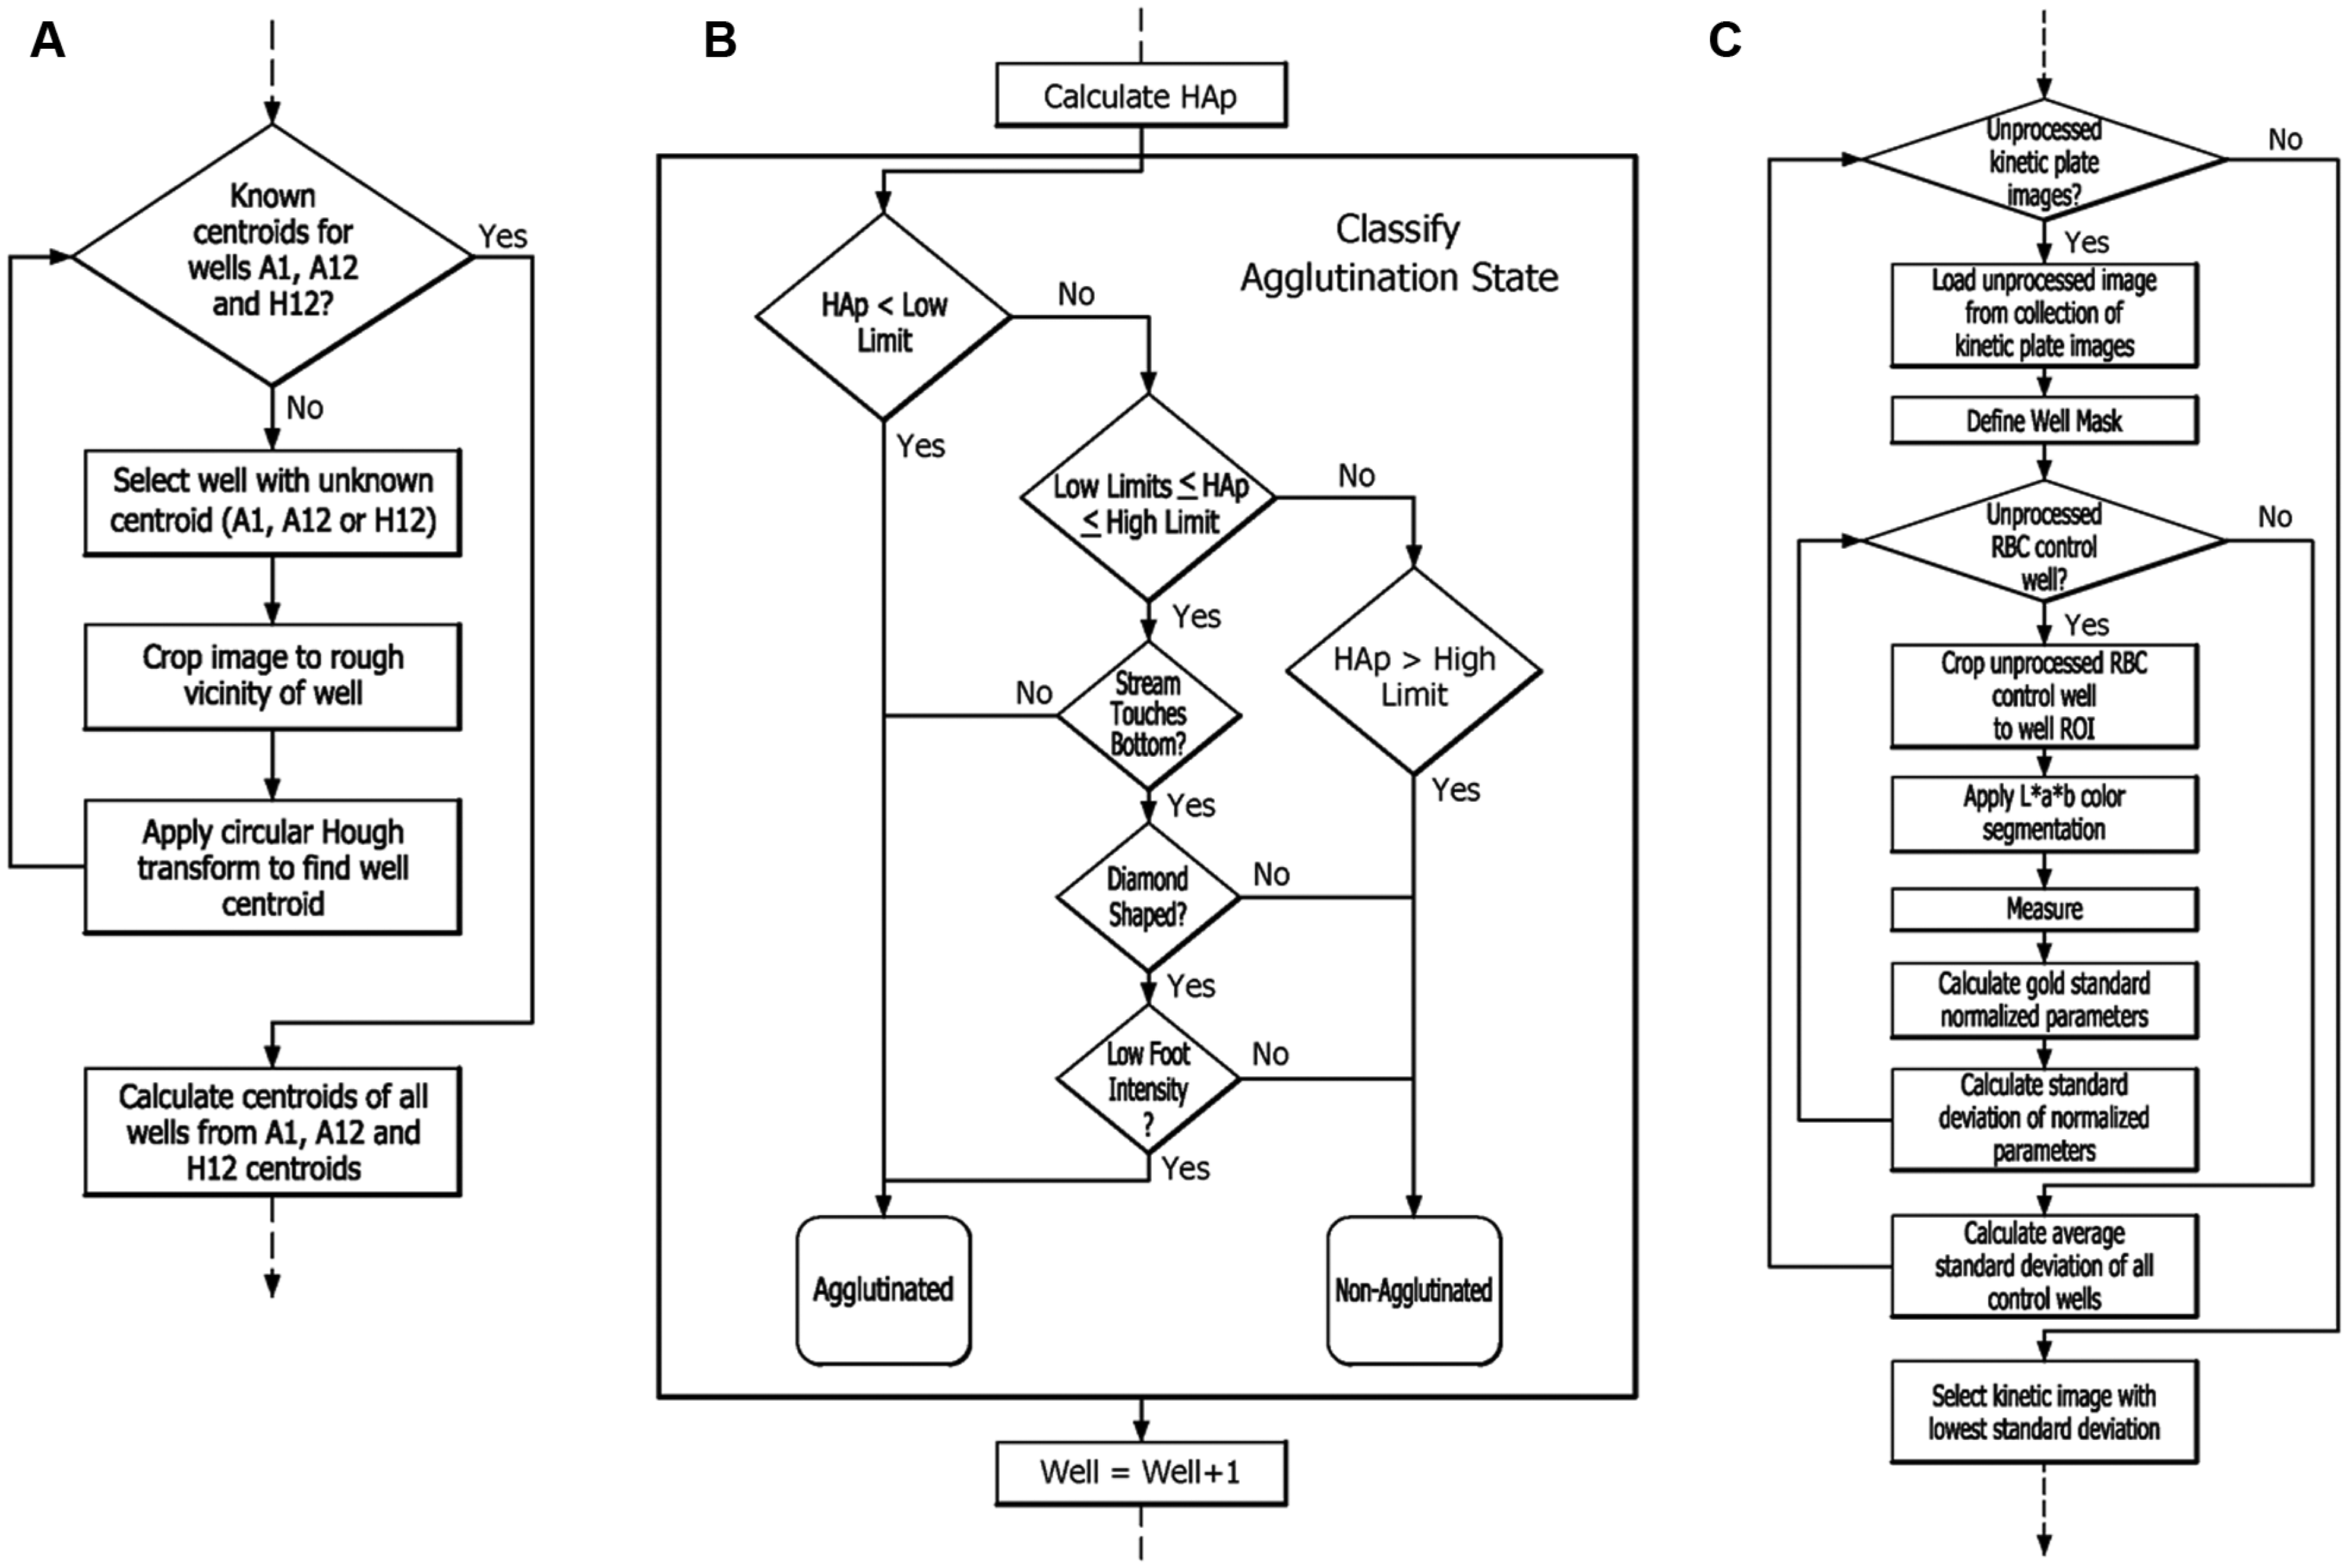
(
HAI Pattern Image Analysis
After the locations of the wells were determined, the well RBC patterns were iteratively processed to determine their agglutination states. The general steps for processing the well patterns were: (1) crop the image to a region of interest containing the RBC pattern, (2) perform color segmentation to isolate the RBC pattern, (3) measure features of the RBC pattern that vary as a function of the agglutination state, and (4) classify the agglutination state based on the feature measurements and additional measurements as needed.
Image Cropping
Each well was automatically cropped to the region containing the RBC pattern using the centroid and radii values determined from the well definition algorithm. Because the pattern streams vertically from the center of the well to the well edge during tilting, the region of interest was confined to approximately one-quarter of the full well image.
Color Segmentation
Color segmentation was used to separate the RBC patterns from the plate images. The original RGB image was first converted to CIELAB (L*a*b*) color space 15 and then compared to a predefined “gate.” This universal color gate was originally defined by creating a composite L*a*b* color space overlay from a large library of cropped HAI well images and recording the location of the pixels that corresponded to the RBCs in the a*–b* plane. Segmenting the RBC pattern was accomplished automatically by discarding pixels that did not fall within the predefined gate.
Image Moment Analysis
The segmented RBC patterns were subjected to image moment analysis to measure key features that vary strongly with agglutination state. More than 60 different image moment functions were initially evaluated, including central and Hu rotation invariant moments, to determine a subset that was proportional to the agglutination state. Seven different parameters were identified, and of those, three were used to derive a single parameter that defines the agglutination state, called the hemagglutination parameter: HAP = L*B*Y, where (L) is the length of the RBC stream, (B) is the location of the bottommost pixel, and (Y) is the weighted centroid in the y-axis. The HAP is calculated for each well RBC pattern and used to classify it as either agglutinated or nonagglutinated. The remaining parameters are applied in the optimal time point algorithm to determine the optimal kinetic plate image to use for analysis.
Agglutination State Classification
The agglutination state of a well was classified as either agglutinated or nonagglutinated using the classification algorithm illustrated in the flow chart in Figure 3B . The algorithm compared the calculated HA parameters to threshold limits that were determined a priori from matching the numeric results with the manual classification of many samples. The well was classified as agglutinated if the HA parameter was less than the lower limit and nonagglutinated if the HA parameter is greater than the high limit. If the value of the HA parameter fell between the low and high limits, then the image-processing algorithm performed additional analysis on the well pattern, specifically concerning the edge, shape, and foot intensity of the RBC stream, to determine its state.
Edge Detection
The edge detection algorithm determines if the RBC stream touches or overlaps the well wall. It uses image processing to analyze the bottom of the RBC stream and the edge of the well wall for overlapping pixels, as shown in Figure 2H . If overlap of the wall and the stream was detected, then the well was classified as nonagglutinated; otherwise, the well was classified as agglutinated.
“Diamond”-Shape Detection
Diamond-shaped RBC streams vary from typical control-well RBC streams and are often encountered with ether-treated 18 antigens. Their shape variation is defined by a characteristic widening near the midpoint of the stream, resulting in an atypical pattern that resembles a diamond. To detect these patterns, the second-order central image moments, µ02 and µ20, were compared against preset thresholds derived from known diamond-shaped RBC patterns. If the thresholds that indicate a diamond shape were exceeded, the well pattern underwent additional analysis of the foot intensity; otherwise, the well was classified as nonagglutinated.
“Foot” Intensity
RBC pattern foot intensity generally varies inversely with the degree of agglutination and can therefore be used as a subtle indicator of agglutination state for streams that are at or near the edge of a well. A threshold value for foot intensity was determined by averaging pixels within a region of interest (ROI) containing the foot in normal RBC control wells. Sample wells with diamond-shaped streams that had ROI average pixel intensities lower or higher than the predetermined threshold were classified as agglutinated or nonagglutinated, respectively.
Titer Assignment
After the agglutination states were determined for each well on the plate, the titer values were assigned for each sample dilution series as the reciprocal of the highest dilution that was nonagglutinated. If a sample dilution series exhibited outliers such as noncontinuous agglutination states or invalid control wells due to issues such as pipetting errors, the samples were flagged by the algorithm and a titer value was not assigned. Following titer assignment and outlier detection, a color-coded plate image overlay was applied to visually depict the well classifications determined by the algorithm. All calculated values were then stored in a relational database for future retrieval.
Optimal Time Point Algorithm
The optimal time point algorithm emulates an analyst observing the control wells for the optimal read time, defined as the point at which the control RBC pattern has streamed to the bottom of the well and formed a “foot.” The process is illustrated in Figure 3C . The algorithm iterates through a collection of kinetic images for a selected plate and compares control-well image moment measurements to reference parameters from a gold standard, which were derived in advance from thousands of RBC control wells that were classified manually as nonagglutinated. In particular, the following image moment measurements are compared: the length of the RBC stream (L), the location of the bottommost pixel (B), the area of the pattern (A), the perimeter (P), the equivalent diameter (D), the weighted centroid in the y-axis (Y), and the circularity (C). The measured values for each of these parameters are then normalized to the reference parameters as a means for comparison. The rationale for this particular normalization scheme is that all of the normalized parameters for an RBC control well are closest to a value of 1 when the pattern in that well is most similar to the reference standard and therefore closest to the optimal read time. Because the values of all normalized parameters approach 1 at the optimal time point, the standard deviation of their values gives a single numeric indication of how close a given RBC pattern is to optimal. To evaluate the overall state of the plate, the average of all the standard deviation values is calculated and the image with the lowest average standard deviation of RBC control-well normalized parameters is selected as nearest the optimal time point.
Concordance and Statistical Analysis
A concordance analysis was performed on the titers generated with the two different reading methods: manual from live video and automated using the HIVE T670. Titers were evaluated in two independent assay runs with different qualified analysts and different lots of TRBCs. Sample panels consisted of 60 human serum samples comprising 30 paired serum samples from pre- and post vaccination with the 2012–2013 influenza vaccine. A total of eight different antigens were tested, and two results per sample per antigen were generated with each reading method. Automated titer assignment was defined by the image-processing algorithm using the optimal static image determined by the optimal time point algorithm. The standard procedure for determining agreement between manual titers was followed, that is, concordance analysis was considered to be 100% in agreement as long as the titers were within one twofold dilution (variability of the assay). The concordance analysis was performed using the R Statistical Programming Language 19 version 2.15.2 and standard internal methods for assessing concordance between two entities conducting serological testing.
In addition to the standard concordance analysis of individual assay runs, statistical analysis of the results composed geometric mean titers (GMTs) of both assay runs, Committee for Medicinal Products for Human Use (CHMP) criteria including percent seroprotection, percent seroconversion, GMT ratio (GMTR, post/pre), and analysis of precision using individual reading methods. Seroprotection is defined as the proportion of subjects with a titer of ≥40. Seroconversion is defined as (1) subjects with a prevaccination titer of <10, the proportion of subjects with a postvaccination titer of ≥40; and (2) subjects with a prevaccination titer of ≥10, the proportion of subjects with a ≥4-fold increase in the postvaccination titer. GMTR is defined as the geometric mean of individual ratios (post- and prevaccination titers). For purposes of calculating the GMT and GMTR, titers reported as <10 were assigned a value of 5.
Results and Discussion
Optimal Time Point
The behavior of the normalized parameters as a function of imaging time point is shown in
Figures 4A
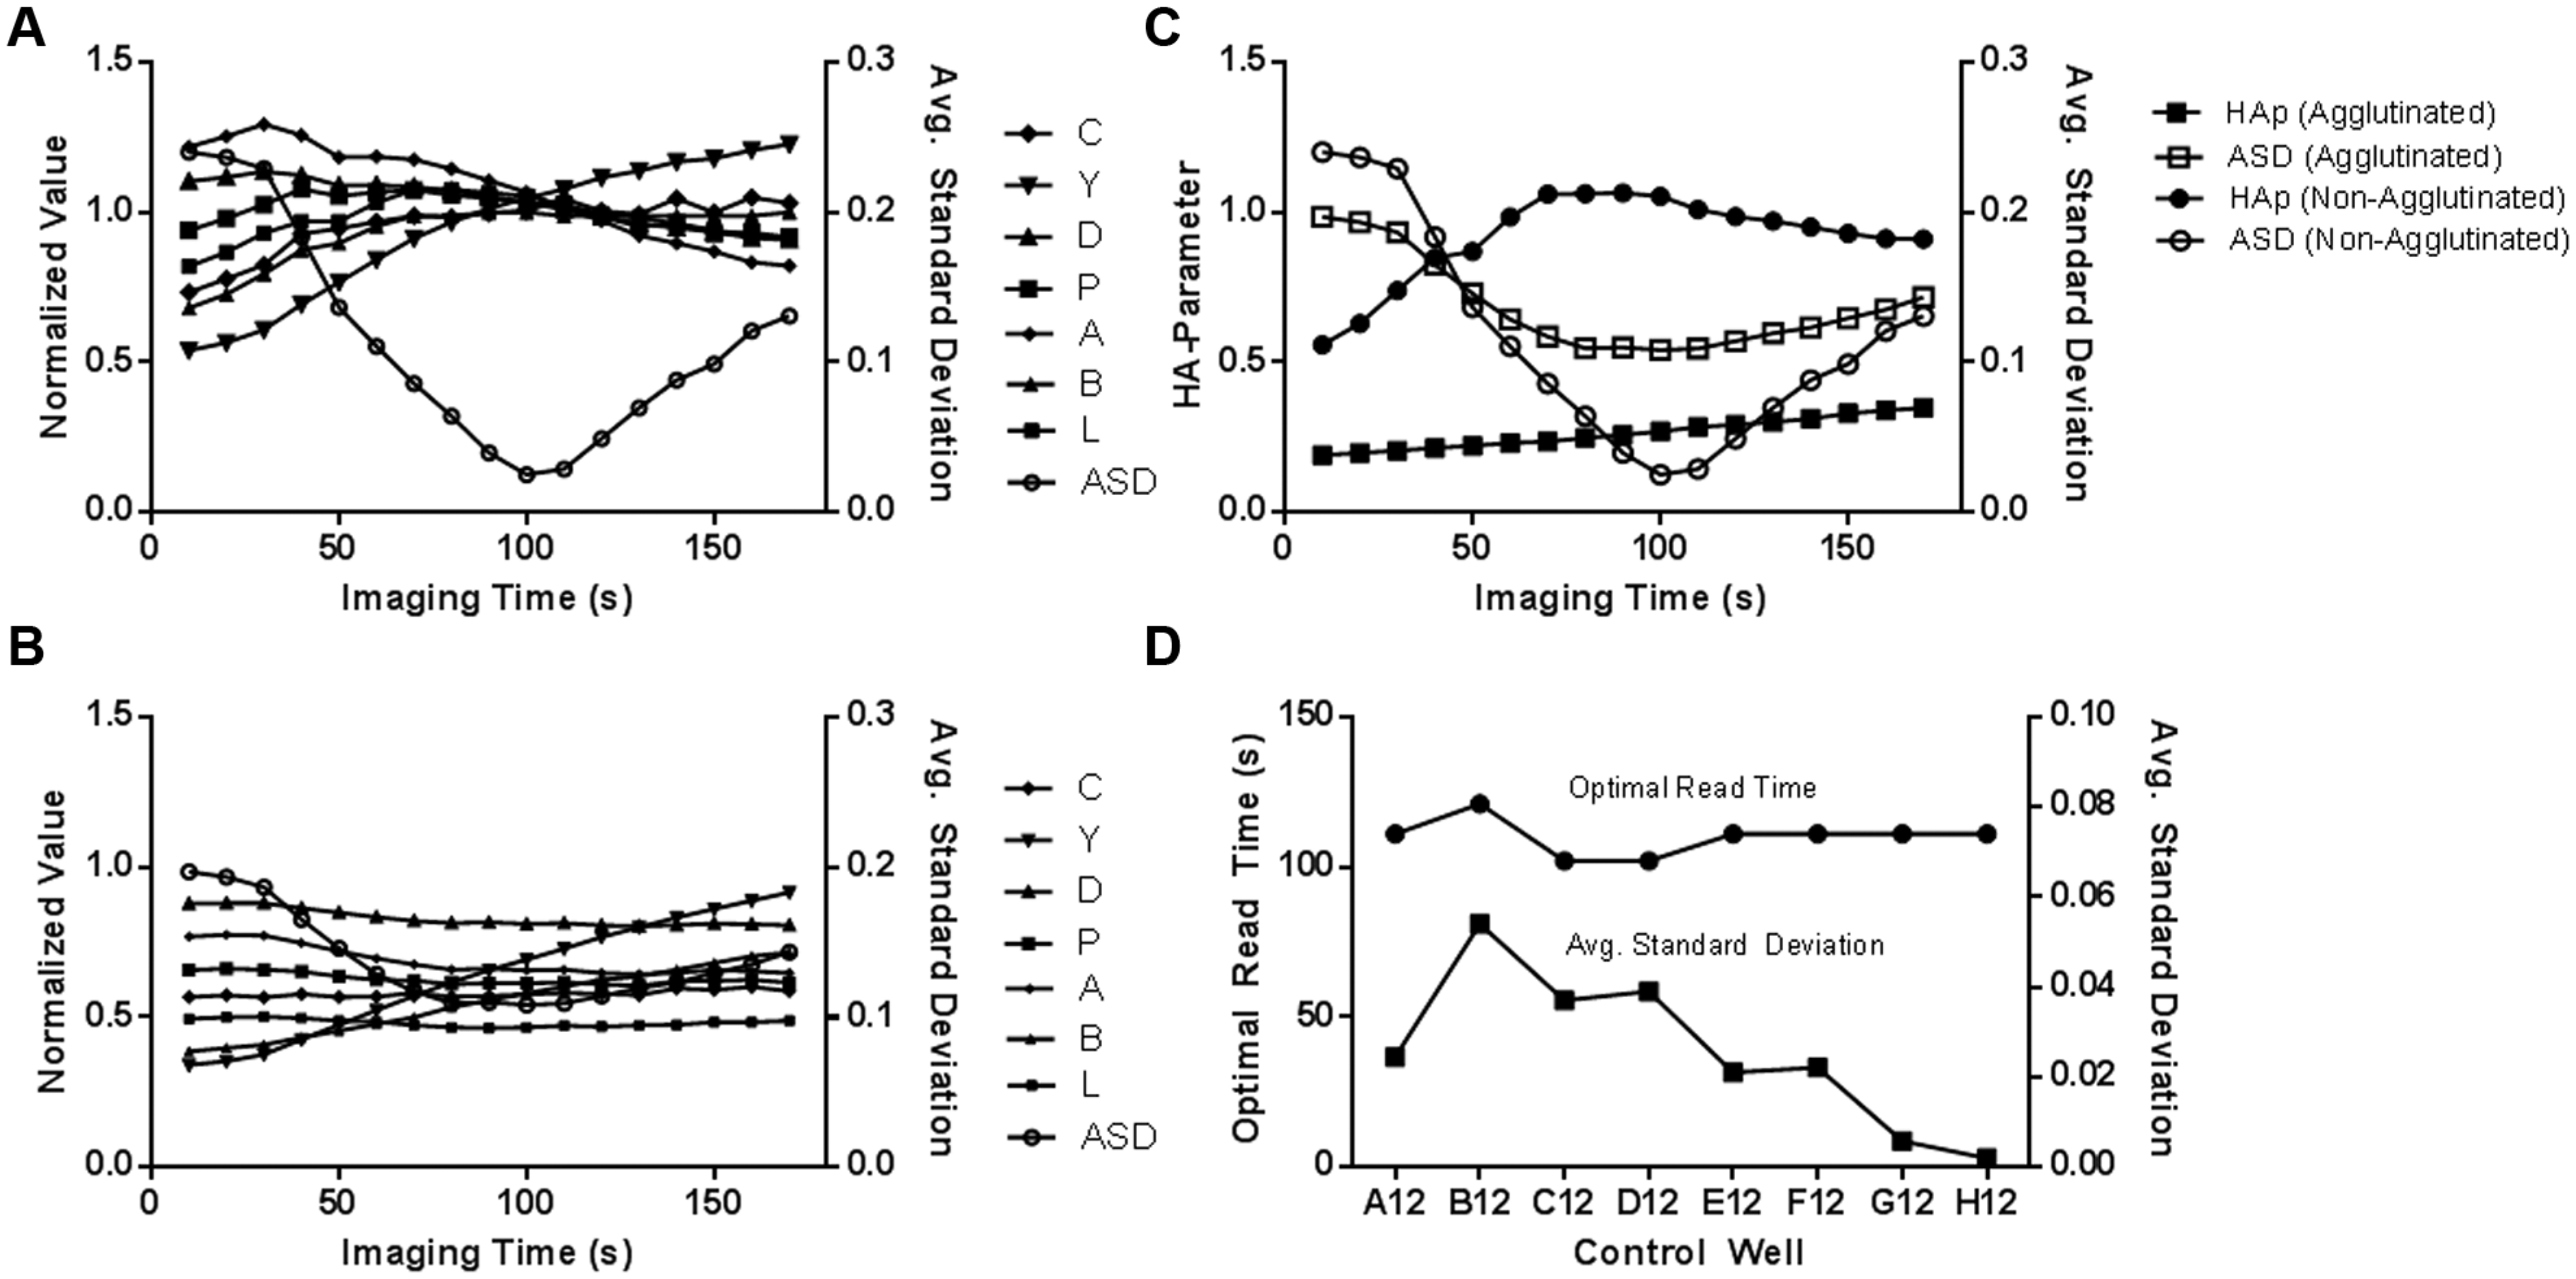
Normalized values as a function of imaging time (time post tilting) for agglutination state-dependent parameters, with average standard deviation (ASD) shown for reference. (
HA parameters vary as a function of time post tilting an HAI plate from 0° to 70° according to the agglutination state of the RBC pattern. As shown in Figure 4C , the HA parameter for an RBC pattern that exhibits no signs of agglutination will approach a value of 1 as the RBC pattern normalized parameters approach the predefined gold standard parameters at the ASD minimum. Conversely, the HA parameters for wells which exhibit agglutination, do not approach a value of 1 at the ASD minimum, and the ASD minimum is significantly higher due to a difference in RBC pattern normalized parameters caused by agglutination.
In general, control wells within a plate will develop at slightly different rates due to normal experimental variations. For example, Figure 4D shows the variation of the optimal read times and corresponding average standard deviations for eight RBC control wells on the same plate. The optimal read times for all control wells, as indicated by the minimal ASD values, are within a range of 100 to 125 s post tilting the plate from 0° to 70°.
Concordance Testing with Different Influenza Antigens
Concordance analysis between the current method of manually reading RBC streaming and automated analysis using the HIVE T670 has displayed excellent agreement for a wide range of influenza strains, as shown in
Tables 1
Concordance Analysis Results.
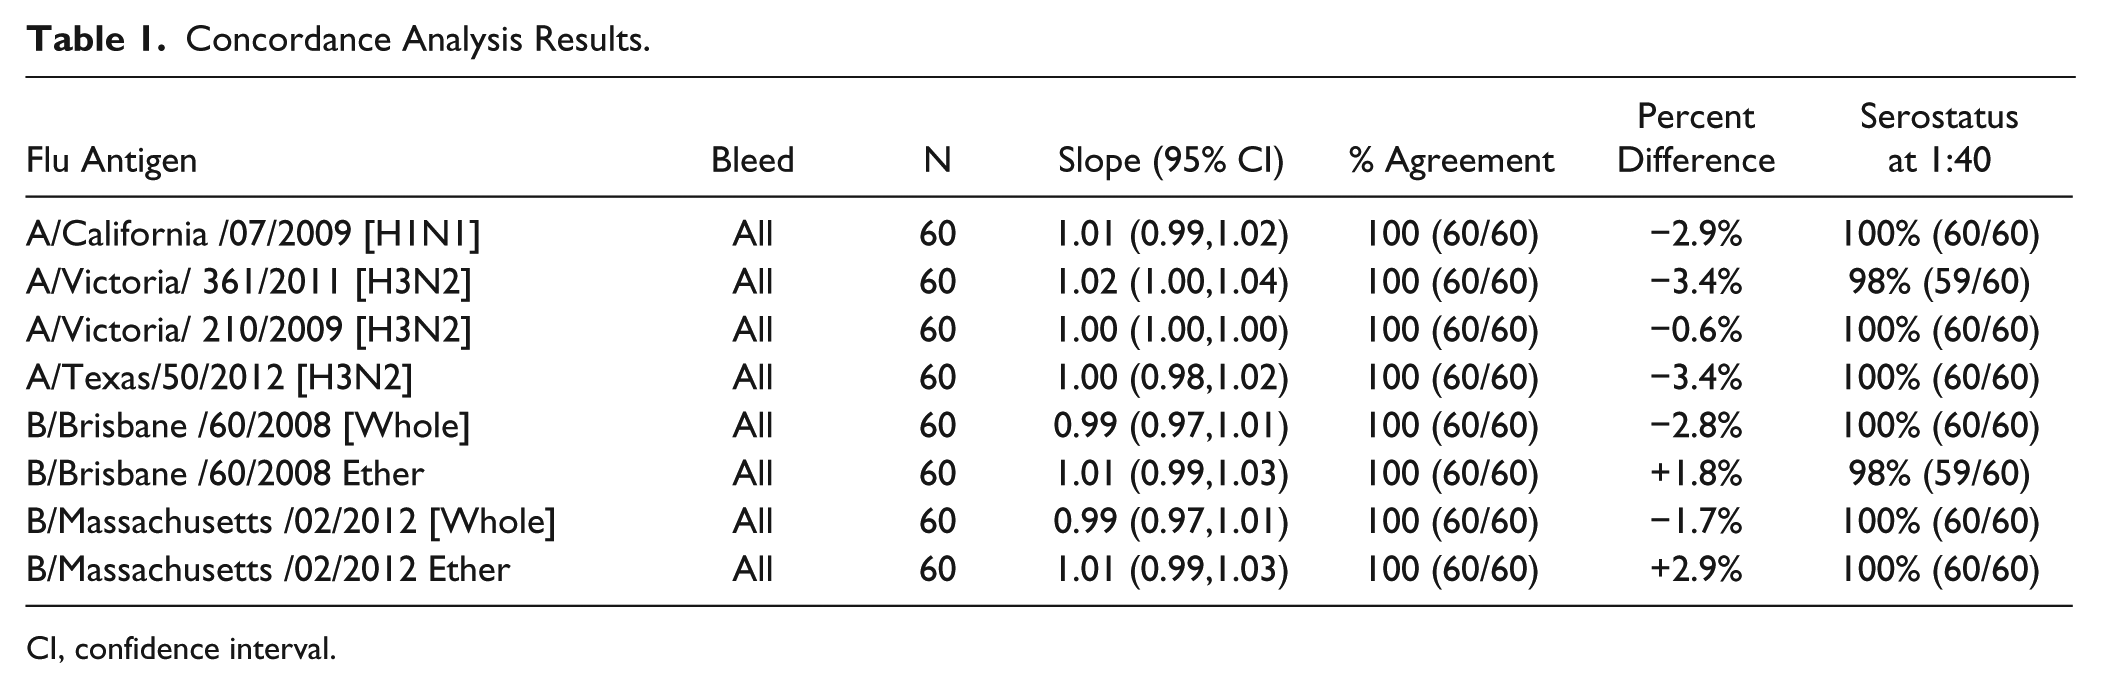
CI, confidence interval.
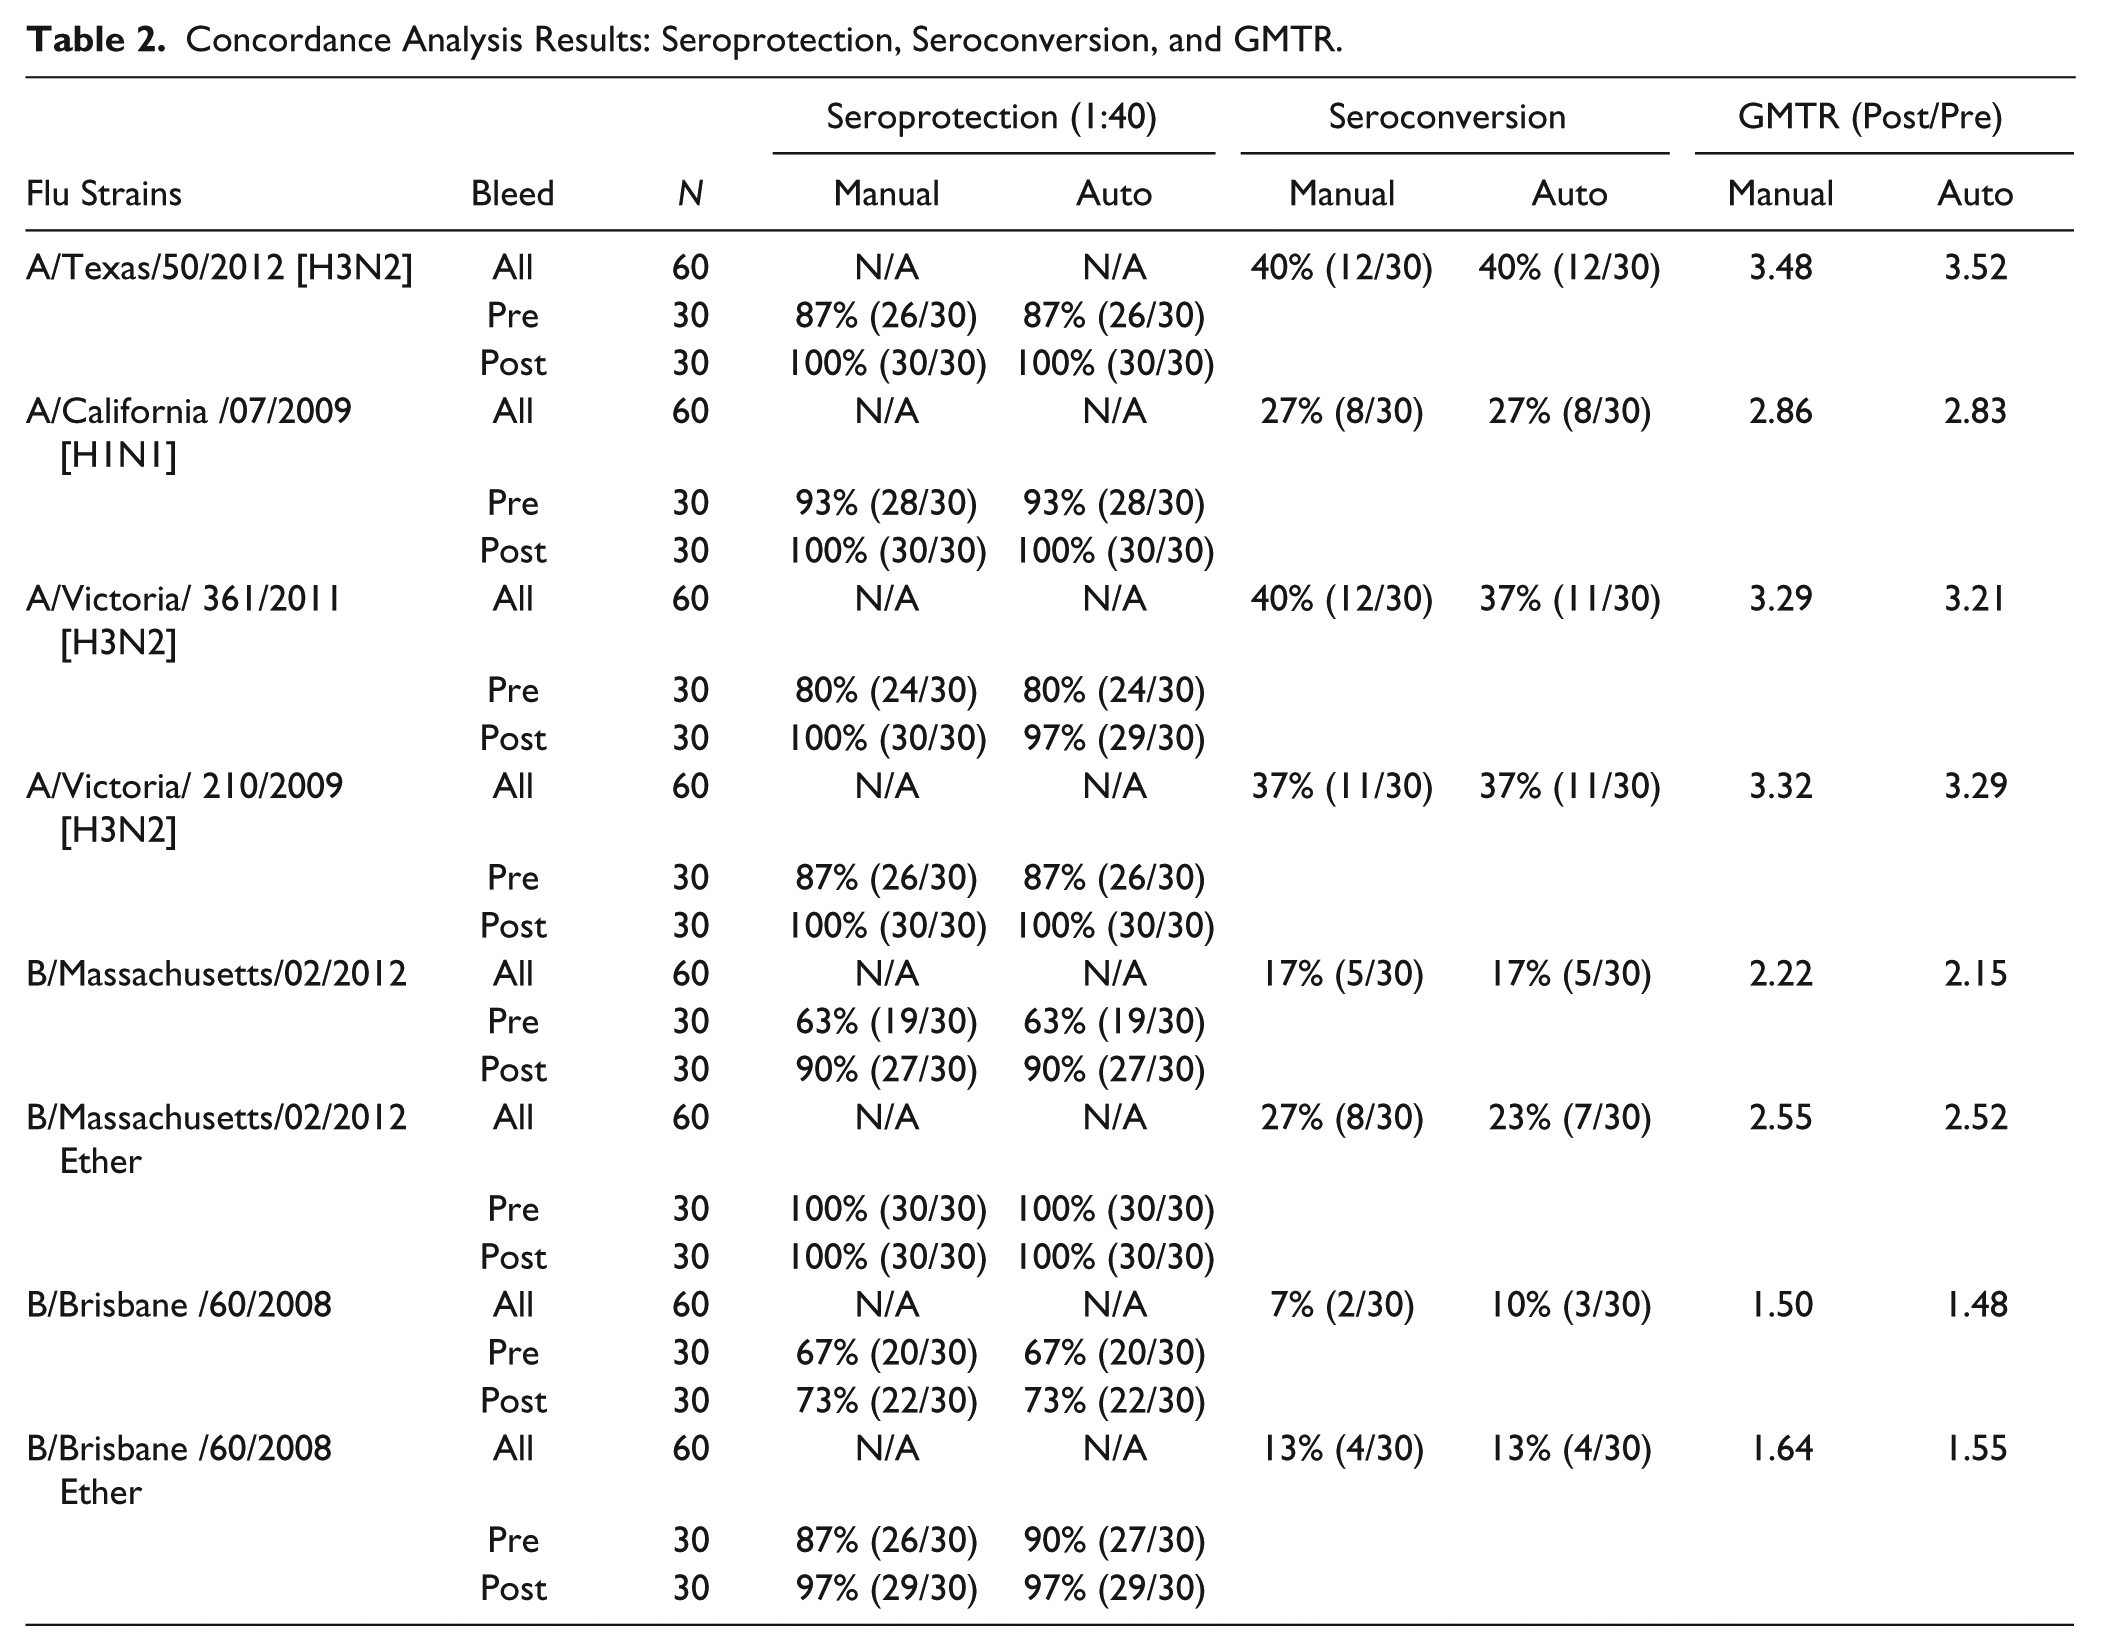
Concordance Analysis Results: Seroprotection, Seroconversion, and GMTR.
The results demonstrate that the influenza HAI titers generated by the manual reading method or by the automated image processing and titer assignment algorithm are comparable with the eight influenza antigens tested. Comparing the titers generated with the two different reading methods, the agreement was 100% for all eight influenza antigens tested. The 95% confidence interval (CI) of the concordance slope was included in the interval 0.80–1.25 for all eight flu antigens tested, and the 95% CI of the GMTR (automated algorithm GMT/manually read GMT) was included in the interval 0.67–1.5 for all eight antigens tested, indicating equivalence. The absolute value of the percent difference observed between the two different reading methods (automated and manual) was less than or equal to 3.4% for all antigens tested.
Seroprotection levels in the subjects evaluated in this comparison are the same with the two different reading methods for the pre- and postvaccination samples for seven of the eight antigens tested. The small difference (3%, or a difference of one out of 30 subjects) observed in the seroprotection levels between the two different reading methods for the prevaccination samples with ether-treated B/Brisbane/60/2008 was not considered significant.
Seroconversion levels in the subjects evaluated in this comparison are the same with the two different reading methods for five of the eight antigens. The small difference (3–4% or the difference of one out of 30 subjects) observed in the seroconversion levels with the two different reading methods with A/Victoria/361/2011 (H3N2), B/Massachusetts/02/2012 Ether, and B/Brisbane/60/2008 were not considered significant.
The GMTR (post- and prevaccination) in the subjects evaluated in this comparison exhibited only small, insignificant differences between the two different reading methods for all cases tested.
Dose–Response Curve Fitting
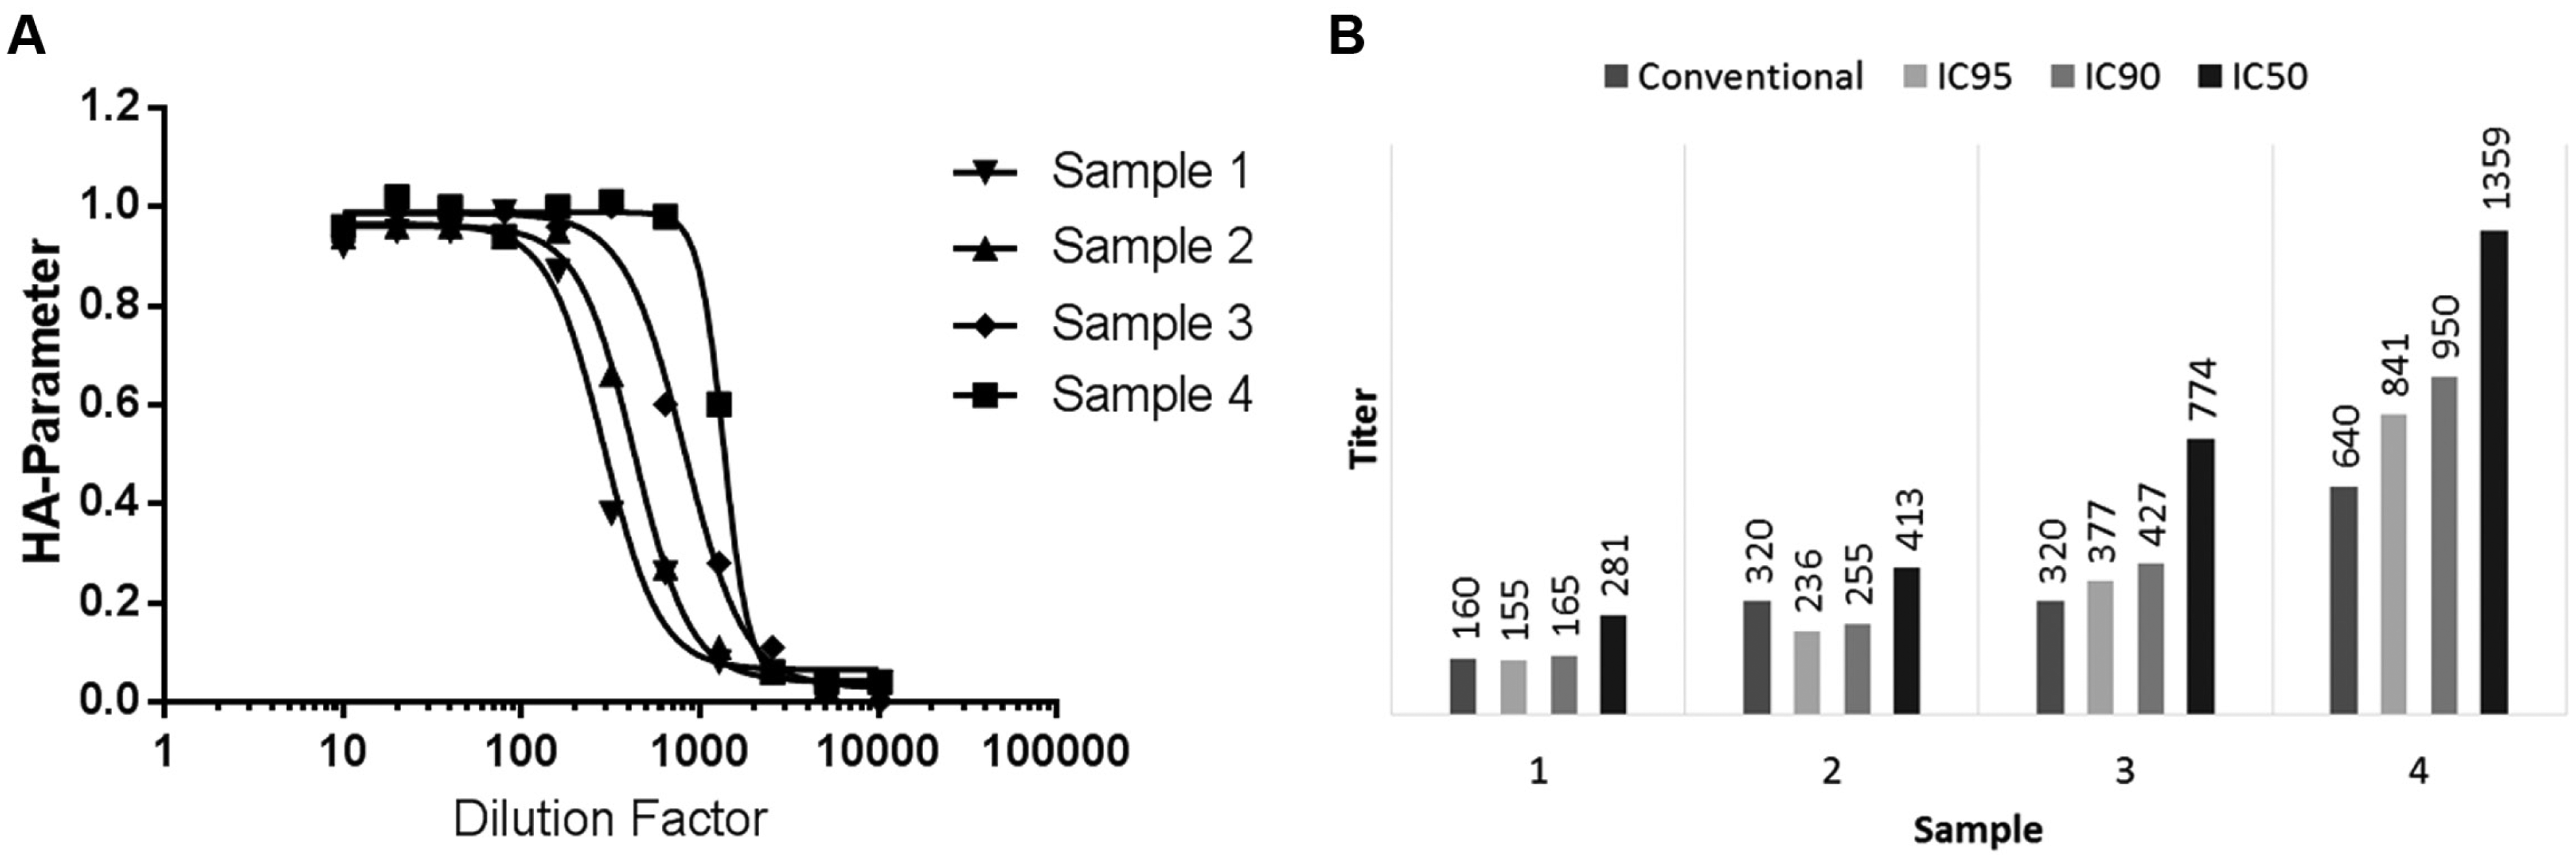
Image processing provides expanded capability for analyzing the HAI compared to traditional analysis by assigning a quantitative measure to the agglutination state. An HAI sample dilution series can be fit to a dose–response curve using these numeric values (HA parameters). As shown in Figure 5A , the dose–response curve makes it possible to assign continuous titer values, essentially interpolating the discrete values that are traditionally reported and improving titer precision. The resulting curve is analogous to an inhibition response curve, which is useful for determining the concentration of a substance (the inhibitor or antagonist) required to inhibit agonist activity by a certain amount, normally reported as the IC50. 20 In the case of HAI, the IC50 value describes the sample dilution factor required to reduce the HA parameter by half. Because the HA parameter is related to the agglutination state, the IC value then provides a means to classify a sample based on degree of agglutination rather than discrete classifications of agglutinated or nonagglutinated. The dose–response curves in Figure 5A each represent the dilution series for a different serum sample. The corresponding IC50, IC90, and IC95 values for each curve are plotted in Figure 5B along with the traditional discrete titer value for the sample. Of note are samples 2 and 3, which have the same conventional titer value of 320, but distinctly different IC values. The difference between the dose–response curves for these samples is evidenced in Figure 5A , where the curve for sample 3 is shifted to the right compared to the curve for sample 2, suggesting they exhibit dissimilar agglutination activity. However, their conventional titer values are the same based on the criteria for assigning discrete values. In this case, the dose–response curves and IC values provide a more complete representation of the sample agglutination states.
(
RBCs from Other Species
We presented results for TRBCs in this study; however, the HIVE T670 has also demonstrated functionality using RBCs from other species, such as chicken, horse, and guinea pig. Additional image classification algorithms with tunable parameters can be readily created in the HIVE software to accommodate the variations among the streaming properties of the different RBC species.
Throughput
The HIVE T670 can perform image acquisition and analysis of up to 100 tilted plates per hour given a standard assay development time of 120 s. This represents a 2–3-fold increase in throughput over manual analysis. Automatic titer determination takes approximately 5–10 s for a full 96-well plate containing eight control wells and eight samples serially diluted into 11 twofold dilutions each. Automated analysis operations may also be batched into large groups that can be processed without user intervention.
Conclusion
We have developed an industry-first high-throughput system for automatic HAI titer determination. This system facilitates the potential for global standardization of HAI analysis and provides a fundamental means for understanding RBC streaming kinetics as a function of agglutination state, virus strain, RBC species, and assay conditions. The ability to assign quantitative values to agglutination states opens new ways to analyze HAI assay data, such as inhibition response curve fitting, that could increase titer precision beyond the discrete values of the current methods. Based on the excellent concordance results obtained, automated analysis of hemagglutination assays could reduce the need for visual inspection, resulting in direct savings in labor hours associated with analyst training and requalification. It is also anticipated that retest rates can be reduced with digital documentation of each sample analyzed and elimination of manual subjectivity. Furthermore, the HIVE T670 has demonstrated the ability to achieve concordant results while also operating at a throughput that can accommodate large-scale clinical testing requirements for HAI assays.
Footnotes
Acknowledgements
The authors would like to thank the Sanofi Pasteur Global Clinical Immunology Flu Team and Alex Karol and Sam Sanders at Sanofi Pasteur VaxDesign for their efforts in support of this work.
Declaration of Conflicting Interests
The authors declared the following potential conflicts of interest with respect to the research, authorship, and/or publication of this article: All authors are employees of Sanofi Pasteur and may be stockholders.
Funding
The authors disclosed receipt of the following financial support for the research, authorship, and/or publication of this article: This research was funded in its entirety by Sanofi Pasteur.