
Abstract
PCR-based fluorescent detection assays for the relative and quantitative measurement of gene expression, such as Taq Man™, LUX™, and SYBR Green™, are currently in wide spread use due to their general applicability, low cost, reproducibility, accuracy, and ease of use. One current limitation of quantitative PCR (Q-PCR) is the lack of a fully integrated and high-throughput method for general genomic and diagnostic applications. Here we report a reliable and high-throughput system for the automated extraction of RNA, first-strand cDNA synthesis, quality control measures, consecutive real-time PCR amplification, and primary data analysis. As described, this procedure utilizes commonly available reagents and pre-packaged “kits” for RNA extraction, first strand cDNA synthesis, Q-PCR, liquid handling, and capillary electrophoresis that are generally applicable to a wide variety of robotic platforms. (JALA 2004;9:128-34)
Introduction
The use of gene expression profiling, coupled to and supported by high-throughput applications, are now in general use and have become commonplace in research, industry, and diagnostic settings. Among the most popular platforms for gene expression profiling are those that are based on the polymerase chain reaction (PCR), termed quantitative-PCR (Q-PCR), such as Taq Man™, LUX™, and SYBR Green™ due to their general applicability, low cost, reproducibility, accuracy, and ease of use. 1 2 3 4 These systems are based on target, probe, or signal amplification technologies that measure the relative or absolute levels of specific mRNAs or DNAs via the accumulation of fluorescence in a closed-tube. In addition to the application of these platforms to mRNA profiling (either as a primary assay or as a validation to microarray-based platforms), Q-PCR has also been adapted as a quantitative DNA test for genotyping, viral load determination, pathogen detection, and other diagnostics.
Current applications of Q-PCR for the quantitative analysis of mRNA expression involve the following: Total RNA isolation, first strand cDNA synthesis, Q-PCR amplification, measurement of fluorescence accumulation, data extraction, and data analysis. Each of these steps can be both labor-intensive and time-consuming. In particular, the extraction of total RNA from a large number of samples and the subsequent synthesis of first strand cDNA typically involve numerous pipetting and centrifugation steps which limits their application to automated high-throughput systems.
Here, we describe the use of a robotic workstation, integrated with a bank of thermocyclers and a capillary electrophoresis unit, for the coupled extraction of total RNA, first strand cDNA synthesis, and quality control monitoring. As a result, manual labor, total procedure time, error rate, and “drop-outs” are reduced to a minimum. We have further increased the high-throughput nature of this system by pairing these robotically assisted pipetting steps with an automated data extraction and primary data analysis workbook. The result is an accurate, high-throughput and reliable system for Q-PCR. As a demonstration of this system, we have profiled the expression of a large number of different gene products against several full 96-well microtiter plates of cells that have had undergone treatment with a variety of compounds with the goal of developing molecular profiles of drug response in this system.
Methods and results
An overview of the automated Q-PCR system is illustrated in Figure 1. Briefly, 105 cells per well, in 96 well microtiter plate format, were subjected to high throughput RNA isolation on a Biomek FX using the Concert 96 RNA isolation system. Extracted RNAs were assayed for quality and quantity on the P/ACE MDQ capillary system and products not immediately used for cDNA first strand synthesis were stored at −80°C. Q-PCR was set up and gene products were assayed on an ABI 7900. Raw data was exported as tab delimited text, analyzed and results displayed through a comparative CT workbook.
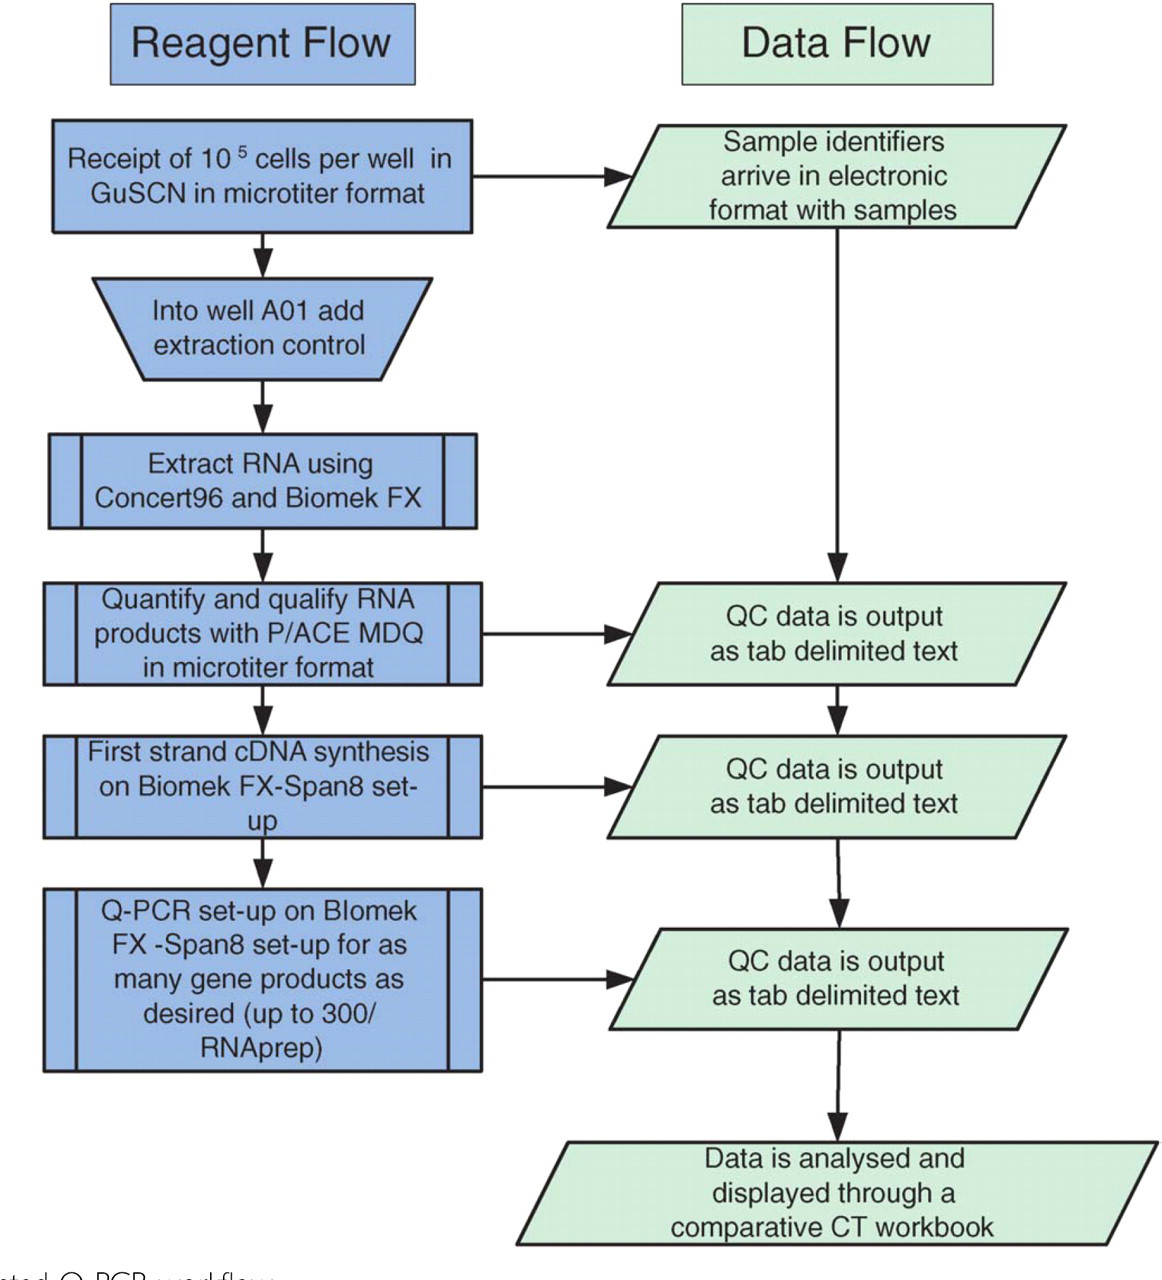
Automated Q-PCR workflow.
RNA extraction: Cells may be cultured in a variety of formats including flasks, 6-well and 24-well plates. 105 cells were harvested into deep-well 96-well microtiter plates. RNAs were extracted according to manufacture's recommendations using Concert96™ RNA kits (Invitrogen Corporation, Carlsbad, CA). 5 RNA extractions were performed on a Biomek FX liquid handling system (Beckman Coulter, Inc., Fullerton, CA) equipped with a vacuum manifold and both 96-channel and span 8 pipettor heads as illustrated in Figure 2. 6 RNAs were eluted into a total volume of 60 μL of sterile H2O. It is recommended that the Biomek FX deck be prepped prior to RNA extraction using any of a variety of commercially available germicidal reagents followed by ultraviolet light treatment immediately before use. Total time for extraction of RNA from 96 samples is ∼1 h. RNA may easily be extracted from up to 8 microtiter plates of cells in one day. We have found that quality of RNAs extracted by this method are equal or superior to those isolated by a variety of commercial and homemade “hand-pipetting” methods (data not shown). Typical RNA yield was sufficient to provide template for 12+ first strand cDNA synthesis reactions as described below.
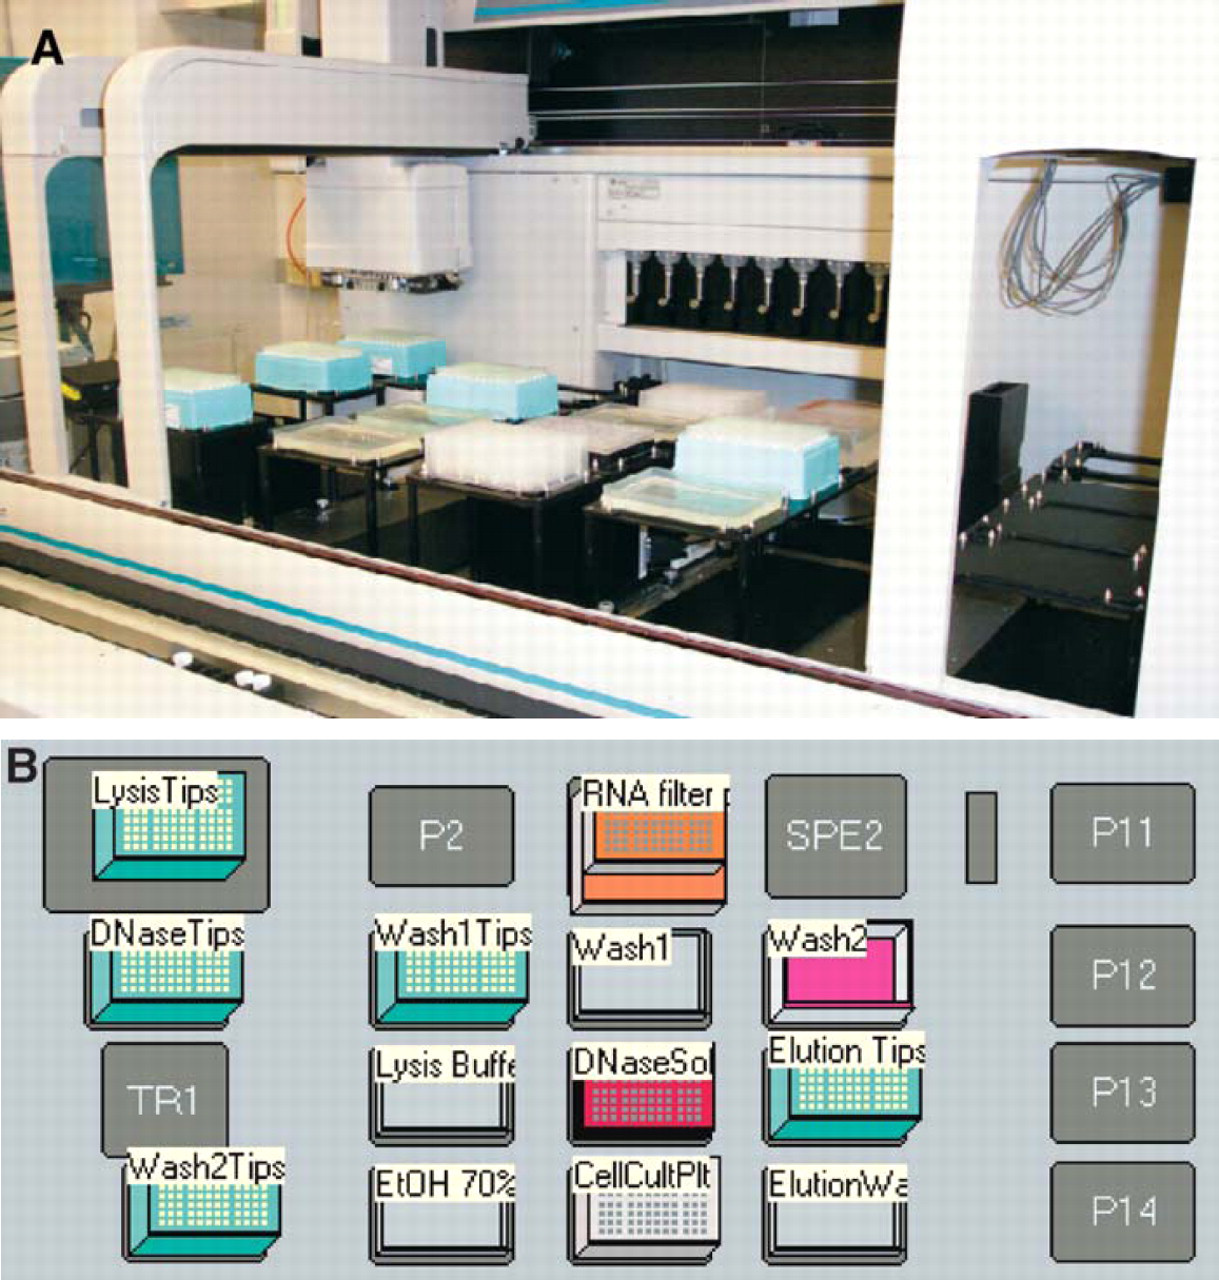
Biomek FX liquid handling system. (A) Biomek FX and (B) Biomek FX deck layout for RNA extraction.
RNA quality control: The P\ACE MDQ from Beckman Coulter (Beckman Coulter, Inc., Fullerton, CA) separates sample components within a fused silica capillary, using UV/Vis, LIF (laser-induced fluorescence) or a PDA (photo-diode array detector) detection method (Figure 3A). The MDQ is capable of running 96 samples in microtiter plate format, making it compatible with most automated liquid handling platforms. 7 The system is run using 32 Karat™ Software (version 4.0) which contains various features consistent with GLP and CGMP compliance. The P\ACE MDQ being used in this application was equipped with an LIF detector equipped with a 488 nm argon-ion laser light source resulting in 500x increased sensitivity than possible with a UV detector. The 96-well sample plate is loaded into the sample tray and stored in a 4°C storage chamber to minimize sample degradation. The samples are injected into the bare silica capillary via voltage injection; run time is approximately 4 minutes per sample. Samples migrating in the capillary that fluoresce at the appropriate wave length are detected. The integrated detector measures and records the fluorescence and the signal is plotted graphically in the form of an electropherogram (Figure 3B). Upon completion of the run the data is analyzed and a custom report generated, giving the sample concentration, and eletropherogram image.
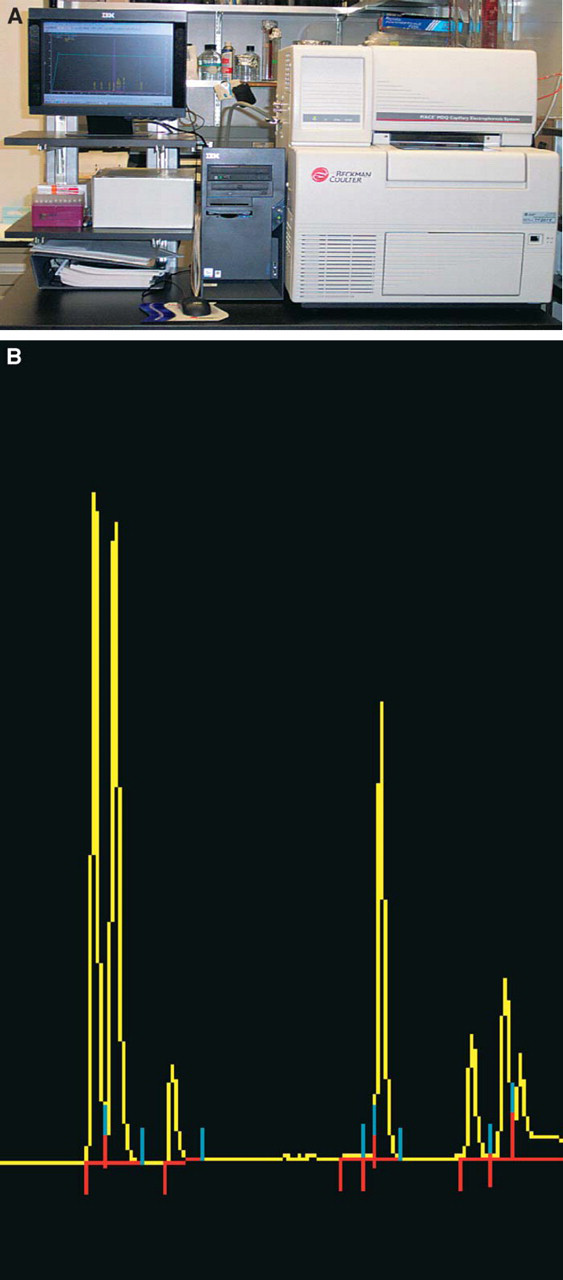
P/ACE MDQ capillary electrophoresis unit. (A) P/ACE MDQ capillary electrophoresis unit and (B) P/ACE MDQ capillary electrophoresis unit RNA analysis electropherogram.
First strand cDNA synthesis: The Super ScriptTM III First Strand Synthesis System for RT-PCR (Invitrogen Corporation, Carlsbad, CA) was used to synthesize cDNA from total RNA in 96-well microtiter plate format according to the manufacture's recommendations. 25 ng of total RNA was typically used as template for first strand cDNA synthesis with RNase OUT™ (Invitrogen Corporation, Carlsbad, CA) included in the reaction to prevent degradation of the target RNA by contaminating ribonucleases. Incubations were carried out in a thermocycler as follows: 65°C for 5minutes followed by 50°C for 50 minutes and the addition of RNase H for 20 minutes at 37°C. Typical cDNA yield was sufficient to provide template for 25+ Q-PCR reactions.
Analysis of Gene Expression by Q-PCR: Q-PCR analysis was directed by Taq Man probes (Applied Biosystems, Foster City, CA) according to manufacture's directions in 10 uL final volumes in 384-well microtiter plates. The 384-well microtiter reaction plates were robotically loaded (J. Cherry, C. Stewart. L. Rasmussen, D. Munroe, unpublished) into the ABI 7900 Sequencing Detection System (Applied Biosystems, Foster City, CA). This additional automation allowed for 1152 reactions/ABI 7900 to be run in an 8-h workday. Thermocycling conditions were as follows: 50°C for 2 minutes, 95°C for 10 minutes and 40 cycles of 95°C for 10 seconds, and 60°C for 1 minute.
Data extraction and analysis: Raw data from each Q-PCR run (Figure 4A) was automatically exported into a comparative CT analysis workbook. CT represents the threshold cycle or the PCR cycle at which an increase in reporter fluorescence above baseline signal can be detected. A schematic of the workflow of the comparative CT analysis workbook is illustrated in Figure 4B. The comparative CT workbook allows for normalization with different endogenous controls on a large number of samples and genes. The Comparative CT Workbook is a Microsoft Excel spreadsheet consisting of three worksheets within the same workbook. The first worksheet (Figure 4C) is used as a destination for the raw data results of real time PCR experiments. The second worksheet (Figure 4D) analyzes those results using computational values visible to the user. And the third worksheet (Figure 4E) displays the analyzed results in a final format (both numerically and graphically) showing their expression relative to not only an endogenous control but also a reference sample (a ubiquitous and abundant gene product that is normally expressed at steady-state levels in the experimental system or cells used). The format of experiments in this spreadsheet is designed to accept is one in which: all samples are run in duplicate, all samples are run against an endogenous control, and the reference sample is known prior to the pasting of data into the workbook. Given these results the user need only transfer data into the first worksheet. The second worksheet (Figure 4D) first averages all duplicate sample CT values (AvgCT). It then subtracts the averaged endogenous control CT values (AvgCT-Endogenous) from the averaged sample CT values (AvgCT-Sample). This output is used for the normalization of each experiment and is called the ΔCT value (ΔCT-Sample = AvgCT-Sample—-AvgCT-Endogenous) Next, the ACT value of the reference sample (ACT-Reference). is subtracted from all other ACT-Sample values. This further normalizes all of the sample ACT values to one reference. This value, referred to as the AACT-Sample value (ΔΔCT-Sample = ΔCT-Sample—ΔCT-Reference), is transformed by taking the result of the expression: If 2(-ΔΔCT)-1 > 0 then the result = 2(-ΔΔCT)-1 or else the result = −1/2(-ΔΔCT). This transformation changes the range for down regulation from 0–1 to −∞-0, and up regulation from 1-∞ to 0-∞. This data format represents a more easily interpretable output, compatible with graphical display, that allows for more direct comparison with other platforms such as microarray (compare Figures 4A and 4E).
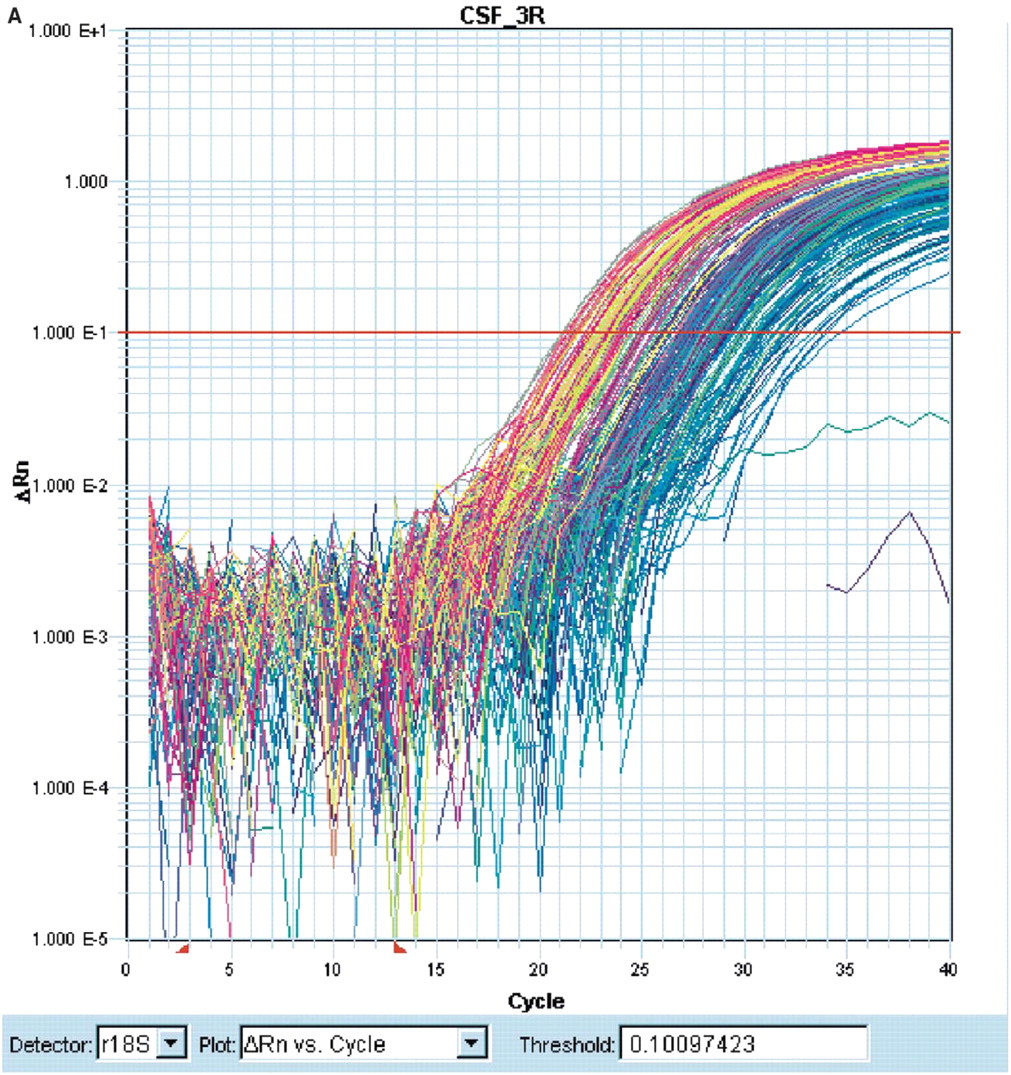
Q-PCR data analysis. (A) Raw data exported from ABI 7900; (B) CT Workbook work flow; (C) CT Workbook spreadsheet 1; D) CT Workbook spreadsheet 2; and (E) CT Workbook spreadsheet 3.
Discussion
We have developed a reliable and high-throughput system that allows us to extract total RNA, synthesize first strand cDNA and produce “finished” Q-PCR based mRNA expression profiles starting from mammalian cells in micro-titer plate format. The use of prepackaged kits, designed for automation, facilitated the practicality, capacity, and reproducibility of this system. We found that RNAs and cDNAs produced in this manner were of sufficient quality for use as templates with sensitive Taq ManTM MGB Q-PCR probes. Furthermore, we are able to produce sufficient quantities of RNA for the subsequent assay of 300 gene products from each source plate of cells (96 samples per plate × 300 genes for a total of 28,800 gene product measurements per source plate). The quality of RNA produced from each source was monitored with the P/ACE MDQ capillary electrophoresis unit following our adaptation of standard protocols. To facilitate data extraction and primary analysis, we designed a data analysis workbook, the CT Workbook, which utilizes ΔΔCT calculations and increases throughput by eliminating the need for the repeated production of standard curves for assessing CT values.
Using this integrated approach, the rate-limiting step in large scale Q-PCR studies has been transferred to the growth, treatment, and incubation of cellular starting materials.
Note: The comparative CT Workbook and all automation methods files are available at: http://web.ncifcrf.gov\rtp\lmt
Acknowledgments
This work was supported by NCI Contract No. NO1-CO-12400.