
Abstract
Swine influenza virus is an economically important pathogen to the U.S. swine industry. New influenza subtypes and isolates within subtypes with different genetic and antigenic makeup have recently emerged in U.S. swineherds. As a result of the emergence of these new viruses, diagnosticians' ability to accurately diagnose influenza infection in pigs and develop appropriate vaccine strategies has become increasingly difficult. The current study compares the ability of subtype-specific commercial enzyme-linked immunosorbent assays (ELISA), hemagglutination inhibition (HI), and serum neutralization (SN) assays to detect antibodies elicited by multiple isolates within different subtypes of influenza virus. Pigs were infected with genetically and antigenically different isolates of the 3 major circulating subtypes within populations of swine (H1N1, H1N2, and H3N2). Serum was collected when all pigs within a group collectively reached HI reciprocal titers ≥160 against that group's homologous challenge virus. The antibody cross-reactivity of the sera between isolates was determined using ELISA, HI, and SN assays. In addition, the correlation between the 3 assays was determined. The assays differed in their ability to detect antibodies produced by the viruses used in the study. The results provide important information to diagnostic laboratories, veterinarians, and swine producers on the ability of 3 common serological assays used in identifying infection with influenza in pigs.
Keywords
Introduction
Swine influenza virus (SIV), a common respiratory pathogen of swine, has been undergoing rapid evolution in the United States over the past several years. Prior to 1998, a classical H1N1 (cH1N1) subtype was the predominant influenza virus infecting pigs. The cH1N1 virus is composed primarily of swine genes and appears to be antigenically stable. In 1998, several H3N2 subtype viruses infected swineherds across the United States. Since their emergence, the H3N2 viruses have continued to spread throughout the U.S. swine population. 8,16 In 1999, the emergence of an additional subtype, H1N2, was reported in the United States. Analysis of viruses of the H1N2 subtype indicated that these were the result of reassortment between the cH1N1 and the more recently emerged H3N2 influenza viruses. 15 Further reassortment of these viruses has created H1N1 viruses containing human, classical swine, and avian genetics. 8 The increasing antigenic diversity in influenza subtypes circulating in swineherds has generated concern among swine veterinarians regarding the ability to detect antibodies generated against the varied influenza viruses. 3,5–9,14,24 In addition, characterization of antibody profiles provides important information on the ability of vaccines to stimulate a protective immune response against disease as genetically different viruses within and across subtypes continue to emerge and infect swine herds. The constant ongoing genetic changes in influenza viruses have reduced the ability of practitioners to accurately diagnose and develop effective vaccination strategies (Kitikoon P, Thacker BJ, Vandertop R, et al.: 2002, The immune response to vaccination and challenge with H3N2 influenza virus. In: Proceedings of the 17th International Pig Veterinary Society Congress, p. 405. Ames, IA). 21,22
A number of methods are currently available for influenza infection diagnosis, including virus isolation, antigen detection using an immunoassay, antibody detection, and molecular-based assays, such as polymerase chain reaction (PCR) assays. Currently, detection of serum antibodies using the hemagglutination inhibition (HI) assay is the most common method used in the United States to diagnose infection caused by influenza viruses in pigs. The HI assay is based on the ability of the hemagglutinin (HA) protein present on the viral surface to agglutinate erythrocytes. Problems associated with the accurate use of the HI assay are nonspecific serum inhibitors, differences in the ability of viruses to agglutinate erythrocytes, and frequent antigenic drift, all of which may lead to false-negative results. 4 Another serum antibody detection assay is a commercial ELISA (IDEXX HerdChek SIV), which has been licensed for both the H1N1 11,12 and the H3N2 subtypes. Research comparing HI and ELISA assays for H1 influenza viruses found good specificity with no false positives, but less than optimal sensitivity for the ELISA. 24 The serum neutralization (SN) assay measures neutralizing antibodies capable of preventing the influenza virus from infecting cells. The production of neutralizing antibodies is important in clearing the virus from the host as well as preventing infection. 19,23 The SN assay is labor intensive, virus-specific, and the correlation to antibodies detected by the other assays is largely unknown. 1,20 The relationship between these influenza antibody assays has not been well defined. Investigation of the serological reactivity among viruses of the 3 subtypes of influenza viruses currently recognized to be circulating within swineherds is important for improving the diagnostic accuracy and increasing the ability to evaluate vaccination efficacy against individual influenza isolates.
Material and methods
Viruses
Eight influenza viruses were used in the current study. Viruses represented strains in each of the 3 subtypes currently circulating in North American swineherds and included a classical H1N1, 2 H1N2, 2 reassortant H1N1, and 3 H3N2 viruses. The H3N2 viruses represented the 3 previously described clusters within this subtype. 18 Viruses were provided from 4 sources and are as follows with the virus name used throughout the study in parentheses: A/Swine/Wisconsin/R33f/01 (H1N2A), A/Swine/H02NJ56371/02 (tH1N1A), A/Swine/Indiana/9K035/99 (H1N2B), and A/Swine/Wisconsin/R7c/01 (H3N2C3) provided by Dr. Chris Olsen, University of Wisconsin–Madison, Madison, Wisconsin; A/Swine/IA/35233/99 (tH1N1B) provided by Dr. Bruce Janke, Iowa State University–Veterinary Diagnostic Laboratory, Ames, Iowa; A/Swine/Texas/00036/02 (H3N2C2) provided by Dr. Marie Gramer, University of Minnesota, St. Paul, Minnesota; and A/Swine/IA/40776/92 (cH1N1) and A/Swine/Texas/4199–2/98 (H3N2C1) provided by the National Veterinary Service Laboratories (NVSL), Ames, Iowa. Further investigation using multiplex reverse transcription polymerase chain reaction (RT-PCR) assay found that the group 3 virus, A/Swine/H02NJ56371/02 (tH1N1A), which had been characterized as a triple reassortant H1N1, was actually 2 viruses, H1N1 and H3N2. 2 No further characterization of the viruses was performed.
All viruses were propagated in Minimum Essential Media (MEM) containing 7% bovine serum albumin (BSA), 300 U/ml of penicillin, 300 μg/ml of streptomycin, and 1 μg/ml of trypsin on Madin-Darby Canine Kidney (MDCK) cells at 37°C with 5% CO2. Clarification of stock virus used for serological assays was carried out through centrifugation at 1,300 X g for 15 min. Stock virus titer was determined both through HA titration using a 0.5% turkey erythrocyte in phosphate buffered saline (PBS) solution, and by calculation of a tissue culture infective dose (TCID50/ml) using influenza type A protein-specific immunocytochemistry staining of infected MDCK cells. 10 Calculations were based on the Reed–Muench method. 17 Multiple aliquots of stock virus were stored at −80°C for use in the study. Stock virus was used to challenge the pigs. The same virus stock was used for the HI and SN assays.
Infection of pigs
Thirty-two 4-week-old crossbred pigs, serologically negative for influenza, Porcine reproductive and respiratory syndrome virus (PRRSV), and Mycoplasma hyopneumoniae antibodies were obtained from a commercial swine farm. Eight groups of 4 pigs were housed in separate isolation rooms at Iowa State University. Serum was collected from pigs prior to challenge and used as negative control sera for all serological assays. Pigs were challenged by intratracheal inoculation using the virus stocks described. Pigs in groups 1–4 were initially challenged with 5 ml of 1 − 106 TCID50/ml of the assigned virus at 5 weeks of age. Because the initial challenge failed to elicit a significant antibody response as measured by HI, pigs were challenged a second time with 5 ml of 1 − 108 TCID50/ml of the same virus at 7 weeks of age. Groups 5–8 were challenged once at 9 weeks of age with a dose of 5 ml of 1 − 108 TCID50/ml of the assigned virus.
Serum was collected periodically throughout the trial. Blood was collected from each pig and the serum was harvested, frozen, and stored for use in the current study. All pigs in groups 1–4 were anesthetized and exsanguinated 4 weeks following the initial challenge (2 weeks following second challenge) when serum antibodies from the pigs in each group reached a HI reciprocal titer of ≥160 against the homologous virus for that group. All pigs in groups 5–8 were euthanized 2 weeks following challenge when serum HI reciprocal titer of ≥160 against the homologous virus occurred. All study procedures and animal care activities were approved and conducted in accordance with the guidelines and under the supervision of the Iowa State University Institutional Committee on Animal Care and Use.
Serological assays
Blood was collected weekly throughout the trial by venipuncture. Serum antibody levels were determined in each individual pig by HI, SN, and ELISA assays. The HI and SN assays were performed on sera to detect cross-reactivity between the H1N1 and H1N2 viral subtypes and the H3N2 subtype viruses separately. The commercial IDEXX ELISA a was performed on sera from all pigs. All serum was heat inactivated at 56°C for 30 min prior to use in all assays.
The HI assay was performed following a standard protocol as previously described. 25 Briefly, sera from groups of pigs challenged with H3N2 viruses were treated with receptor-destroying enzyme (RDE) for 18 hr at 37°C prior to assaying. The H3N2 sera were hemabsorbed with a 50% turkey erythrocyte solution consisting of equal parts of washed turkey erythrocytes and PBS. Antiserum from groups challenged with the H1N1 and H1N2 viruses were hemabsorbed with a solution of 10% turkey erythrocytes diluted in PBS, prior to performing each assay. The initial serum dilution used for the HI assay was 1:10 using PBS. Two-fold dilutions were made with each sample to a final serum dilution of 1:10,240. All HI assays were performed using 0.5% turkey erythrocytes in PBS for hemagglutination. All HI tests were carried out using the virus stocks described above diluted to a working titer of 4–8 HA units determined using a 0.5% turkey erythrocyte solution. Titers for the HI assays are reported as the group geometric mean titer based on the reciprocal of the last antibody dilution that completely inhibited hemagglutination.
The SN assay was performed as previously described with modifications. 1,20 Viruses used for the SN assay were diluted from virus stock solutions at a titer between 100–300 TCID50/0.1 ml. Initial serum dilutions of 1:10 were made using PBS. Two-fold dilutions of all samples were made to a final serum dilution of 1:10,240. To each serum dilution, 50 μl of 100–300 TCID50/0.1 ml of virus was added and incubated for 1 hr at 37°C in 5% CO2. Following incubation, the virus and serum mixtures were added to 96-well flat bottom plates containing confluent MDCK cell monolayers and incubated for 48 hr at 37°C in 5% CO2. Viral infection of the MDCK cell monolayer by SIV was detected by indirect immunocytochemistry using a monoclonal antibody b that detects type A influenza virus nucleoproteins. A labeled rabbit antimouse antibody c was used as a secondary antibody. Staining was carried out using 3-amino-9-ethylcarbazole (AEC) d substrate. Back titrations of each virus were performed on MDCK cells to confirm a working virus concentration of 100–300 TCID50/0.1 ml. Titers for the SN assays are reported as the group geometric mean titer based on the reciprocal of the last antibody dilution that completely inhibited infection of MDCK cells respectively.
The IDEXX ELISA was performed according to the manufacturer's instructions. All serum was assayed with both H1 and H3 subtype-specific ELISA assays. Enzyme-linked immunosorbent assay data are reported as sample-to-positive control (S/P) ratios according to the manufacturer's standard protocol with a positive cut-off value of 0.4.
Statistical analysis
Differences between serum group geometric mean titers from the data on sera from each individual pig were measured against each test antigen using a Kruskal–Wallis analysis of variance, Statistix 8. e Serum reactivity patterns from groups infected with viruses of the H1N1 and H1N2 subtypes (groups 1, 2, 3, 5, and 6) were compared, and a separate similar comparison of groups infected with viruses of the H3N2 subtype (groups 4, 7, and 8) was made. The statistical differences between the group geometric mean titers against each test antigen was determined by least significant difference based on group geometric mean titer.
A comparison was also made between both subtype-specific ELISA assays using serum from groups challenged with each of the viruses of the H1N1 and H1N2 subtype. A similar comparison was made between each ELISA assay using serum from groups challenged with viruses of the H3N2 viral subtype. Differences between each group mean ELISA S/P ratios were also analyzed using a Kruskal–Wallis analysis of variance. Differences between each group were determined by least significant difference based on group mean S/P ratio measured using each ELISA test kit. The differences between serum groups for the HI and SN assay based on test antigen used and the ELISA based on subtype-specific kit used were considered significant at a P value <0.05.
Individual reciprocal serum titers measured against the homologous test antigen for each individual pig with the HI and SN assay were normalized using the mean and standard deviation of homologous titers among each group challenged with a virus of the H1N1 and H1N2 viral subtype, and separately the H3N2 viral subtype. A comparison of these individual homologous HI and SN titers (log10) with a corresponding ELISA S/P ratio was made, and a correlation between both the HI and SN assay with the ELISA was determined using linear regression, JMP 5.1. f
Results
Results from HI and SN assays are reported as the reciprocal of geometric mean titers against each of the test antigens used in these assays (Tables 1, 2). The HI assay reactivity pattern elicited by each group of pigs challenged with H1N1 or H1N2 viruses against each other varied as shown in Table 1. Antibodies in serum from challenge groups 1 (H1N2A) and 3 (tH1N1A) showed strong 2-way cross-reactivity against themselves and each other, while showing moderate reactivity to the other 3 viruses used in the study. In addition, group 3 antiserum reacted strongly against the group 5 (tH1N1B) virus. Analyses of serum antibodies collected from challenge groups 5 (H1N2B) and 6 (tH1N1B) demonstrated that these viruses had the strongest serological cross-reactivity with the homologous virus, but had low cross-reactivity with the other 4 viruses used in the study.
Reactivity of antibodies from groups challenged with viruses of the H3N2 subtype is shown in Table 2. A representative virus from each of the 3 H3N2 subtype clusters used in this study is indicated along with the viral group name in parentheses. 18 Serum from challenge group 4 (H3N2C1) reacted strongly with both the homologous virus and the group 8 (H3N2C3) virus, with a weak reactivity with the group 7 (H3N2C2) virus. Serum from challenge groups 7 and 8 showed a similar pattern of having the strongest reactivity with the homologous virus for that group and weak reactivity with the other 2 viruses.
Hemagglutination inhibition (HI) assay and serum neutralization (SN) assay serum antibodies reported as reciprocal of group geometric mean titers measured against H1N1 and H1N2 influenza challenge antigens used in study.*
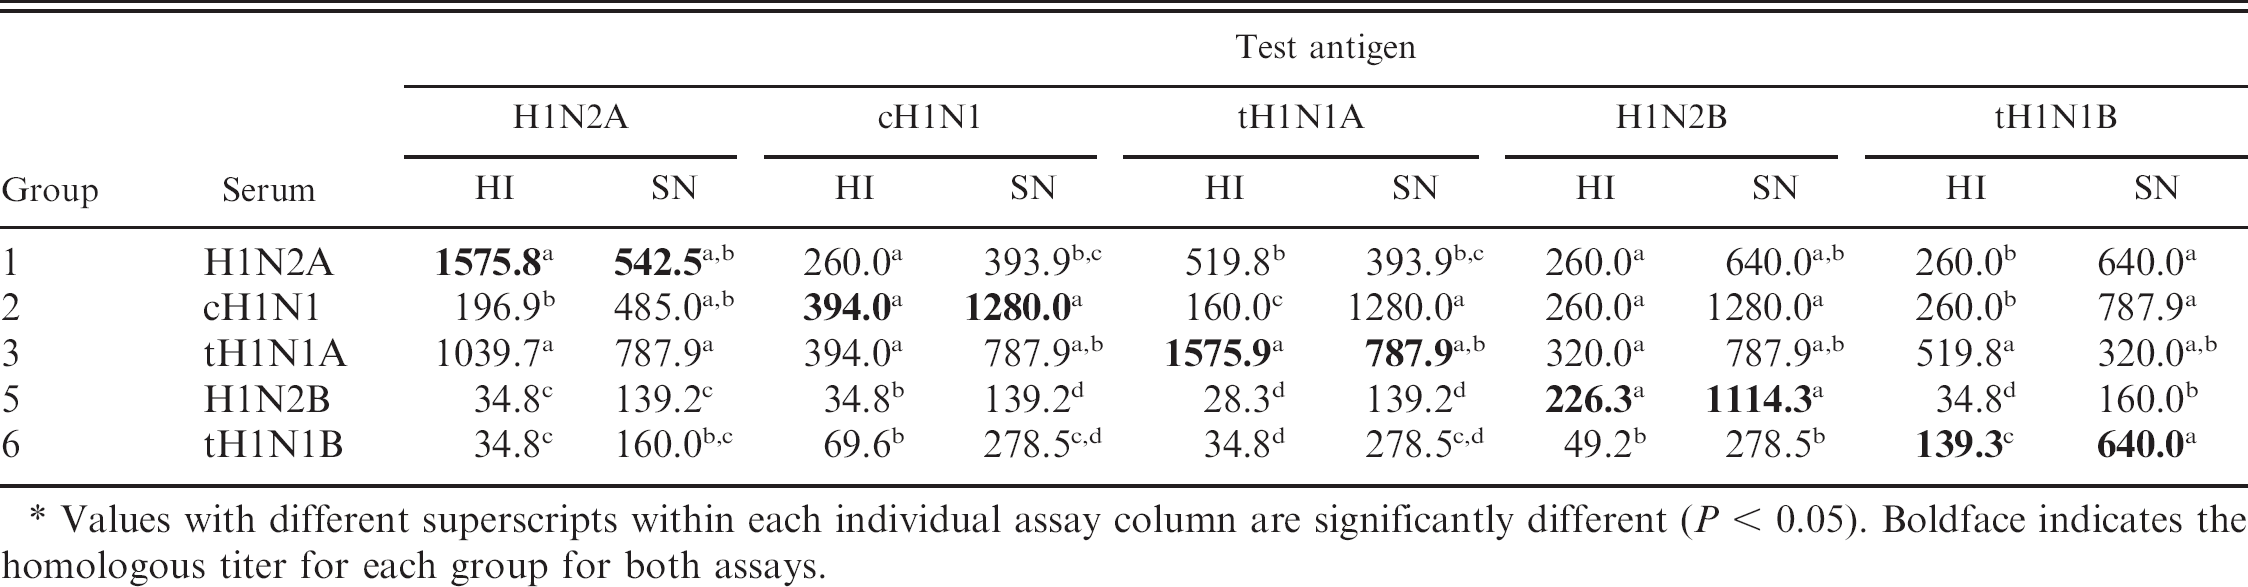
Values with different superscripts within each individual assay column are significantly different (P < 0.05). Boldface indicates the homologous titer for each group for both assays.
Serum neutralization antibody responses are described in Tables 1 and 2. The SN antibody responses tended to be similar to the HI results with most groups having the highest geometric mean titer to the homologous virus. Overall, the serum reactivity of the SN antibodies to the H1N1 and H1N2 viruses appeared higher than the HI antibody levels. A number of exceptions occurred where SN antibody levels deviated from the trend shown by the HI assay. Interestingly, group 1 (H1N2A) had higher SN antibody titers to group 5 and 6 viruses than against the homologous virus. The group 2 virus induced the highest SN antibody titers to the homologous virus and had similar levels of SN antibodies to the group 5 virus. As with the HI levels, groups 5 and 6 induced the lowest SN titers with the strongest reaction against the homologous viruses and lower responses to the other viruses used in the study.
Serum neutralization antibody responses to the H3 viruses were more consistent with those observed in the HI assays. The H3 viruses demonstrated the greatest reactivity to the homologous virus, and as with the HI responses, group 8 had low SN antibody responses to the viruses of the other groups.
Enzyme-linked immunosorbent assay data is reported as a group mean S/P ratio for both the H1 and H3 subtypes (Tables 3, 4). All serum samples were evaluated using both assays. The H1N1 assay determined that groups 1, 2, and 3 were positive for H1N1 antibodies, using a positive cut point of >0.4 according to the manufacturer's directions. Neither groups 5 or 6 were found to be positive for H1 antibodies, although both viruses were previously confirmed to be H1N2 and H1N1 viruses. The H3N2 assay confirmed all 3 of the known H3N2-positive samples as positive with a value of >0.4. In addition, H3N2 ELISA results showed that group 3 was positive, which had been documented as a combination of H1N1 and H3N2 viruses. Interestingly, group 1, a H1N2 virus, was within the suspect range, using the H3 antibody ELISA.
Overall, there was a poor correlation between the S/P ratio values measured by the ELISA compared with the HI and SN assay results for the homologous virus titers against its test antigen for each group. The correlation between HI and SN homologous titers for the H1N1 and H1N2 viruses and the H1 ELISA S/P ratio values was poor with r = 0.800 and r = 0.246, respectively. Similarly, the correlation between the HI and SN homologous titers for groups challenged with the H3N2 viral subtype and the H3 ELISA was also poor with r values of 0.433 and 0.568, respectively.
Hemagglutination inhibition (HI) assay and serum neutralization (SN) assay serum antibodies reported as reciprocal of group geometric mean titers measured against each H3N2 challenge antigen used in study.*
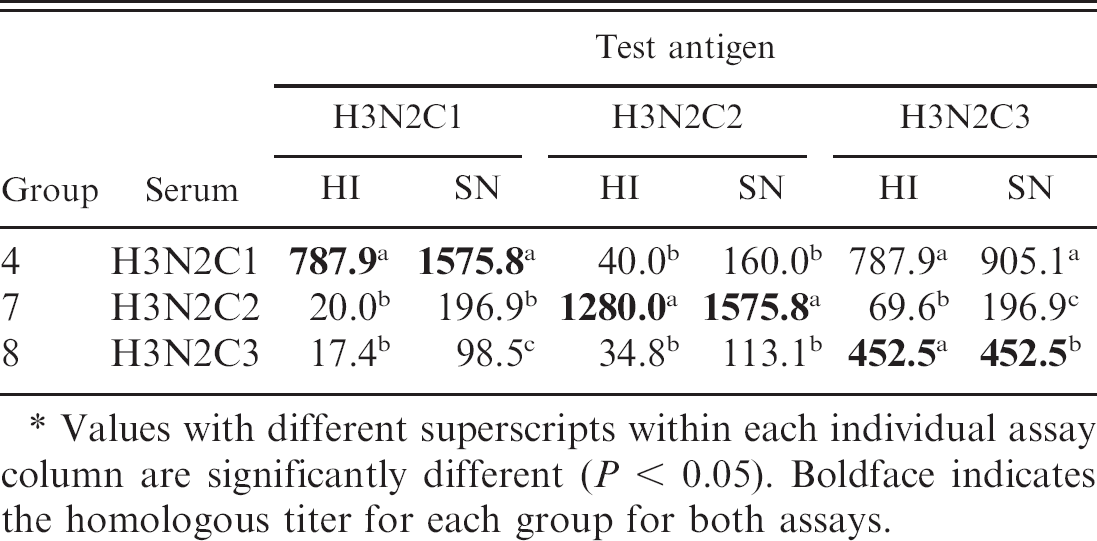
Values with different superscripts within each individual assay column are significantly different (P < 0.05). Boldface indicates the homologous titer for each group for both assays.
Enzyme-linked immunosorbent assay (ELISA) group mean sample-to-positive control (S/P) ratios measured by both the H1 and H3 subtype ELISA for groups challenged with viruses of the H1N1 and H1N2 swine influenza subtype.*
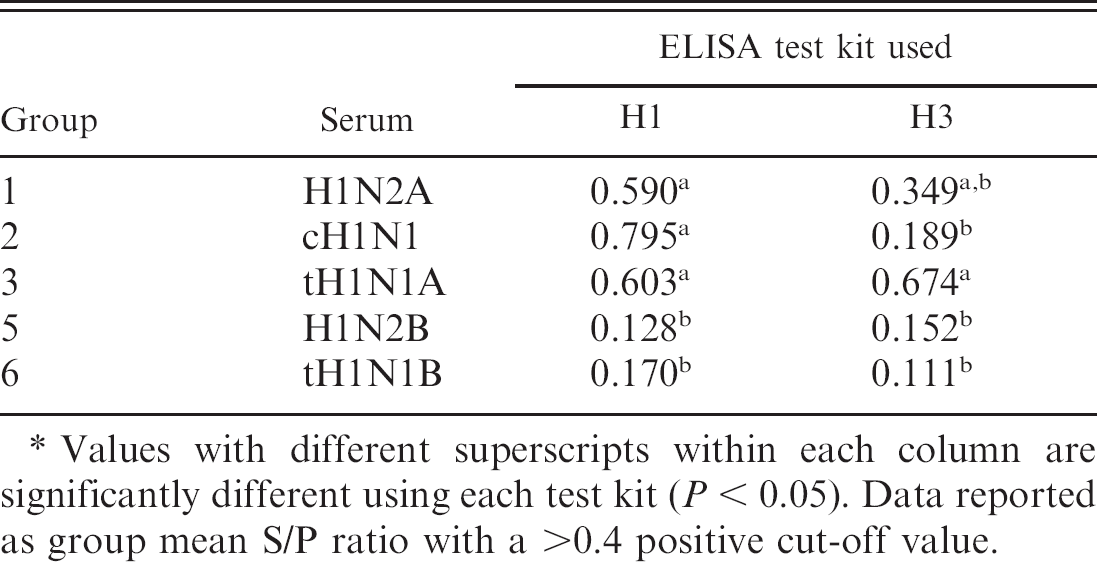
Values with different superscripts within each column are significantly different using each test kit (P < 0.05). Data reported as group mean S/P ratio with a >0.4 positive cut-off value.
Enzyme-linked immunosorbent assay (ELISA) group mean sample-to-positive control (S/P) ratios measured by both the H1 and H3 subtype ELISA for groups challenged with viruses of the H3N2 swine influenza subtype.*
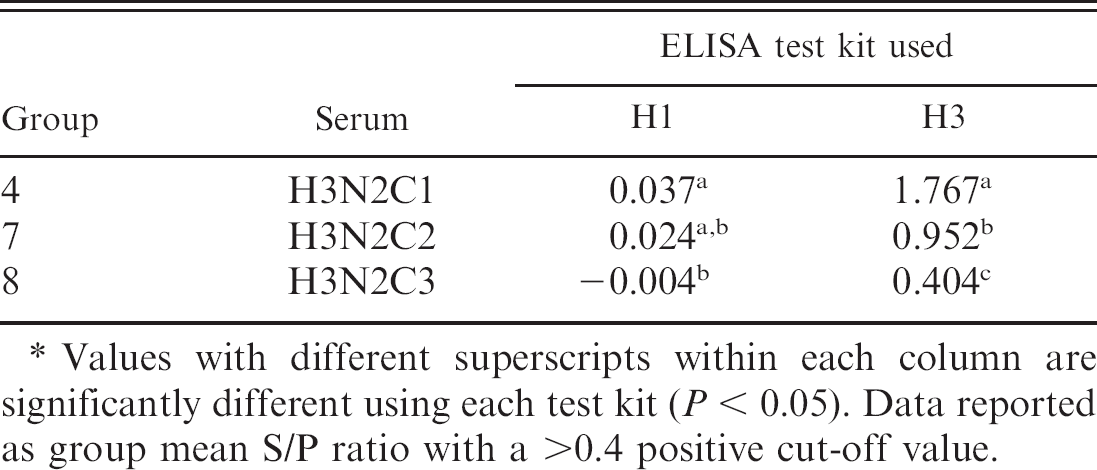
Values with different superscripts within each column are significantly different using each test kit (P < 0.05). Data reported as group mean S/P ratio with a >0.4 positive cut-off value.
Discussion
The current study investigated the serum cross-reactivity patterns of 8 different isolates of influenza viruses in pigs. Disease caused by influenza viruses has become an increasing problem to the U.S. swine industry because of the diversity of the circulating viruses. Historically, influenza-induced disease in pigs was controlled through sow vaccination strategies to increase the levels of maternally derived antibodies to pigs through colostrum intake. 13 The passive antibodies protect the pigs from disease until the grow-finish stage at which time the virus has less impact on overall health and production parameters. If necessary, vaccination of pigs could be implemented to control disease in pigs in the finishing phase. However, the purpose of the current study was to assess the ability of 3 available antibody assays to detect and quantify antibodies to influenza as well as to investigate the cross-reactivity of these antibodies to different viruses within subtypes. Both the HI and SN assays detected all positive samples in the study, and all negative control serum tested negative in both assays throughout the study.
The results demonstrate that there is a significant variation in the reactivity of the various viruses against each other, determined by the 3 antibody-detection assays used in this study. This was true of both the H1 and the H3 viruses. Differences in HI results of Swine influenza viruses have been documented, as has the impact of assay protocols. 14 The assay conditions were optimized for the viruses used in the current study. During the course of this investigation, it was determined that the stock virus of group 3, tH1N1A (which was originally thought to be a reassortant H1N1 made up of swine, human, and avian genetics) was actually a combination of both H1N1 and H3N2 viruses. Thus, H1N1 antibodies were detected when the HI assay using multiple H1 test antigens was performed, but the sera were also positive for the H3N2 antibodies by the ELISA. It was confirmed that the isolate consisted of both subtypes of viruses using a multiplex RT-PCR assay. 2 No further characterization of the viruses was performed, but the data was left in to demonstrate that the H1N1 antibodies were still detectable.
It was expected that the results of the HI and SN assays would be similar in measuring antibody titers. However, this was not consistently observed in the current study. A possible reason for the observed differences in levels of antibodies between the HI and SN assays is the ability of the virus to agglutinate erythrocytes. Differences in the agglutination ability of the viruses may have an effect on the HI serological assay as observed in the results from sera from groups 5 and 6 where the SN titers were higher than the HI titers. This suggests that the H1N2B (group 5) and tH1N1B (group 6) viruses may have reduced ability to agglutinate turkey RBC, thus lowering the sensitivity of the HI assay. Also, nonspecific agglutination inhibitors may influence final titers. The SN assay, although similar in method to the HI assay in respect to serum dilution and addition of virus, has characteristics that make it unique. The assay is run on live cells and accurate results are impacted by cell passage number and overall cell health. The amount of time that the cells are exposed to the virus-serum mixture could also influence titer results.
The current study did not assess disease severity induced by these viruses nor cross-protection between isolates. In addition, the significance of the SN antibody levels in relation to protection against clinical disease is unknown. Further studies are needed to determine whether there is a correlation between the level of SN antibodies, HI antibody levels, and protection against disease. However, SN assays are difficult, expensive, time-consuming, and impractical for routine diagnostic use. Nevertheless, the findings of the present study provide preliminary information to assist in evaluating the serological results induced by exposure to the various viruses.
Overall, the correlation between the homologous antibody titers measured by the HI and SN assay of individual samples compared to the corresponding ELISA S/P ratio was poor. The commercial ELISA assays were easy to perform and did detect antibodies to all 3 H3N2 viruses. Similar to results found in an earlier study, the sensitivity and accuracy in detecting antibodies to the H1 viruses was more questionable, with the assays not detecting antibodies to viruses in groups 5 and 6. 24 Although both of these viruses appear to be less immunogenic as evidenced by the low HI titers induced and showed less cross-reactivity against other H1 antigens, they did show a high reactivity to the homologous virus by SN test.
A serious concern was the lack of correlation between ELISA S/P ratios and the titers observed with either the HI or SN assays. One possible explanation for the lack of correlation between the 3 assays is that the samples had high titers towards the homologous virus, which may have resulted in a lower correlation by creating a compact grouping of similar values that alone were not correlated to S/P ratios. However, a logarithmic transformation of SN and HI titers did not have an effect on the correlation to the ELISA results. Similarly, other methods of data transformation did not have an effect on the correlation among assays. These results suggest that care must be taken when interpreting the time course of infection based on S/P ratios of the ELISA due to lack of correlation in S/P ratios to HI or SN titers.
The results of the current study demonstrate that different influenza viruses used as antigens in diagnostic laboratories may impact the success of diagnosing influenza virus infection based on antibody production within specific production systems. Thus, care must be taken when using serology alone to diagnose influenza infection in pigs, and the use of multiple assays may further increase the accuracy of diagnosis. Unfortunately, as the number of assays performed increases, the cost to the producer increases as well, which is problematic. Further studies will need to be performed continuously as new genetically diverse viruses emerge in the field. However, the results of this study provide important information about the cross-reactivity patterns and diagnostics required for accurate determination of influenza virus infection using a number of genetically diverse isolates.
Acknowledgements
The authors would like to thank Barbara Erickson, Nancy Upchurch, and the students of the Thacker Laboratory for their assistance in this project. The project was funded by the National Pork Board.
Footnotes
a.
IDEXX Laboratories, Westbrook, ME.
b.
ATCC HB-65, American Type Culture Collection, Manassas, VA.
c.
DAKO P0360, Dako North America Inc., Carpinteria, CA.
d.
Sigma-Aldrich, St. Louis, MO.
e.
Analytical Software, Tallahassee, FL.
f.
SAS Institute, Cary, NC.