
Abstract
Acoustic droplet ejection (ADE) as a means of transferring library compounds has had a dramatic impact on the way in which high-throughput screening campaigns are conducted in many laboratories. Two Labcyte Echo ADE liquid handlers form the core of the compound transfer operation in our 1536-well based ultra-high-throughput screening (uHTS) system. Use of these instruments has promoted flexibility in compound formatting in addition to minimizing waste and eliminating compound carryover. We describe the use of ADE for the generation of assay-ready plates for primary screening as well as for follow-up dose-response evaluations. Custom software has enabled us to harness the information generated by the ADE instrumentation. Compound transfer via ADE also contributes to the screening process outside of the uHTS system. A second fully automated ADE-based system has been used to augment the capacity of the uHTS system as well as to permit efficient use of previously picked compound aliquots for secondary assay evaluations. Essential to the utility of ADE in the high-throughput screening process is the high quality of the resulting data. Examples of data generated at various stages of high-throughput screening campaigns are provided. Advantages and disadvantages of the use of ADE in high-throughput screening are discussed.
Introduction
High-throughput screening (HTS) remains a critical component for lead finding in small-molecule drug discovery programs. 1 Its modes of implementation have undergone significant changes over the years. Screening throughputs have dramatically increased, and screening approaches continue to evolve depending on the capabilities, needs, and philosophies of each organization. The advent of acoustic droplet ejection (ADE) has had a fundamental impact on HTS campaigns. With this technology, acoustic energy can be focused to accurately and precisely transfer compound solutions in DMSO from a source plate to an assay plate.2,3 Compound transfer by ADE has enabled the robust production and use of assay-ready plates (ARPs) in primary screening and dose-response confirmation of hits.4,5 Many characteristics of ADE make it ideal for such applications. It facilitates the transfer of low and variable amounts of compound and, as such, maximizes the efficiency of compound use. It is contactless, so there is no compound carryover, as can be encountered with tip-based pipetting systems and pin tools. In addition, there are many published examples demonstrating the positive impact that ADE has had on the quality of assay and screen results.4,6–8
Our 1536-well ultra-high-throughput screening (uHTS) system was initially implemented using pin tools to transfer compounds. This method requires wet transfer of compounds into assay plates already containing buffer or reagent, so compound transfer was an integral part of the screening process. In 2008, we added an Echo 550 acoustic liquid handler (Labcyte Inc., Sunnyvale, CA) to the system to enable hit picking from the on-system library. A significant benefit was that we were able to expand the use of the Echo to serve all compound transfer functions on the system. It replaced the use of pin tools for both primary screens and hit confirmation. A second Echo liquid handler (model 555) was subsequently added to increase throughput. The two Echos now serve as the core of the compound transfer function on the uHTS system. Through the generation of ARPs, ADE has increased our screening flexibility by allowing compound transfer into assay plates to be decoupled from assay execution. As such, the use of acoustic dispensers has changed the way we operate our system and conduct screening campaigns for the better.
We have since added a third Echo liquid handler to our screening laboratory as part of a separate, fully automated plate preparation system. This system provides excess capacity for screening plate preparation and also permits the generation of ARPs for a variety of uses, including further follow-up of HTS hits from existing stocks. This article will describe our systems and their applications, discuss benefits and limitations of the use of ADE in screening, and illustrate the data quality by providing results from each stage of our HTS campaigns.
Materials and Methods
The ADE instrumentation and concepts have been fully integrated into our uHTS system to dispense and dilute DMSO-solubilized compounds for primary screening and dose-response confirmation of hits; these two processes represent the key activities in our screening campaigns. The uHTS system consists of two subsystems, the Replication Station and the Screening Station. The Replication Station performs all of the compound transfers using ADE to transfer from source compound plates to assay plates to produce single-concentration and dose-response assay-ready plates (ARPs and DARPs, respectively). These ARPs/DARPs are loaded onto the Screening Station as the starting point for primary screens of the library and dose-response hit confirmations.
uHTS System Configuration
The core hardware of the Replication Station and the Screening Stations is very similar. Each station has a centralized robot (Stäubli TX90; Stäubli International AG, Pfäffikon, Switzerland) used to move plates between devices within the station. The components of the Replication Station consist of four Cytomat 48 Linear Hotels (Thermo Scientific, Waltham, MA) with a 1008-plate capacity per unit, two PlateLoc plate sealers (Agilent Technologies, Inc., Santa Clara, CA), two XPeel seal peelers (Brooks Life Science Systems, Manchester, UK), a VSpin plate centrifuge (Agilent Technologies), a Certus dispenser for DMSO (Leap Technologies, Carrboro, NC), 12 plate lid removers, a plate orientation station (UK Robotics, Manchester, UK), a barcode reader (MicroScan, Renton, WA), a room-temperature plate hotel, a Vision System (UK Robotics, Manchester, UK), an automated gripper calibration station (UK Robotics, Manchester, UK), and two ADE dispensers (
The components of the two uHTS Screening Stations consist of a central Stäubli Robot plus a linear plate pass-through between Screening Station One (SSO) and Screening Station Two (SST). SSO has a Cytomat 24 incubator, a Cytomat 6000 incubator, and a Cytomat 6001 incubator (Thermo Scientific, Waltham, MA); two VSpin plate centrifuges; an XPeel seal peeler; 12 plate lid removers; a plate orientation station; a barcode reader; a room-temperature plate hotel; an automated gripper calibration station; an automated weigh station (UK Robotics, Manchester, UK); a Vision System for seal verification (UK Robotics, Manchester, UK); and two to three BioRAPTR FRD dispensers (Beckman Coulter Inc., Brea, CA). SST is similarly equipped with the addition of two ViewLux readers (PerkinElmer, Waltham, MA) and a PHERAStar FS plate reader (BMG LabTech BMGH, Ortenberg, Germany).
Process Workflow for Screening Campaigns
The workflow for a biochemical screening campaign starts with the production of ARPs on the Replication Station ( Fig. 1 ). Empty, lidded 1536-well assay plates (MaKO 1536; Brooks Life Science Systems, Manchester, UK) are loaded into one of two linear hotels designated for destination plates. Library source plates (catalog No. 3730; Corning, Tewksbury, MA), each containing up to 1408 screening compounds with columns 1 to 4 empty, are stored sealed at room temperature in two linear hotels for easy access and are replaced every 6 months. The sealed library source plates (CM) are centrifuged with a VSpin and unsealed with an XPeel prior to transferring the compounds to the empty MaKO plates using the ADE dispenser. Control plates consist of wells of DMSO and wells of control compound in an Echo qualified 384-well low dead volume plate (384LDV, LP-0200 COC; Labcyte Inc.). Each compound and control is transferred (10 to 40 nL, nominal 20 nL) into the appropriate well of the ARP using an ADE dispenser. After all transfers to the ARP are completed, it is sealed with a PlateLoc and its lid is replaced. Filling the blank MaKO plates with compounds and controls produces the ARPs for primary screening. For a 4 µL assay reaction volume, our standard HTS library compounds in the ARP (20 nL at 1 mM) will be at a concentration of 5 µM during the assay reaction.
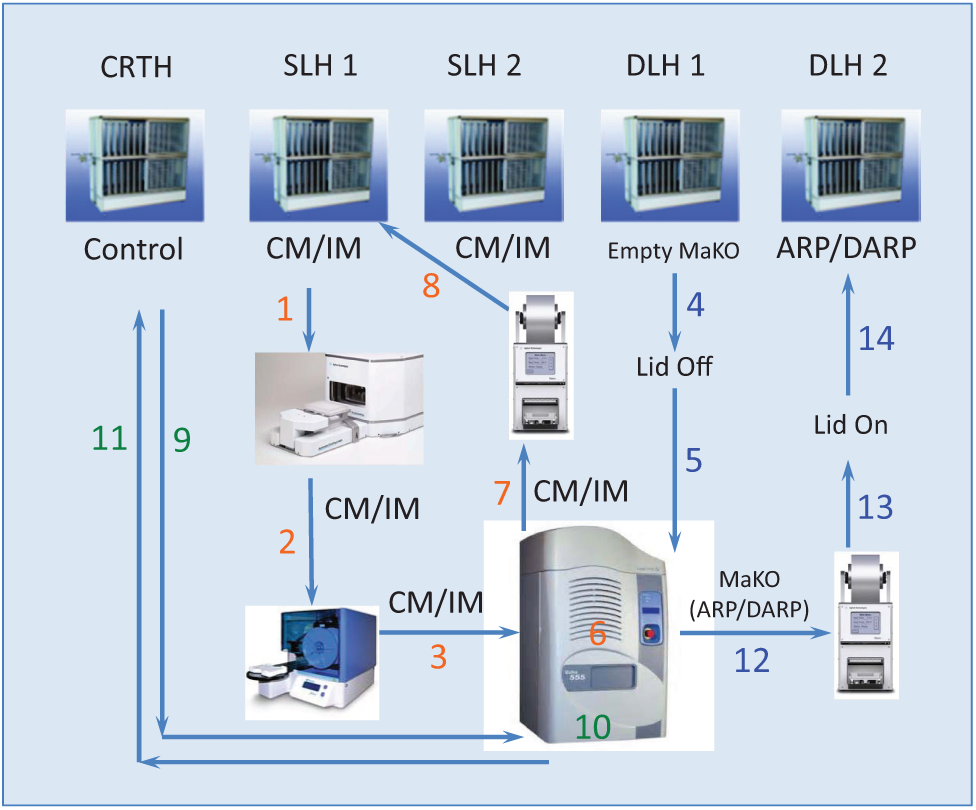
ARP/DARP generation. This schematic illustrates the workflow for preparation of ARPs and DARPs. The steps in the process are numbered. The paths of different plate types through the system are color coded. Orange represents the source CM and IM plates, blue represents the destination ARPs and DARPs, and green represents the control source plate. CRTH, control room-temperature hotel; SLH, source linear hotel; DLH, destination linear hotel; CM, source plate created in compound management; IM, intermediate plate; ARP, assay-ready plate; DARP, dose-response assay-ready plate.
For each target-specific screening campaign, the production of ARPs is tracked by our LIMS system, the Target Management Tool (TNT; Gadgitech Ltd, London UK; to be described in detail in a subsequent article), which is fully integrated with our dynamic scheduling software Revolution. In brief, each ARP is “ordered” from the overall uHTS library in the context of a target-specific project. A target-specific TNT replication order with a list of requested library source plates for replication is generated for each project. The TNT replication order cycles through the ARP production process until all of the requested library source plates in the replication order are prepared and their assay successfully completed. TNT uses the replication order as the basis for generation of a uHTS screening order for each project. Each screening day Revolution works in concert with TNT to select a set of ARPs (typically 200) from the uHTS screening order until all ARPs in the order are completed. A plate is not considered completed until assay data have been generated and accepted.
To initiate a uHTS primary screening campaign, a subset of ARPs is selected from the uHTS screening order and loaded into the Cytomat C24 on SSO. The uHTS screening system can be configured to run a variety of assays such as binding assays, biochemical assays, and cellular assay formats. A routine homogeneous biochemical assay such as a kinase assay will follow a dispense format of enzyme dispense from BioRAPTR A with a single-valve nozzle configuration followed by a substrate/adenosine triphosphate (ATP) dispense from BioRAPTR B with a single-valve nozzle configuration, followed by an incubation in either the Cytomat 6000 or 6001. After completion of the incubation, the ARPs are transferred via the interconnecting slide between SSO and SST. Detection reagent is dispensed from BioRAPTR C using a single-valve nozzle configuration, followed by incubation in the Cytomat 6001 and a ViewLux or PHERAstar read. TNT receives progress notifications from the Revolution protocol to provide the user with failure/completion checkpoints for each ARP. For example, for each ARP, TNT can report ARP initiation into a screening run, status of the plate read, and the occurrence of fatal run errors. A successful read of an assay plate by either the ViewLux or the PHERAstar FS reader signifies a successful physical run of the ARP through the uHTS system. Each processed assay plate is checked by the end user for acceptable plate statistics through data analysis and review in Genedata Screener (Genedata, Basel, Switzerland). This is the final checkpoint for each ARP and is reported in TNT.
After all of the ARPs in a uHTS screening order have been screened, the active compounds from the primary screen are selected, and this subset of compounds must be picked from existing stocks ( Fig. 2A ). To facilitate fast and efficient dose-response hit follow-up, each compound in the uHTS screening library has been replicated into a few sets of 384 REMP tubes (7 µL at 10 mM) and stored in a −20 °C REMP automated storage system (Brooks Life Science Systems, Manchester, UK). The active compounds are cherry-picked using the REMP Tube Punching Module from the REMP −20 °C liquid sample storage unit and transferred using a positive displacement pipettor into a 384LDV plate to form the cherry-pick source plate. The dynamic dispense range of the ADE technology is insufficient to span the concentration range of the desired dose-response curve using the 10 mM stock. Therefore, intermediate concentrations must be made to complete the production of DARPs using ADE ( Fig. 2B ). Four intermediate dilutions are prepared from each 10 mM compound source in a 384LDV plate using ADE dispensing coupled with a bulk DMSO backfill. Each compound is present in this IM at four concentrations: 5 mM, 164 µM, 8.3 µM, and 4.2 µM. Each compound concentration in the IM is acoustically transferred into up to 3 wells of a 1536-well plate in distinct volumes to yield a 10-point dose titration from 25 µM to 2.6 nM. Sets of DARPs (typically three to five copies) are produced to accommodate the planned number of dose-response hit follow-up assays. The setup and procedures for running of the DARPs on the uHTS system are the same as the ARPs with some changes to the Revolution protocol to account for differences in plate and assay configuration.
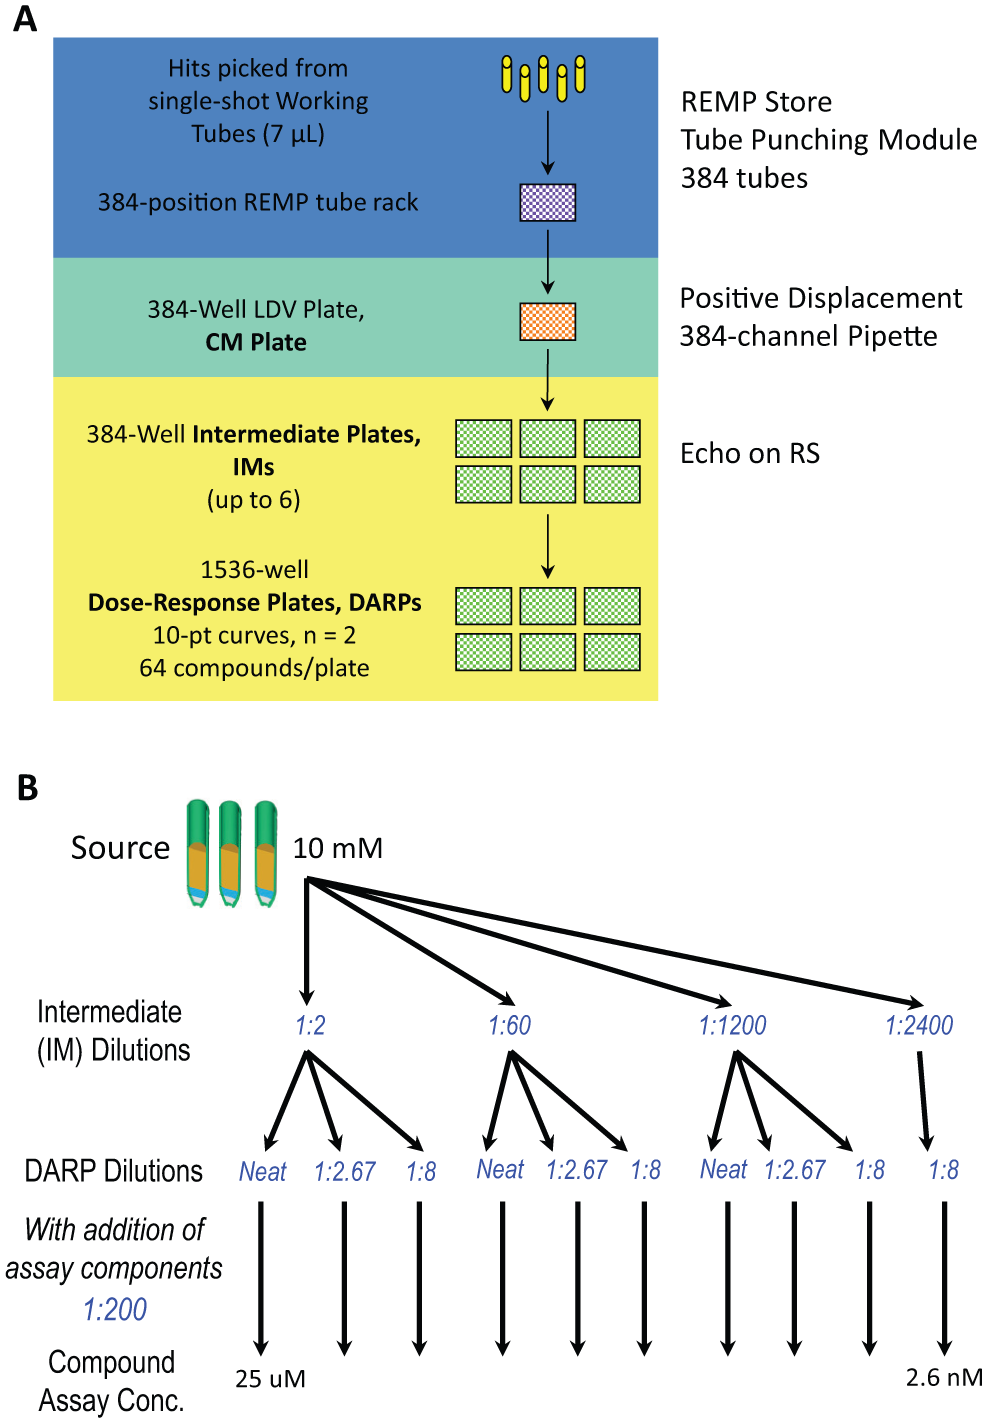
Preparation of dose-response titrations for follow-up of screen hits. (
ADE Dispenser Integration and Monitoring
A custom device driver was developed (Gadgitech Ltd, London, UK) in C#.Net using the Labcyte Application Programming Interface to control and extract transfer and survey data from the Echo liquid handlers on the uHTS system (
Fig. 3
). All data are persisted to a custom developed Oracle 10g database (Echo database) within a database farm, which also hosts our compound library information (Mosaic Software; Titian Software, London, UK). All survey and transfer data are visualized and analyzed in near real time using a custom developed (Gadgitech Ltd, London, UK) quality control (QC) application, which allows for automated error notifications via email and for manual user analysis via color-coded survey and transfer maps (
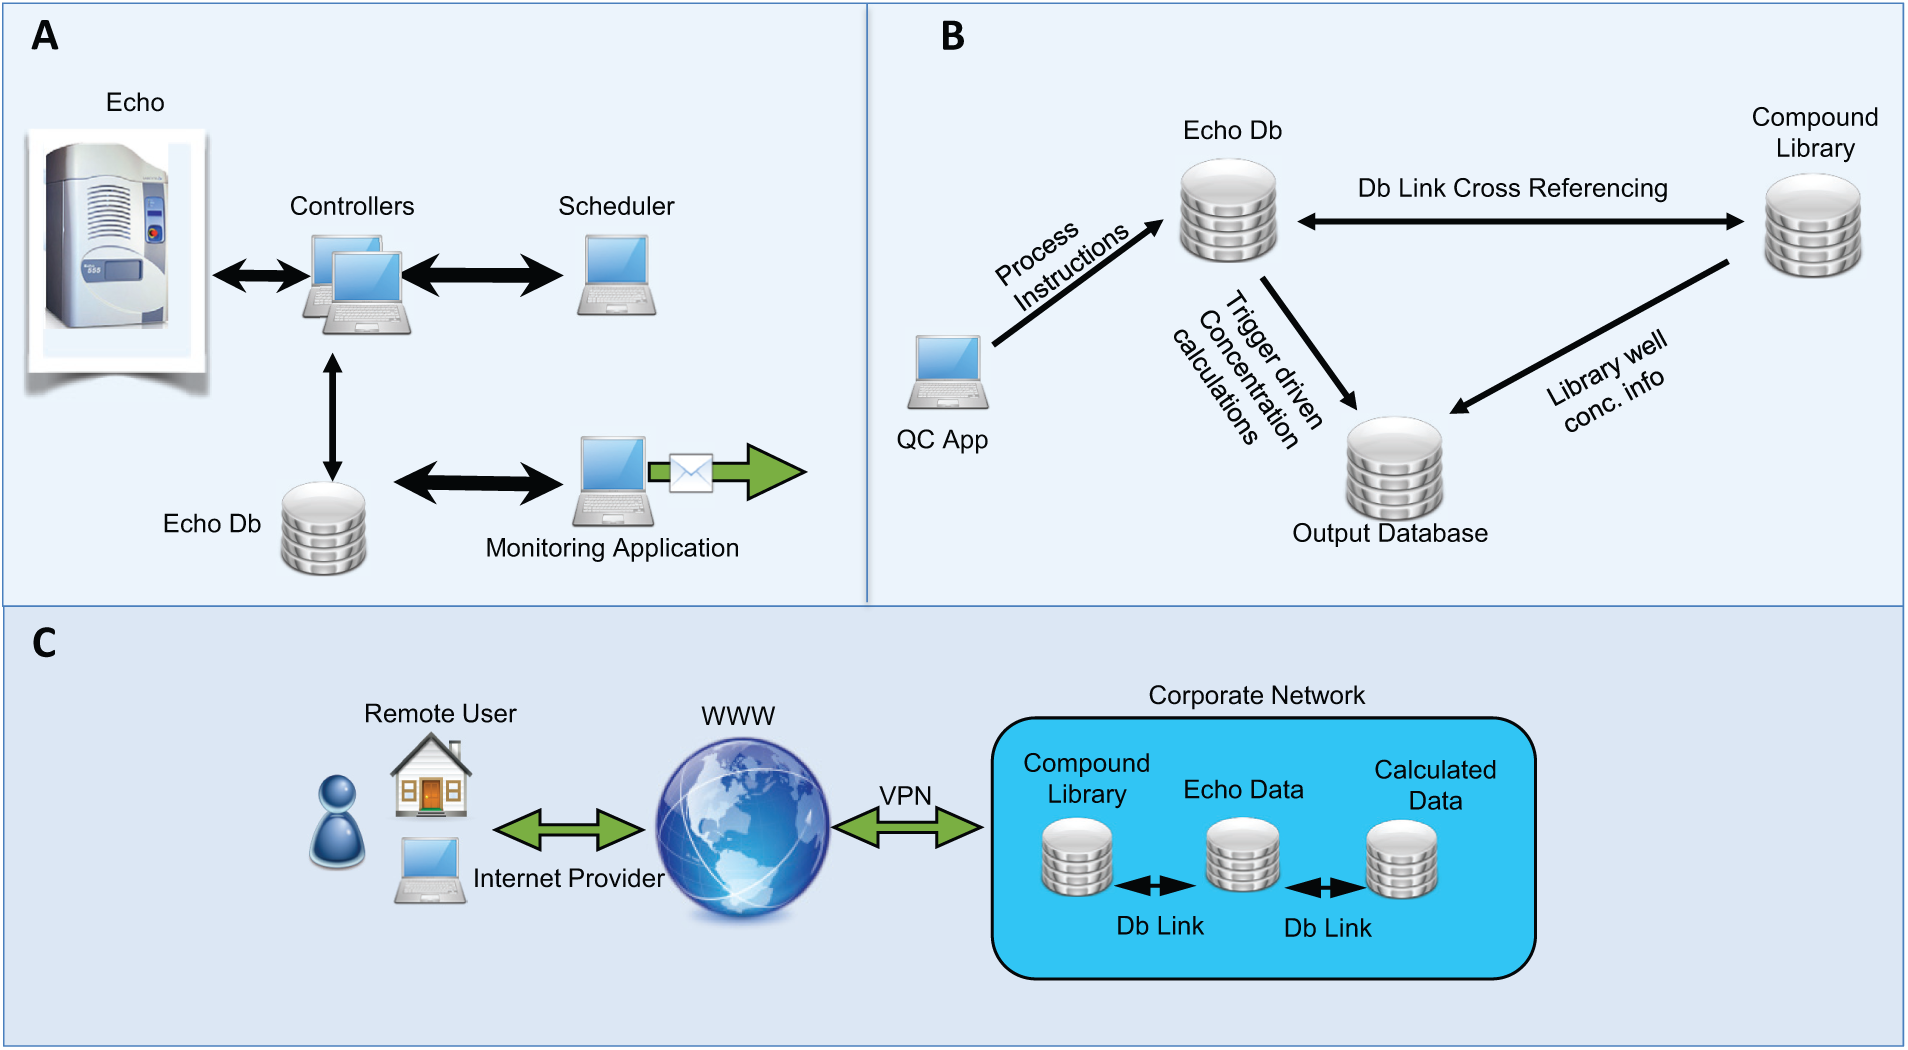
Echo quality control architecture. (
The Echo QC application guides the user through the process of compound mapping and final concentration calculations for streamlined migration to an assay data analysis tool (Genedata Screener). Echo and compound library databases are interrogated and cross-referenced to transfer compound identifiers and calculate final well concentrations for single-point, intermediate, and dose-response assay plates in 384- and 1536-well formats ( Fig. 3B ). Multithreaded parallel processing methods coupled with database link (Db Link) technologies are leveraged to ensure efficient data transfer during the compound-mapping and concentration calculation process. This results in low-latency data transfer and calculation speed irrespective of user location ( Fig. 3C ), as all data transactions occur within the in-house database farm. The Echo QC application automatically maps compounds to single-point, intermediate, and dose-response assay plates using a recursive parent plate lookup algorithm that spans plate generations. This facilitates streamlined data analysis workflows and reporting.
Second Fully Automated ADE Plate Preparation System
To enhance flexibility and capacity as well as to incorporate full automation, a second plate preparation system was built around an Echo 555 liquid handler. The system is an Access workstation with Tempo software (Labcyte Inc.; Suppl. Fig. S3). In addition to the Echo, it is configured with a plate sealer, a seal peeler, and a plate centrifuge as in the Replication Station. In addition, it has a Cytomat 24 incubator and a Multidrop Combi dispenser (Thermo Scientific, Waltham, MA). Integral components of the Access system include a robotic arm, barcode reader, lid removal station, and random access plate racks. This system has all of the standard Echo software, as do the Echos on our uHTS system (liquid handler, reformat, dose-response, and cherry-pick). The system has a small footprint because of its focused function in plate preparation.
This system can perform all of the plate preparation functions conducted on the uHTS system, although in lower throughput because of the presence of only one ADE liquid handler. In addition, it can perform more specialized or customized functions. For example, we use it to pick subsets of HTS hits for further evaluation. For these functions, pick lists of hit subsets are generated for use in conjunction with the Echo cherry-pick or dose-response software. Instrument protocols are established with the appropriate software, and the system protocol is generated with the Tempo software. The set of plates containing the selected hits is loaded onto the system, and the run is executed. The transfer results are captured through the Echo reporting function and are transformed within Excel into a format suitable for use in compound mapping.
Assays and Data Analysis
The 1536-well screening data were generated with homogeneous biochemical binding or enzyme activity assays. Target classes represented include kinase, deacetylase, demethylase, and bromo domain. The assay technologies used include time-resolved fluorescence energy transfer (TR-FRET) binding, TR-FRET activity, adenosine diphosphate generation detected by fluorescence polarization, and ATP consumption detected by luciferase luminescence. A typical protocol for an enzyme activity assay follows: add 2 µL enzyme to 20 nL compound in an ARP, mix by centrifugation and incubate for 10 min, add 2 µL substrate to start the reaction, mix by centrifugation and incubate for 1 h, add 3 µL detection reagent, mix and incubate for 10 to 60 min depending on the detection technology, and read the plate on a ViewLux reader.
Assay controls included total controls (maximal signal; all assay components with DMSO as sample), background controls (minimal signal; no target protein with DMSO as sample), and antagonist control (all assay components with a specified inhibitory compound as sample). The temperature and duration of ARP storage were not rigorously controlled. If ARPs were to be stored beyond a week, they were maintained in a −20 °C freezer. More recently, we moved to minimizing the time between plate preparation and usage and now store the plates at −20 °C (even if only overnight) to limit drying of DMSO in edge wells.
Dose-response curves were analyzed with Genedata Screener using the SmartFit curve-fitting strategy with outlier masking to generate relative IC50 values. IC50 values were not extrapolated beyond the highest tested concentration. If the maximal inhibition for a given compound was less than 50%, its IC50 value was designated as greater than the highest tested concentration, and it was excluded from the scatterplot analysis unless otherwise noted. If inhibition was greater than 50% but still incomplete, the bottom end of the curve was fixed at 100% inhibition. For analysis of reproducibility of multiple replicate curves for a single compound, mean and standard deviation of the IC50 values were calculated. To assess comparability of IC50 values for a large number of compounds across two sets of evaluations, the pIC50 values were calculated, the two values for each compound were plotted against each other as scatterplots in Vortex (Dotmatics, Herts, UK), and the data were fit to a linear equation.
To illustrate the utility of ADE dispensing in lower-throughput secondary assays, compound binding to a bromo domain protein was assessed by 19F-NMR through competition with a fluorine-containing reference compound. Protein and reference compound were added to test compounds that had been dispensed into 384-well plates by ADE. 19F-NMR signal-to-noise ratios obtained from the NMR software, TopSpin 3.0 (Bruker, Rheinstetten, Germany) were used as a direct measure of reference compound binding. The signal-to-noise ratio stemming from free 19F-labeled compound determined in the absence of protein was 22 and that of bound compound determined in the presence of protein was 2. Because of the competition format of the NMR follow-up assay, a signal increase represents higher binding affinity of the HTS hit.
Results and Discussion
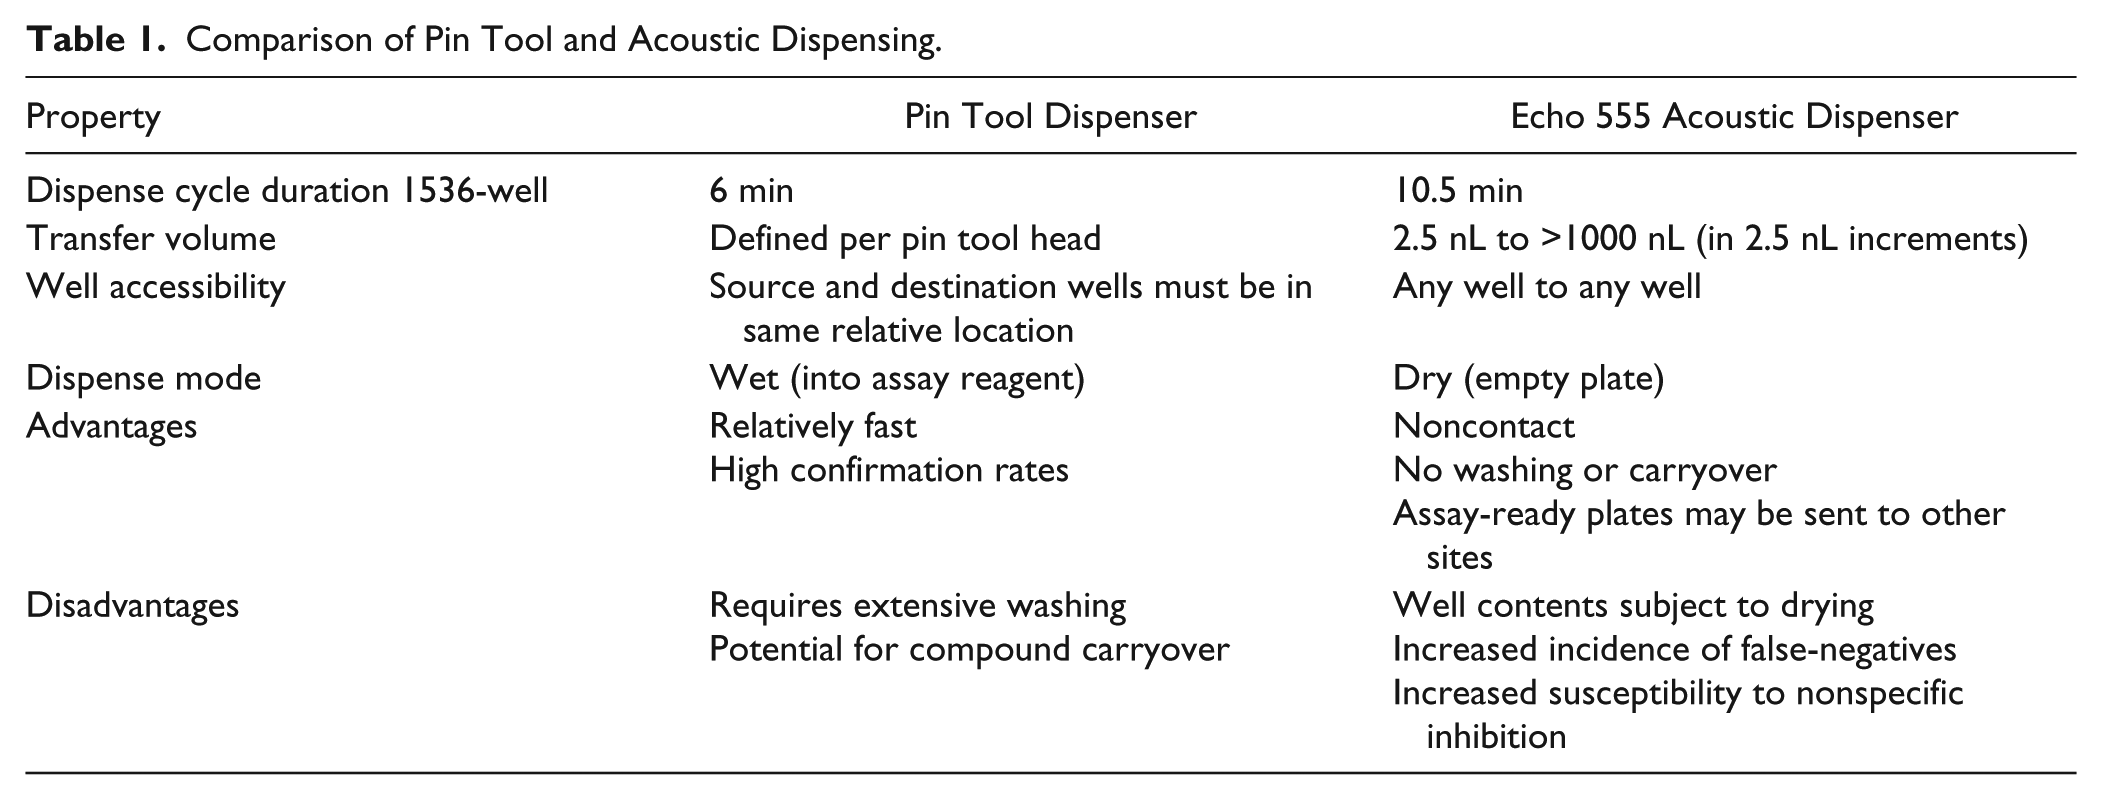
The move from pin tool dispensing to acoustic dispensing significantly altered our uHTS processes and results. We have since gained significant experience with ADE dispensing in screening. Greater than 60 million single-point compound wells and 400,000 dose-response titrations have been generated by ADE for screening campaigns since its integration into our uHTS processes. Table 1 provides a comparison of the two compound-transfer methods. Both methods represent direct dilution methods and require no IMs for primary screens, and as such, they offer significant advantages over tip-based procedures. Importantly, both techniques are suitable for 1536-well assays. Similarly to pin tools, ADE can be used for addition of compounds to assays in progress; however, in screening applications, it is most often used for preparation of ARPs. As such, our discussion will focus there. Direct comparisons of screening results obtained using ADE and pin tools for compound transfer have been reported, and discrepancies were noted.9,10 Although the GNF team saw 96% agreement in potency values between the two dispense methods in BaF3 proliferation assays, many of the remaining 4% of the compounds showed lower potencies with the generation of ARPs through ADE dispensing. The group at Novartis found similar but more pronounced differences, indicating that both hit rates and confirmation rates were lower for ADE dispensing than for pin tool transfers. Both groups attributed the differences to unfavorable compound properties, including poor solubility and adsorption to assay plates.
Comparison of Pin Tool and Acoustic Dispensing.
Many of these problems associated with the use of ARPs appear to be exacerbated by time; for example, some anomalies may arise due to drying of the DMSO from the compound aliquots coupled with the inability to reconstitute the compounds from the dried spots. In fact, the Novartis group recommended the preparation of ARPs in “just-in-time” mode.
10
In carefully conducted studies, Eriksson et al.
11
generated reproducible IC50 values with ARPs stored for up to 6 d under ambient conditions and up to 13 d with −20 °C storage; furthermore, they showed similarly good stability of DMSO drop size, as detected by microphotography. Nevertheless, our observations in practice led us to carefully consider conditions for ARP handling. For example, duplicate dose-response curves from one of our confirmation screens (
Acoustic dispensing has many advantages over pin tool dispensing, particularly related to flexibility and the noncontact nature of the dispensing process; however, it can be somewhat slow. In fact, the time required for preparing a primary screening ARP (10.5 min) or a DARP (13.5 min) with compounds and controls sourced from separate plates exceeds the typical pace time for assay plate input into our uHTS system (4–6 min). This speed limitation is addressed in many laboratories by engaging multiple ADE instruments in the dispense process. The use of two acoustic dispensers in our HTS system has cut the average time per plate produced to 5.5 min for primary ARPs and 7 min for DARPs. Although the rate of ARP generation remains very similar to the rate of plate screening, this is not detrimental, because the two are conducted as discrete processes. Nevertheless, there may be pressure during a screening campaign to maintain plate production ahead of use. Even though it is feasible to prepare the full plate set in advance of the screen, the risks related to prolonged storage (discussed previously) have led us to avoid this practice.
Use of the Echo liquid handler in conjunction with the Echo QC software has facilitated tracking of compound transfers. Records of compound surveys and transfers are maintained in a database, and a variety of visualizations and queries facilitate monitoring of results to improve the QC of transfer processes and to simplify investigation of discrepancies. This software facilitates accurate mapping of specific compound information to assay plate wells. With pin tool compound transfers, failed transfers of individual compounds often go unnoticed, whereas on the Echo, a record is generated of the success or failure of each transfer (
The accuracy and precision of ADE as a dispense technique has been rigorously validated through directed studies conducted in a number of labs.8,10,11,14 Here we share data obtained from practical implementation of ADE in our uHTS campaigns. We have used ADE dispensing in the conduct of 1536-well primary screens and dose-response confirmation assays as well as in cherry-picking of confirmed hits for additional, lower-throughput 384-well evaluations. Typical compound volumes in our 1536-well assays range from 10 to 40 nL (most often 20 nL). Figure 4 shows the reproducibility of single-point inhibition data for replicate plate sets from the validation screens of two kinase targets. To ensure that suitable ranges of compound potencies were represented, kinase-focused compound sets were selected for this analysis and were assayed against each target multiple times. The data show strong correlation between the first two sets of data collected for each target, with only a few outliers. The variability of the compound and antagonist control replicates is comparable to those observed for the total and background controls, which have DMSO alone as the Echo-dispensed sample. Notably, the variability in the data encompasses both compound dispense variation and assay variation, and it falls well within accepted standards, as indicated by the linear regressions with slopes near 1 and intercepts near 0 and excellent correlation coefficients (R2 = 0.98 and 0.97).
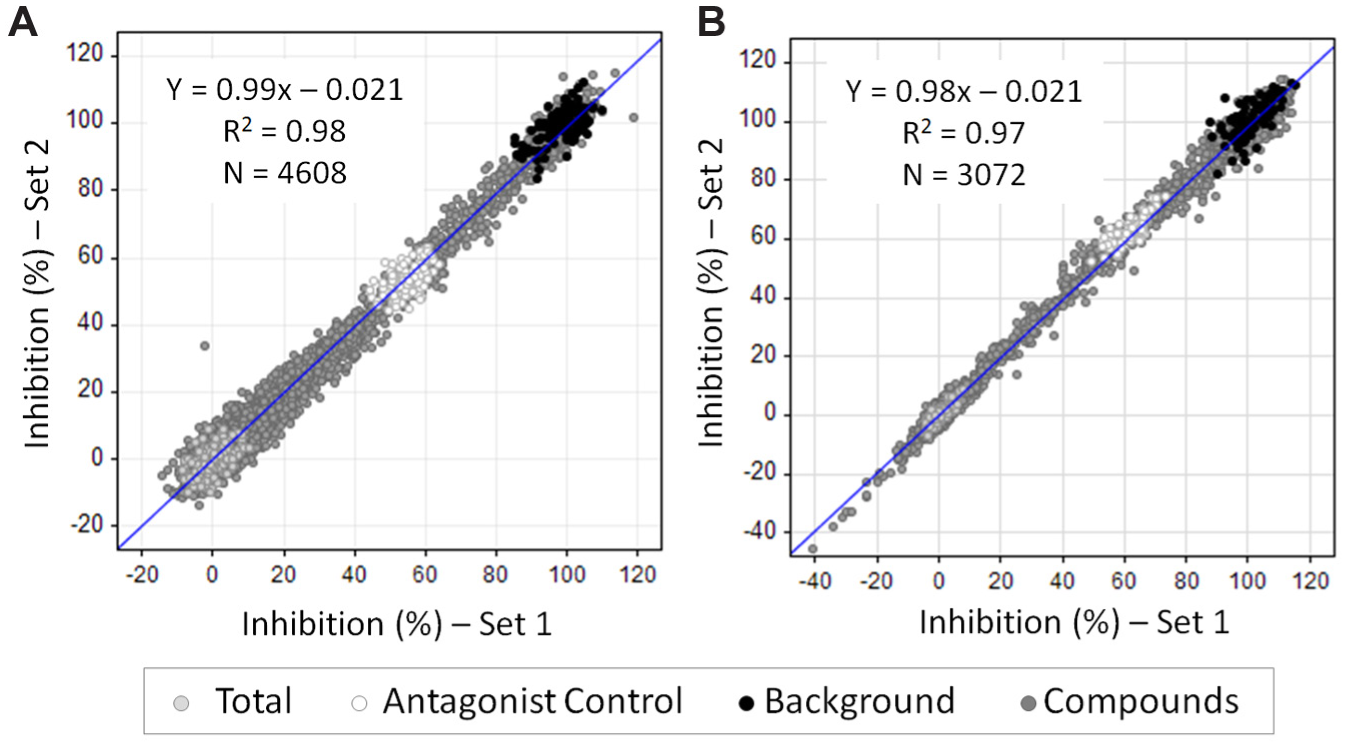
Reproducibility of single-point inhibition determinations. Scatterplots compare percentage inhibition values for two replicates of each compound or control well against (
Assay-ready compound plates are typically generated for dose-response evaluations in a two-step process. Because of the large range of volumes that can be transferred accurately by ADE (~2.5 nL to 5 µL), only two dilution steps are required to access a broad range of final compound concentrations. Typically, final concentrations are evenly spaced, although ADE dispensing does not impose such restrictions. First, an IM is generated, and then it is used as the source for generation of the dose titration in the assay plate ( Fig. 2 ). IC50 values generated with 1536-well DARPs show excellent between-plate reproducibility, as illustrated with six assays representing four target classes and three detection technologies ( Fig. 5 ). The curves for the six assays in this study were generated from 10-point duplicate dilution series. Each curve was run in a separate plate, and all plates for a given assay were evaluated in a single run. In all cases, the coefficient of variation across the set of curves (ranging in number from 31 to 99) was less than 15%. Again, as for single-point determinations, this variability in dose-response curves includes both assay and compound dispense variation. The results in the demethylase assay ( Fig. 5F ) show a fair amount of assay variation, as indicated by the spread in the curve plateaus at low compound concentration. Nevertheless, the reproducibility of the IC50 values remains high. IC50 values from tip-based serial dilutions were available for the control antagonists in three of these assays. In all three cases, the IC50 values achieved by ADE and tip-based compound titrations were within 30% of each other.
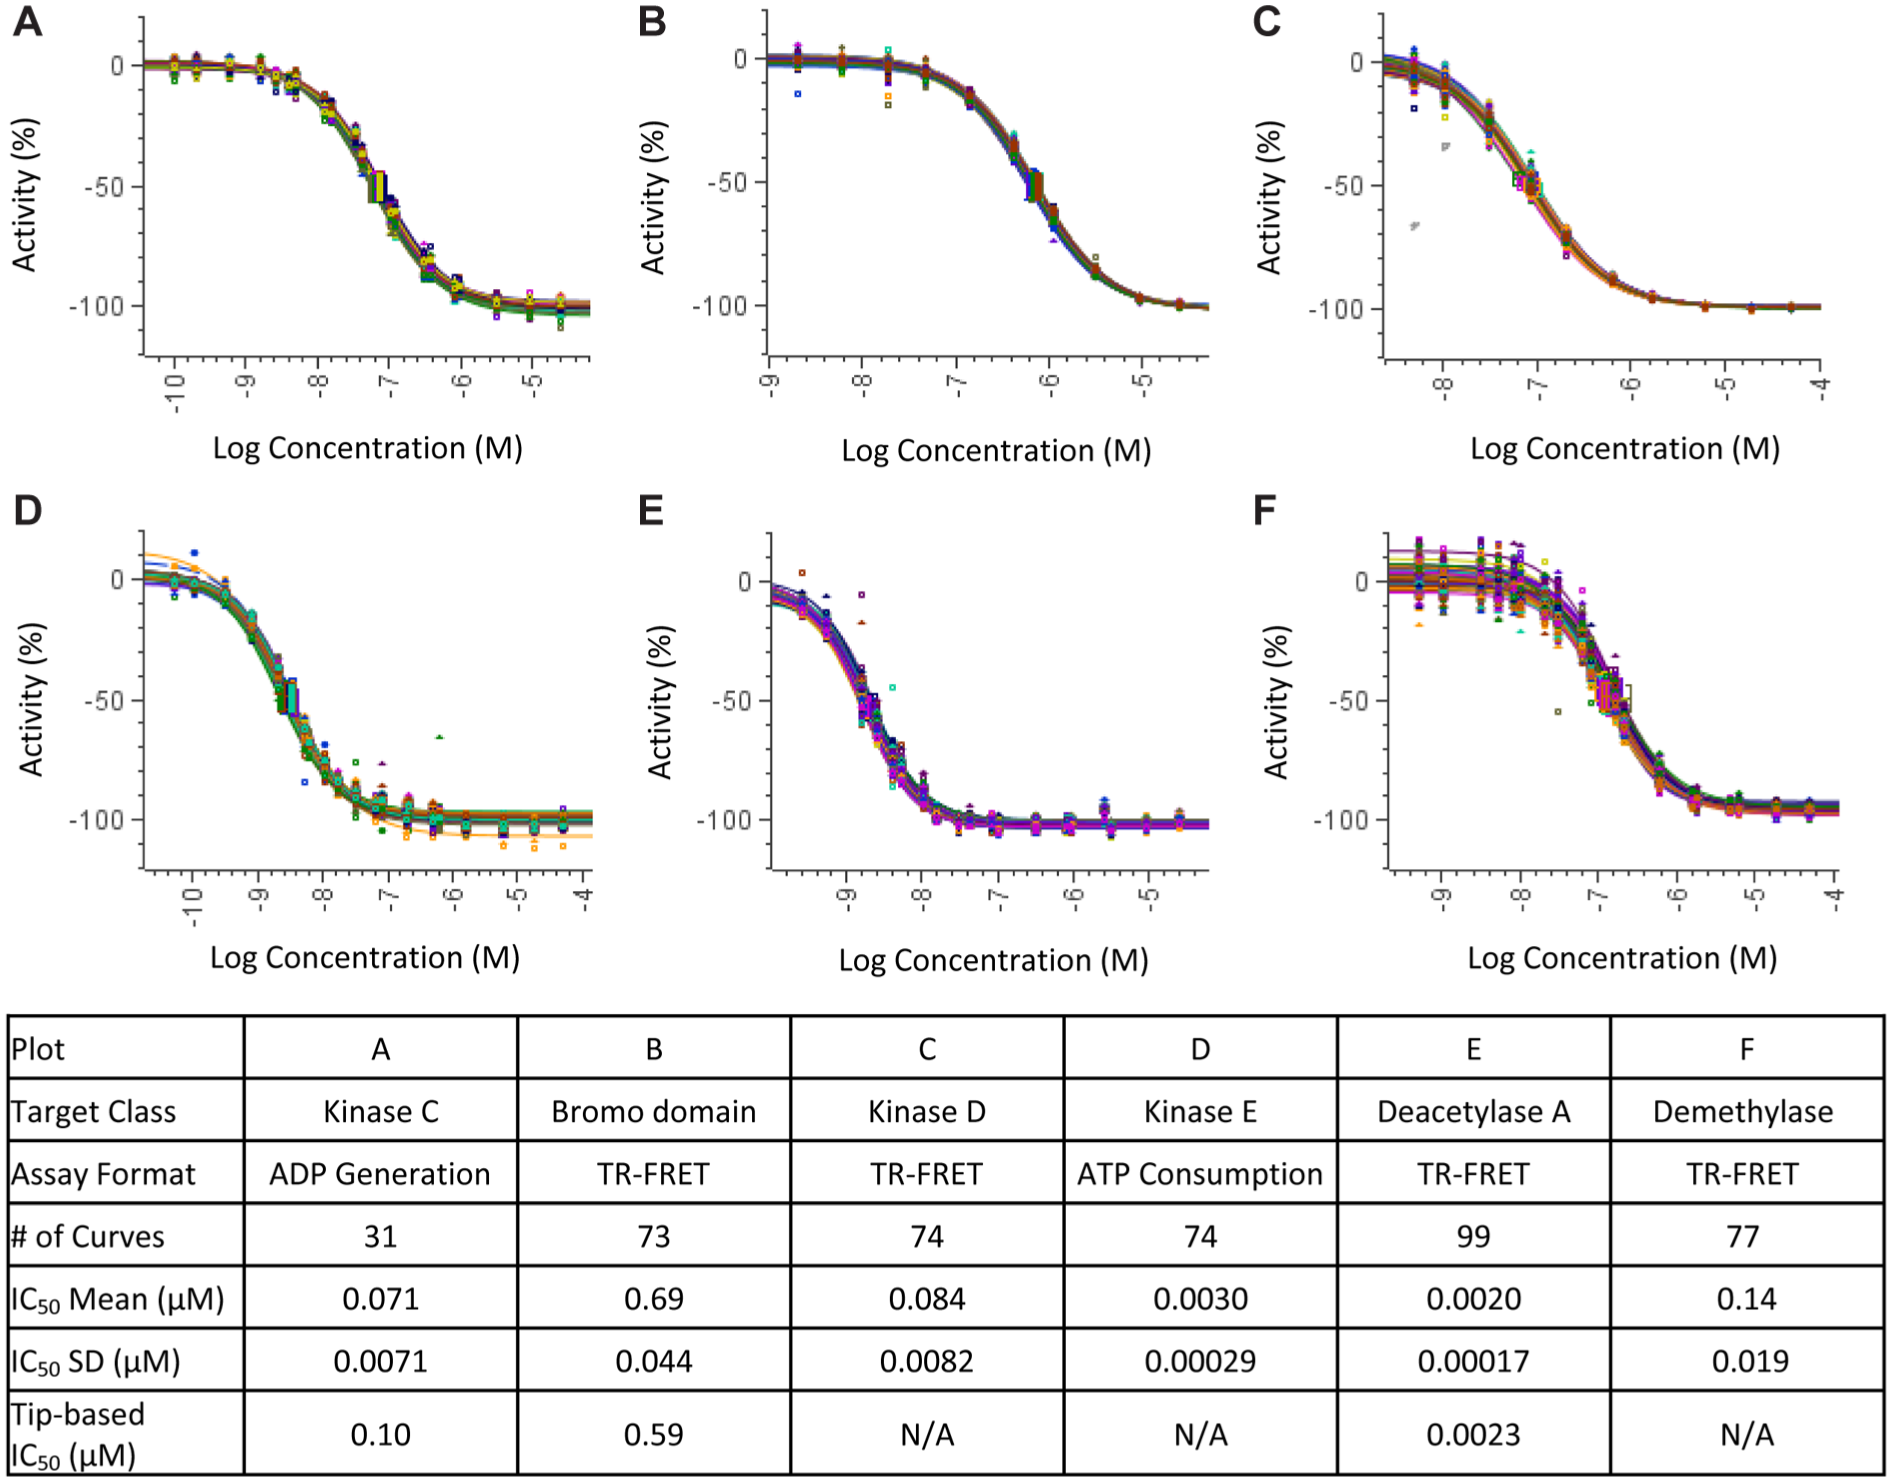
Replicate dose-response titrations of control antagonist compounds in 6 assays. Control compounds were assayed as dose titrations in 1536-well plates as 10-point curves with N = 2 in six different assays (
Preparation of dose-response curves by ADE is inherently more robust than typical serial dilutions, 14 because the accumulated error is minimized with only two levels of dependent dilutions as in our applications. Dose-response curves generated with pin tool dispensing often involve the use of a compound source that has been serially diluted by a tip-based method. Notably, computational studies based on patent literature showed that tip-based serial dilutions may lead to inaccurate potency data and erroneous interpretation of the results. 15 In those studies, different pharmacophore models were generated from potency data generated by tip-based methods as compared with ADE. Furthermore, the pharmacophore model generated from tip-based serial dilutions was inconsistent with crystal structures and did not correctly predict potencies of additional compounds. In addition to cumulative errors from serial dilutions, tip-based methods may be compromised by carryover, contamination of the samples by leachates from the tips, or compound adsorption. 16 Of these contact-based dispense issues, only adsorption affects ADE, and its effect posttransfer can be minimized by limiting the time between plate preparation and use. However, both transfer methods are subject to artifacts relating to compound storage in plates, such as water absorption leading to precipitation or contamination with leachates from plates.
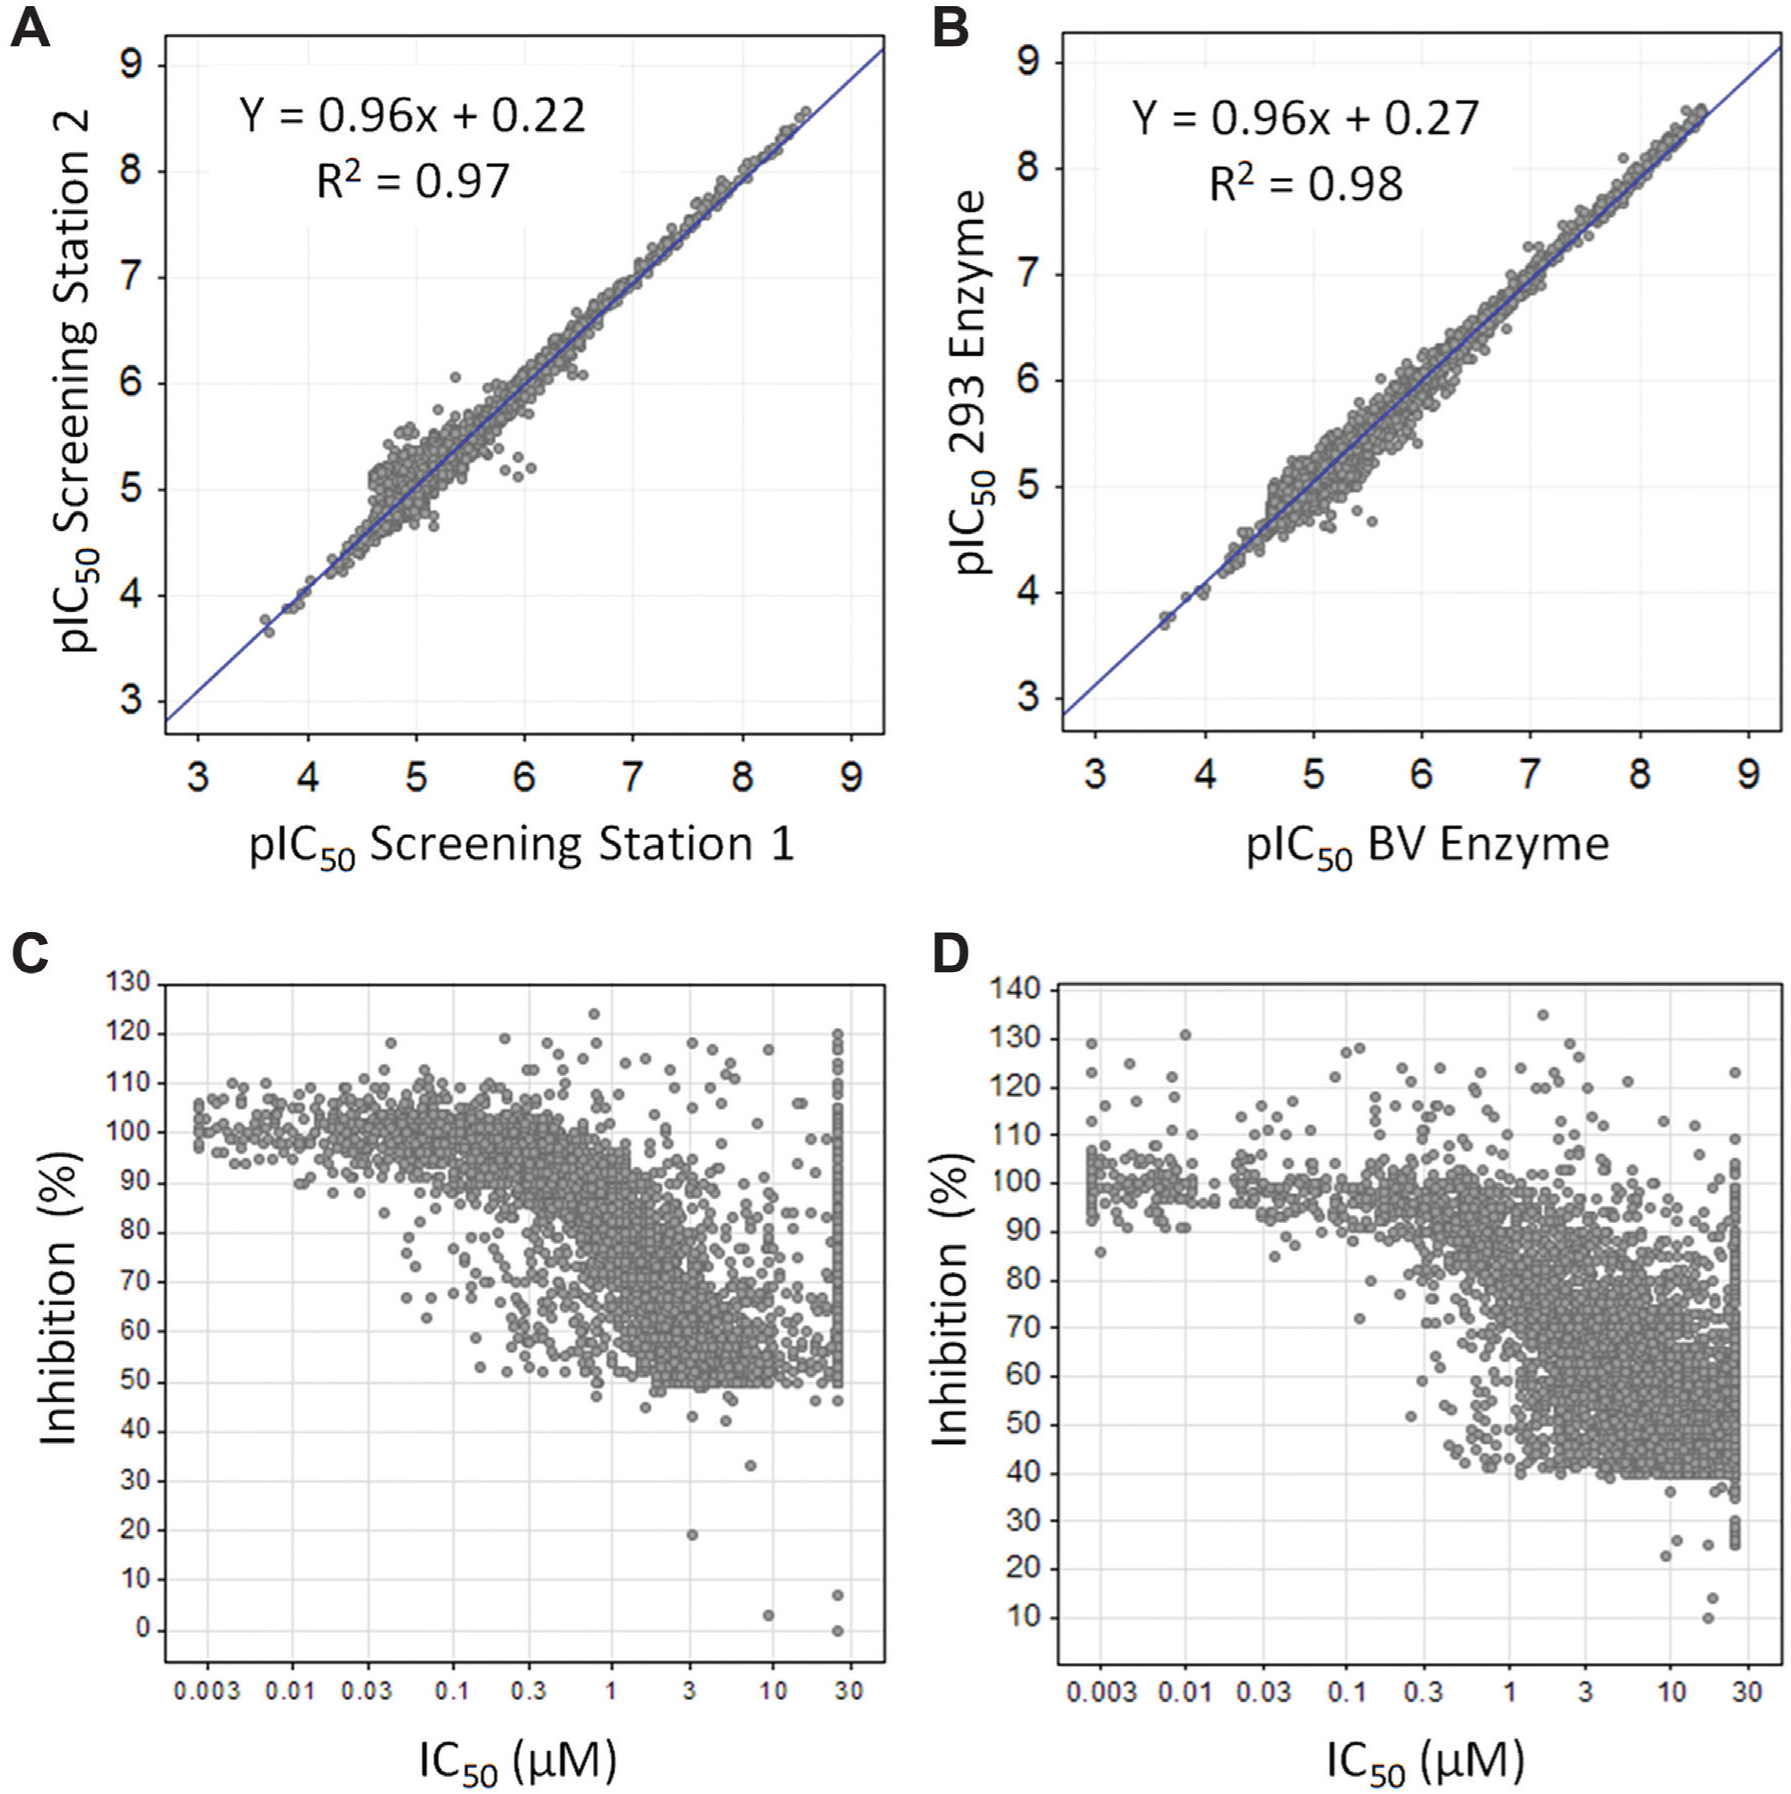
Primary hit compounds from a deacetylase screen were assayed in two pairs of related TR-FRET assays to assess the reproducibility of potency evaluations conducted with DARPs generated by ADE ( Fig. 6A , B ). The assays in each pair were closely related to minimize extraneous differences that could contribute to IC50 variability. The first assay pair used the same assay as was used for the deacetylase A primary screen, and it was run on each of two subsystems within our uHTS system (distinct dispensers, incubators, and plate readers, etc.; Fig. 6A ). The second assay pair used a related enzyme, deacetylase B, and it was sourced from two different expression systems, baculovirus and 293 cells ( Fig. 6B ). Both data sets show strong correlations, as indicated by the linear regressions for the potency values generated for the two assays across a broad range of compound potencies. For most of the compounds, the dose titrations begin at a concentration of 25 µM. As such, compounds with IC50 values in the range of about 10 to 25 µM (pIC50 ~4.6 to 5) may have incomplete curves; this is likely a contributor to broadening of the data spread in this region of the plots. Dose titrations for compounds with lower potencies began with concentrations of 62.5 µM or 200 µM. Consequently, tight correlations were observed for compounds with pIC50 values in the range of about 4. These strong correlations between assay values for each compound across the set require robust generation of a range of compound dilutions on the ADE dispenser.
Dose-response titrations of high-throughput screening (HTS) hit sets. Duplicate sets of hit compounds from a deacetylase screen were assayed in dose-response fashion in two sets of two closely related assays: (
As another way to assess the accuracy and reproducibility of compound plate preparation, we compared primary screen data with dose-response data. Such comparisons require very robust assays and hit sets spanning a broad range of potencies. Toward this end, we show data from a kinase screen and a deacetylase screen ( Fig. 6C , D ). The correlation is strongest for the kinase screen. Given the paucity of selected hits with less than 50% inhibition in the primary screen, the data scatter resembles the top half of a four-parameter logistic Hill curve, as would be expected for a highly correlated data set. 17 Notably, the confirmation rate in this screen was very high at 93%. A correlation exists but is not as strong for the deacetylase screen, which showed a slightly lower confirmation rate at 88%. The weaker correlation may be due to a lower prevalence of highly potent deacetylase inhibitors as compared with kinase inhibitors in the compound library; other possible factors include poorer properties of the compounds in the deacetylase hit set and/or reduced quality of the assay. Solid correlations and high confirmation rates as shown in these two examples are founded upon the outstanding consistency in ARP preparation between the single-point and both stages of the dose-response methods that can be achieved with ADE dispensing.
For hit confirmation and additional follow-up activities, our screening teams are limited to one aliquot of compound (7 µL at 10 mM) from library stocks picked from the REMP liquid compound store. Consequently, they must make economical use of this material. The primary use is for 1536-well dose-response assays to confirm, characterize, and prioritize hits. Assays at this stage may include the primary assay for confirmation, orthogonal assays or detection counterscreens to eliminate compounds that interfere with the detection, assays of related proteins to assess selectivity, and modifications of the primary assay for preliminary assessment of mechanism of action or to eliminate nonspecific inhibitors. A single set of IMs is made to serve all of these needs. Preparation of these plates on the Echo consumes 2.2 µL of each compound, and six or more dose-response assays can be readily conducted from this single set of IMs, even with an assay starting concentration of 50 µM. These methods accomplish very efficient use of the compound stocks and deplete only a fraction of the available material. As a result, compound remains available for other purposes. In fact, there is surplus compound in the original compound management source plate as well as in the IMs.
By leveraging the capabilities of acoustic dispensing, we are able to use this remaining material to supply compound for lower-throughput secondary evaluations of confirmed hits. Such investigations include cellular assays, surface plasmon resonance, 19F-NMR, LC-MS, and mass spectrometry–based activity assays. Their intent is to further validate hits through biophysical confirmation of target interaction, further elimination of nonspecific inhibitors, and/or demonstration of cellular activity. These assays are generally conducted in 384-well plates and use only a selected fraction of the original hit sets. Because of the random-access capability, the Echo dispensers provide a perfect solution for cherry-picking the selected hits from existing plates. The compound management (single-concentration) source plates are typically used when only one or two dilutions are needed, and the IMs (four concentrations) are used when dose titrations are desired. Notably, there are 384 compounds per compound management source plate and 64 compounds per IM, so many more source plates are typically required when picking compounds from the IMs. The Access system enabled us to generate these ARPs for secondary evaluations in fully automated fashion. Figure 7 shows the results for a secondary assay in comparison with the primary assay IC50 data. The secondary assay was a biophysical binding assay using 19F-NMR that was assembled in 384-well plates. 18 Its purpose was to authenticate the hits as direct binders of the target protein. Again, the correlation between these assays is strong. The compounds identified with solid black circles have Hill slopes greater than 1.5 in the primary assay and were suspected to be nonspecific inhibitors. Notably, most of these compounds gave low signal to noise in the 19F-NMR competitive binding assay and were thus considered of low priority for further evaluation. This case provides an example of the use of ADE dispensing to enable further hit authentication efforts without having to procure additional quantities of compound.
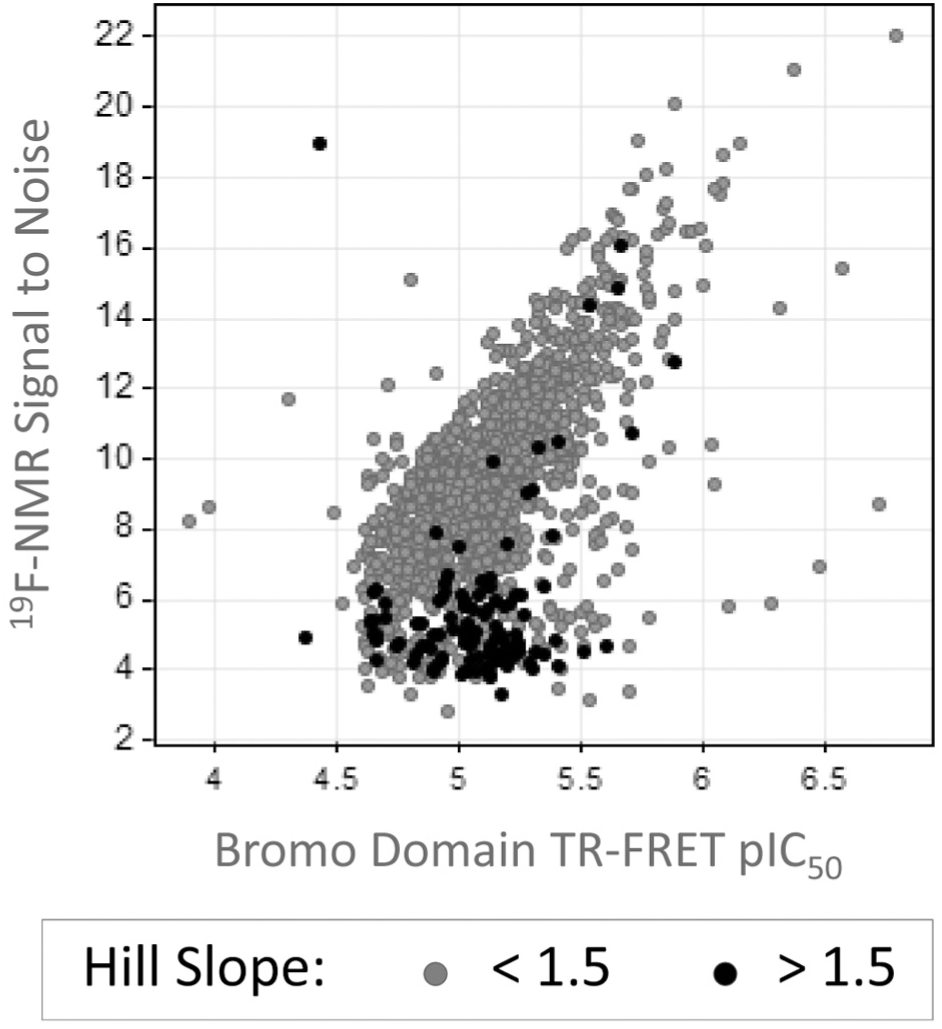
Correlation of potencies in a high-throughput screening IC50 assay with response in a secondary 19F-NMR binding assay. A subset of confirmed hits in a bromo domain screen was assayed for inhibition of binding of a fluorine-containing scout compound by 19F-NMR. The 19F-NMR signal to noise was plotted against the IC50 values in the time-resolved fluorescence energy transfer (TR-FRET) assay. The black circles indicate compounds with Hill slopes greater than 1.5 in the TR-FRET assay.
In the practice of screening ARPs generated by ADE, we encountered a couple of drawbacks. First, we observed an increase in the incidence of nonspecific inhibitors in certain assays when using assay-ready plates as compared with assays with direct compound addition. 19 Nevertheless, we found that this phenomenon could be managed by inclusion of bulking agents in the assay buffer or by initial dissolution of the compounds in the ARP with another assay component prior to the addition of target protein. We postulated that this effect was due to enhanced exposure of susceptible target proteins to compound aggregates upon addition to the ARP and recommend that assays be monitored and optimized to control its occurrence. Second, our maintenance of 1536-well HTS source plates under ambient conditions on the uHTS system leads to hydration of some of the edge wells. This water uptake increases volumes in these wells such that they exceed the working volume of the Echo liquid handlers. Thus, through an indirect effect, those wells become unusable, and we are unable to transfer their contents into ARPs. Minimizing source plate exposure, improving the plate-sealing conditions, and reducing compound volumes in the source plates are potential ways for managing this limitation.
In summary, ADE has contributed significantly to the evolution of our HTS processes to enable more efficient use of compounds and to expand the scope of hit evaluations that can be supplied from the HTS compound stocks. It has improved the quality of our data due to its excellent accuracy and reproducibility as well as its lack of potential for cross-contamination. The benefits of ADE dispensing to our screening campaigns far outweigh the drawbacks. Disadvantages such as speed and potential false-negatives can be managed through procedural optimization. One of our aims in screening is to standardize and streamline processes to minimize errors, and ADE fits well into such a strategy. Nevertheless, it allows flexibility when customization is needed and has promoted greater latitude in our screening methods than is possible with pin tools. The successful application of ADE dispensing in our HTS laboratory has promoted broad adoption of this technology in our organization in areas spanning both small-molecule and large-molecule projects, and its scope will continue to grow as more applications are investigated.
Footnotes
Acknowledgements
We gratefully acknowledge our colleagues in Protein Expression and Protein Chemistry, Krista Bowman, Yvonne Franke, Jiansheng Wu, and their groups for providing us with high-quality purified proteins for our assays. We thank our Compound Management team, Dan Hascall and Jan Seerveld, for supporting our needs for library compounds and the information behind them. We appreciate the efforts of our Cheminformatics group, Nick Skelton, Chandra Goliva, and Hans Purkey, in building our compound library and providing us with the tools to analyze our assay data. We thank Mike Counsell of UK Robotics for creating the Revolution software and for providing hardware and software support for our uHTS system.
Declaration of Conflicting Interests
The authors declared no potential conflicts of interest with respect to the research, authorship, and/or publication of this article.
Funding
The authors received no financial support for the research, authorship, and/or publication of this article.
References
Supplementary Material
Please find the following supplemental material available below.
For Open Access articles published under a Creative Commons License, all supplemental material carries the same license as the article it is associated with.
For non-Open Access articles published, all supplemental material carries a non-exclusive license, and permission requests for re-use of supplemental material or any part of supplemental material shall be sent directly to the copyright owner as specified in the copyright notice associated with the article.