
Abstract
Microarrays provide a platform for high-throughput characterization of biomolecular interactions. To increase the sensitivity and specificity of microarrays, surface blocking is required to minimize the nonspecific interactions between analytes and unprinted yet functionalized surfaces. To block amine- or epoxy-functionalized substrates, bovine serum albumin (BSA) is one of the most commonly used blocking reagents because it is cheap and easy to use. Based on standard protocols from microarray manufactories, a BSA concentration of 1% (10 mg/mL or 200 μM) and reaction time of at least 30 min are required to efficiently block epoxy-coated slides. In this paper, we used both fluorescent and label-free methods to characterize the BSA blocking efficiency on epoxy-functionalized substrates. The blocking efficiency of BSA was characterized using a fluorescent scanner and a label-free oblique-incidence reflectivity difference (OI-RD) microscope. We found that (1) a BSA concentration of 0.05% (0.5 mg/mL or 10 μM) could give a blocking efficiency of 98%, and (2) the BSA blocking step took only about 5 min to be complete. Also, from real-time and in situ measurements, we were able to calculate the conformational properties (thickness, mass density, and number density) of BSA molecules deposited on the epoxy surface.
Keywords
Introduction
A microarray consists of sub-millimeter-sized spots of biomolecules arranged in a regular pattern on a solid substrate. These biomolecules can be DNA,1,2 proteins,3,4 small molecules,5–7 carbohydrates,8–10 and even cells or tissues.11–13 They are spotted, printed, or directly synthesized on solid supports such as glass slides, silicon wafers, and other functionalized substrates. In 1991, Stephen Fodor reported the first DNA microarray fabricated on glass chips by combining the photolithographic method with a directed synthesis of oligonucleotides. 14 DNA microarrays have since been widely used for high-throughput analysis of nucleic acids at the transcriptional level. In 2000, MacBeath and Schreiber fabricated the first protein microarray, using a high-precision pin-type arrayer, with more than 10,000 spots of protein G immobilized on aldehyde-functionalized glass slides. 4 One year later, Zhu and colleagues reported the first proteome-on-a-chip by cloning, overexpressing, purifying, and arraying 5800 yeast open reading frames (which cover 80% of yeast proteins) on a functionalized glass slide. 3 Successes in protein microarrays have enabled characterization of human proteins in the postgenomic era. Peptide microarrays, small-molecule microarrays, carbohydrate microarrays, and cell and tissue microarrays are now available for genomic, proteomic, glycomic, and cytomic research, as well as drug development.
Microarrays have many advantages over traditional biochemistry techniques in analyzing biomolecular interactions. The first is miniaturization. Spots of 0.1 mm or smaller in diameter with nanoscale molecular thickness require minute quantities of target materials for binding reactions. With small spot diameters, arrays with hundreds or thousands of spots can be fabricated on a single glass slide. For example, a 3 × 1 in. microscope slide can hold more than 30,000 spots in a microarray with a spot diameter of 150 μm and a spot-to-spot spacing of 250 μm. The second is parallel detection of binding reactions. In this case, one probe (e.g., DNA, protein, virus, cell) reacts with tens of thousands of surface-immobilized targets concurrently, and the results of these reactions are read simultaneously ex situ (end points only) or in situ (end points or kinetics). It is now feasible to analyze an entire genome-on-a-chip or proteome-on-a-chip for specific molecular or cellular activity.
Immobilizing biomolecules stably on solid surfaces is one of the fundamental steps in microarray fabrication. Before doing so, it is important to consider the intrinsic properties of molecular targets to be arrayed, such as their charges and available chemical groups. Then suitable substrates are fabricated for capturing these biomolecules in an appropriate orientation without altering their conformations and functions. Due to the diverse nature of biomolecules, there is no one solid support optimal for all biomolecules. As a result, it is necessary to find out the optimal immobilization strategy for specific biomolecules under investigation. In general, there are two approaches for efficient attachment of different biomolecules. First, the microarray surfaces are functionalized with specific chemical groups to capture unmodified molecular targets. Second, biomolecules themselves are conjugated with certain molecules that react with specific chemical groups on a functionalized solid support. The first approach is applicable to big biomolecules such as proteins, because there are intrinsic chemical groups (such as lysine) on their surfaces that react with the molecular groups on functionalized solid supports. The second approach is appropriate for biomolecules without proper active groups, such as DNA molecules, oligosaccharides, and small molecules.
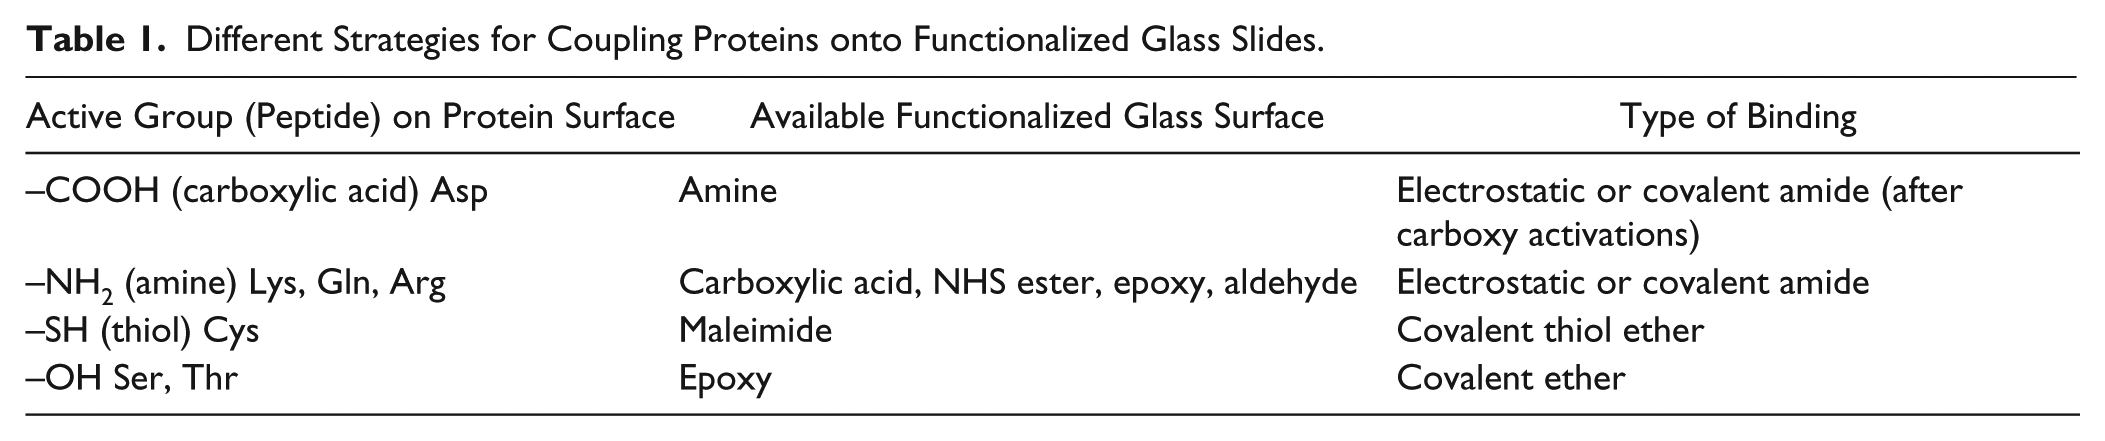
Though different types of solid supports have been applied as microarray substrates, glass slides are by far the most widely used ones. Glass surfaces are rigid, smooth, and easily chemically treated. Functionalized glass slides are appropriate for immobilizing unmodified proteins through multiple active groups on their surfaces. Glass slides are coated with desired chemical groups through silane chemistry for capturing various proteins. Table 1 lists different strategies for coupling proteins onto functionalized glass slides. Particularly, epoxy-coated slides, derived from bare glass substrates through epoxysilane chemistry, are most commonly used as microarray substrates. Proteins are covalently attached to the surface through the epoxy–amine reaction, as shown in Figure 1 . Also, small molecules such as peptides, drugs, and natural products can be conjugated to macromolecular scaffolds for immobilization on epoxy-coated surfaces via amine groups of those scaffolds.15,16
Different Strategies for Coupling Proteins onto Functionalized Glass Slides.
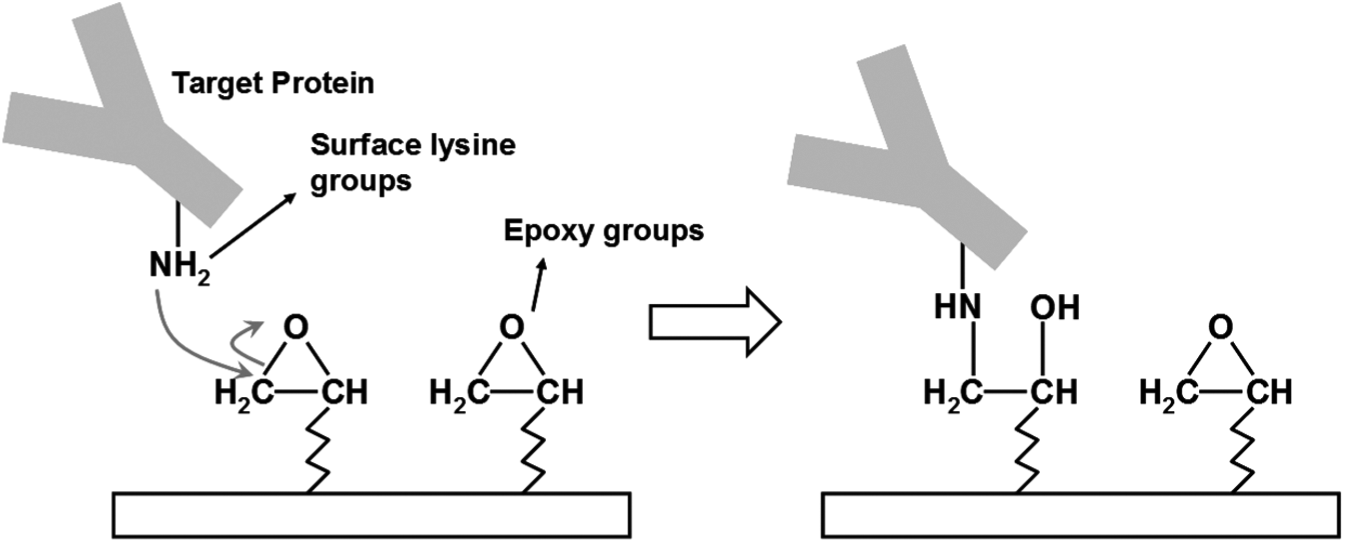
Immobilization of protein targets on epoxy-coated substrates.
It is known that nonspecific interactions between analytes and unprinted yet functionalized surfaces reduce the detection sensitivity and specificity of microarrays. Therefore, surface blocking is usually required before microarray reaction and detection. Although there are many blocking reagents available, bovine serum albumin (BSA) is the most commonly used one in protein and DNA microarrays because it is cheap and easy to use.4,17 According to standard protocols from microarray manufacturers (Thermo Scientific and Arrayit Corporation), the required BSA blocking concentration and reaction time are 1% and at least 30 min, respectively. These experimental conditions come mostly from benchtop experience, and no study was conducted to systematically evaluate the effects of BSA concentrations and reaction time on microarray blocking efficiency. In this paper, using both fluorescent and label-free methods, we try to find the optimal BSA blocking conditions. Fluorescence-based methods have advantages such as high sensitivity, a large selection of labeling agents, and easy manipulation. They are applicable to both real-time and end-point detection of biomolecular interactions. However, in obtaining the binding kinetics, labeling proteins could change their conformational and functional properties, and thus affect the binding affinities and isothermal equilibrium of these proteins.16,18 As an alternative to fluorescent methods, label-free techniques, requiring no external tagging, are more suitable for kinetic measurements. Therefore, to study the blocking efficiency of BSA on epoxy-functionalized substrates for microarray applications, a fluorescent scanner and a label-free oblique-incidence reflectivity difference (OI-RD) microscope were applied in end-point and real-time detection, respectively. It was found that a BSA concentration of 0.05% could give a blocking efficiency of 98%. Also, from real-time and in situ measurements using the OI-RD microscope, such a BSA blocking step took only about 5 min to complete. Finally, the conformational properties (thickness, mass density, and number density) of BSA molecules deposited on epoxy surfaces were calculated from the OI-RD data.
Materials and Methods
Protein Targets and Probes
Bovine serum albumin (BSA), rabbit immunoglobulin G (IgG-RB), and Cy3-labeled goat anti-rabbit IgG (Cy3 GT Anti-RB) were purchased from Jackson ImmunoResearch Laboratories (West Grove, PA). All proteins were diluted in 1× phosphate-buffered saline (PBS) and used without further purification.
Fluorescence-Based Characterization
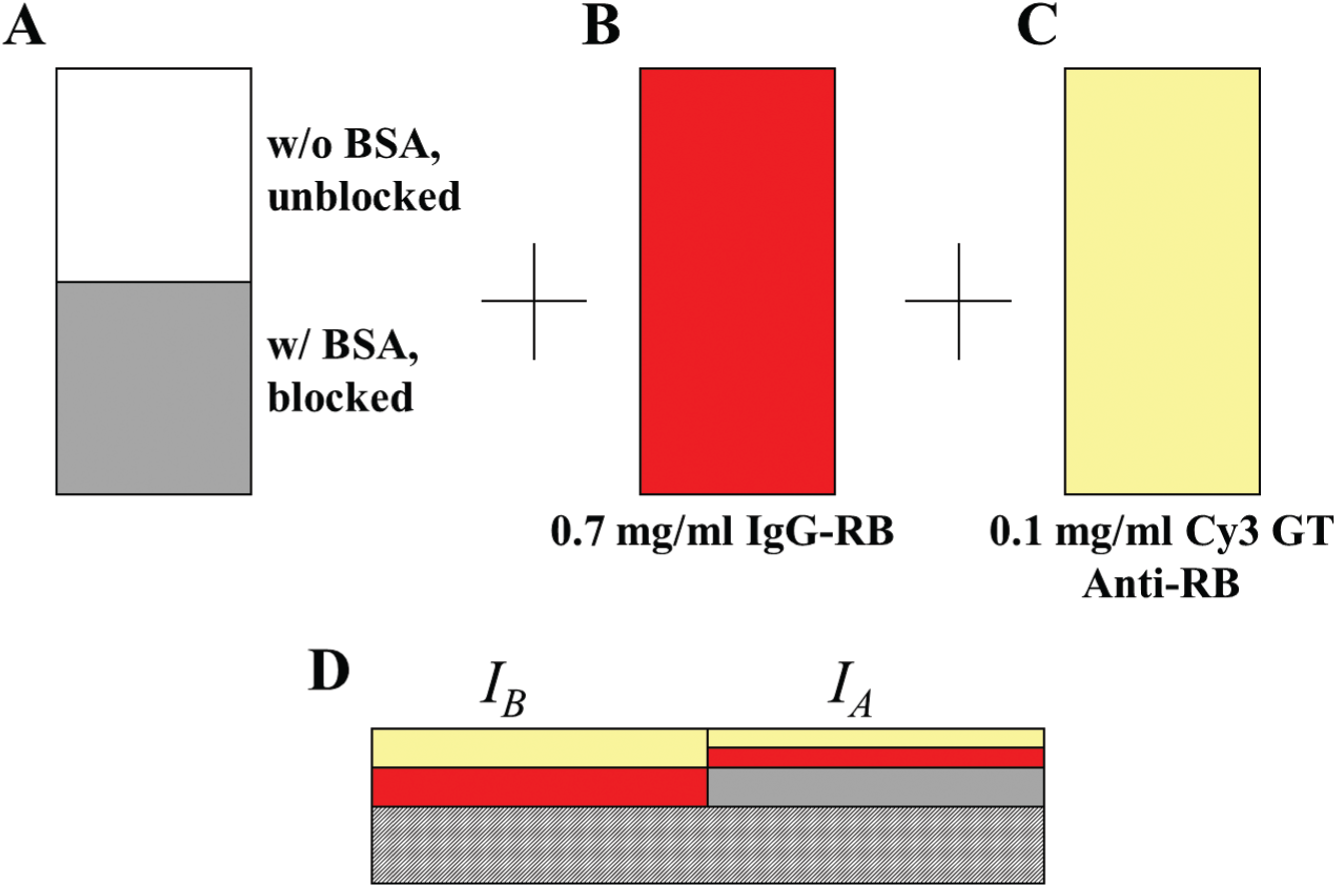
First, as shown in Figure 2A , half of an epoxy-coated glass slide (CEL Associates, Pearland, TX) was covered with a LiftSlip cover glass (Eric Scientific, Portsmouth, NH), and 40 μL of BSA solution (different concentrations, all in 1× PBS) was pipetted underneath the cover glass. The slide was placed in a reaction chamber and allowed to sit at room temperature. Afterward, the cover glass was removed from the slide with a gentle stream of ultrapure water (prepared with a Millipore Milli-Q filtration system, Billerica, MA) and the slide was washed in 1× PBS for 60 s, 1× PBS again for 60 s, 0.1× PBS for 60 s, and ultrapure water for 60 s. The slide was then spun dry in a high-speed microarray centrifuge (TeleChem ArrayIt, Sunnyvale, CA). Second, as shown in Figure 2B , the whole slide was covered by a larger cover glass and reacted with 0.7 mg/mL IgG-RB (dissolved in 1× PBS) for 90 min, washed in four buffers as described above, and then spun dry. Third, as shown in Figure 2C , the whole slide was covered by another cover glass and reacted with 0.1 mg/mL Cy3 GT Anti-RB (dissolved in 1× PBS) for 150 min, washed in four buffers, and then spun dry. Finally, the slide was scanned with a fluorescence scanner (GMS 418, Genetic Microsystems, now Affymetrix, Santa Clara, CA). The power and gain were 20% and 20%, respectively. As illustrated in Figure 2D (side view of the slide), half the slide blocked with BSA reacted with fewer IgG-RB molecules and therefore showed lower Cy3 signal (averaged fluorescent signal = IA). On the other hand, another half of the slide unblocked with BSA reacted with more IgG-RB molecules and therefore showed higher Cy3 signal (averaged fluorescent signal = IB). The blocking efficiency is defined as (IB – IA)/IB. This quantity shows not only how well the surface was blocked, but also the relative amounts of deposited BSA molecules in different concentrations.
(
OI-RD-Based Characterization
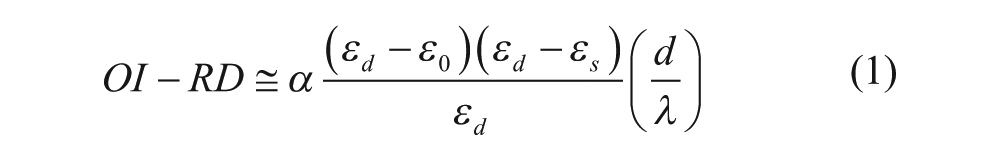
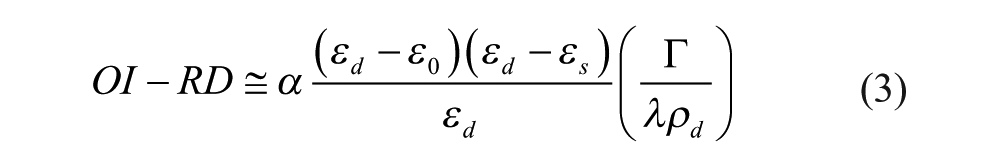
OI-RD is a particular form of optical ellipsometry that measures the differential changes in both phase and magnitude of the reflectivity for p- and s-polarized components of a monochromatic light in response to small changes in physical and chemical properties of deposited thin films. The working principles of OI-RD were detailed in references.19,20 Previously, OI-RD microscopes were applied to study various biomolecular interactions in microarray format.8,13,15,21–26 Zhu and coworkers have shown that the OI-RD signal is given by27,28
where
In these equations, ε0, εs, and εd are the dielectric constants of the ambient (1× PBS), the substrate (BK7 glass substrate), and the protein layer, respectively; d is the thickness of the protein layer; λ is the wavelength of the laser; and θ is the incident angle. By monitoring the OI-RD signal over time, one can determine the corresponding changes in the thickness d and/or dielectric constant εd of deposited protein layers.
Before reaction, a clean epoxy-coated glass slide was mounted onto a homemade reaction chamber. First, about 180 mL of 1× PBS was added into the chamber and the OI-RD signal was recorded over time. Then 20 mL of BSA at a desired concentration in 1× PBS was added into the chamber. Customized software programmed in LabVIEW (National Instruments, Austin, TX) was used to control the OI-RD microscope and monitor the signal in real time.
Results and Discussion
Fluorescence-Based Characterization
To determine the blocking efficiency, half of an epoxy-coated glass slide was blocked with BSA at different concentrations, and the whole slide was reacted with IgG-RB and then Cy3 GT Anti-RB. After taking a fluorescent image, as shown in Figure 3 , the averaged fluorescent intensities of unblocked and blocked regions, IB and IA, respectively, were measured. The blocking efficiency was calculated as (IB – IA)/IB and expressed in percentage. First, to determine the optimal blocking time, a set of measurements were done in different reaction times. As shown in Table 2 , at a BSA concentration of 40 μM, the blocking efficiency was close to 99.2 regardless of the reaction time. At a concentration of 2 μM, the efficiency was only 61.5 for a 10 s reaction, but increased to about 90 as the reaction time became longer than 6 min. This value remained almost constant even at a reaction time of 80 min. We conclude that this BSA blocking took at most 10 min to complete, even though based on past experience it took at least 30 min. Then the blocking efficiency was measured at different BSA concentrations with a reaction time of 6 min. As shown in Table 3 , the efficiencies were 47.6, 83, and 90.3 at BSA concentrations of 0.2, 1, and 2 μM, respectively. As the concentration increased over 10 μM, the blocking efficiency stayed close to an equilibrium value of about 98-99. Therefore, a BSA concentration of 10 μM (0.5 mg/mL or 0.05%) was high enough to efficiently block the epoxy-coated substrate.
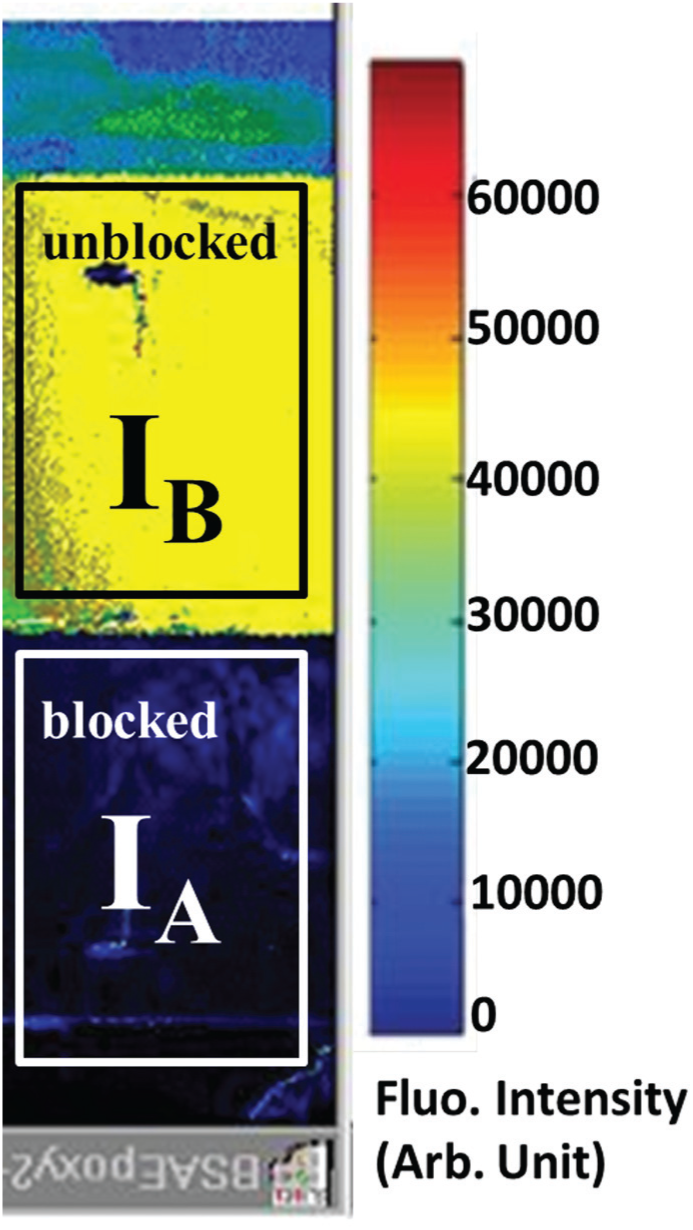
Characterization of BSA blocking efficiency from fluorescent images. In this image, a BSA concentration of 40 μM was used, and the reaction time was 6 min.
BSA Blocking Efficiency Characterized by Fluorescence-Based Measurements: Different Reaction Times.
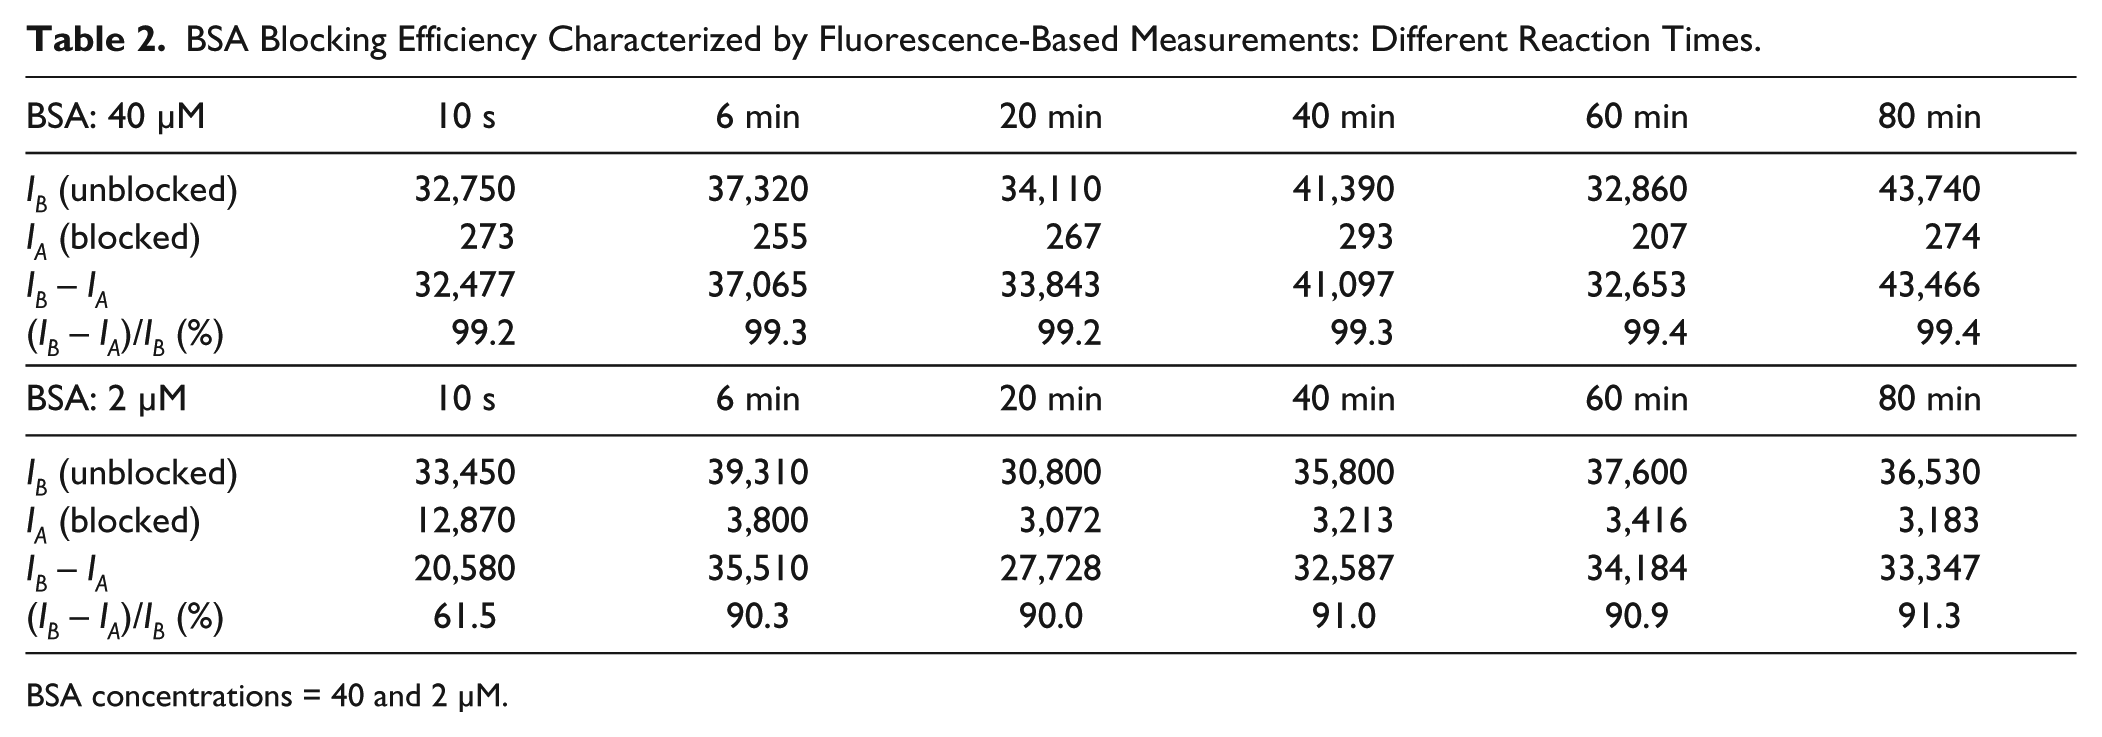
BSA concentrations = 40 and 2 μM.
BSA Blocking Efficiency Characterized by Fluorescence-Based Measurements: Different BSA Concentrations.
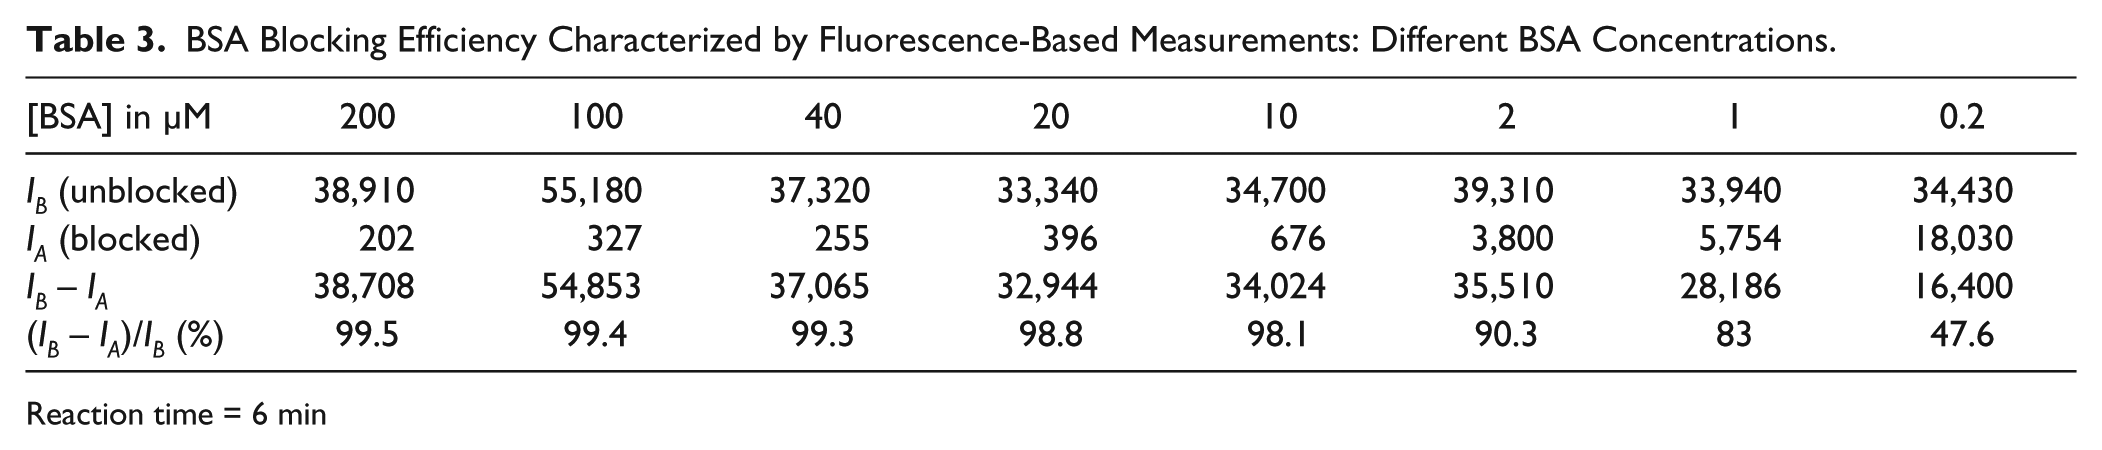
Reaction time = 6 min
OI-RD-Based Characterization
An OI-RD microscope was used to monitor the binding kinetics between BSA and epoxy-coated glass substrates. The measurable OI-RD signal can be converted into surface mass density and number density, and we assume that the deposited proteins cluster together on the surface. Under the condition that the size of the clusters is less than the optical length, Zhu has shown that in eq 1 the thickness d can be interpreted as the average thickness of the protein clusters.
28
The surface mass density Γ can be expressed as
The dielectric constant and volume density of surface-immobilized BSA are εd = 2.031 and ρd = 1.35 g/cm3, respectively.
20
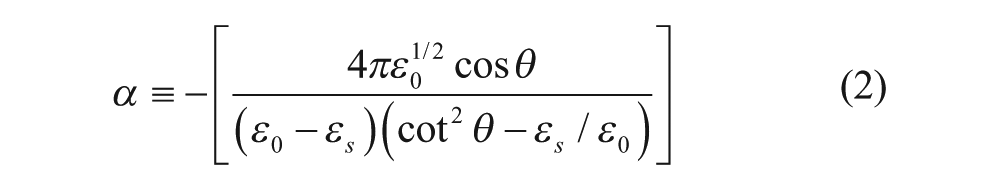
Together with ε0 = 1.788 for 1× PBS, εs = 2.307 for glass slides, λ = 532 nm for a Nd-YAG laser, and calculated α = 46.17, eq 3 gives Γ = (212.3 ng/mm2) × (OI-RD signal). Also, the number density σ is related to the mass density as
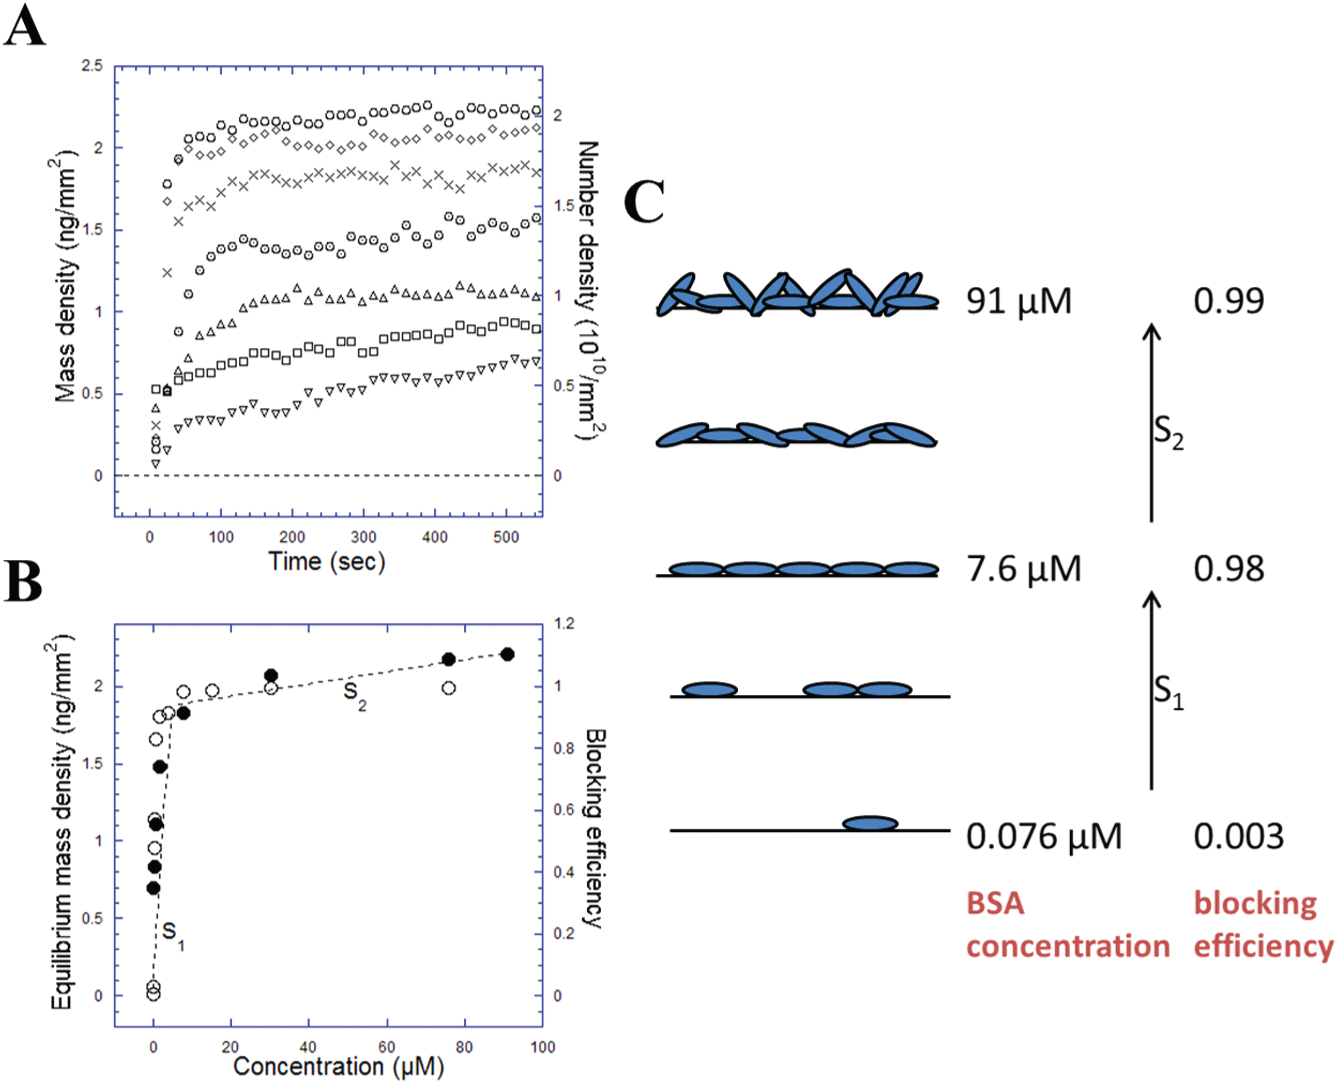
Figure 4A shows the surface mass density and number density as a function of time and BSA concentrations. It suggests that even at low BSA concentrations (e.g., 0.076 μM), a dynamic equilibrium was reached in less than 10 min. This further indicates that it took only minutes instead of hours to finish the blocking process. 4 The equilibrium surface mass density (in OI-RD measurements), together with the blocking efficiency (in fluorescent measurements) as a function of BSA concentrations, is shown in Figure 4B . Some important results can be drawn here. First, the blocking efficiency was close to 1 (0.98-0.99) as the concentration of BSA increased past 7.6 μM, which implies that the epoxy-coated surface is fully covered after this concentration. We could verify this by quantitatively inspecting the corresponding OI-RD data. Various methods such as analytical ultracentrifugation, dielectric dispersion, and transient birefringence have been used to measure the hydrodynamic size of proteins.29–31 Modeled as ellipsoids, a BSA molecule has a size of 4.0 × 4.0 × 14.0 nm with a 0.5 nm uncertainty for each dimension. 30 Using this size of BSA, the surface mass densities were calculated to be 1.9 and 6.8 ng/mm2 in side-on (long axis parallel to the surface) and end-on (long axis perpendicular to the surface) monolayers, respectively. In OI-RD measurements, from Figure 4B , the surface mass density is 1.8 ng/mm2 at a BSA concentration of 7.6 μM, suggesting that a side-on BSA monolayer was formed. Moreover, given that the blocking efficiency is close to 1, this monolayer well blocked the surface. At a BSA concentration of 91 μM, the surface mass density increased to 2.2 ng/mm2, indicating that a monolayer of mixed side-on and end-on BSA molecules was formed. The stacking of BSA molecules on epoxy-coated surfaces is illustrated in Figure 4C . As the concentration increased up to 7.6 μM, more and more BSA molecules were deposited on the surface, and a side-on monolayer was formed at the end. Afterward, increasing the concentration of BSA only increased the surface mass density, making these molecules more compact. These two processes could be represented as S1 and S2 in Figure 4B,C . S1 showed the formation of a side-on BSA monolayer, while S2 indicated an increase in the packing density. Other experiments (data not shown) showed that once the monolayer was formed, adding more BSA molecules would not change the surface mass density. For example, adding 7.6 μM BSA onto a 0.76 μM BSA-covered surface increased the mass density to the value of a side-on monolayer, but subsequently adding 30 μM BSA onto it did not change the mass density anymore.
(
Additionally, the binding affinity, KA, can be derived from the Langmuir adsorption isotherm equation given by

where c is the concentration and θeq is the equilibrium fractional surface coverage. This binding affinity is related to the association rate (ka) and dissociation rate (kd) as KA = ka/kd. In fluorescence-based measurements, blocking efficiency can be directly expressed as θeq since it is already normalized to unity. In OI-RD measurements, assuming that θeq = 1 for a fully covered side-on BSA monolayer, the surface mass density was normalized after dividing by 1.8 ng/mm2. Plotting θeq as a function of c and fitting the curve with eq 4 gave binding affinities of 1.12 × 10⁶ M−1 in fluorescent experiments and 1.42 × 10⁶ M−1 in OI-RD experiments. These two values are in good agreement.
Conclusion
To optimize the BSA blocking of epoxy-coated substrates, we studied the dependence of blocking efficiency on BSA concentrations and reaction time. From fluorescent experiments, we found that a BSA concentration of 10 μM (0.5 mg/mL or 0.05%) and reaction time of at most 10 min are enough for efficient (blocking efficiency > 98%) blocking of the surface. From label-free measurements using the OI-RD microscope, similar blocking conditions were concluded. Moreover, using the real-time data, we also calculated the surface mass density and number density as BSA deposited onto epoxy surfaces. It was found that a side-on monolayer was formed at a BSA concentration of 7.6 μM, and a monolayer of mixed side-on and end-on BSA molecules was formed when the concentration increased to 91 μM. These results provide an optimal BSA blocking protocol to microarray users.
Footnotes
Acknowledgements
The authors acknowledge financial support from NIH-R01-HG003827 (X. D. Zhu) and Taiwan MOST 101-2112-M-030-003-MY3 (Y. S. Sun).
Declaration of Conflicting Interests
The authors declared no potential conflicts of interest with respect to the research, authorship, and/or publication of this article.
Funding
The authors disclosed receipt of the following financial support for the research, authorship, and/or publication of this article: NIH-R01-HG003827 (X.D. Zhu) and Taiwan MOST 101-2112-M-030-003-MY3 (Y.S. Sun).