
Abstract
Hepatocellular carcinoma (HCC) is the fifth most common cancer worldwide. The expression of glucose transporter isoform 1, a key factor in transporting glucose into cancer cells, is overexpressed in several human cancers, including HCC. In addition, this has been shown to correlate with a higher proliferation index and more advanced stages in HCC, suggesting that inhibition of glucose metabolism is a promising therapeutic strategy. Our study used high-content screening (HCS) for compounds that target glucose metabolism and effect cell death in HCC cells. Specifically, we showed that a fluorescent 2-deoxyglucose analog, 2-[N-(7-nitrobenz-2- oxa-1,3-diazol-4-yl)amino]-2-deoxyglucose, and CellTrace Calcein Red-Orange AM can be used reliably as readouts for glucose uptake and proliferative index, respectively, to identify drug candidates that simultaneously reduce glucose uptake and induce cell death in HCC cells. Thus, fluorescent glucose uptake bioprobes can be implemented in HCS assays to identify previously unknown regulators of glucose metabolism in HCC. In addition, our study also employs the use of feedback system control (FSC.II), a platform that optimizes the combinations of drugs identified through HCS. The coordinated use of HCS and FSC.II can improve the development of drug combinations and uncover previously unidentified signaling pathways that govern HCC as well as other cancers.
Keywords
Introduction
Hepatocellular carcinoma (HCC) is one of the most common primary liver cancers, accounting for more than 600,000 deaths annually. 1 Hepatic resection and liver transplantation with adjuvant chemo- and radiotherapy are the mainstay of HCC treatment, but the 5-y survival rate remains poor because of frequent recurrence and intrahepatic metastasis. 2 Currently, the multikinase inhibitor sorafenib is the only Food and Drug Administration (FDA)–approved drug for the treatment of advanced HCC. Sorafenib acts by inhibiting serine-threonine kinases Raf-1 and B-Raf, receptor tyrosine kinase of vascular endothelial growth factor receptors 1, 2, and 3 and platelet–derived growth factor receptor β (PDGF-β).3,4 However, patients treated with sorafenib demonstrated modest overall survival benefit and have been shown to develop primary or acquired resistance, along with other adverse side effects.5,6 Therefore, there is a need to identify new therapeutic targets to improve the current HCC therapeutic modality.
The reprogramming of energy metabolism in cancer cells to favor glycolysis even in the presence of oxygen is a phenomenon known as the “Warburg effect.” 7 Given the fact that this glycolytic switch produces less adenosine triphosphate (ATP) relative to mitochondrial oxidative phosphorylation, cancer cells compensate for this lower efficiency of ATP production by up-regulating glucose transporters, mainly the glucose transporter isoform 1 (GLUT1). 8 Indeed, GLUT1, a key rate-limiting factor in transporting glucose into cells, is frequently overexpressed in several human cancers, including HCC, lung, colorectal, gastric, and ovarian cancers.9,10 More importantly, enhanced GLUT1 expression has been associated with increased malignant potential, invasiveness, and poor prognosis in these cancers.11–14 Furthermore, the use of a potent inhibitor of glycolysis, 3-bromopyruvate, demonstrated promising antitumor effects in several animal models of liver cancer. 15 These studies highlight the importance of glucose metabolism in cancer and could possibly serve as a potential therapeutic target.
Acquired drug resistance, however, limits the potential efficacy of single-drug targets identified. This phenomenon is observed across many cancers, including HCC, because of the heterogeneous nature of tumors. One of the ways to overcome drug resistance is through the administration of combinatorial drug treatment, which aims to target multiple oncogenic pathways so as to reduce the incidence of resistance. To achieve this, we employed the use of feedback system control.II (FSC.II), a top-down approach that directs a biological system toward a desired phenotype. FSC, a platform commonly used in engineering processes for optimization, is a closed system in which the inputs introduced into a system are optimized via an algorithm-assist process that harnesses experimental data to produce optimized outputs. This serves as a useful tool to screen for optimal drug combinations in contrast to the traditional high-throughput screening, a bottom-up approach that requires detailed information about the pathways and is not able to provide the optimal dosage for each drug used in the combination. FSC aims to drive the biological system to the desired state without measurement of the detailed mechanistic/molecular activities inside the cell, as commonly seen in the bottom-up approach. FSC.II was derived from its predecessor, the first generation of FSC (FSC.I). Based on these FSC.I studies, Al-Syoukh et al. showed that drug efficacy can be represented by smooth quadratic surfaces.16–19 FSC.II is a revised platform that is able to obtain these smooth surfaces without iterative feedback searches, as carried out in FSC.I. 18 For the purpose of our study, we used the orthogonal algorithm of the FSC.II to determine the potent combination of drugs. 20 Several studies have demonstrated the efficacy of combinatorial drugs over single-drug administration in HCC; however, most of them are not optimized combinations. 21 Hence, the use of FSC.II aims to overcome this hurdle by predicting optimized drug combinations in vitro and in vivo.
The studies described here aimed to use high-content screening (HCS) to first identify drugs that potentially target glucose metabolism and mediate cell death in HCC cells. Specifically, we used a fluorescent 2-deoxyglucose analog, 2-[N-(7-nitrobenz-2-oxa-1,3-diazol-4-yl)amino]-2-deoxyglucose (2-NBDG), in parallel with CellTrace Calcein Red-Orange AM as a functional readout for glucose uptake and proliferative index, respectively. Importantly, our study also aimed to increase the sensitivity of the drug screening by using two parameters as outputs as compared with most drug screening studies that employ only one output to determine the performance of the drugs. Based on the high-throughput screening of these two parameters, we were able to identify potential drug candidates that can simultaneously inhibit glucose uptake and induce cell death in HCC cells. Following the identification of potential drug candidates, FSC.II was used to determine optimal drug combinations that will effectively target HCC based on the top target inhibitors highlighted from the results of the HCS. This will eventually aid in the development of new therapeutic drugs to improve treatment of HCC patients as well as provide the framework for a more efficient approach to identifying and optimizing new drug combinations against cancer as well as other diseases.
Materials and Methods
Cell Culture
Human hepatocellular carcinoma cell lines, Hep3B, HepG2, SNU398, and Bel-7402, were obtained from American Type Culture Collection (Manassas, VA), whereas Huh-7 was obtained from the Japanese Collection of Research Bioresources (Tokyo, Japan). Huh7, Hep3B, and HepG2 cells were cultured in Dulbecco’s modified Eagle’s (BioWest, Kansas City, MO) medium, whereas SNU398 and Bel-7402 22 were cultured in standard RPMI-1640 (BioWest) medium, with both media supplemented with 5% fetal bovine serum (FBS) and 1% penicillin/streptomycin. THLE-2 epithelial cell line (Lonza, Basel, Switzerland) were cultured in bronchial epithelial cell growth medium medium (Lonza), supplemented with 5% FBS and other additional nutrients as supplemented. All cell lines were cultured in a humidified atmosphere of 5% CO2 at 37 °C.
Quantitative Real-Time PCR
Total RNA was extracted from cell pellet using TRI Reagent (Sigma-Aldrich, St. Louis, MO), and reverse transcription was carried out in 20 µL reactions on 1000 ng total RNA from each sample using iScript Reverse Transcription Supermix (Bio-Rad Laboratories, Hercules, CA) according to the manufacturers’ instructions. For quantitative real-time PCR, triplicate aliquots of cDNA for each sample (2 µL) were then subjected to 40 amplification cycles of PCR (Applied Biosystems Prism 7500 sequence detection system; Carlsbad, CA) using iTaq Universal SYBR Green Supermix (Bio-Rad Laboratories). Primers used were as follow: GLUT1 (forward primer, 5′-AACTCTTCAGCCA-GGGTCCAC-3′; reverse primer, 5′-CACAGTGAAGATG-ATGAAGAC-3′), HK2 (forward primer, 5′-CAAAGTGAC-AGTGGGTGTGG-3′; reverse primer, 5′-GCCAGGTCCT-TCACTGTCTC-3′), and GAPDH (forward primer, 5′-AGCCACATCGCTCAGACAC-3′; reverse primer, 5′-GCCCAATACGACCAAATCC-3′). The level of gene expression was determined using GAPDH as the normalizer gene and expressed as mean ± SD of the triplicate PCR reactions.
Western Blot
Cells were pelleted and lysed in buffer containing 0.5% sodium deoxycholate, 1% NP-40 detergent, 0.1% sodium dodecyl sulfate (SDS), 0.15 mol/L NaCl, and 10 mmol/L Tris-HCl (pH 7.4), with protease and phosphatase inhibitors cocktail tablets (Roche, Basel, Switzerland). Equal amounts of protein were separated by SDS polyacrylamide gel electrophoresis, transferred to polyvinylidene difluoride membranes, and probed with primary antibodies. Membranes were processed according to standard procedures and proteins detected using the imaging system ImageQuant LAS 500 (GE Healthcare Life Sciences, Pittsburgh, PA). The following antibodies were used: anti-GLUT1 (1:1000; Thermo Scientific Lab Vision, Waltham, MA), Hexokinase II (1:1000; Cell Signaling, Danvers, MA) and anti-β-actin (1:10,000; Sigma).
Kinase Inhibitor Library Drug Treatment
Hep3B and THLE-2 cells were dissociated with trypsin and seeded into 96-well plates at a density of 5000 cells per well. Cells were allowed to adhere and recover for 24 h prior to drug treatment. Thereafter, cells were subjected to 1 µM and 5 µM of each drug from the kinase inhibitor library (Enzo Life Sciences, Farmingdale, NY). The drug treatment was executed by the liquid-handling system Mini Janus (PerkinElmer, Waltham, MA). The drugs were diluted in media to a concentration of 20 µM before dispensing the drugs into master plates containing the respective media to a final concentration of 1 µM by the Mini Janus system ( Fig. 1B ). Thereafter, the library of drugs at 1 µM was added to the plates containing the respective cells and incubated for 24 h.
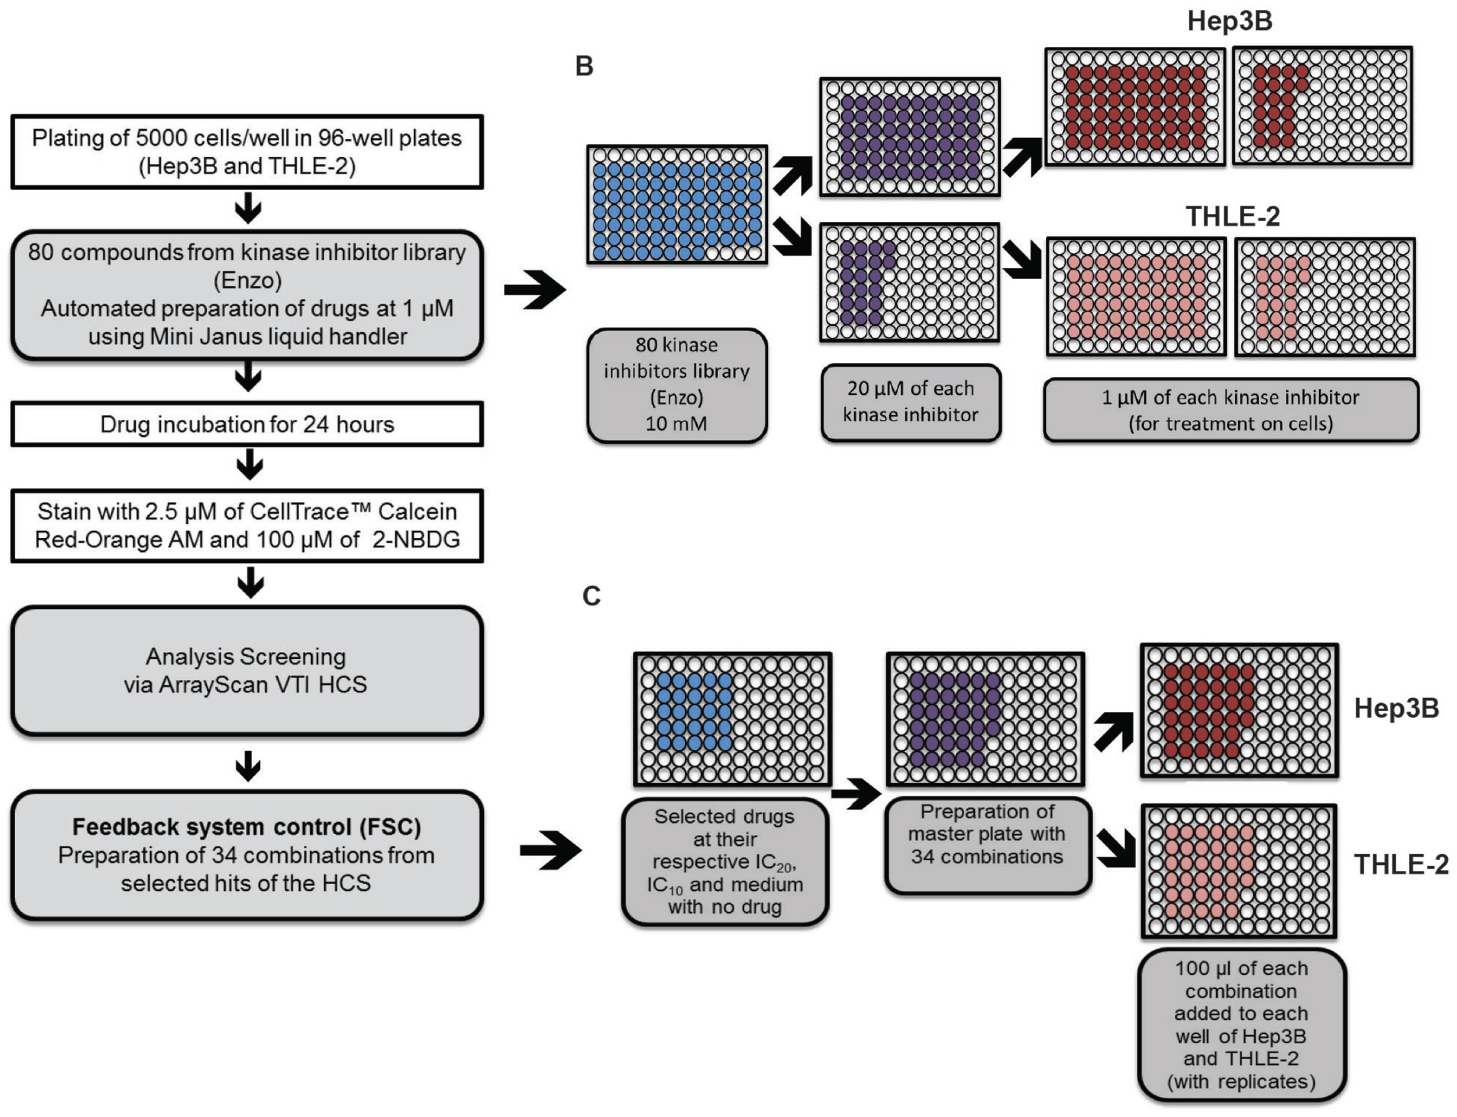
Workflow of automated liquid handler set up for preparation of master plates. (
Glucose Uptake and Proliferation Status
To determine the glucose uptake and proliferation status of the cells after kinase inhibitor treatment, fluorescent 2-NBDG (Life Technologies, Carlsbad, CAS) and CellTrace Calcein Red-Orange AM (Life Technologies) assays were performed, respectively. 2-NBDG is a 2-deoxyglucose analog that has been shown to be transported intracellularly by the same GLUT transporters as glucose. 23 Phosphorylation at the C-6 position causes the molecule to be retained within the cell.24,25 Thus, this fluorescent probe can be used to reflect the levels of glucose utilization in the cells. CellTrace Calcein Red-Orange AM contains an acetoxymethyl ester (AM) group that masks charge, rendering it nonpolar and permeant to live cells. Once converted into fluorescent products by esterase intracellularly, these compounds are retained within cells because of their negative charges. Hence, CellTrace Calcein Red-Orange AM fluorescent probe is suitable for detecting viable, proliferating cells.
Cells were washed once with 1× phosphate-buffered saline (PBS) before incubation of 2.5 µM of CellTrace Calcein Red-Orange AM in serum-free media for 30 min in a 37 °C incubator. The cells were washed with 1× PBS and subsequently incubated with 100 µM of 2-NBDG in glucose-free media (Sigma), supplemented with 2 mM L-glutamine only for 30 min in a 37 °C incubator. Thereafter, the media were replaced with Hank’s Balanced Salt Solution supplemented with 10% FBS and 1% penicillin/streptomycin, and incubation continued for another 5 min to allow efflux of residual nonphosphorylated 2-NBDG from the cells. The cells were then fixed with 4% paraformaldehyde for 10 min before 1 µM of Hoechst 33342 in phenol red-free RPMI media (Sigma) was added. Hoechst 33342 will be used to mark out the individual cells during image scanning and analysis.
Scanning and Analysis
Images used for quantitation of 2-NBDG and CellTrace Calcein Red-Orange AM uptakes were captured by the ArrayScan VTI HCS reader (Thermo Fisher Scientific Inc.). X93 filter sets were used. An X93-Hoechst filter was used to detect Hoechst 33342, an X93-FITC filter was used to detect 2-NBDG, and an X93-Cy5 filter was used to detect CellTrace Calcein Red-Orange AM. HCS data were analyzed using the algorithm “target activation,” where channel 1, which detects Hoechst, was used as the primary identifier (primary object) for total cells stained and for segmentation purposes. Channels 2 and 3 will measure the fluorescence of 2-NBDG and CellTrace Calcein Red-Orange AM, respectively, within the marked-out cells as indicated in channel 1. Single-cell quantitation of 2-NBDG and CellTrace Calcein Red-Orange AM uptake was assessed as the intracellular accumulation of fluorescence, which was analyzed using the vHCS view program after capturing the images. Automated image analyses were performed to obtain the valid object count (indicated by the nuclei) and the total intensities of secondary objects (i.e., 2-NBDG and CellTrace Calcein Red-Orange AM). The mean intensities of the secondary objects were determined as total intensity of channel 2/valid object count and total intensity of channel 3/valid object count, which indicate the arbitrary glucose uptake and proliferation status of the cells, respectively.
Determination of Half-Maximal Inhibitory Concentrations (IC50)
Hep3B cells were dissociated with trypsin and seeded into 96-well plates at a density of 5000 cells per well. The selected drugs, ZM449829, SU 1498, PP2, AG-1296, and HA-1004·2HCl (ranging from 0.00001 to 100 µM) were added per treatment (n = 6) for 24 h. The media were removed thereafter before quantification of cell viability using 3-(4,5-dimethythiasol-2-yl)-5-(3-carboxymethoxyphenyl)-2-(4-sulfophenyl)-2H-tetrazolium (MTS) colorimetric assay (Promega, Madison, WI) at an absorbance 490 nm according to manufacturer’s instructions. Background absorbance (staining in the absence of the cells) was subtracted from each sample before calculating the absorbance ratios. Sigmoidal dose-response curves were generated by fitting calculated cell viability values at different log concentrations using Graphpad Prism 6 software (Graphpad, La Jolla, CA).
FSC.II Combinatorial Drug Treatment
Hep3B and THLE-2 cells were dissociated with trypsin and seeded into 96-well plates at a density of 5000 cells per well. Cells were allowed to adhere and recover for 24 h prior to combinatorial drug treatment consisting of ZM 449829 (SelleckChem. Houston, TX), SU1498 (Millipore, Billerica, MA), PP2 (Abcam, Cambridge, UK), AG-1296 (Santa Cruz Biotechnology, Santa Cruz, CA), and HA-1004·2HCl (Santa Cruz Biotechnology). The three-level (which represents concentrations at IC20, IC10, and no drug), five-drugs treatment consisting of 34 combinations ( Table 1 ) is a composite design adapted from Xu et al. 26 This design is based on a two-level factorial design and a three-level orthogonal array, consisting of the least number of combinations required for factor screening and in-depth analyses. The Mini Janus executed and prepared the master plates containing the drug combinations. Cells were then treated with the drug combinations for a period of 72 h.
Combination Design for Five Drugs with Three Levels of Concentrations. a
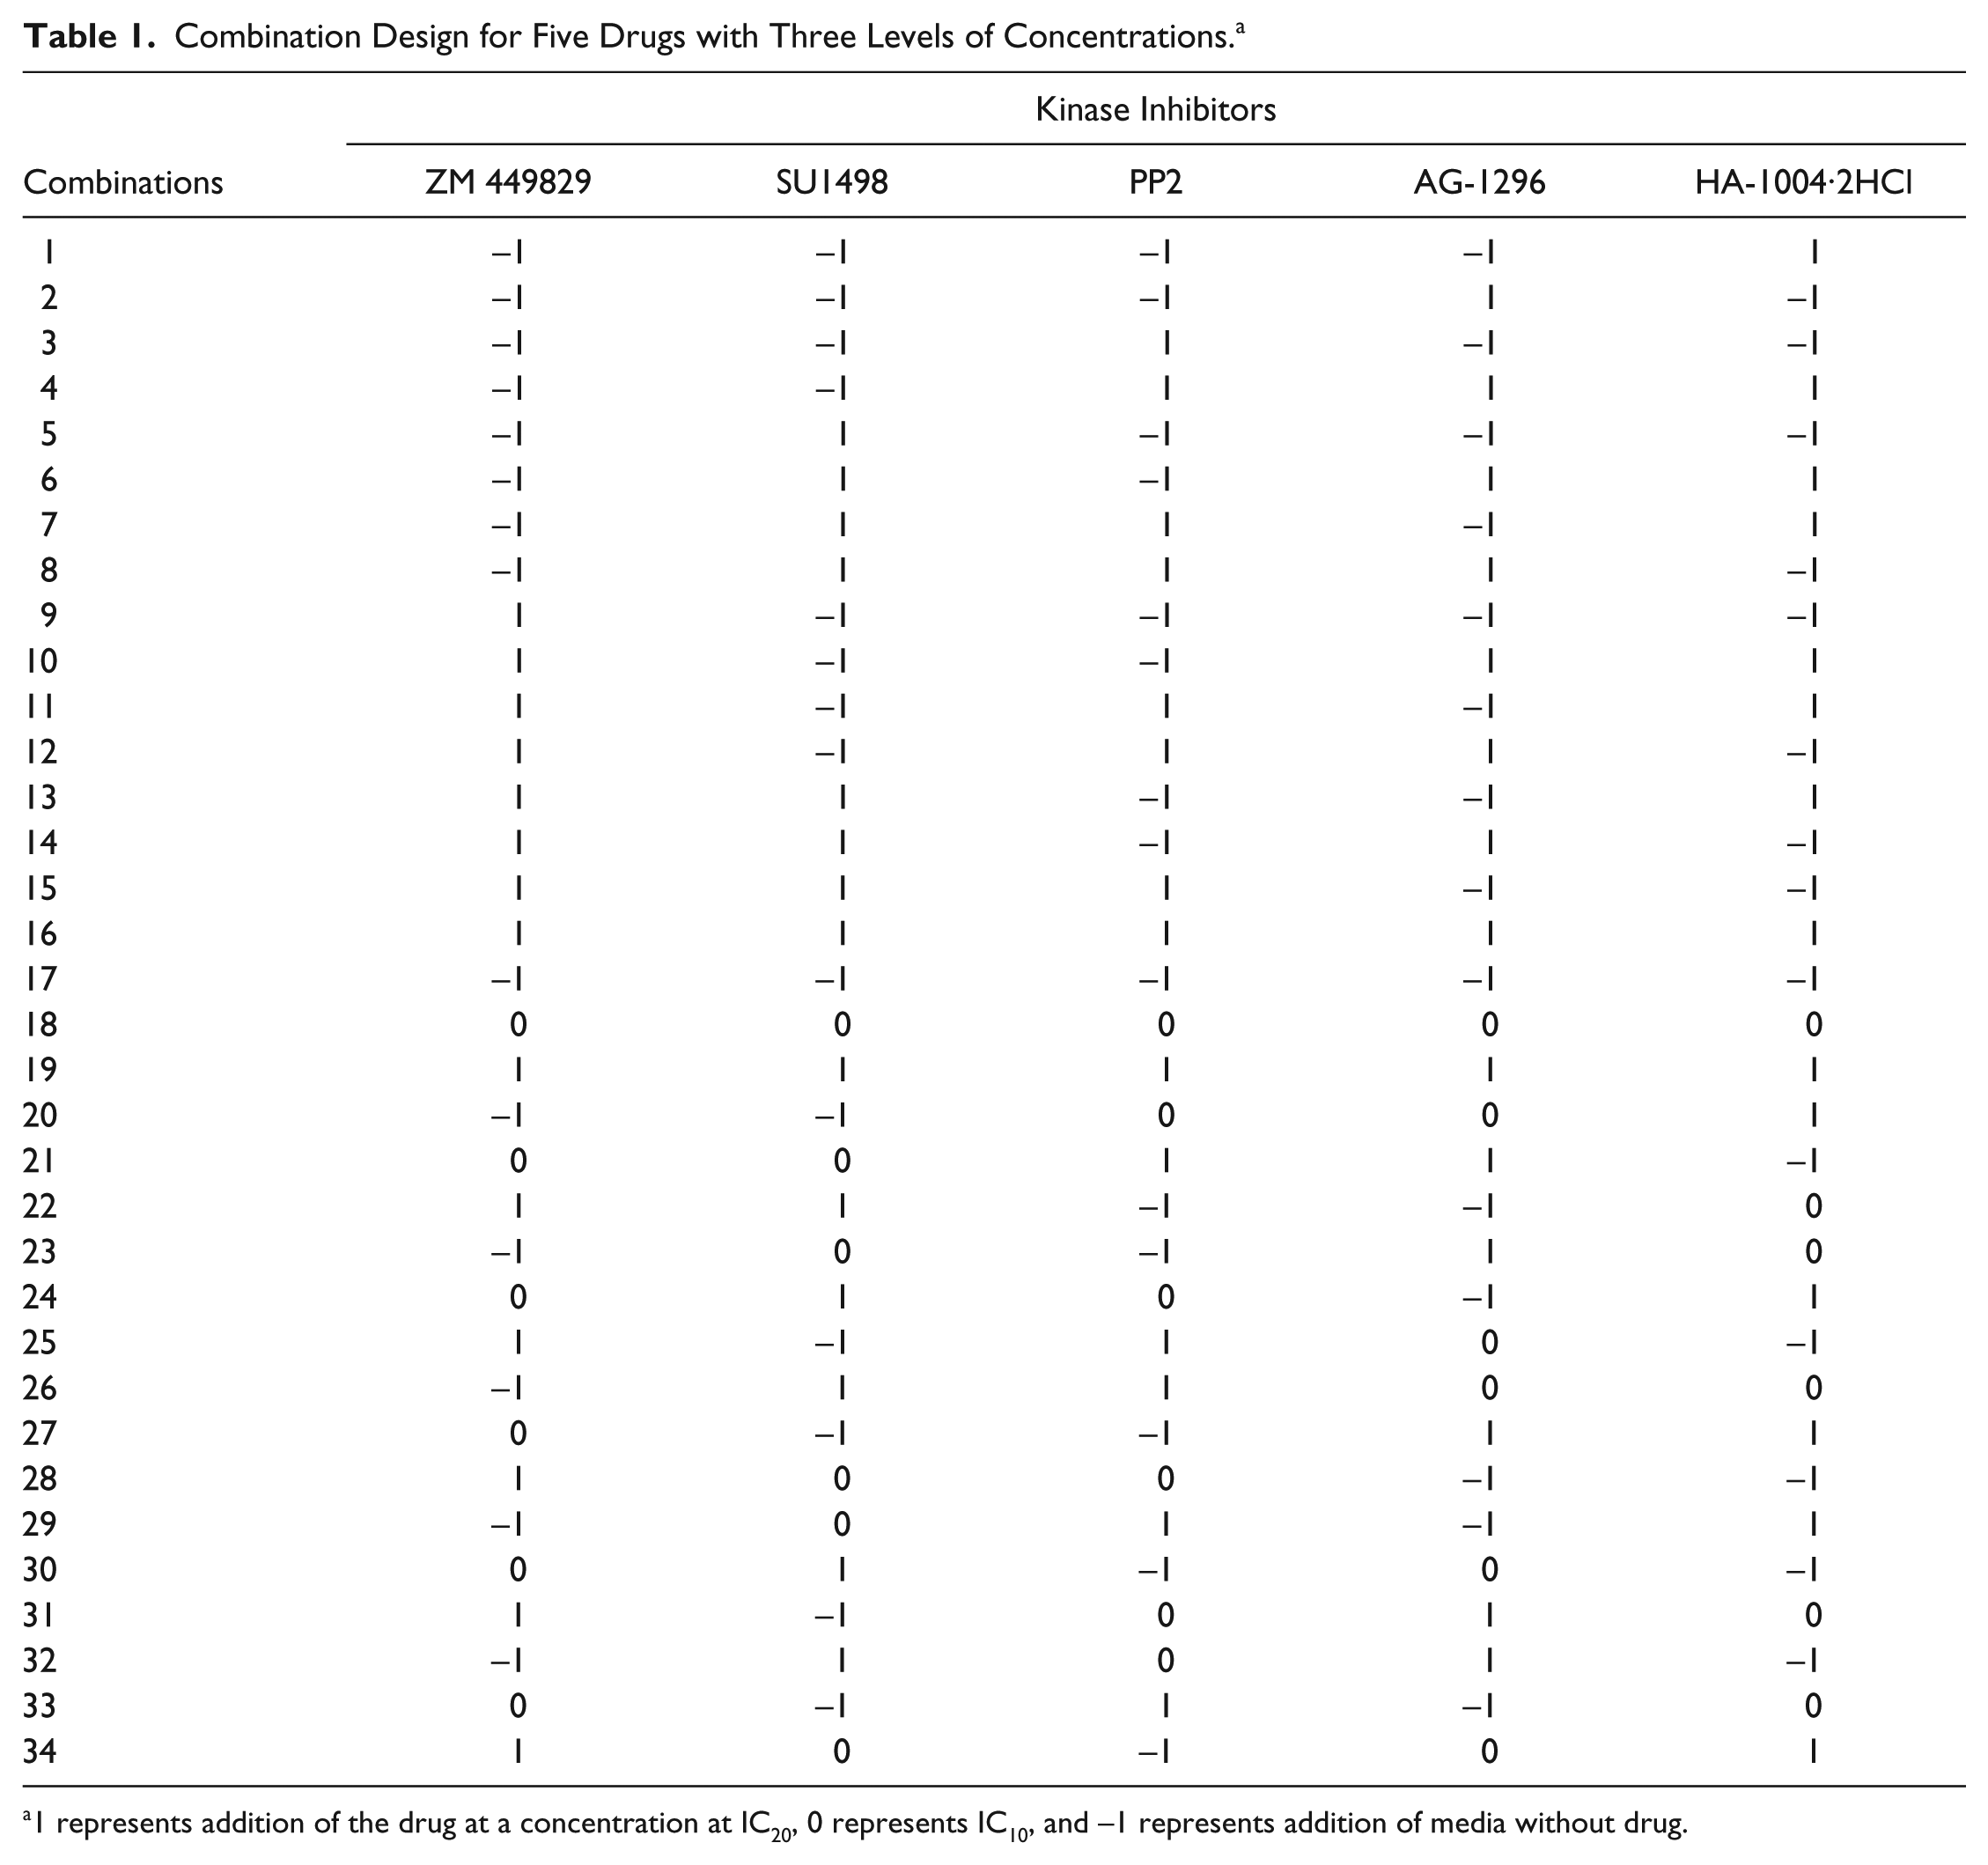
1 represents addition of the drug at a concentration at IC20, 0 represents IC10, and −1 represents addition of media without drug.
Cell Viability Assay
The cell viability was measured using the MTS colorimetric assay (Promega) at an absorbance of 490 nm according to the manufacturer’s instructions. The proliferation status of the cells is used as the readout for subsequent analysis.
Analysis of FSC.II Readouts
The second-order linear model was coded with MATLAB software (Mathworks Inc., Natick, MA). Each drug combination was represented as a vector in the software. Coded dosage was used rather than absolute concentration. The dosages of 34 combinations in the first iteration were chosen arbitrarily, as exemplified by Xu et al. 26 The code computed the objective function value of each combination and suggested the new group of drug combinations to be tested.
Results
Differential Glucose Metabolism across Hepatocellular Carcinoma Cell Lines
To demonstrate the activity of glucose metabolism in HCC, the mRNA expression of glucose transporter 1 (GLUT1) and Hexokinase II (HK2) was determined across different human HCC cell lines (Huh7, Hep3B, HepG2, Bel-7402, SNU-398) and an immortalized, nontumorigenic normal human liver cell line (THLE-2). GLUT1 mRNA expression levels have been shown to be up-regulated in HCC tissues and cell lines as compared with matched nontumor tissues.9,27,28 In addition, Hexokinase II, a key enzyme in the glycolytic pathway, has been shown to be highly expressed in HCC patients and is prognosticated with poorer survival. 29 As depicted in Figure 2a , there is differential mRNA expression of GLUT1 and HK2 exhibited across the different HCC cell lines, with generally higher GLUT1 and HK2 expression in the HCC cell lines as compared with the nontumorigenic THLE-2 cells. Of note, Hep3B exhibited the highest GLUT1 expression and SNU398 exhibited the lowest expression, and this trend was mirrored in the mRNA expression for HK2 as well. To further confirm this observation, the protein expressions of Glut1 and Hexokinase II were determined via Western blotting. Consistent with our previous mRNA analyses, a similar trend was also observed at the protein levels for Glut1 and Hexokinase II ( Fig. 2b , c ) with the exception of HepG2, for which Glut1 protein expression was much higher than its matched mRNA expression.
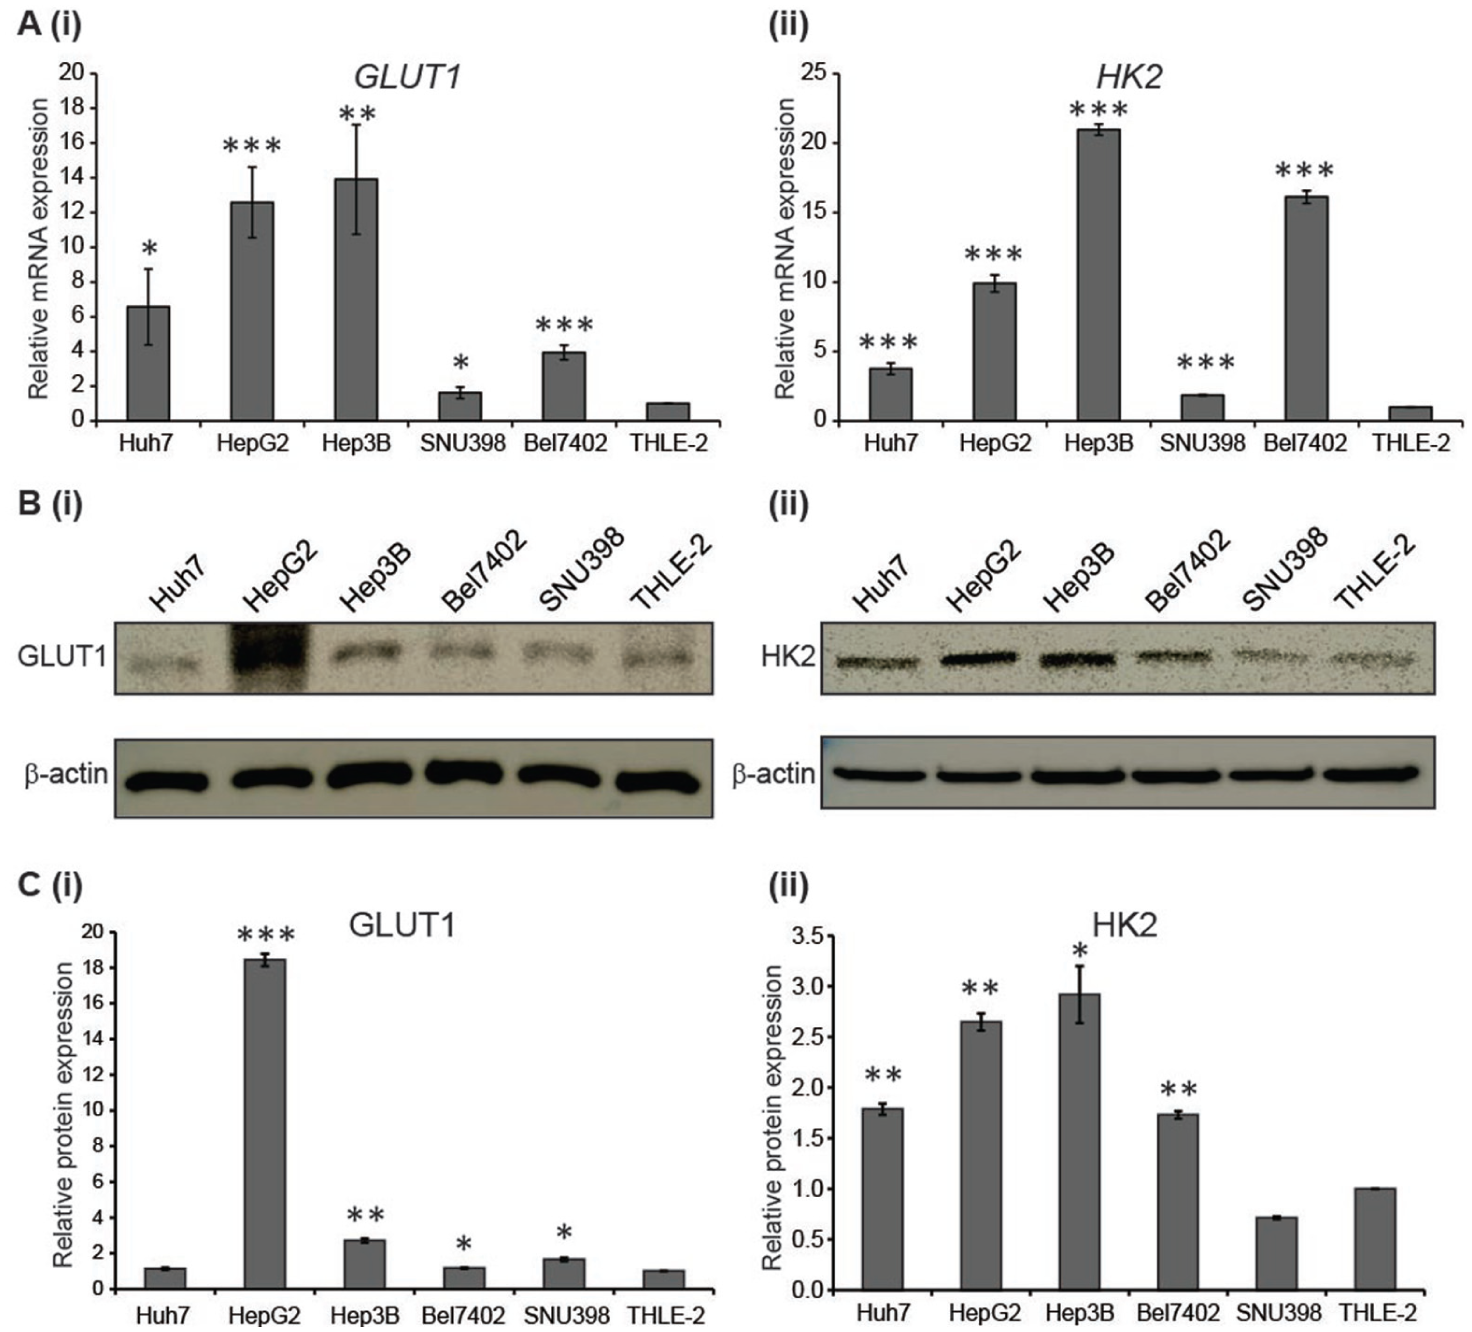
Differential glucose metabolism across human hepatocellular carcinoma cell lines. (
Fluorescent 2-NBDG was used to determine whether these differences in mRNA and protein expressions translate to differential uptake of glucose in the cells. Considering the consistent expression of Hexokinase II and Glut1 at both the mRNA and protein levels ( Fig. 2 ), Hep3B and Bel-7402 were selected for the downstream experiments, as these cells demonstrated high and low levels of glucose metabolism, respectively, with the THLE-2 cell line serving as the normal control. Incubation of 100 µM of 2-NBDG in glucose-free media was carried out for 30 min in these selected cell lines. This cellular uptake of 2-NBDG reflects the rate of cellular glycolysis, with hepatic malignant cells accumulating more of the probe than benign cells. 30 These cells were subsequently viewed under fluorescence microscopy. We observed that Hep3B displayed the highest 2-NBDG uptake followed by Bel-7402 and THLE-2 ( Fig. 3 ), which coincidently mirrored the differential mRNA and protein expression shown earlier ( Fig. 2 ). Collectively, these results showed that there is higher glucose uptake in HCC cell lines as compared with normal liver cells, with differential glucose uptake across the HCC cell lines, suggesting differences in glucose metabolic activity across different HCC cell lines.
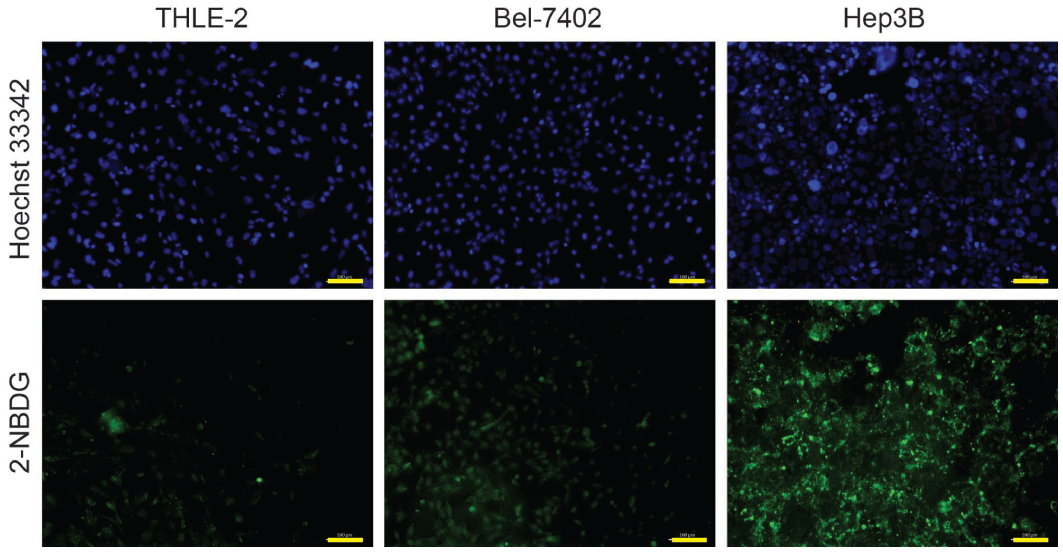
Glucose uptake activity in hepatocellular carcinoma cells. 2-NBDG uptake evaluated across THLE-2 (control), Bel-7402, and Hep3B cell lines. The top panel represents the fluorescence of Hoechst 33342, and the bottom panel represents the fluorescence uptake of 2-NBDG for the respective cells lines. Scale bar represents 100 µm.
Perturbation of Glucose Uptake and Proliferation Levels upon Kinase Inhibition
To investigate pathways that affect glucose uptake and/or proliferation, a kinase inhibitor library (Enzo) consisting of 80 small-molecule inhibitors was used to treat Hep3B and THLE-2 for 24 h at an initial screening concentration of 1 µM. For the purpose of this screen, Hep3B was selected based on its high glucose uptake activity relative to the other HCC cell lines, with THLE-2 as a nontumorigenic hepatic cell control. After drug treatment, these cells were washed and subjected to stainings with fluorescent probes, 2-NBDG and CellTrace Calcein Red-Orange AM, which reflect the glucose uptake and proliferation status of the cells, respectively. Subsequently, the ArrayScan VTI HSC reader was used to capture and analyze the fluorescence intensities based on the “target activation” algorithm, as summarized in Figure 1A .
The outputs (i.e., 2-NBDG and CellTrace Calcein Red-Orange AM) were derived by taking the average fluorescent intensities of the respective parameters (
Tables 2
Summary of the Analysis from the ArrayScan VTI High-Content Screen on Hep3B. a
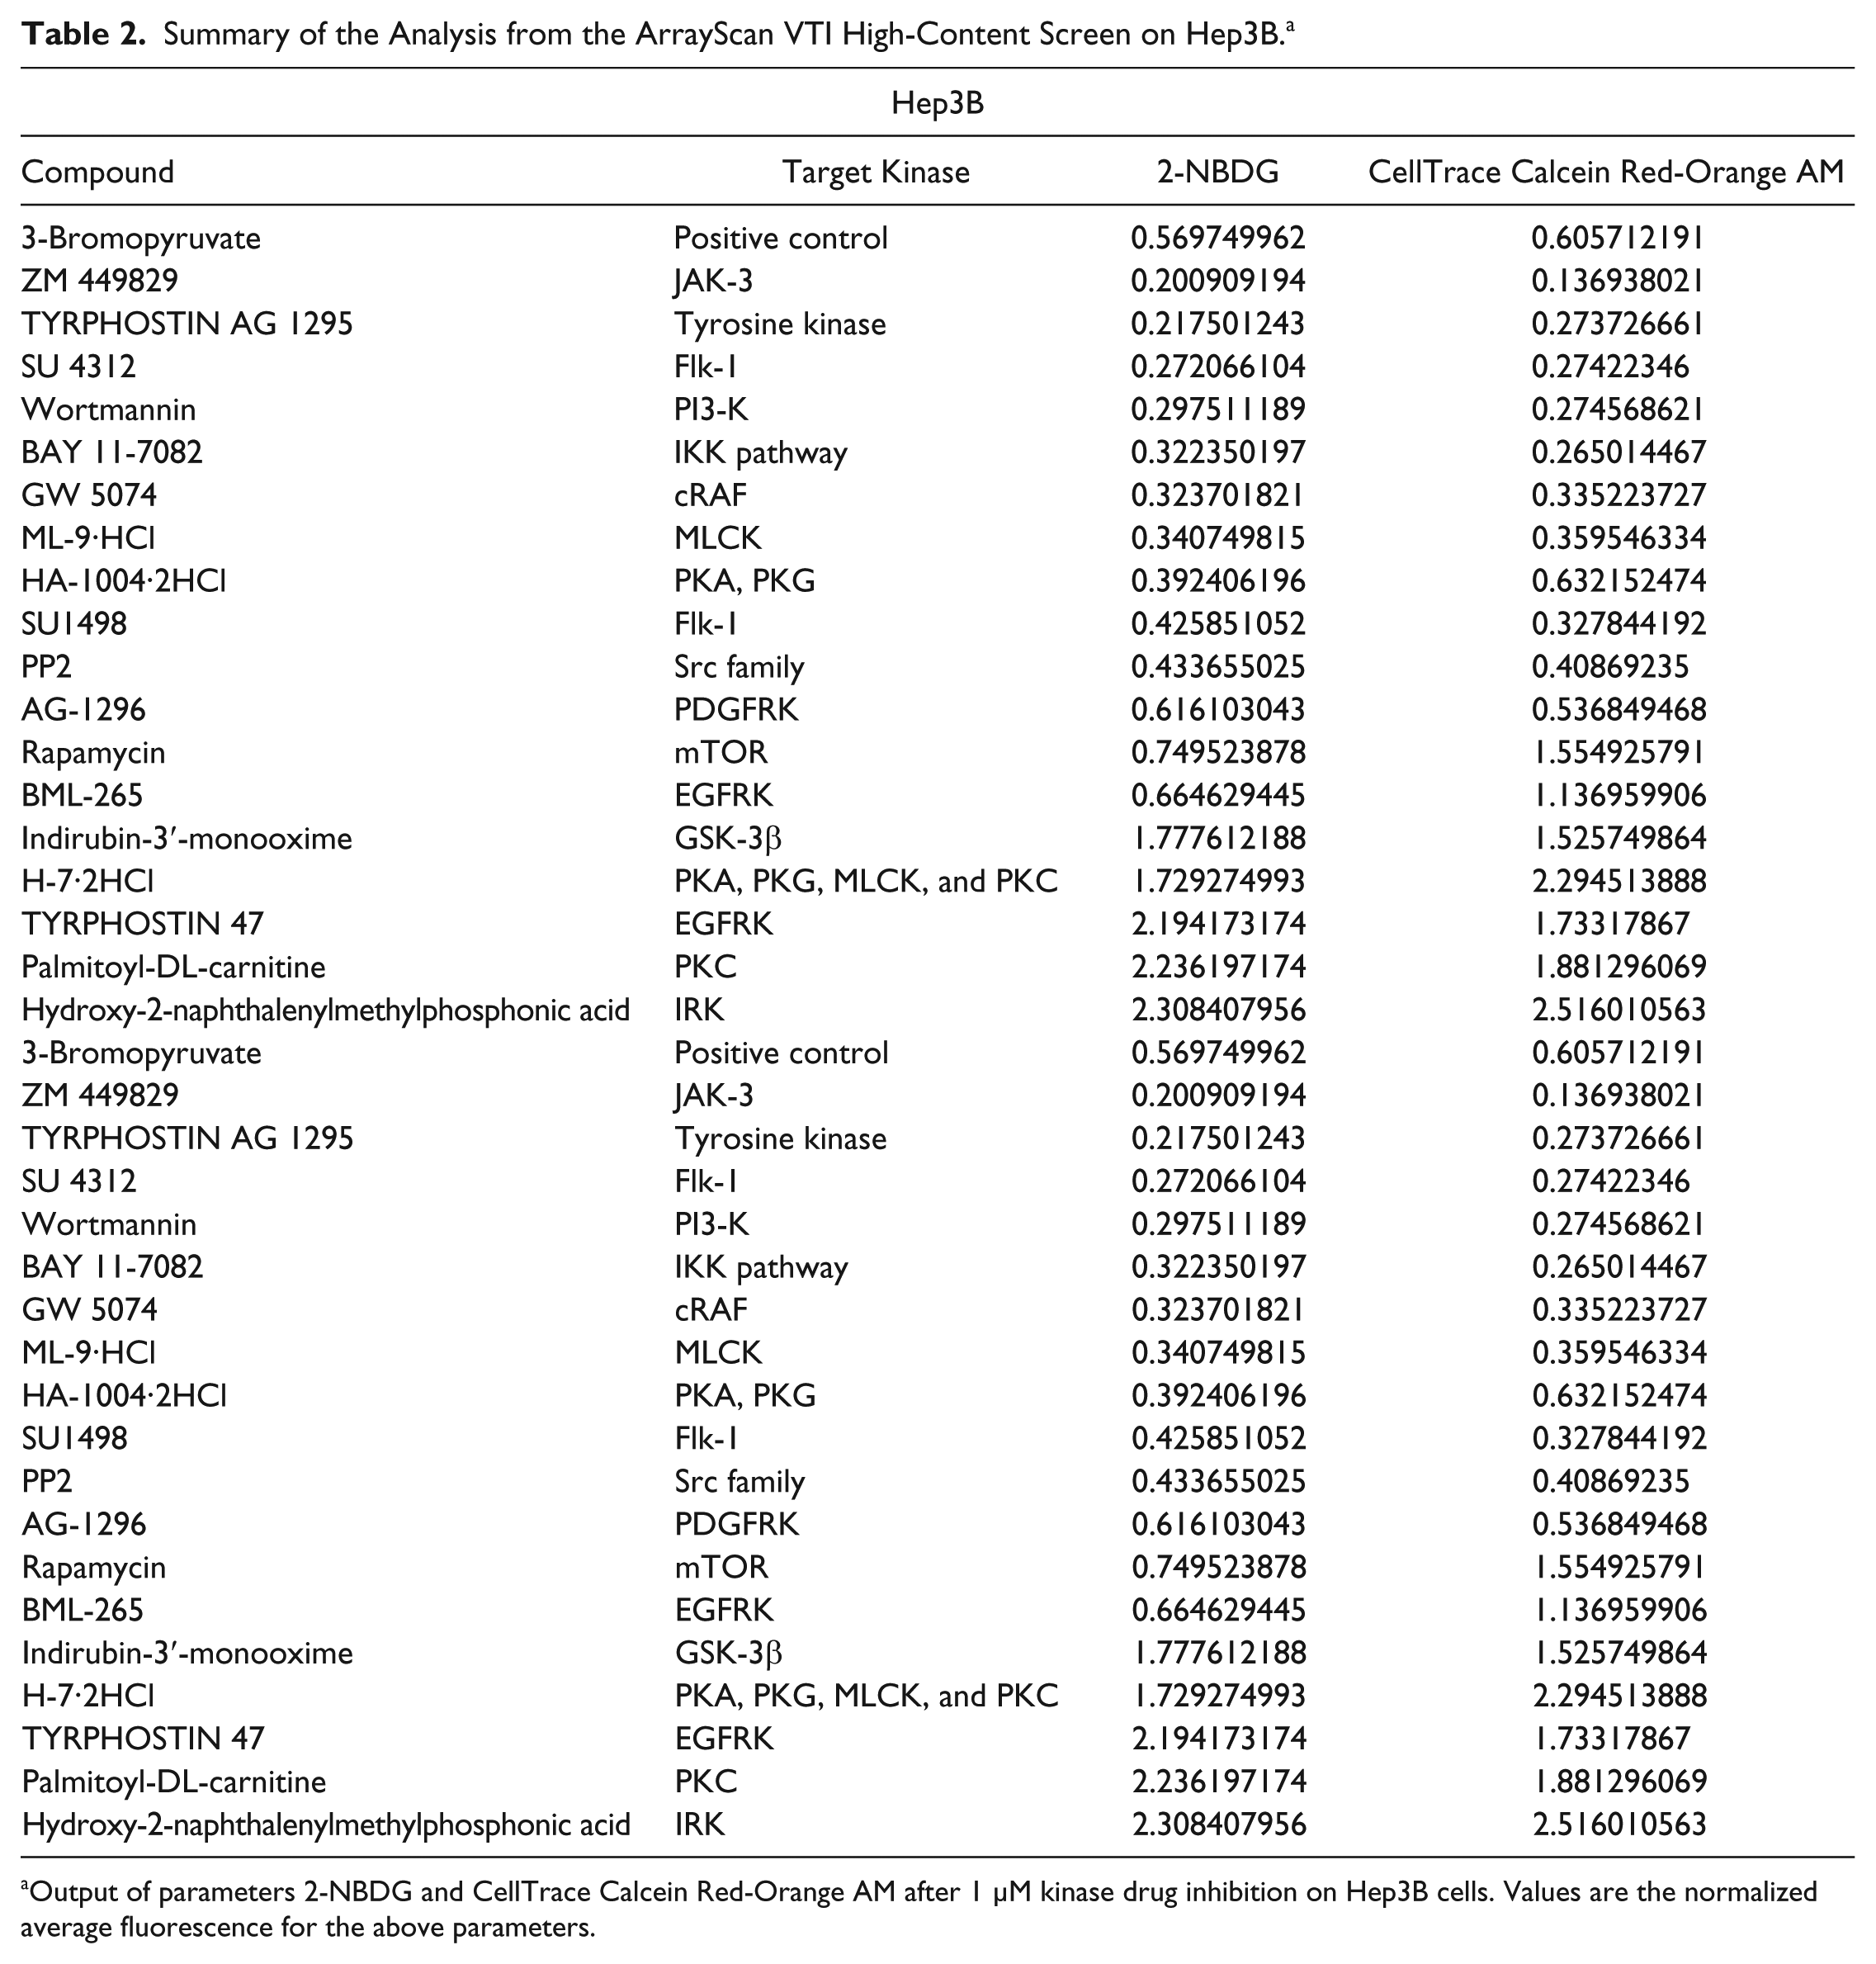
Output of parameters 2-NBDG and CellTrace Calcein Red-Orange AM after 1 µM kinase drug inhibition on Hep3B cells. Values are the normalized average fluorescence for the above parameters.
Summary of the Analysis from the ArrayScan VTI High-Content Screen on THLE-2. a
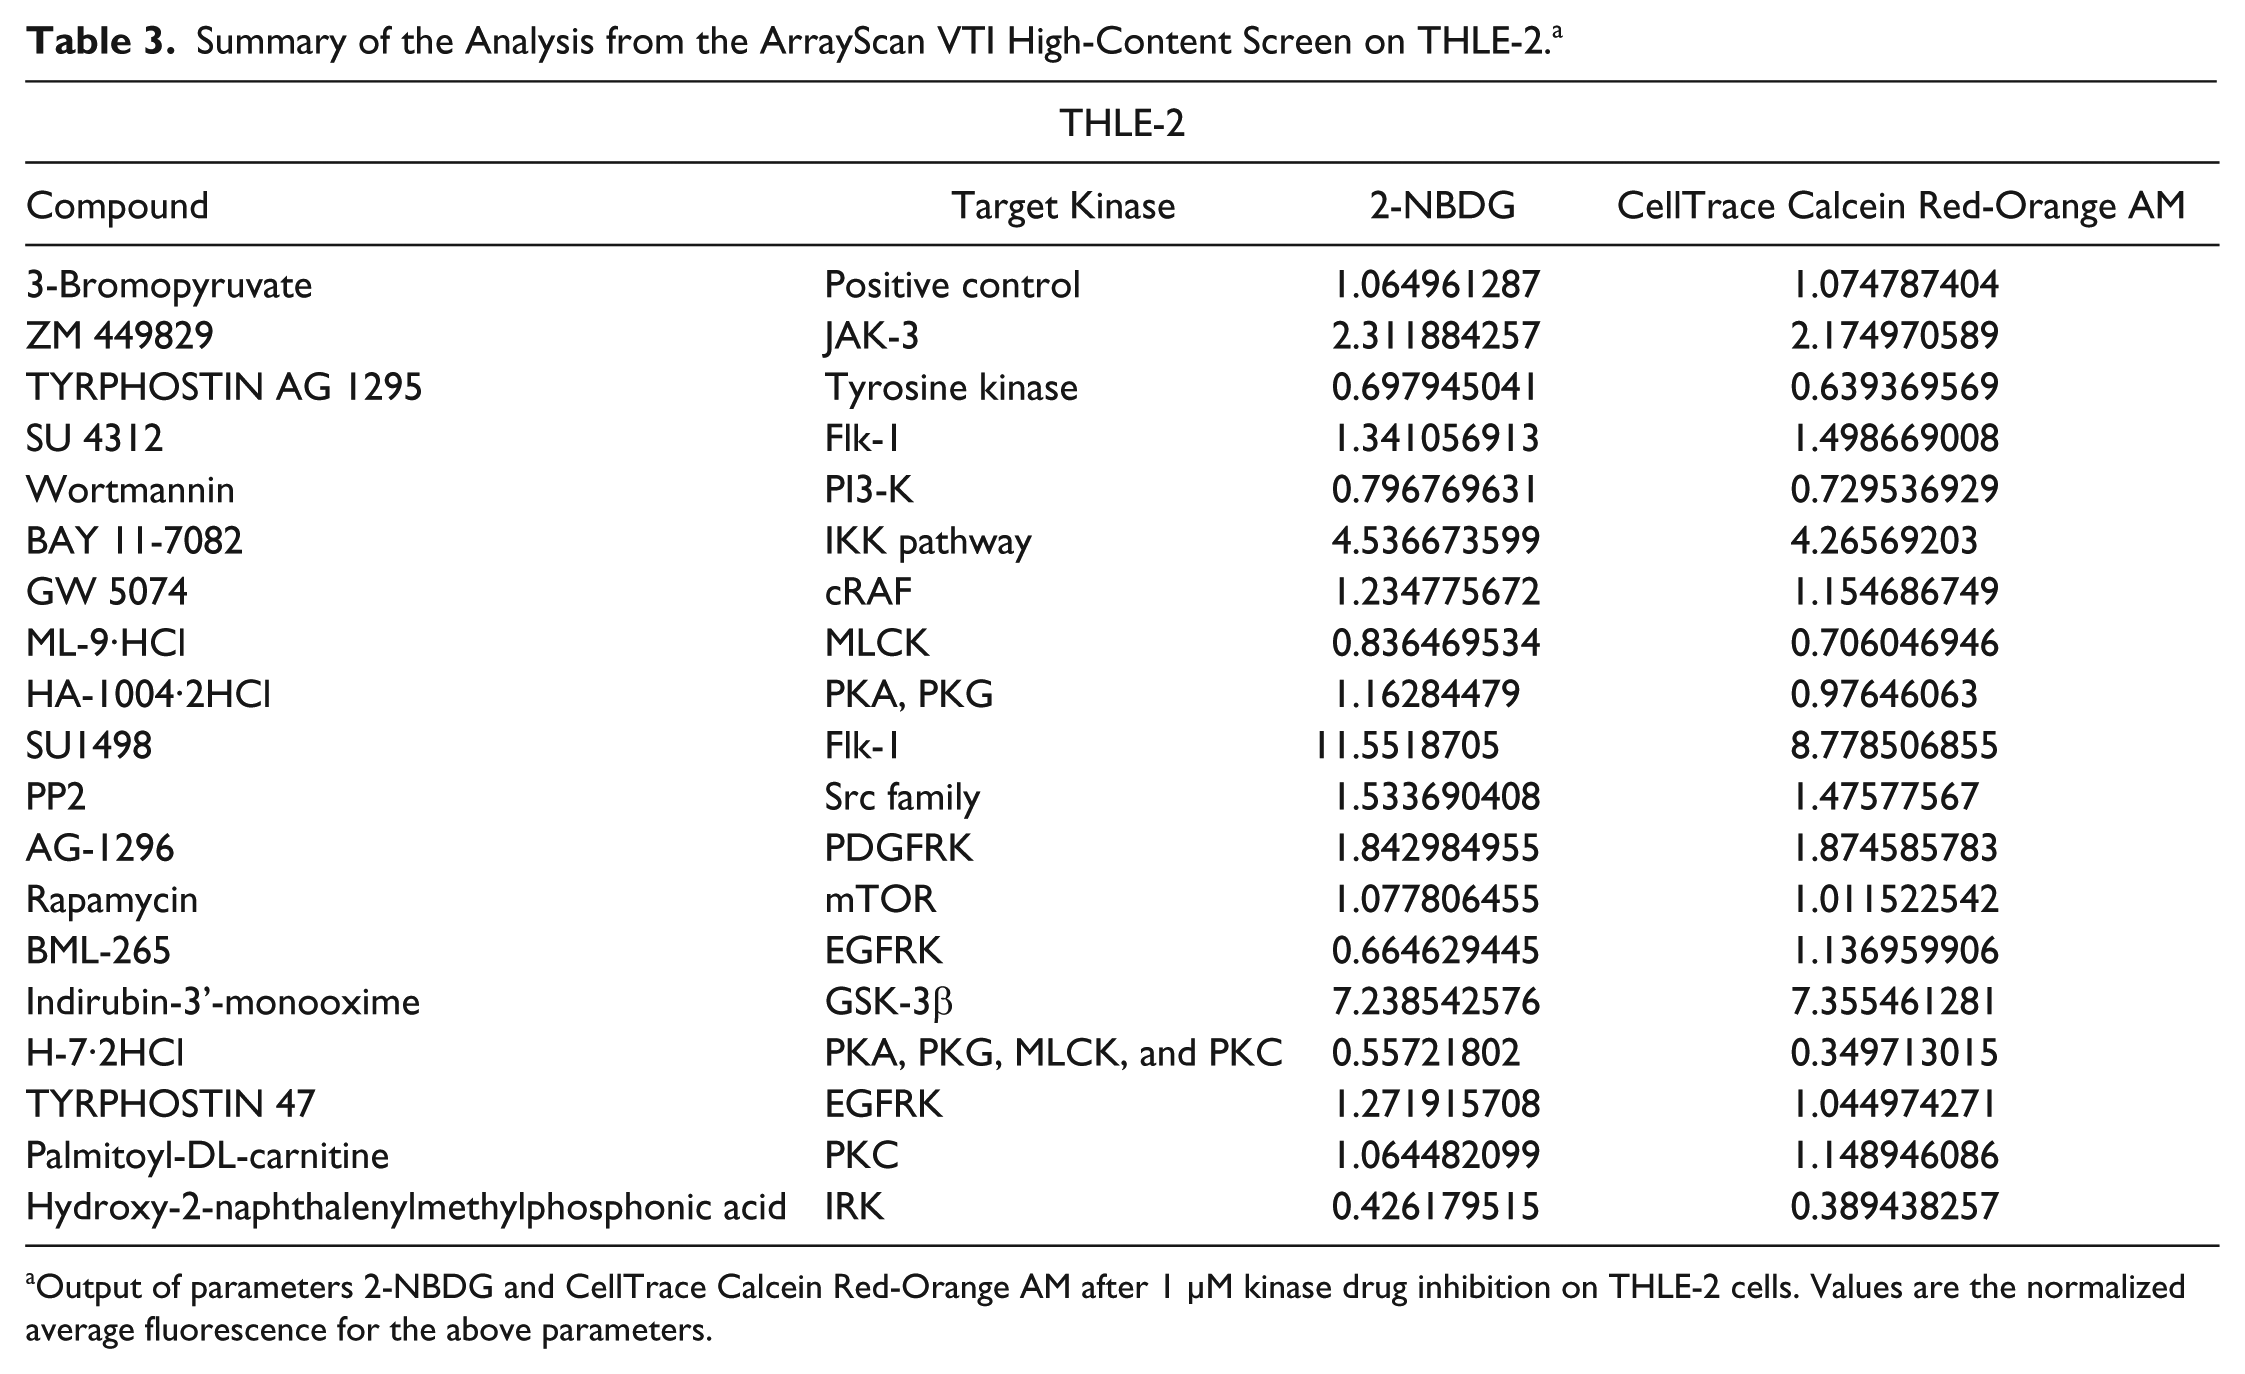
Output of parameters 2-NBDG and CellTrace Calcein Red-Orange AM after 1 µM kinase drug inhibition on THLE-2 cells. Values are the normalized average fluorescence for the above parameters.
The selectivity of these drugs was exhibited in some drugs that inhibit glucose uptake but do not affect the proliferation of Hep3B cells. This highlights the caveats of other methods that rely on only glucose uptake to screen for potential inhibitors, as they do not successfully arrest the cells. It also rules out the possibility that the decrease in glucose uptake of the drugs highlighted earlier was due to decreased proliferation. Rapamycin, an mTOR inhibitor, as well BML-265, an epidermal growth factor receptor kinase inhibitor, exhibited these outputs. The normalized fluorescent values of 2-NBDG and CellTrace Calcein Red-Orange AM on Hep3B cells were 0.745 and 1.55, respectively, for rapamycin ( Table 2 ), whereas that for BML-265 were 0.665 and 1.14, respectively ( Table 2 ).
We have also further evaluated the platform of ArrayScan by using 3-bromopyruvate, a potent glycolytic inhibitor, as a positive control. 15 Specifically, the normalized fluorescent values of 2-NBDG and CellTrace Calcein Red-Orange AM uptake were 0.606 and 0.570 for Hep3B, respectively ( Table 2 ), whereas for THLE-2, the values were 1.07 and 1.06 ( Table 3 ). This further validates the robustness of this system, where it is able to effectively highlight drugs that inhibit the malignant hepatic cells, Hep3B, but not the nontumorigenic liver cells, THLE-2.
In addition, there were some drugs that had no effect on Hep3B cells. Indirubin-3′-monooxime, a GSK-3β inhibitor, resulted in normalized fluorescent values of 1.73 and 1.53 ( Table 1 ) for 2-NBDG and CellTrace Calcein Red-Orange AM uptake, respectively, indicating that their glucose utilization and proliferation status were higher than the normal untreated Hep3B cells. This could suggest that GSK-3β inhibition may not be effective in targeting the glucose metabolism pathway of these cells.
However, there were some drugs that depressed the glucose uptake and proliferative ability of the THLE-2 cells. Some examples include TYRPHOSTIN AG-1295, a tyrosine kinase inhibitor and H-7-2HCl, a multiple protein kinase inhibitor, for which their fluorescence values were less than 1 ( Table 2 ). These data suggest that the pathways inhibited by these compounds are important for the viability of these THLE-2 cells and that these compounds could be avoided so that normal liver cells are not compromised.
Both cell lines were also subjected to the kinase inhibitors at a higher concentration of 5 µM. Even though the top hits after Hep3B and THLE-2 cell lines were treated with 5 µM were different, there were some overlaps between the two concentrations. At a higher concentration of 5 µM, both ZM 449829 and SU1498 behaved similarly, as observed at a concentration of 1 µM (
Tables 4
Summary of the Analysis from the ArrayScan VTI High-Content Screen on Hep3B. a
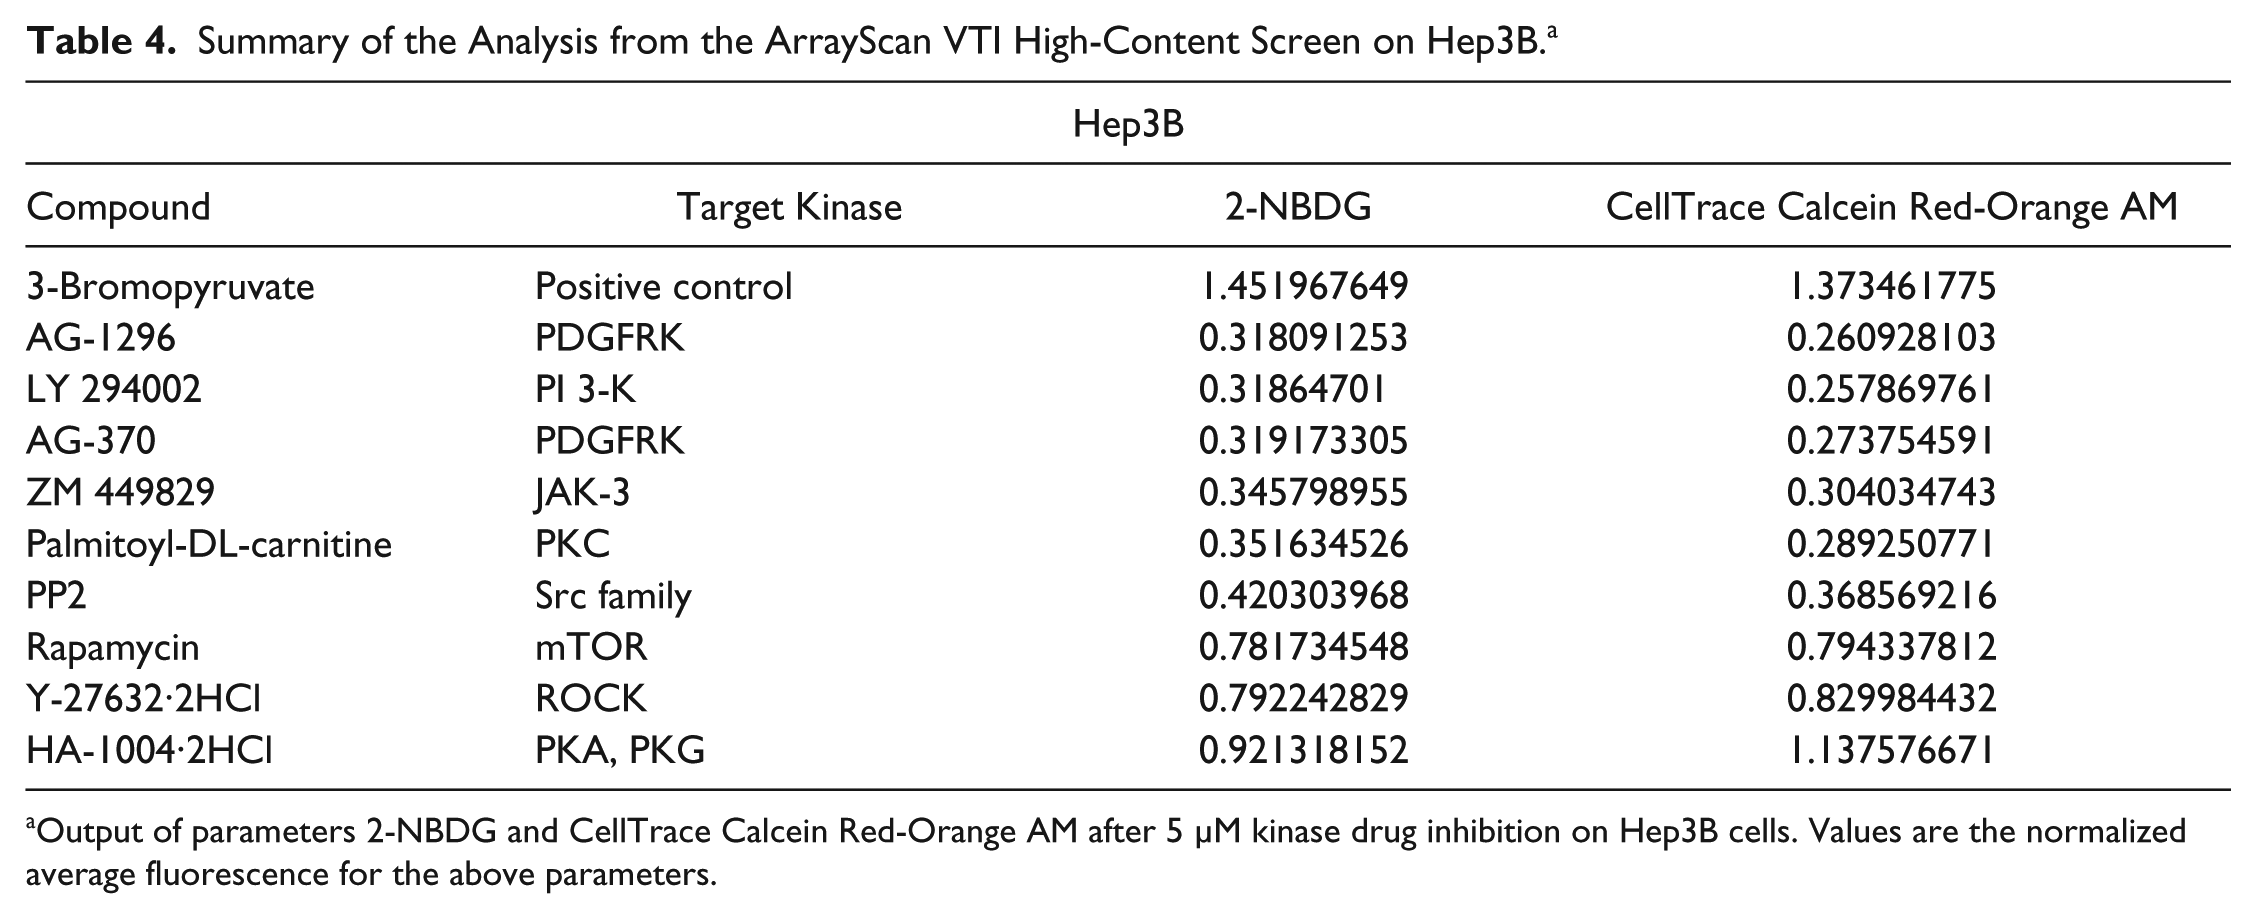
Output of parameters 2-NBDG and CellTrace Calcein Red-Orange AM after 5 µM kinase drug inhibition on Hep3B cells. Values are the normalized average fluorescence for the above parameters.
Summary of the Analysis from the ArrayScan VTI High-Content Screen on THLE-2. a
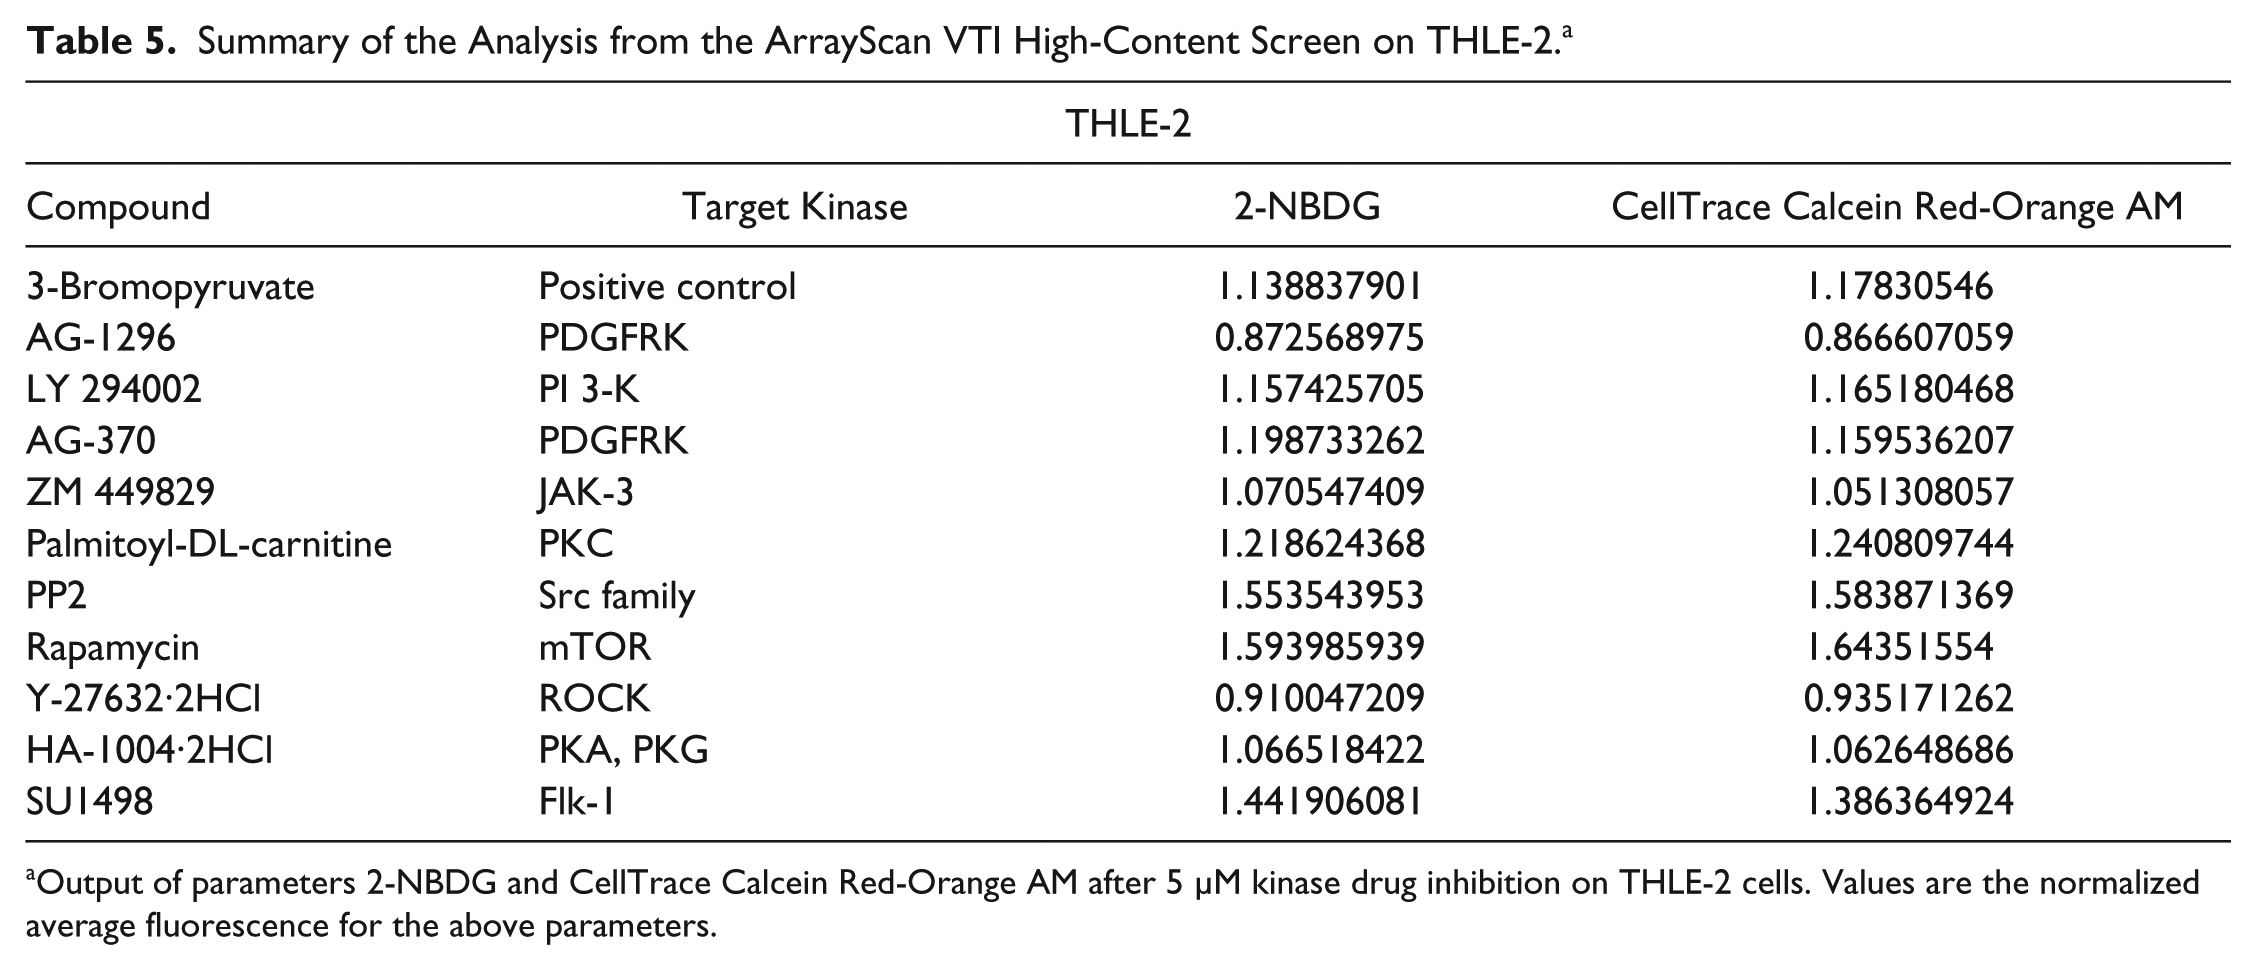
Output of parameters 2-NBDG and CellTrace Calcein Red-Orange AM after 5 µM kinase drug inhibition on THLE-2 cells. Values are the normalized average fluorescence for the above parameters.
Selected Hits from the Results of HCS
Based on the results from the HCS analysis, drugs that potently inhibited both glucose metabolism and proliferation of Hep3B cells without affecting THLE-2 cells were selected. There was decreased fluorescence of channel 2 (2-NBDG), indicating that glucose utilization decreased upon treatment with ZM 449829 (
Fig. 4Av
) and SU1498 (
Fig. 4Aviii
) as compared with the untreated control Hep3B cells (
Fig. 4Aii
). The proliferative rate of the cells also decreased, as evident from the decreased fluorescence of CellTrace Calcein Red-Orange AM for ZM 449829–treated cells (
Fig. 4Avi
) and SU1498-treated cells (
Fig. 4Aix
). As juxtaposed to the control nontumorigenic THLE-2 cell line, the fluorescence of 2-NBDG on the ZM 449829–treated cells (
Fig. 4Bv
) and SU1498-treated cells (
Fig. 4Bviii
) did not differ much from the control untreated cells (
Fig. 4Bii
). This was mirrored in the proliferation status of the cells as well, where there was not much difference in the fluorescence of CellTrace Calcein Red-Orange AM in the treated cells (
Fig. 4Bvi
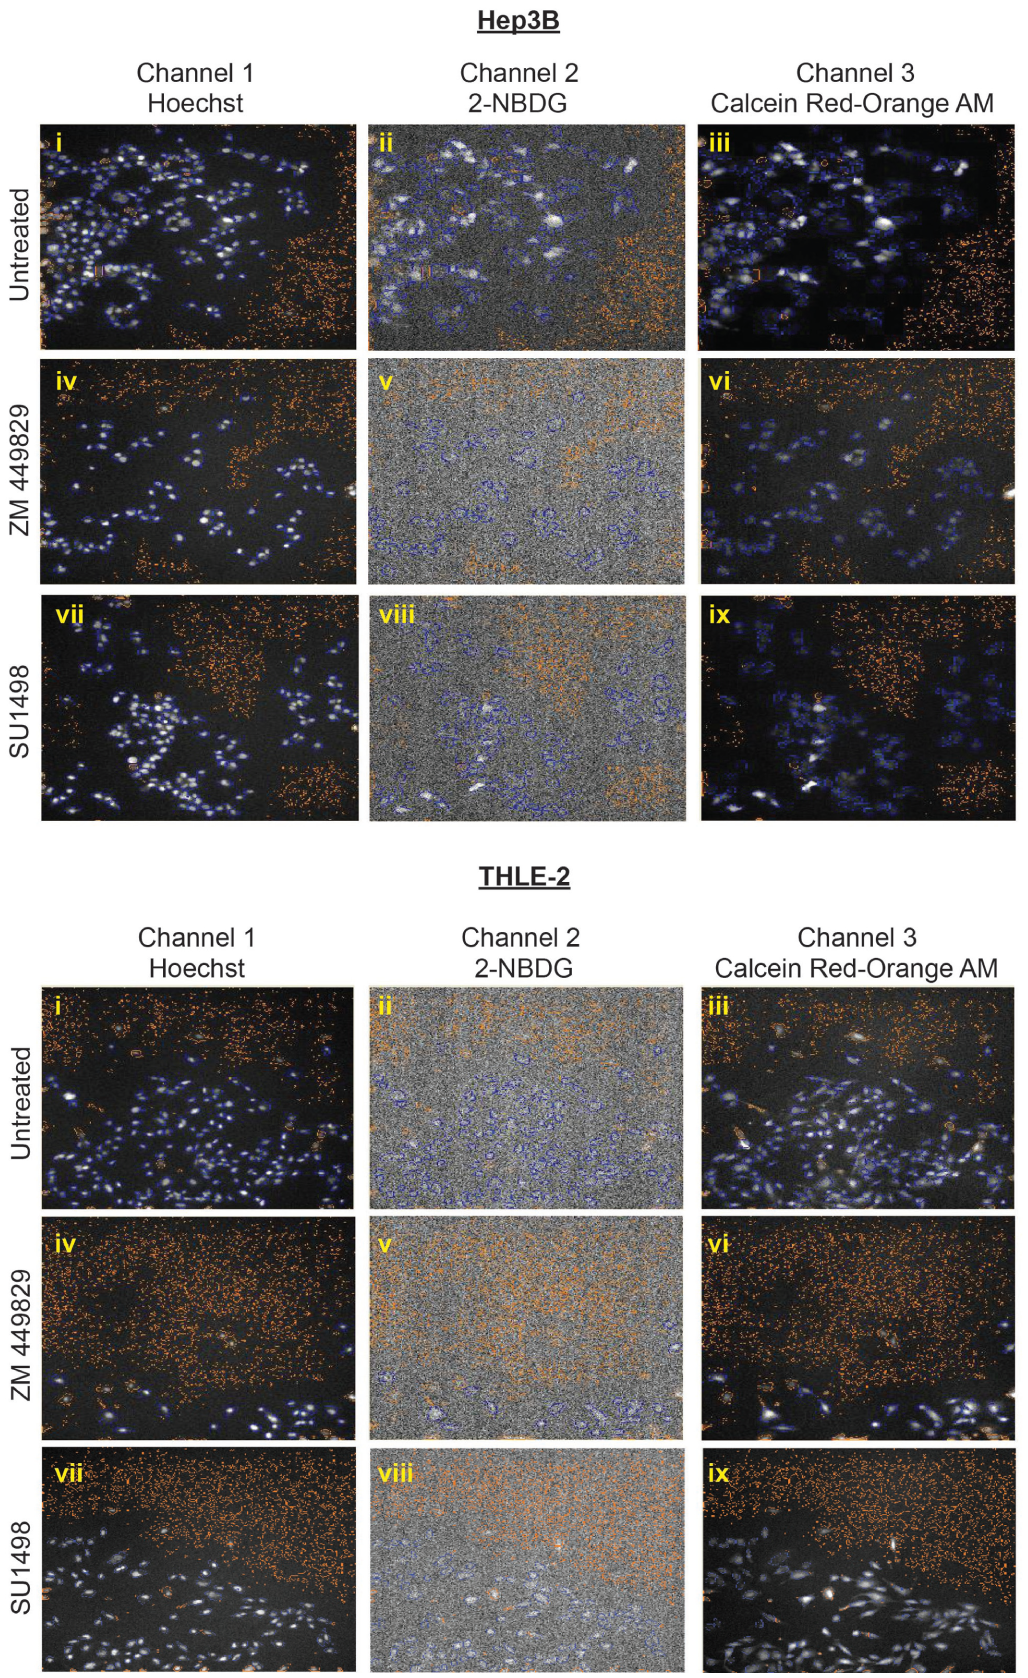
Selected hits from the drug screen. (
Validation of Selected Hits
To confirm the HCS results, we treated both Hep3B and THLE-2 cells with ZM 449829 and SU1498 for 24 h to determine their half-maximal inhibitory concentrations (IC50). For ZM 449829, the IC50 for Hep3B was 9.97 ± 0.66 µM, whereas that for THLE-2 was 25.6 ± 0.99 µM ( Fig. 5A ). For SU1498, the IC50 for Hep3B was 8.32 ± 0.58 µM, whereas that for THLE-2 was 235 ± 38.1 µM ( Fig. 5B ). The IC50s for both drugs were significantly lower for Hep3B compared with THLE-2, suggesting that the drugs targeted the HCC cells more specifically and effectively than the nontumorigenic cells.
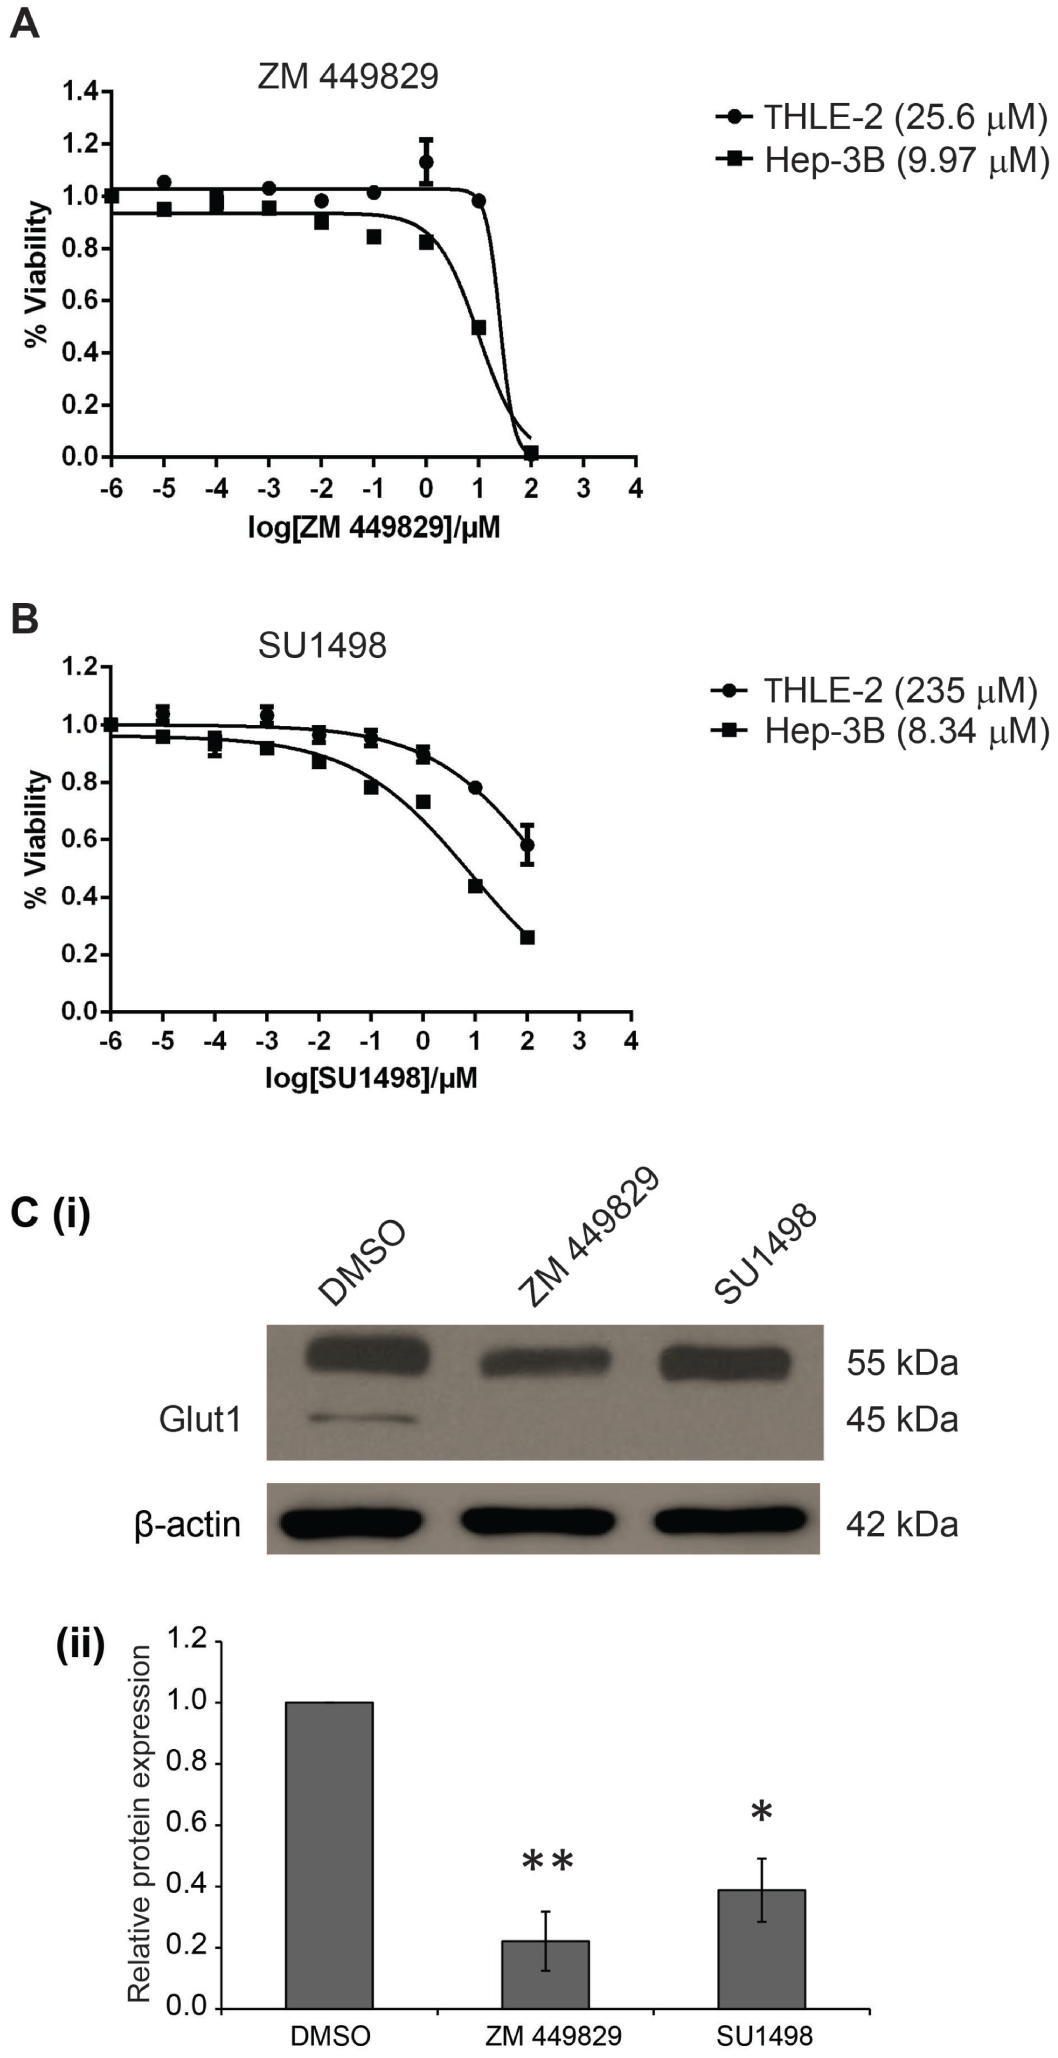
In vitro validation of selected hits, ZM 449829 and SU1498. Half-maximal inhibitory concentrations (IC50) of (
To verify the specific inhibition of glucose uptake by the selected inhibitors, the protein expression levels of Glut1 were determined and quantified after inhibitor treatment. The protein levels of the 45 kDa isoform of Glut1 for both the ZM 449829– and SU1498-treated Hep3B cells were significantly decreased as compared with the DMSO-treated control ( Fig. 5Ci ), with relative quantification of 0.221 and 0.388 for the ZM 449829– and SU1498-treated Hep3B cells, respectively ( Fig. 5Cii ). This further validates the inhibition of glucose uptake by the respective drugs. Collectively, using these different outputs to measure the proliferation status and the glucose uptake levels of the inhibitor-treated cells, we demonstrated the robustness of a multiparameter HCS approach to identify glucose metabolism inhibitors that may effectively treat HCC.
Optimal Drug Combination Prescribed by FSC.II
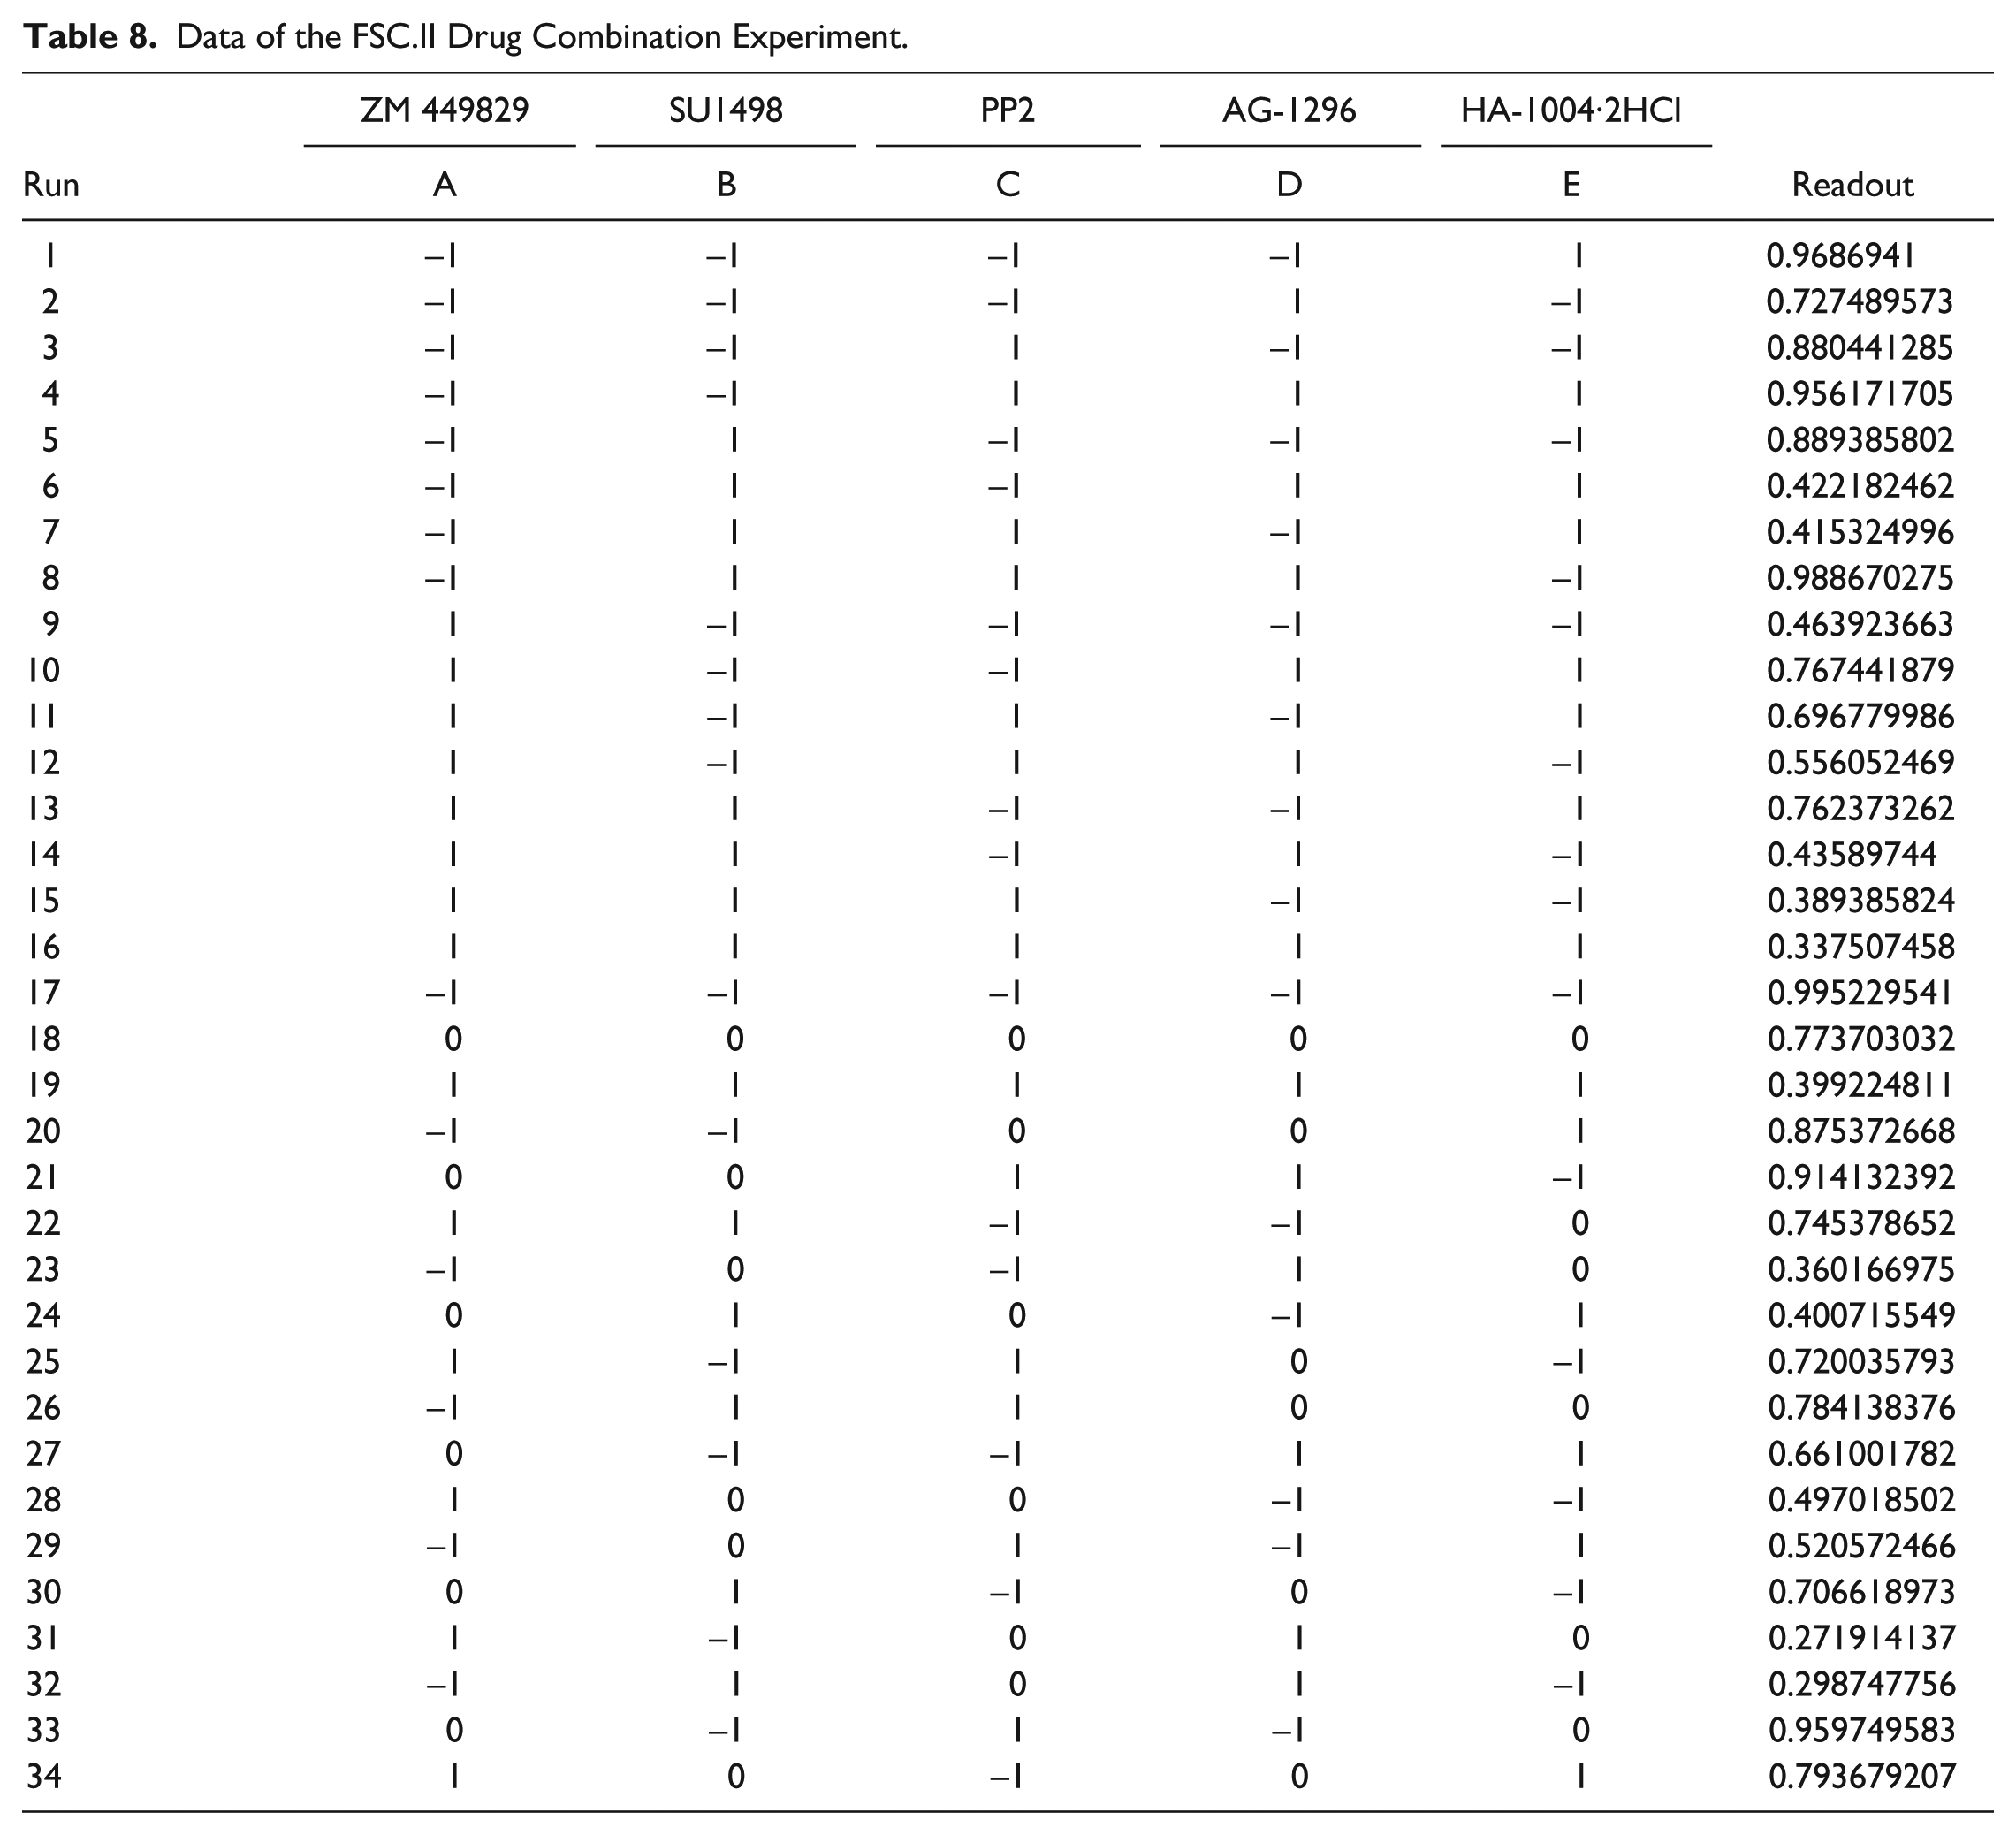
Following identification of compounds that potently inhibited both glucose metabolism and cancer cell proliferation, FSC.II was performed to determine optimal drug combinations for maximal cancer cell growth inhibition. Prior to carrying out the drug combination experiments, the IC50s of the selected drugs were determined ( Table 6 ). Based on these values, the respective IC20 and IC10 values were used for the different concentrations for the 34 combinations ( Table 7 ). After treating both Hep3B and THLE-2 cells with the different combinations for 72 h, the absorbance from the MTS assay was used to measure the proliferative status of the cells ( Table 8 ). We commenced the analysis by fitting a second-order model, previously carried out by Ding et al., 19 using the measured proliferation status of the cells as the response. A fitting correlation R2 value of 0.87 was observed, indicating a strong match between the projected and observed outcomes. Table 9 shows that the linear effect B was significant at the 0.1% level; the linear effects of A and D, the combination effect CD, and the quadratic effect C2 were significant at the 1% level, and the combination effects AE, BE, and CE and the quadratic effect D2 were significant at the 5% level. Overall, the results showed that A (ZM 449829), B (SU1498), and D (AG-1296) are significant drugs, with D having a strong interaction with C (PP2). There is mild interaction between E (HA-1004·2HCl) with A, B, and C. Based on this initial fitted model, we proceeded to analyze the response surface plots of the predicted repression of proliferation. Results from FSC.II analysis suggested a two-drug combination (D1), ZM 449829 (2.74 µM), SU1498 (0 µM), PP2 (0 µM), AG-1296 (0 µM), and HA-1004·2HCl (53.9 µM), and a three-drug combination (D2), ZM 449829 (2.74 µM), SU1498 (0 µM), PP2 (0 µM), AG-1296 (35.5 µM), and HA-1004·2HCl (53.9 µM).
Half-Maximal Inhibitory Concentration (IC50) of the Respective Drugs on Hep3B. a
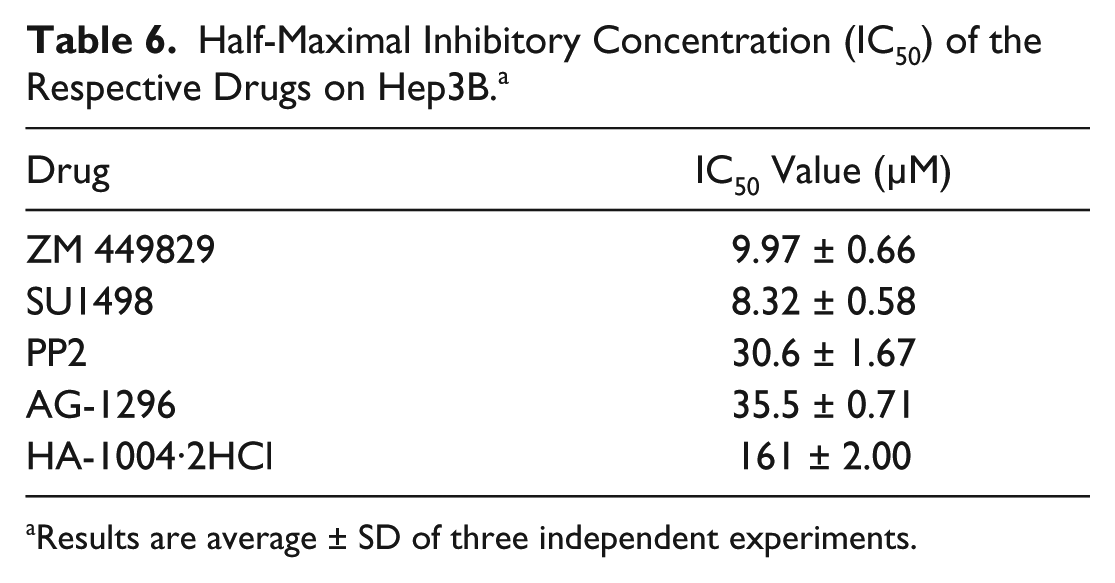
Results are average ± SD of three independent experiments.
Concentrations of Drugs Used for the 34 Drug Combinations. a
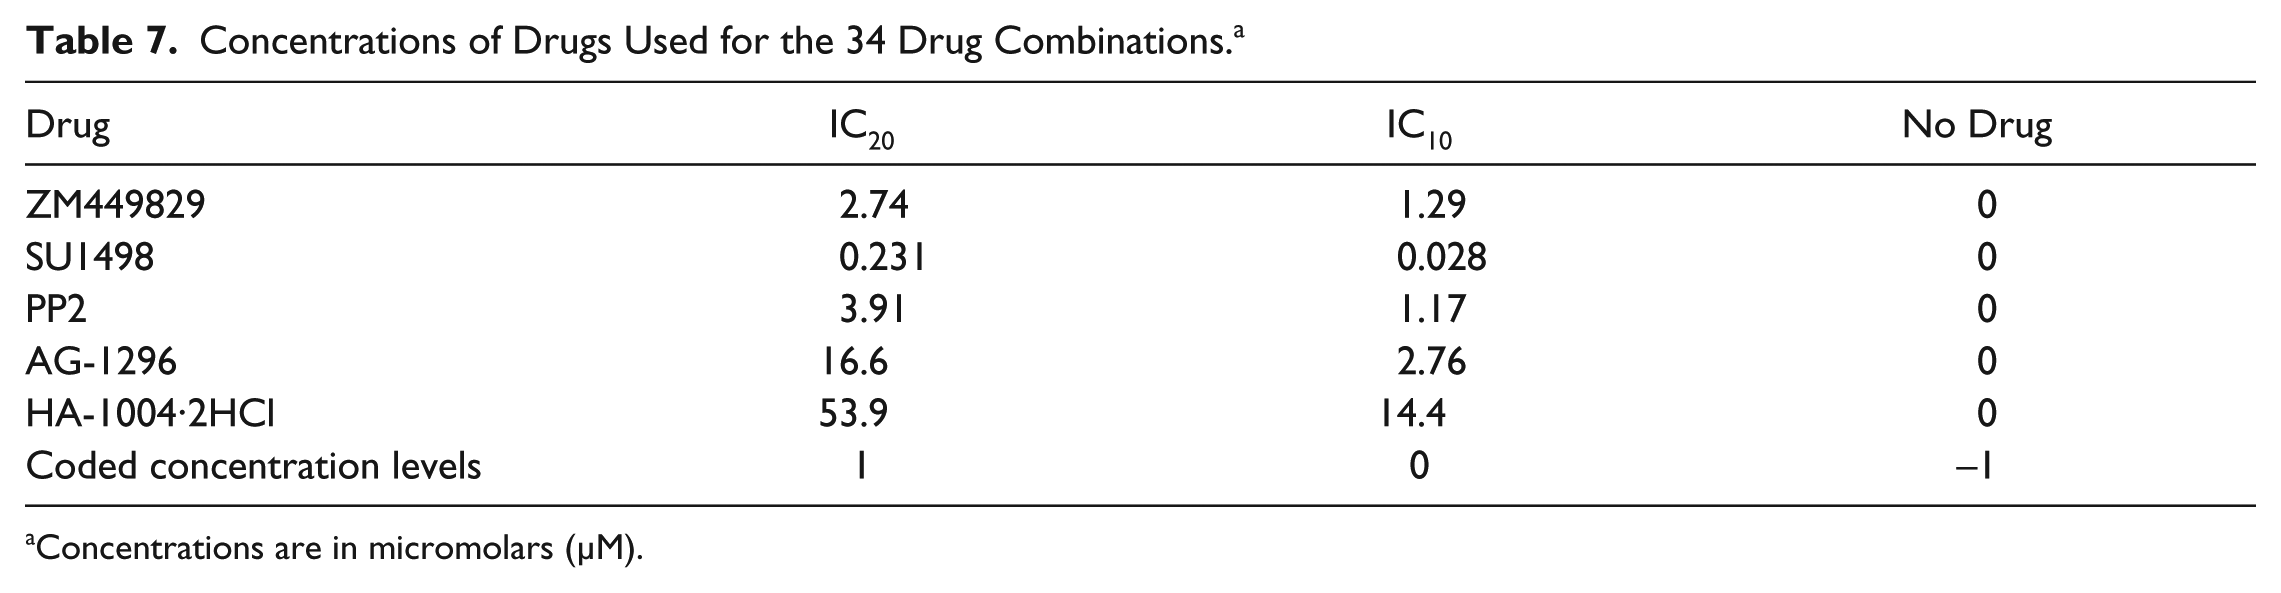
Concentrations are in micromolars (µM).
Data of the FSC.II Drug Combination Experiment.
Estimates of Parameters for the FSC.II 34-Combination Experiment.
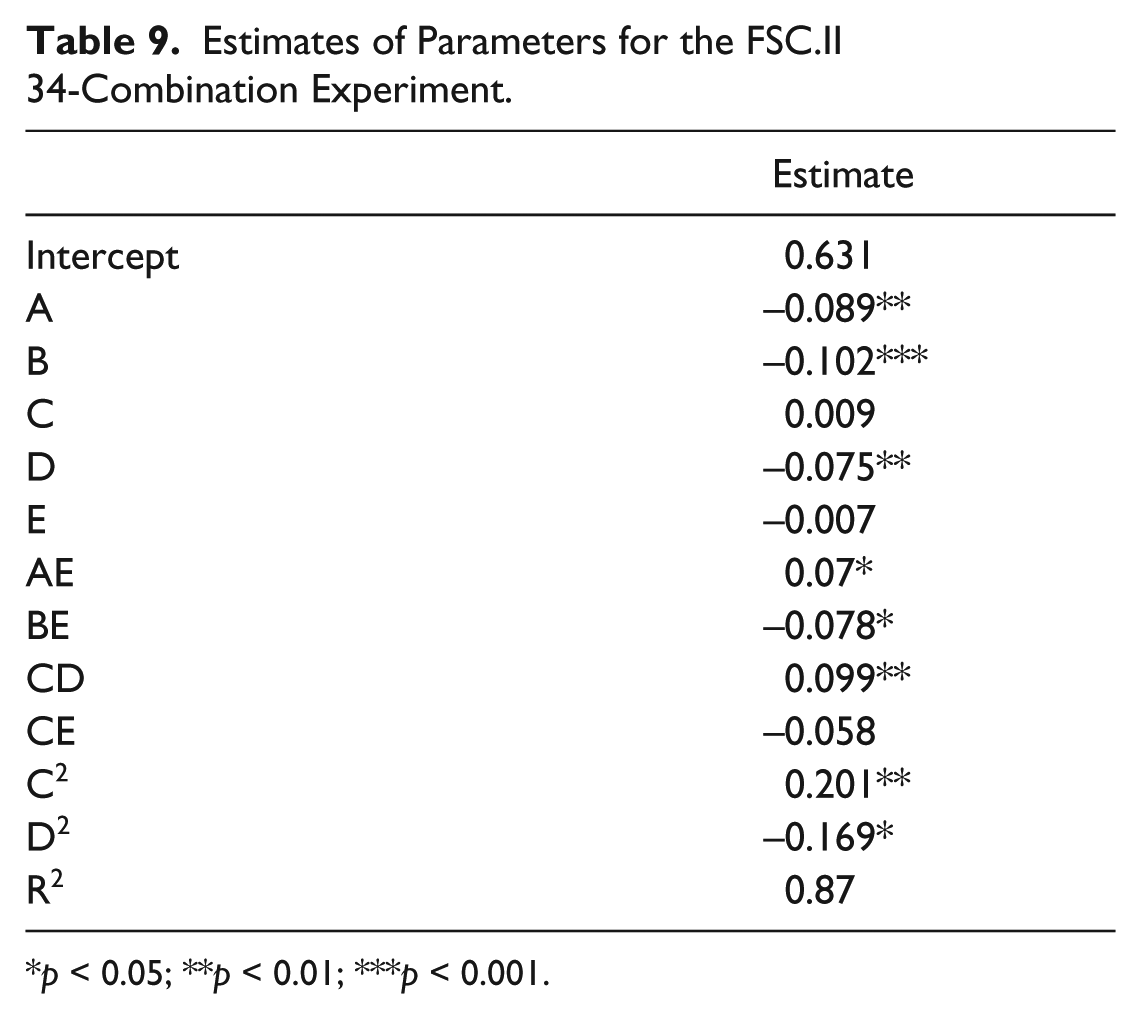
p < 0.05; **p < 0.01; ***p < 0.001.
Validation of Drug Combinations, D1 and D2
To validate the drug combinations suggested by the FSC.II optimization, Hep3B cells were treated with D1 and D2 drug combinations. Two other combinations, D3 and D4, which were ranked insignificant by the FSC.II, were also included to serve as a basis of comparisons. After combinatorial drug treatment for 72 h, the Hep3B cell viability following D1 treatment was significantly reduced to 50.28% ± 0.55% cell viability, and D2-treated cells showed reduction of proliferation to 29.99% ± 0.52% cell viability as compared with the control ( Fig. 6A ). In contrast, no significant changes in terms of proliferation were observed for combinations D3 and D4.
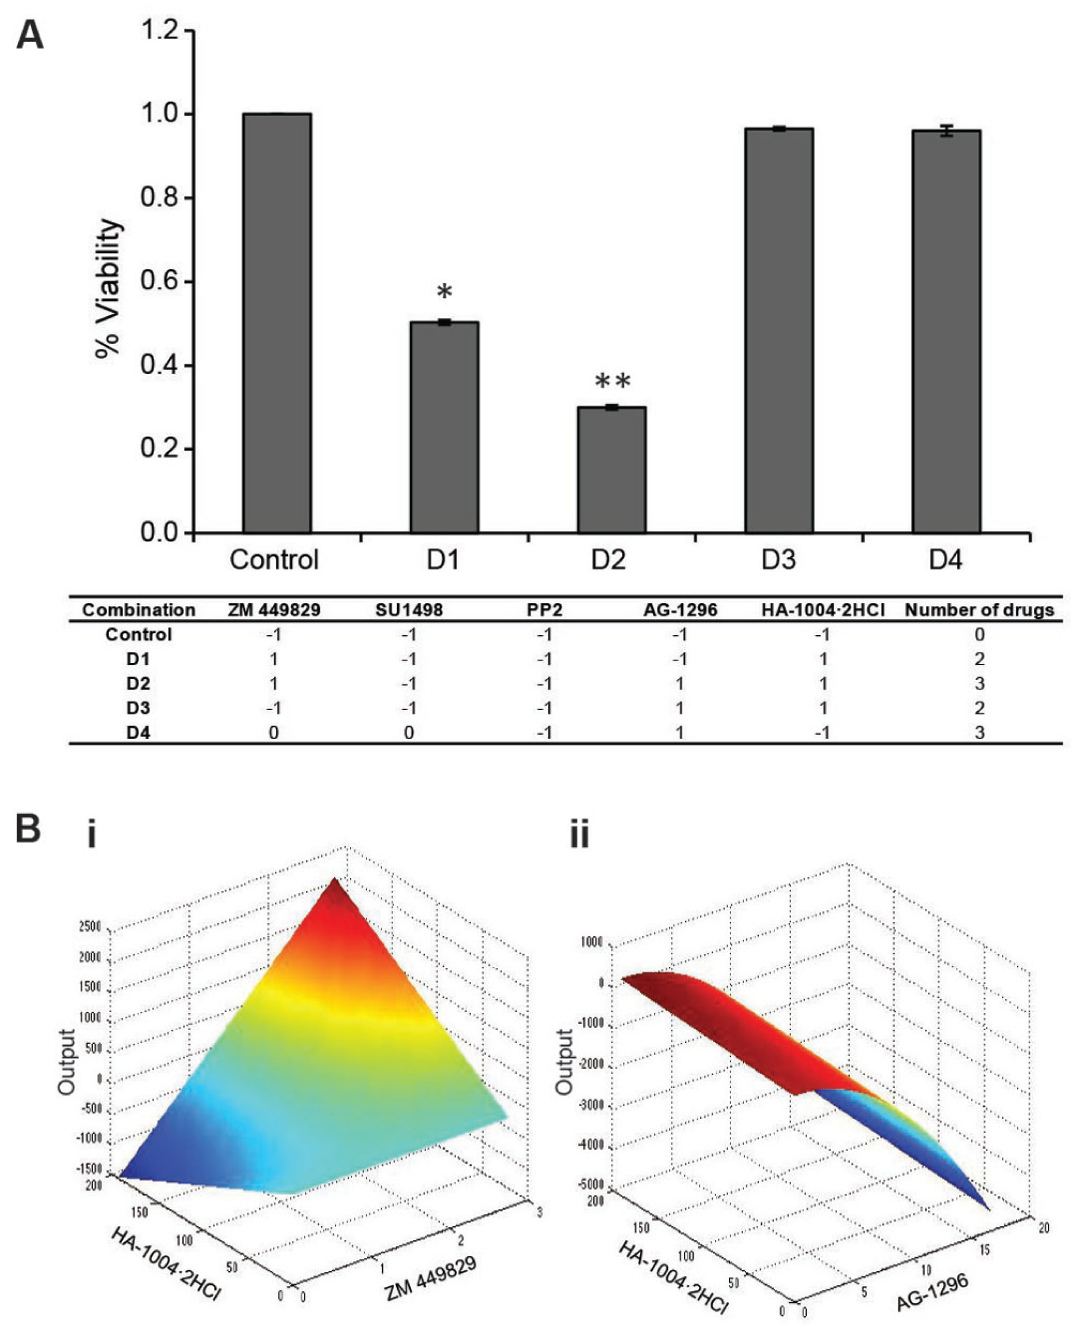
FSC.II optimization of drug combination. (
A comparison of the two-drug combinations to the predicted response surface plots showed that the maximal interaction between ZM 449829 and HA-1004·2HCl occurred at the peak when the concentrations of ZM 449829 and HA-1004·2HCl were high, as reflected by the decrease in the proliferation status of D1 ( Fig. 6Bi ). For AG-1296 and HA-1004·2HCl, maximal output was observed when AG-1296 was low, regardless of the concentration of HA-1004·2HCl. The reverse occurred when the AG-1296 concentration was high ( Fig. 6Bii ). This mirrored the verification of D3, which was composed of both AG-1296 and HA-1004·2HCl at their highest concentrations but did not affect the proliferation of the cells. Collectively, these results and analyses confirmed the effectiveness of FSC.II in definitively identifying the most potent drug combinations possible.
Discussion
Glucose metabolism in cancer cells is mainly characterized by two major biochemical events: (1) increased glucose uptake and (2) aerobic glycolysis, the process of converting glucose into pyruvate resulting in the production of lactate. Recent literature has shown enhanced glucose metabolism in tumors as compared with normal, healthy cells. There is much progress recently demonstrating viable targets of glucose metabolism that effectively arrests these cancer cells. 3-bromopyruvate, an antiglycolytic and alkylating agent, has been shown to mediate cell death by inhibiting GAPDH, which is involved in glycolysis and cell survival. 15 By binding to GAPDH, 3-bromopyruvate depletes ATP, thus depriving the cancer cells of energy. Because of promising in vitro and in vivo results, 3-bromopyruvate has entered the early phase of clinical trials. Another promising target is lactate dehydrogenase (LDH), which facilitates the conversion of pyruvate into lactate in the glycolytic pathway. The export of lactate out of cells is essential as intracellular accumulation of lactate lowers the pH. This active transport requires monocarboxylate transporters. For instance, FX11, an inhibitor of LDH, depletes intracellular ATP levels, which in turn significantly increases oxidative stress, resulting in tumor cell death.
The results of our HCS analysis using the ArrayScan VTI HCS to target glucose metabolism has shown that some kinase inhibitors are capable of depressing glucose utilization of the cells, thus affecting the proliferation of the cells. ZM 449829 and SU1498, inhibitors of JAK-3 and Flk-1, respectively, decreased the uptake of 2-NBDG and CellTrace Calcein Red-Orange AM on the HCC cell line, Hep3B, while not affecting the nontumorigenic THLE-2 cells. This system has been validated using a previously published inhibitor, 3-bromopyruvate, which effectively inhibits Hep3B but not THLE-2. Hence, ZM 449829 and SU1498 could potentially be viable inhibitors to arrest increased glucose activity selectively in HCCs, without affecting the normal liver cells. This would be especially relevant as many solid tumors are heterogeneous in nature. This selectivity would also be more advantageous as compared with conventional chemotherapeutic drugs such as the anthracyclines, which are nonselective and target the normal healthy cells as well. Tumor glycolysis has seen to play a role in chemoresistance, and as such, these inhibitors may serve as combinatorial therapy in addition to the chemotherapeutic drugs. These combinatorial therapies have produced better results in preclinical models. One example using 3-bromopyruvate to sensitize the tumor cells before administering chemotherapeutic drugs, such as paclitaxel, improved the efficacy.31,32 By harnessing the FSC.II platform, the drug targets highlighted from HCS were used to identify optimal interactions and combinations between the different drugs. The combinations suggested in this study involved the permutation of ZM 449829, a JAK-3 family inhibitor; AG-1296, a platelet-derived growth factor receptor kinase inhibitor; as well as HA-1004·2HCl, a cyclic AMP-dependent protein kinase (PKA) and cyclic GMP-dependent protein kinase (PKG) inhibitor. JAK-3 has not been extensively explored in HCC glucose metabolism, but studies have shown its role in adipogenesis, immune responses, and myocardial glucose metabolism.33–36 This raises our interest in exploring how JAK-3 inhibition leads to glucose repression in HCC. Studies have shown that adipose tissue lipolysis also occurs when an alternative fuel source is needed, where PKA and PKG are involved in promoting the hydrolysis of triglycerides. 37 Even though both ZM 449829 and HA-1004·2HCl inhibit different pathways, this could suggest that they are repressing glucose metabolism by altering the levels of an alternative energy source. PDGF-regulated glycolysis has also been shown to occur independently of PDGF-regulated proliferation in tumors. 38 This further supports the finding in our study in using AG-1296 to decrease glucose uptake. Further investigations of how the combinations D1 and D2 affect the glucose metabolic pathways in HCC should be determined to delineate the mechanism of inhibition.
Even though drug combinations D1 and D2 managed to significantly reduce cellular proliferation to 50% and 30%, respectively, the treatment efficacy can be further improved. A more thorough study would include the initial selection of more drug candidates so that more interactions can be highlighted. Based on the significant factors generated from the first output via FSC.II optimization, the combinations can be further refined by carrying out subsequent iterations. This enables us to better capture the robustness of FSC as a platform for phenotypic personalized medicine, highlighting the interactions and combinations from an initial large array of factors. The use of both HCS and FSC present a promising platform that will aid in the development of novel therapeutic drugs and uncover potentially new indications for FDA-approved drugs and even potential interacting combinations to manage HCC, as well as other cancers.
Footnotes
Declaration of Conflicting Interests
The authors declared no potential conflicts of interest with respect to the research, authorship, and/or publication of this article.
Funding
The authors disclosed receipt of the following financial support for the research, authorship, and/or publication of this article: E.K.-H.C. gratefully acknowledges support from the National Research Foundation Cancer Science Institute of Singapore RCE Main Grant, National Medical Research Council (NMRC CBRG-NIG NMRC/BNIG/2012/2013), and Ministry of Education Academic Research Fund (MOE AcRF Tier 1 T1-2012 Oct-11 and Seed Fund Grant T1-BSRG 2014-05). This work is funded by the NCIS Yong Siew Yoon Research Grant through donations from the Yong Loo Lin Trust. D.H. gratefully acknowledges support from the National Science Foundation CAREER Award (CMMI-1350197), Center for Scalable and Integrated NanoManufacturing (DMI-0327077), CMMI-0856492, DMR-1343991, V Foundation for Cancer Research Scholars Award, Wallace H. Coulter Foundation Translational Research Award, National Cancer Institute Grant U54CA151880 (the content is solely the responsibility of the authors and does not necessarily represent the official views of the National Cancer Institute or the National Institutes of Health), Society for Laboratory Automation and Screening Endowed Fellowship, and Beckman Coulter Life Sciences.