
Abstract
In order to describe temperature-dependent cell osmotic behaviors in a more reliable method, a novel mathematical mass transfer model coupled with dynamic temperature change has been established based on the combination of a time domain to temperature domain transformation equation and a constant temperature mass transfer model. This novel model is numerically simulated under multiple temperature changing rates and extracellular osmolarities. A microfluidic system that can achieve single-cell osmotic behavior observation and provide dynamic and swift on-chip temperature control was built and tested in this paper. Utilizing the temperature control system, the on-chip heating processes are recorded and then described as polynomial time–temperature relationships. These dynamic temperature changing profiles were performed by obtaining cell membrane properties by parameter fitting only one set of testing experimental data to the mathematical model with a constant temperature changing rate. The numerical modeling results show that predicting the osmotic cell volume change using selected dynamic temperature profiles is more suitable for studies concerning cell membrane permeability determination and cryopreservation process than tests using constant temperature changing rates.
Keywords
Introduction
Biospecimens such as red blood cells, spermatozoa, oocytes, and bone marrow can be stored at a very low temperature for decades and still be vital after thawing to normal temperature with proper cryopreservation protocols.1–4 During the cooling processes in cryopreservation, fatal injuries such as osmotic injury and intracellular ice formation injury on biological samples may occur, and both are firmly related to transmembrane water transportation. 5 To avoid those injuries during cryopreservation, the prediction and regulation of the transmembrane water transportation process are two essential approaches. These approaches can be achieved by establishing a transmembrane water transport model and determining its cell membrane permeability to water.
Based on the van’t Hoff equation and Clapeyron equation, several numerical models have been proposed to describe transmembrane mass transfer; they use a temperature-dependent cell membrane property, Lp, to represent the cell membrane’s ability to transport water (cell membrane permeability to water).2,6,7 A mass transfer model involving the temperature changing rate and temperature-dependent Lp can better reflect the phenomenon of the actual cooling process during cryopreservation, which will also help scientists propose an optimal cryopreservation protocol with an optimized concentration of nonpermeating cryoprotective solutes and/or salt with the least damaging cooling and thawing rates.
The dependence of Lp on temperature can be expressed by the Arrhenius equation with Lpg (membrane permeability to water at the reference temperature) and Ea (activation energy of Lp).8–10 Different types of cells in different conditions have various Lpg and Ea values and react differently to osmotic changes. Determining cell-specific cryopreservation protocols basing on cell-specific Lpg and Ea has the advantage of high cryopreservation efficiency.11,12 For obtaining suitable Lpg and Ea values for specific cells, much research has been done. Chen et al. and Peng et al. illustrated in their papers13,14 that Lp of a specific cell at a certain temperature can be obtained by recording the cell volume change under a sudden osmolarity change, and then a constant temperature transmembrane mass transfer model is deduced by curve fitting the cell volume versus time. By doing such experiments at a few discrete temperature points (e.g., 4, 22, and 37 °C), Lpg and Ea can be acquired by parameter fitting the Arrhenius equation.
Leibo 12 measured Lp at multiple temperatures between 0 and 30 °C and then estimated the Ea and Lpg values of fertilized and unfertilized mouse ova. Later, McGann et al. 15 measured Lp of chondrocytes at 3, 18, and 24 °C and calculated Ea. Chen et al.13,16 measured Lp of mouse dendritic cells at 12, 22, 25, and 32 °C and then calculated Ea with the Arrhenius plot. Recently, in Fang’s research, 17 Lp and cell permeability to cryoprotective agent (CPA; DMSO solution), at various temperatures (room temperature and 30 and 37 °C), were both measured. Ea for Lp and activation energy for membrane permeability to CPA were both calculated. All of those results were obtained by conducting Lp measuring experiments in multiple discrete temperatures, which will also help scientists in understanding osmotic behaviors of many different cell types. Ea is usually obtained by performing parameter fitting with the data collected from limited discrete temperatures, while the membrane conditions might be inconsistent among the temperature ranges (e.g., due to membrane phase transition18,19). Those test results may also lack of accuracy since the cells being observed in different temperatures are possibly different, and those different cells may be in various growing stages and membrane conditions. Even if the tests are conducted with the very same cell, repetitive osmotic changing processes could result in tampered membrane conditions. Also, massive labor is requires to repeat the same process at different temperatures.
As for the experimental setup and approaches to measure cell membrane permeability, many innovative devices and techniques have been developed and improved. Through the years, experimental devices were designed to be more integrated with better temperature control performance and higher observation accuracy. In 1980, Leibo 12 obtained Lp at different temperatures by measuring cell volume change when the cell was transferred from phosphate-buffered saline (PBS) solution into a rectangular glass capillary tube filled with hypertonic sodium chloride (NaCl) solution. The temperature was regulated by mounting the capillary tube on a controlled hot plate of a thermoelectric microscope stage. Sample temperatures were measured by a thermocouple inserted into the capillary tube. During each test, usually 15–30 photographs were taken, and the ova rose and sank in the capillary, which was inconvenient for continuous observation. In McGann et al.’s research in 1988, volume changes of thousands of cells were measured and averaged with an electronic particle counter. 15 Cell suspensions and experimental solutions (hypertonic Ham F12 medium) were kept at a preset temperature in a water bath before testing. This temperature control method might not be sufficient and accurate for dynamic temperature changing tests since the heat transfer process through water baths and large-volume cell suspensions was confined. With the recent development of microfluidic technology, various devices providing quantitative and efficient measurement for small-volume biosamples have been invented.20,21 In 2007, Chen et al.13,16 designed microfluidic platforms that could stabilize single cells and observe constant cell osmotic volume change. Cells were trapped in a perfusion chamber during the tests, and the extracellular environment was changed from PBS to 3× PBS. Temperature was controlled by circulating liquid in the test temperature underneath the perfusion chamber layer and reading the temperature with a thermocouple. These microfluidic platforms realized on-chip temperature control and single-cell osmotic behavior observation. More recently, in 2015, Lai 22 developed a microfluidic CPA exchange system to study the positive influence of a steady and slow cell shrinkage rate during CPA exchanges on sublethal cellular damage. Multiple oocytes and zygotes could be immobilized in a microfluidic CPA exposure chamber by several separate microsuction ports. This system could reduce convective forces applied to cells. In 2017, Toner 23 designed a single-cell trapping device to determine the cell membrane permeability of rat hepatocytes and patient-derived circulating tumor cells on a cryostage at 4, 22, and 37 °C. This device could realize osmotic volume change observation of multiple isolated cells with an array of butterfly-shaped traps. Zhao 24 developed a microfluidic device with four groups of semicircular distributed micropillars for cell immobilization. This device could study the permeability of four oocytes in gradient concentration distribution synchronously and nondestructively. Fang 17 designed a microfluidic platform that could perform single-cell analysis by flow-focusing at a velocity stagnation point, and it was integrated with a precise micro on-chip temperature control system. The channel structure and fluid pressure would not interfere with the cell trapped at the stagnation point, which could better reflect the environment of cell suspension in actual cryopreservation. However, the manufacturing and regulation process of this platform required highly precise operations.
Zhao also measured the membrane permeability of human oocytes with a microfluidic chip at 4, 15, and 25 °C in 2017 25 and an updated design at 0, 4, 15, and 22 °C later in 2019. 26 These multilayer devices could trap cells with a cuboid “road block” structure in the microchannel and achieve determination of the cell permeability from 0 °C to room temperature. The temperature of the trapping zone was recorded by a thermocouple embedded beneath it, and the coolant bath was isolated from the trapping channel with a glass layer above or beneath it. However, with the increasing requirement of precise on-chip temperature control, the thermocouple became less sufficient for cell-scale temperature measurement. Zhao 27 then determined the membrane permeability of human oocytes at 37 °C using a new microfluidic device. In this device, a cell-scale microheater and resistive temperature detector were integrated as a local temperature control system using ITO patterning wire coated on the glass substrate. This control system was more accurate than the global temperature control. Compared with earlier works, those recent devices provided a much faster response and more precise on-chip temperature control. However, experiments with those devices were only conducted using constant temperatures.
This research builds a mass transfer model with dynamic temperature change to obtain Lpg and Ea utilizing the relationship between temperature and osmotic cell volume change. With the proposed numerical model, the properties of cell transmembrane mass transfer for the nonpermeating solute-only situation can be estimated by parameter fitting only one set of experimental data that cover information about transmembrane water flux within the entire temperature changing range. Corresponding osmolarity changing experiments can be achieved by recording cell volume change versus time and temperature change versus time under the same timescale utilizing a microfluidic controlled cell trapping device integrated with a precise and fast-response on-chip temperature control system. Based on the experimental on-chip heating results, the mass transfer model is also modified and verified with the dynamic temperature changing rate for a more reliable and straightforward measurement.
Materials and Methods
Mathematical Transmembrane Water Transfer Model with Dynamic Temperature
A mathematical transmembrane water transfer model for the nonpermeating solute-only situation at a constant temperature can be expressed as the dynamic relationship between the cytoplasmic water loss rate and the osmolarity difference across cell membranes:16,28–31
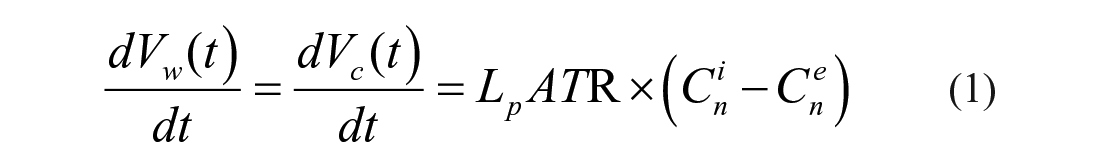
where Vw(t) is the total volume of cytoplasmic water loss (μm3) at time t (min); Vc(t) is the cell volume (μm3) at time t (min); and Lp is the cell membrane permeability to water (μm/atm/min), assumed to be constant at a certain temperature. A is the cell membrane area (μm2) and assumed to be constant during the experiment; T is the absolute temperature (K); R is the universal gas constant (R = 0.008207 [atm·L/mol/K]); and

where
When its extracellular environment being changed from an isotonic solution to a hyperosmotic solution with nonpermeating CPA, a cell loses its intracellular water until the osmolarity of its extracellular environment and cytoplasm reaches equilibrium, which is one typical process of many situations that can be described by eq 1. By fitting the cell volume change and time obtained from the experiments to eq 1, the Lp value of this certain cell can be obtained at certain experiment temperatures. In order to observe and record single-cell osmotic behavior, a single-cell trapping microfluidic device with precise on-chip temperature control is used in this paper. A single cell can be stopped, immobilized, and observed under dynamic temperatures at a micro “lowered ceiling” block structure in a microchannel, as given in the subfigure in Figure 1 . As presented in Figure 1 with a Jurkat cell (Jurkat cells, Clone E6-1; American Type Culture Collection, Manassas, VA), the cell loses its intracellular water and shrinks right after the switching of its extracellular environment. The relationship of the cell volume change and time can be obtained by processing microscopic images that are recorded during shrinkage. The volume change is fast during the first few seconds because of the high chemical potential difference across the cell membrane, and then it gradually slows down until the intracellular osmolarity and extracellular osmolarity reach equilibrium. The numeric solution with fitted values from parameter fitting of eq 1 agrees with the experimental result.

Osmotic volume change of a trapped Jurkat cell and its numerical modeling result with eq 1. The top right subfigure is a diagram of single-cell trapping using a stair-structure microfluidic channel.
On the occasions with different temperatures, the dependence of Lp on temperature T follows the Arrhenius equation and can be expressed as
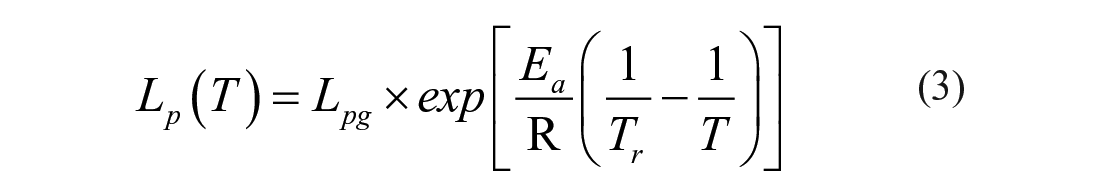
where Lpg (μm/atm/min) is the membrane permeability to water at the reference temperature Tr (in K) and Ea (kcal/mol) is the activation energy of Lp. With Lp measured from at least three different temperatures, Ea can be determined by parameter fitting with eq 3.
In order to simplify the multiple measuring procedures into a one-off measurement and achieve a more accurate result, it is necessary to establish a coupled transmembrane mass transfer model under dynamic temperature for the nonpermeating solute-only situation. To achieve that, expression of the cytoplasmic water loss rate needs to be transferred from time-dependent to temperature-dependent by
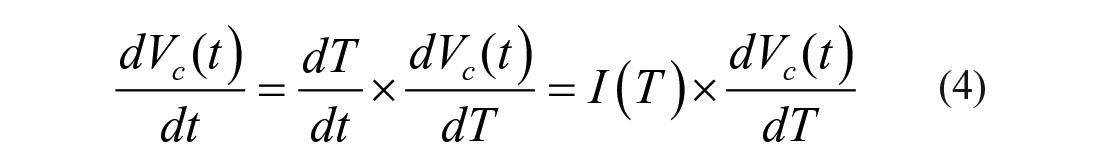
where I(T) is the temperature changing rate (K/min).
The coupled transmembrane mass transfer model under dynamic temperature for the nonpermeating solute-only situation can be obtained by combining the mass transfer model for constant temperature (eq 1), the relationship between Lp and temperature (eq 3), and the time domain to temperature domain transformation equation (eq 4):
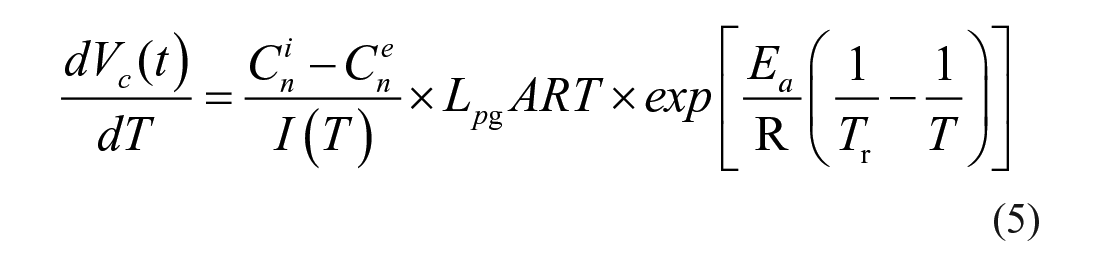
For cells collected from humans, experiments for cryobiology study are often conducted under 37 °C. Therefore, the relevant temperature range should be set within 0 to 37 °C in this study.
From eq 5 it can be seen that the osmolarity difference and temperature changing rate may influence the cell volume changing behavior cell specifically. With the aid of simulation software, researchers can achieve parameter fitting, obtain the Lpg and Ea values that best fit the experimental data, and find the one and only solution of the differential equation in many different conditions with the parameter fitting result values.
Microfluidic Single-Cell Observation System with Dynamic Temperature Control
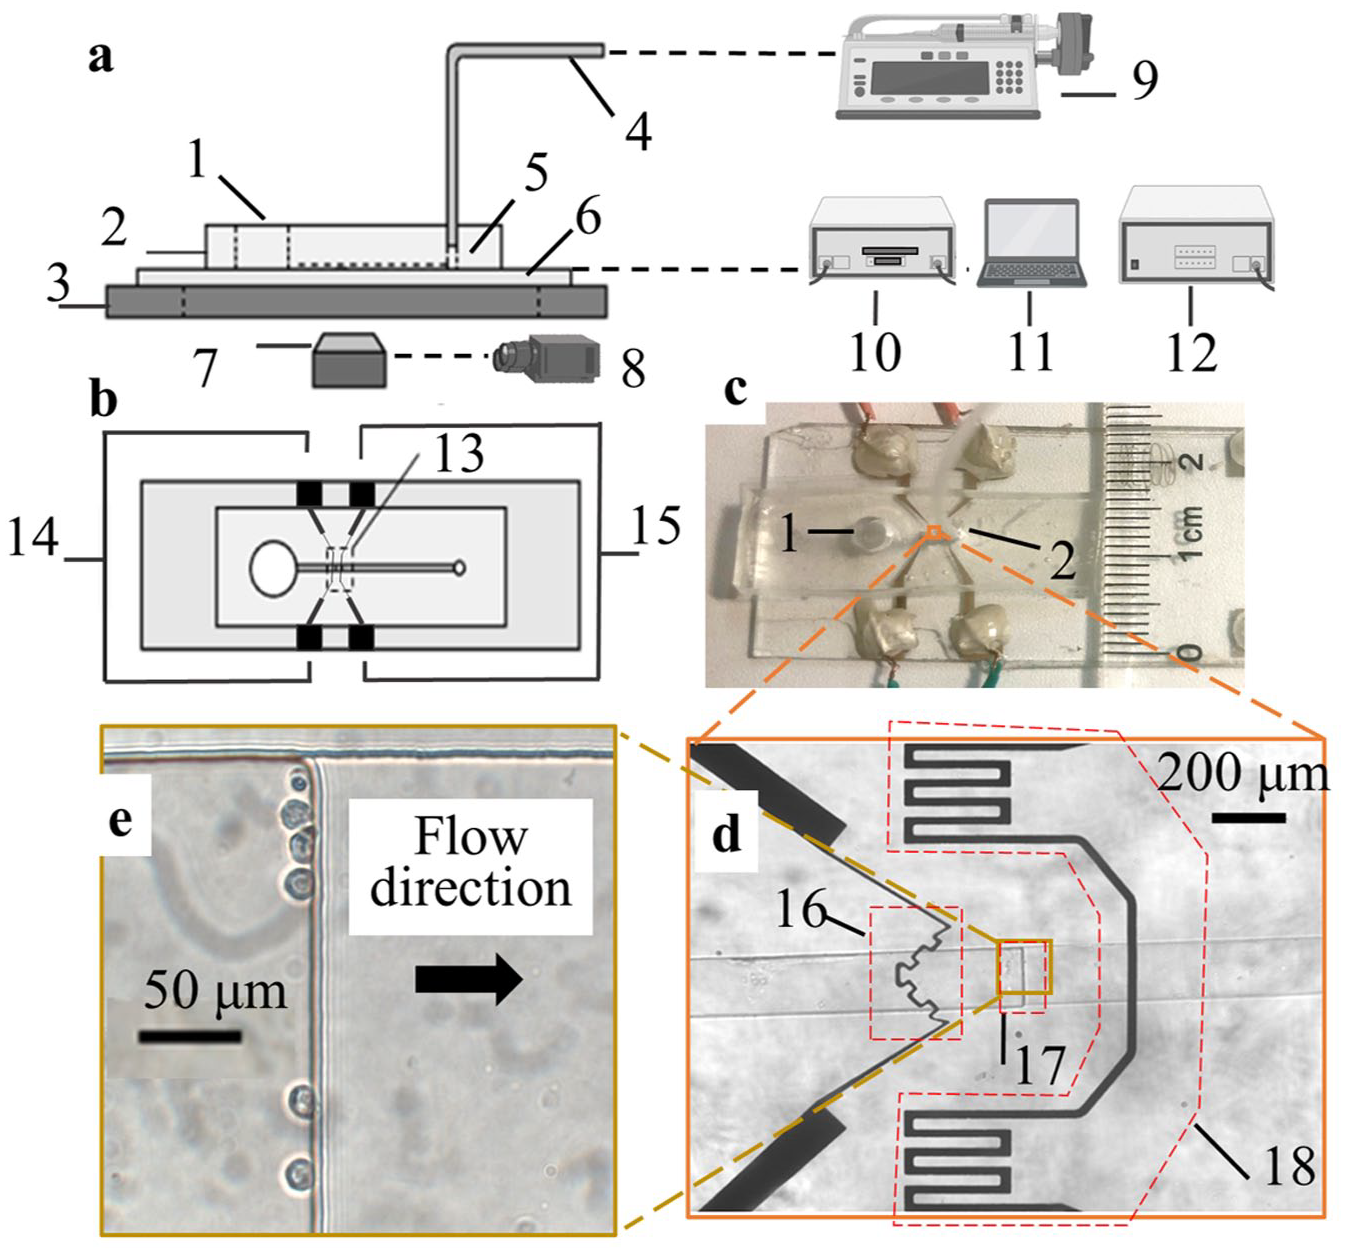
A microfluidic system that can realize single-cell trapping, solution switching, and on-chip temperature control functions is built up with a polydimethylsiloxane (PDMS; Sylgard 184; Dow Corning Corporate, Auburn, MI)-based microfluidic chip, a high-precision DC power supply (cat. 9124; B&K Precision, Yorba Linda, CA), a high-precision digital multimeter (cat. 2700 with cat. 7703 switch module; Keithley, Tektronix, Beaverton, OR), a microcontroller (USB 6009; National Instruments, Austin, TX), a power transistor (MOSFET), a precisely controlled microflow syringe pump (neMESYS; Cetoni GmbH, Korbussen, Germany), a microscope (Eclipse Te2000-s; Nikon, Chiyoda, Japan) with a high-speed camera (cat. V310; Phantom vision research, Wayne, NJ), and LabVIEW software (NI LabVIEW; National Instruments).
Figure 2
shows the components and overall structures of the system (
(
The microfluidic chip is made by bonding a PDMS piece (
The microflow syringe pump (
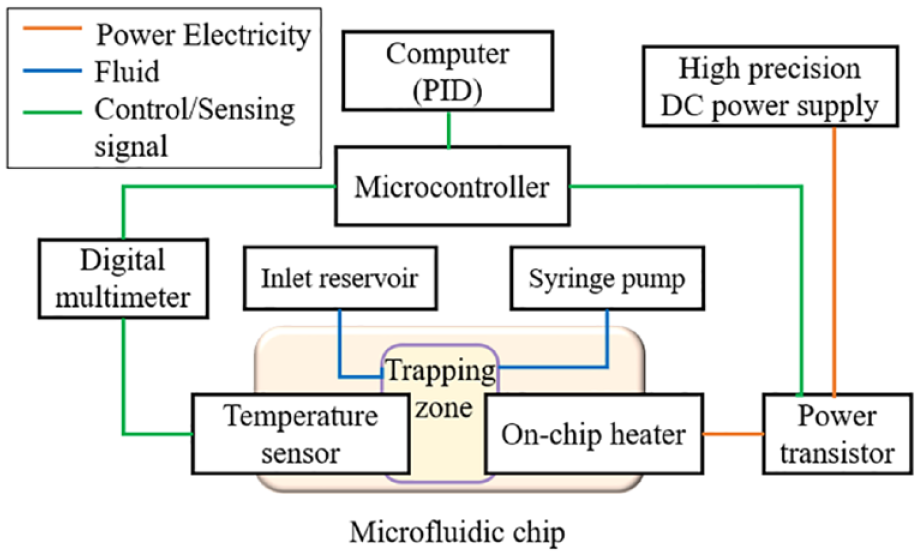
Schematic of the microfluidic control system.
Results and Discussion
Experimental Verification Results of the On-Chip Temperature Control System
The resistance of the gold on-chip microsensor changes along with the temperature change. Therefore, the microsensor can be used as a temperature indicator by monitoring its resistance change, and each temperature corresponds to a resistance value that can be read out by a multimeter. Before sealing with a microfluidic chip, the relationship between resistance and local temperature needs to be calibrated. The resistance change of the microsensor is recorded under dynamic temperatures during calibration, and simultaneously, the local temperature at the same site is measured with a thermocouple. Since the relationship between the resistance of gold and the local temperature can be considered as linear within the temperature range in this research, the temperature–resistance relationship of the on-chip micro temperature sensor can be described using a linear equation obtained by linear fitting with calibration results. The resistance–temperature relationship of the microfluidic chip, which is used to conduct the following tests, can be described as

for calibration conducted under a temperature range of 22 to 50 °C, where T is the local temperature (K) and Rsensor is the resistance (Ω) of the micro on-chip sensor read by the multimeter. From our previous simulation and test results,14,17 heating of the solution from room temperature to 37 °C can be reached within 20 s, and the temperature variation in the microchannel at the trapping zone is less than 0.1 (°C· volume change to temperature [left] and cell volume change to time with step size of 3 K [right]), while the environment is heated (
Proportional integral derivative (PID) control together with the microsensor is used to realize controlled on-chip heating (active), cooling (passive), and local temperature sensing. Several different heating tests are successfully conducted, including heating in steep change14,17 and in ramp-up change by regulating PID control parameters. The PID settings for ramp-up heating require a relatively slow and steady response, while normally in the step change heating the response is fast at the beginning and flat in the end. The slow and steady performance can be achieved by setting the target temperature a little bit higher than the real target with a smaller-proportion coefficient to slow down the heating rate at the beginning stage, and terminating the observation when the temperature approaches the real target temperature to avoid a flat ending stage. The actual gradual temperature changing processes are analyzed and their time–temperature relationships are given as separate data pairs in Figure 4 . The set temperatures for tests A, B, and C are 320, 310, and 320 K. In some circumstances with moderate accuracy demand, the dynamic temperature changing processes using properly selected PID parameters can be approximated into processes of constant temperature changing rates, which can achieve parameter fitting of Lpg and Ea directly. For some other processes, the temperature changing rates are far from constant, as shown in Figure 4 , and in these cases the temperature-dependent mathematical model can be modified by substituting the constant temperature changing rate in eq 5 with dynamic temperature changing rates. Time–temperature curves can be fitted into higher-order polynomial equations, by which the temperature changing rate at any time point can be calculated.
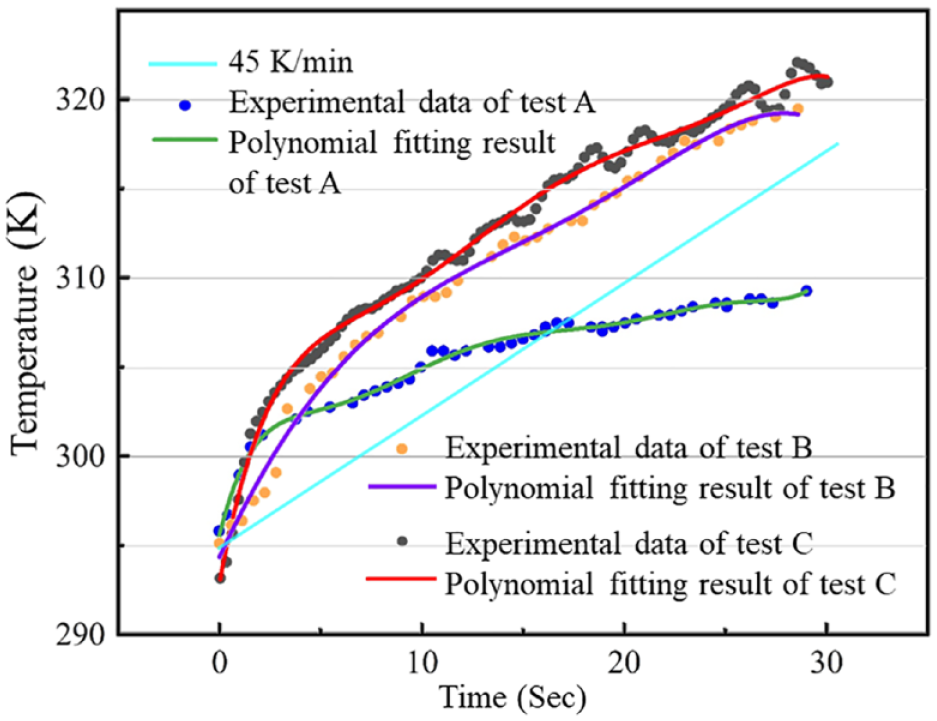
Tested temperature (T) rises with time (t) of the on-chip temperature control system and polynomial fitting results of tests A, B, and C. The polynomial fitting expression for test A is T(t) = 295.38 + 4.72t – 1.35t2 + 0.20t3 – 0.016t4 + 7.104 × 10⁻⁴t5 – 1.58 × 10⁻⁵t6 + 1.41 × 10⁻⁷t7, COD = 0.99427; for test B, T(t) = 294.37 + 2.43t – 0.11t2 – 1.94 × 10⁻⁵t3 + 1.91 × 10⁻⁴t4 – 4.21 × 10⁻⁶t5, COD = 0.99515; and for test C, T(t) = 293.08 + 6.15t – 1.13t2 + 0.113t3 – 0.0058t4 + 1.455 × 10⁻⁴t5 – 1.425 × 10⁻⁶t6, COD = 0.99438.
Since both of original volume and temperature data are recorded under the same timescale and the temperature changing process is monotone increasing/decreasing, the one-to-one correspondence between time, temperature, temperature changing rate, and cell volume can be coupled. The correspondeing experimental temperature–volume data can be fitted into eq 5, and the temperature changing rate at any temperature can be found by calling up the corresponding time of the temperature and then looking for the corresponding temperature to the time derivative of the polynomial equation. The experimental data might need to be converted into constant temperature step length data depending on the parameter fitting methods before being fitted. Since the osmotic cell volume change is fast at the beginning stage and then gradually slows down, which is a trend similar to the experimental temperature changing pattern, numerical simulation adopting the higher-order polynomial temperature changing process description could not only employ a more realistic and accurate temperature changing expression but also help to utilize the experimental data more efficiently by providing relatively denser time/temperature–volume data points for the fast-shrinking process at the beginning of CPA exposure.
Utilizing this microfluidic device, Lp above room temperature can be obtained. However, Lpg and Ea at hypothermic and subzero temperatures would be more important for cryopreservation, such as for studying the procedures of CPA addition, cooling, thawing, and CPA removal at hypothermic temperature. Theoretically, Lpg and Ea obtained from above room temperature still stand for processes happen from the freezing point of the extracellular solution to room temperature if the physical property of the cell membrane is kept consistent. However, phase changes and other phenomena that could suddenly change the cell membrane permeabilities might happen at some points. Therefore, observing and investigating cell osmotic behavior under room temperature with active cooling devices is needed. The current microfluidic platform is compatible with on-chip active cooling microchannels that could cool the local temperature to the freezing point, and the updated device will be discussed in our future work.
Numerical Verification and Analysis of the Mass Transfer Model under Dynamic Temperature
The mass transfer model under the dynamic temperature model established in this study is applicable to the study of general cell membrane permeability when cells are exposed to nonpermeating solute-only solutions above freezing point, as long as the cell-specific parameters in the equations, such as initial cell volume and osmotic inactive volume, are changed. The Jurkat cell is chosen as the numerical simulation subject in this study. Parameters obtained from previous constant temperature experiments for the same cell can be used as reference settings to make the simulations more reasonable and practical. From previous work, the morphology of Jurkat cells is assumed to be highly spherical and its isotonic cell volume can be set as 810 μm3, Vb as 49.6% of the isotonic cell volume, 35 Lpg as 0.370 μm/atm/min, Ea as 7.075 kcal/mol 17 , and Tr as 295.15 K (room temperature, 22 °C), and the extracellular environment of the cell is set to be switched immediately from an isotonic to a hypertonic nonpermeating salt-only solution (300 mOsm/L to 375 mOsm/L, 600 mOsm/L and 900 mOsm/L). With the aid of Wolfram Mathematica (Wolfram Research, Champaign, IL), the mathematical solutions of the cell volume changing process under dynamic temperature based on eq 5, with constant temperature changing rates of 1, 5, 10, 20, 30, 45, 60, and 90 K/min from 295.15 K (22 °C) to 310.15 K (37 °C), are calculated and shown in Figure 5 .
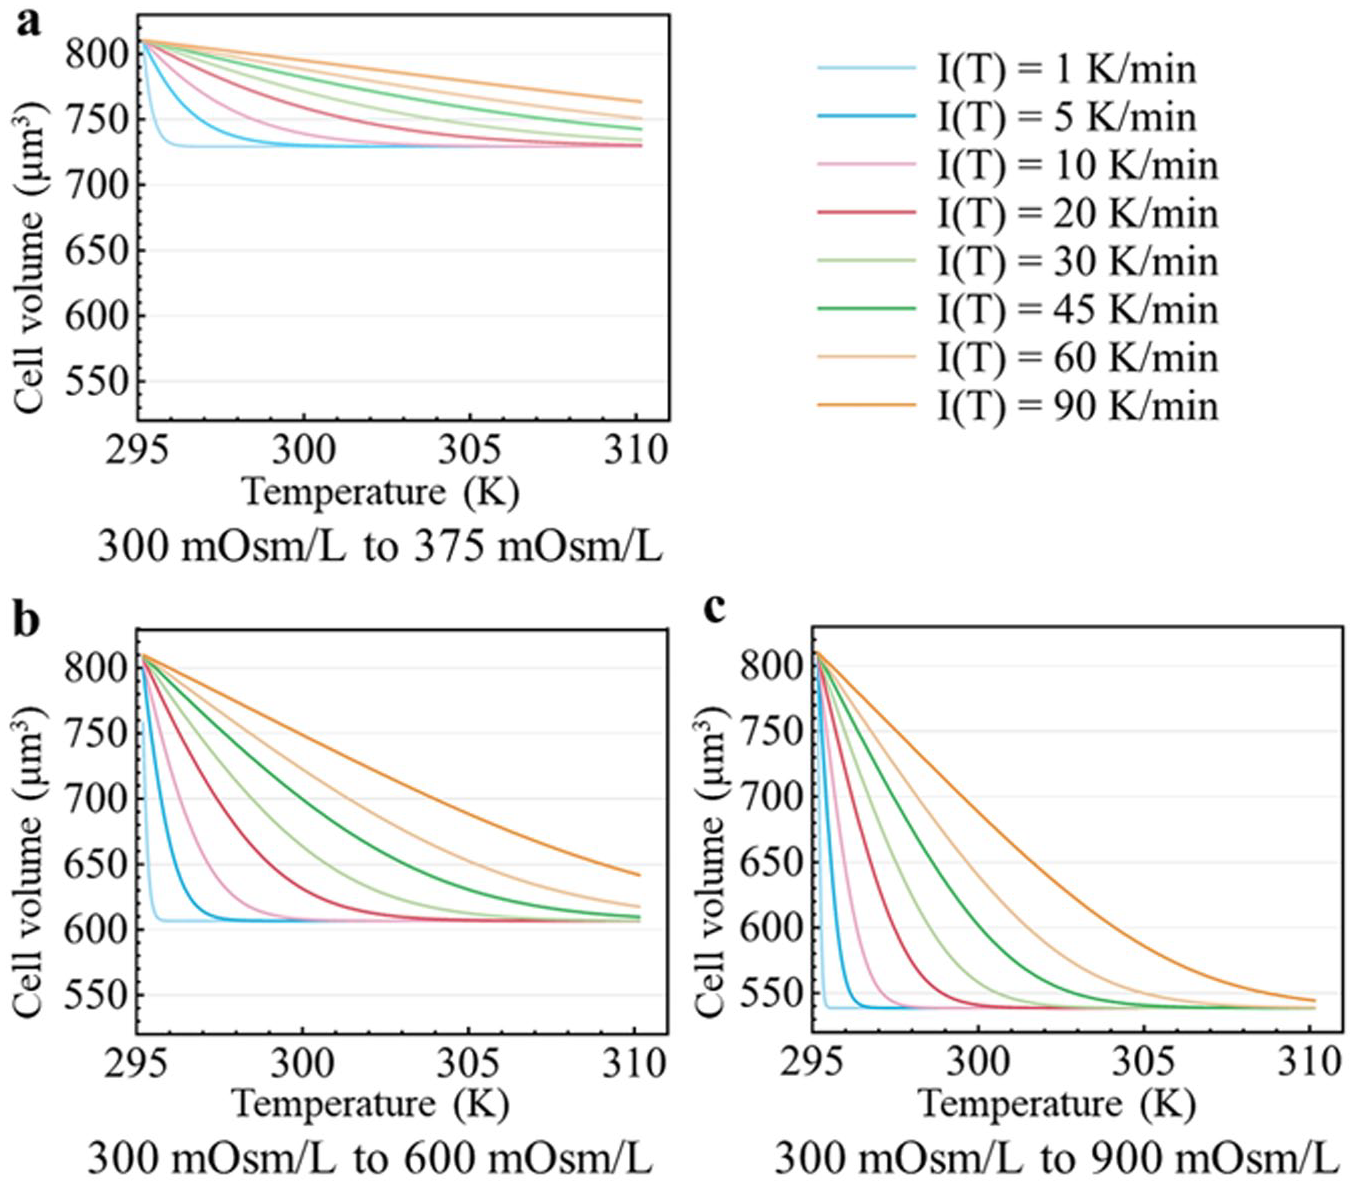
Simulation results of temperature-dependent Jurkat cell volume change for cells changing from an isotonic (300 mOsm/L) to hypertonic ([
From Figure 5 , the molarity increase of the hypertonic extracellular solutions results in a significant decrease in cell equilibrium volume and an increase in water loss rate due to a higher chemical potential difference across the cell membrane. If the temperature raising rate is too slow, the fast-shrinking stage will end long before the temperature reaches the desired point, and therefore the number of experimental data points on the temperature scale would be insufficient for parameter fitting. If the temperature raising rate is too fast, the heating process will finish before the cell volume reaches its equilibrium and the data points on the volume scale may not be sufficient for a reliable parameter fitting. The molarity choice of the hypertonic solution is also crucial. Tiny osmolarity changes will cause an undistinguishable result of volume change, which is 19.9% of osmotic active volume in the 300 mOsm/L to 375 mOsm/L case compared with 66.6% in the 300 mOsm/L to 900 mOsm/L case. A higher temperature changing rate is suggested for a larger osmolarity change. Larger osmolarity changes also resulted in a smaller equilibrium cell volume (severe cell dehydration) and faster shrinking speed, both of which might lead to cell damage and cell membrane inconsistency.22,36 About 10% of the intracellular water remaining inside the cells is suggested to prevent cell from fetal shrinkage, and the maximum target osmolarity for Jurkat cells at above zero temperature should be 3 Osm/L from calculation.2,37 Those simulation results are instructive for choosing experimental conditions in future parameter determination experiments and other studies. For example, from the above simulation results generated with a constant temperature changing rate, the recommended conditions for Jurkat cell Lpg and Ea determination tests between 295.15 and 310.15 K are osmolarity changes from 300 mOsm/L to 600 mOsm/L at a heating rate of 45 K/min, or from 300 mOsm/L to 900 mOsm/L at heating rates of 60 and 90 K/min. Exposure from 300 mOsm/L to 375 mOsm/L is not recommended because of the limited volume change range.
Choosing an optimized temperature changing rate should be a decision considering both the simulation results and the device performance. More information will be given when the temperature changing rate is faster, which requires a higher sampling rate to collect cell volume change data. To ensure these accuracy requirements, a high-speed camera and high-precision digital multimeter are used in this microfluidic system. All the processes from the simulation results show that the water loss process is fast at first and then slows down. Controlling the microheater to provide a fast temperature changing rate at first and then a slower rate in the parameter determination experiments not only suits the temperature characteristic of the microheater better but also may result in more efficient data utilization and data analysis.
Substituting a temperature profile of higher-order polynomial fitting results and their temperature changing rates into eq 5 with the same settings, a cell volume change to dynamic temperature, as well as a cell volume change to corresponding time, can be obtained. Figure 6 shows the simulation results obtained by using the temperature profiles of tests A, B, and C together with the result using 45 K/min as a reference when osmolarity changes from 300 mOsm/L to 600 mOsm/L. The left subfigure is the simulated temperature to volume results. Simulated cells in all four tests reach their equilibrium volume at the end of the heating processes. The right subfigure in Figure 6 shows the corresponding data points of every 3 K presented in a time to volume scale. Data points obtained in 45 K/min are uniform in timescale during the entire process but sparse in volume scale during the fast-shrinking stage. In timescale, data points generated with temperature profiles of tests A, B, and C are all intensive at first and then become sparser. In volume scale, result data points of test A are intensive at first and then become sparser, result data points of test B distribute comparatively uniformly along the entire volume scale, and result data points of test C are intensive at both ends and sparse in the middle part. Among the four simulated cell osmotic behaviors in dynamic temperature, the one using temperature profile B has a more uniform distribution in volume scale, which represents a better utilization of data points compared with the modeling results of other temperature changing patterns. This numerical model could help researchers predict cell osmotic behaviors above the freezing point during the dynamic temperature changing process in cryopreservation.
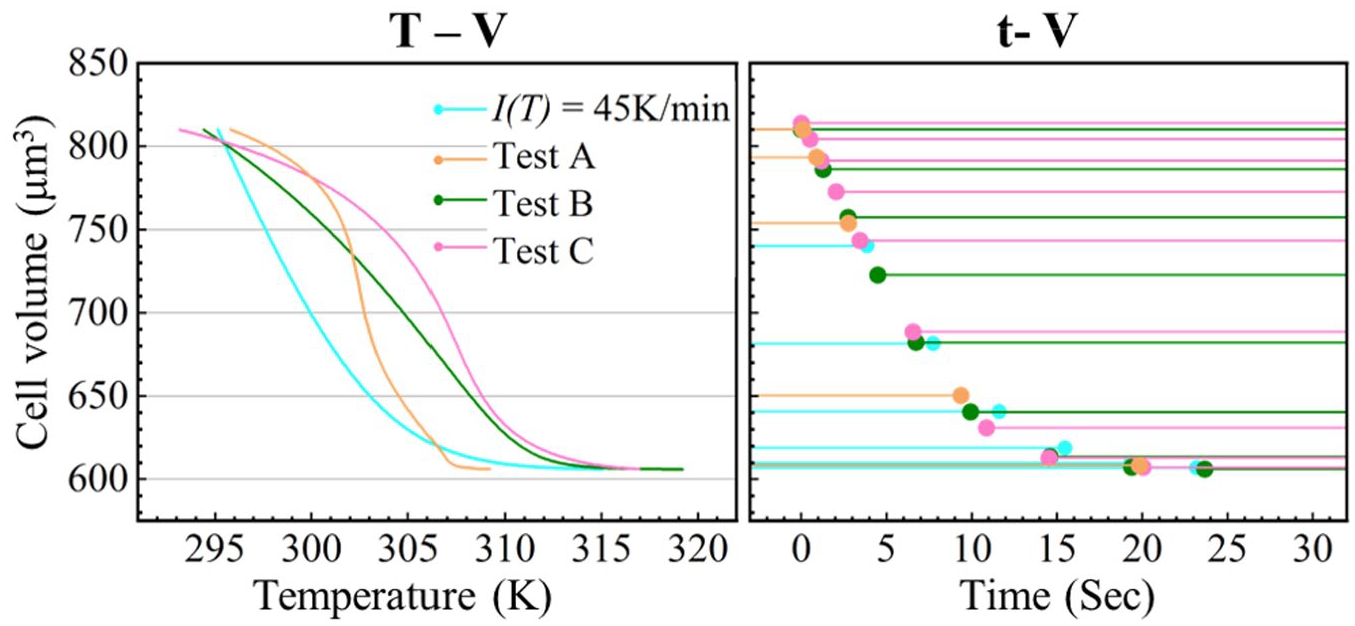
Simulation results of cell volume changes to temperature (left) and time (right) with a step size of 3 K while the environment is heated in (
Model Verification of Parameter Fitting
In order to prove that the coupled transmembrane mass transfer model under dynamic temperatures for the nonpermeating solute-only situation can find reliable Lpg and Ea values from the observed results, dummy test data are generated by adding random noise to the simulated theoretical results of cell volume change. A nonlinear mathematical model where Lpg and Ea are unknown parameters that need to be found by fitting the model to the dummy data is built in Wolfram Mathematica. Theoretical data for parameter fitting verification are obtained in a 0.1 K step length with a 300 mOsm/L to 600 mOsm/L osmolarity change. Four groups of data are generated with the 45 K/min warming rate and the other three experimentally obtained temperature profiles, respectively. Random noise in a normal distribution (~N [0, 0.0136]) is added on to the normalized cell volume theoretical data to generate dummy data in consideration of mimicking errors that may happen during image collection and data processing. It also makes the data a more challenging test for parameter fitting. The value of the noise distribution is an average of error distributions collected from our previous tests (n = 6) conducted at room temperature. It should be noted that this manually added noise only describes the value distribution of all the errors; actual noise may distribute less randomly along a temperature/time scale. A pair of positive Lpg and Ea values that best fits the test data is obtained by using the “NMinimize” fit method in Wolfram Mathematica, which searches for the global minimum residual. Compared with parameter fitting using dynamic heating rates, parameter fitting with a constant temperature changing rate is a few seconds faster.
The theoretical result, test data, and simulation result using the best-fit Lpg and Ea are shown in Figure 7 . The theoretical and simulation results only have a tiny distinction as they basically overlap during the entire process. The preset values of Lpg and Ea are 0.370 μm/atm/min and 7.075 kcal/mol. After parameter fitting with the generated test data, the best-fit Lpg and Ea are 0.379 μm/atm/min and 6.688 kcal/mol with 0.006 μm/atm/min and 0.136 kcal/mol standard error, respectively, for the 45 K/min test; 0.382 μm/atm/min and 6.673 kcal/mol with 0.027 μm/atm/min and 1.989 kcal/mol standard error for the profile A test; 0.369 μm/atm/min and 7.426 kcal/mol with 0.011 μm/atm/min and 0.720 kcal/mol standard error for the profile B test; and 0.366 μm/atm/min and 7.03255 kcal/mol with 0.014 μm/atm/min and 0.795 kcal/mol standard error for the profile C test. All adjacent preset values prove that the model is reliable in parameter fitting with dynamic temperature changing profiles.
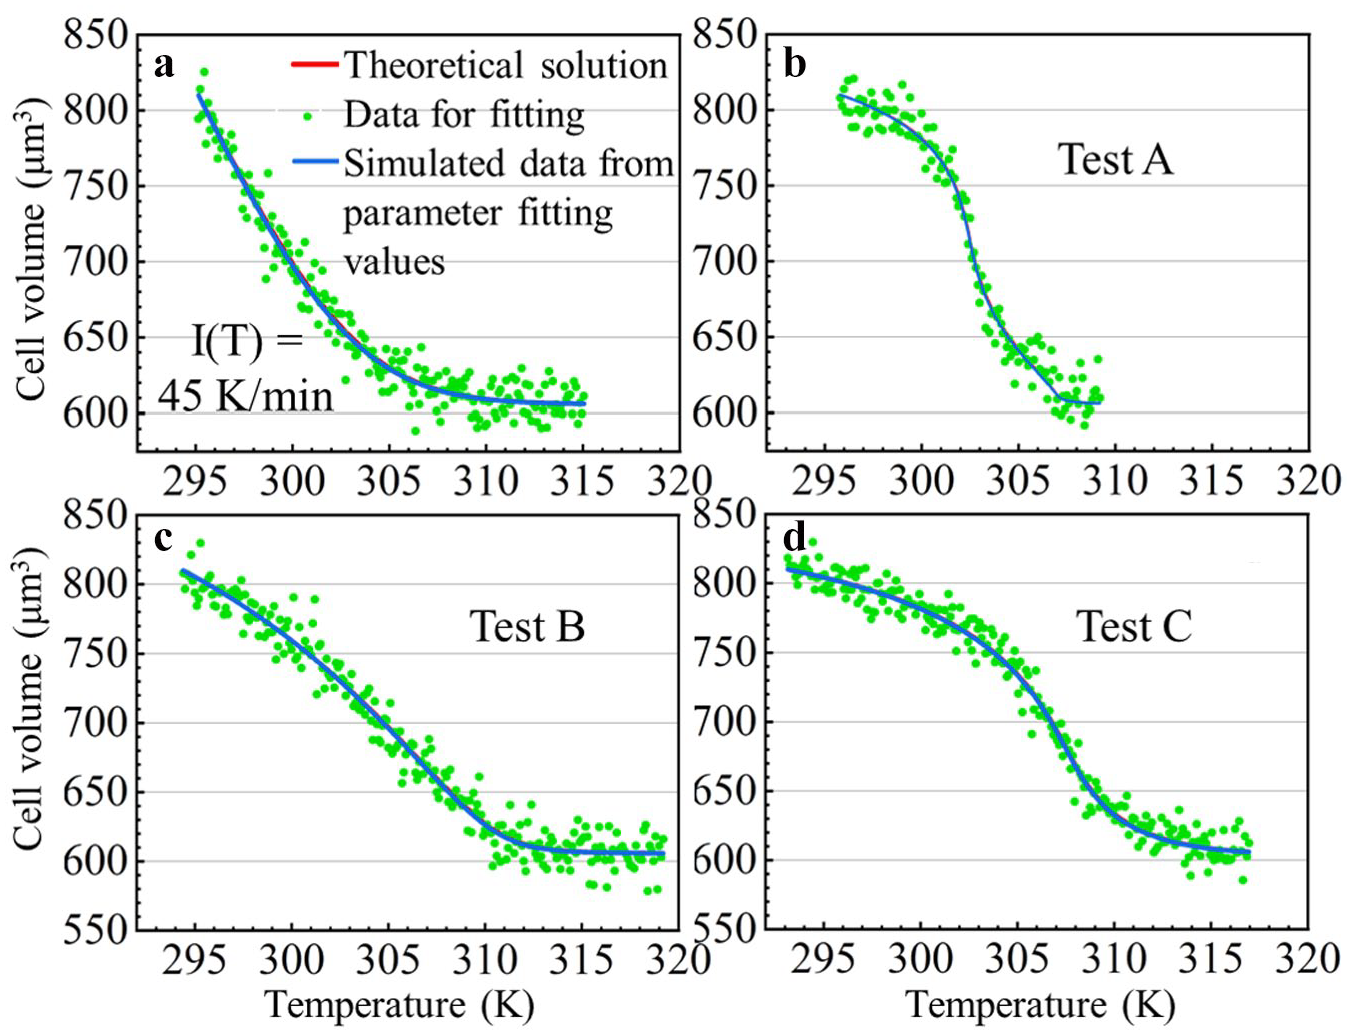
Theoretical result, test data, and simulation results of cell osmotic volume change using the best-fit Lpg and Ea while the environment is heated (
Conclusions
In this study, a coupled transmembrane mass transfer model under dynamic temperature for a nonpermeating solute-only situation is established to simplify and improve the time-dependent cell membrane permeabilities (Lpg and Ea) of the determination process. A microfluidic single-cell trapping device with an on-chip temperature control system was built to verify this model. The model’s capability to regulate and monitor the dynamic temperature was also tested. With this model, osmotic behaviors with dynamic temperatures in different circumstances are simulated, and the influence of different temperature changing rates and target osmolarities on Lpg and Ea determination is discussed based on simulation results. To better reflect the actual heating processes happening on the microdevice, the model was modified with dynamic temperature changing rates based on the experimental results obtained from heating tests by establishing a one-to-one relationship between the corresponding time, temperature, temperature changing rate, and cell volume during the heating process. This optimized model was tested and proved to be able to find Lpg and Ea, which can fit the test data with efficiency and credibility. This optimization makes numerical modeling of cell osmotic behavior a theoretical guidance on temperature-dependent cell membrane permeability for water determination and cryopreservation protocol formulation.
Footnotes
Declaration of Conflicting Interests
The authors declared no potential conflicts of interest with respect to the research, authorship, and/or publication of this article.
Funding
The authors disclosed receipt of the following financial support for the research, authorship, and/or publication of this article: This work is supported by China Scholarship Council.