
Abstract
Intra-laboratory turnaround time (TAT) is a key indicator of laboratory performance. Improving TAT is a complex task requiring staff education, equipment acquisition, and adequate TAT monitoring. The aim of the present study was to evaluate the intra-laboratory TAT after laboratory automation implementation (June 2013–June 2014) and to compare it to that in the preautomation period (July 2012–May 2013). Intra-laboratory TAT was evaluated both as the mean TAT registered and the percentage of outlier (OP) exams. The mean TAT was 36, 38, and 34 min during the study periods, respectively. These values respected the goal TAT established at 45 min. The OP, calculated at 45 min as well as at 60 min, decreased from 26 to 21 and from 11 to 5, respectively. From a focused analysis on blood count cell, troponin I, and prothrombin (PT) test, TAT improvement was more evident for tests requiring longer preanalytical process. The follow-up of TAT from June 2013 to June 2014 revealed the reduction of the mean TAT as well as of the OP exams after automation implementation and that automation more strongly affects the test in the preanalytical phase including centrifugation of the sample, such as troponin I and PT.
Introduction
Because intra-laboratory turnaround time (TAT) is a key indicator of clinical laboratory performance, it is included among the most important quality indicators and is constantly measured.1–4 Improving TAT is a complex task requiring staff education, equipment acquisition, and adequate TAT monitoring.
The therapeutic TAT for laboratory assays includes the entire interval from test order to the initiation of a therapeutic intervention based on the test results. 5 The time from order to specimen collection as well as time for transport to the laboratory are difficult to control; thus, laboratories prefer to use intra-laboratory TAT as a quality indicator.
The intra-laboratory TAT includes all of the laboratory activities from the check in by scanning the barcode sample as “received” to the final report accessible to the ward clinicians. 6
Howanitz and Howanitz 4 reported that TAT can be improved by staff education, long-term planning, and even small investments in the laboratory, such as front-end automation that centrifuges, decaps, prepares aliquots, and sorts samples. 4
In a previous study, we reported our experience of intra-laboratory TAT improvement by the introduction in the laboratory of a real-time system for TAT monitoring, the application of step-by-step corrective strategies, and staff awareness encouragement. 7
Holland and others 8 reported their experience with total laboratory automation and TAT improvement; the authors found a strong relationship between TAT outlier percentage and emergency department length of stay and reported that total laboratory automation can effectively improve laboratory performance and contribute to decreased emergency department length of stay.
Recently, the Clinical Biochemistry Laboratory Section at Singapore General Hospital implemented a laboratory automation system and reported a significant decrease of mean TAT for both stat and routine samples. 9
The aim of the present study was to evaluate the intra-laboratory TAT for emergency samples after laboratory automation implementation (June 2013–June 2014) and to compare it to that registered in the preautomation period (July 2012–May 2013).
The expectation of implementing laboratory automation was TAT reduction to improve patient safety and clinician satisfaction.
Materials and Methods
The study was performed at the Laboratory of the University Hospital Campus Bio-Medico of Rome, Italy.
The University Hospital Campus Bio-Medico is a tertiary care 280-bed hospital equipped with an integrated informatics platform (MedArchiver) that manages both patient records and laboratory test orders.
Laboratory data are treated through a software package (MedLis) interfaced with MedArchiver, allowing clinicians real-time consultation of laboratory reports after laboratory staff clinical validation.
Prior to the implementation of laboratory automation, the preanalytical area was equipped with two modular Olympus OLA2500s (Beckman Coulter, Brea, CA), and the laboratory layout included multiple analyzers for urgent sample processing, as previously described. 7 After automation implementation, the laboratory layout was as follows: Flexlab 3.6 automation (Inpeco SA, Lugano, Switzerland), a modular system designed to automate preanalytical, analytical, and postanalytical processes. The system combines multiple analysis tools into a single workstation, allowing the application of common management processes to tubes. The automation software enables staff to manage the workload orders from the hospital information system (laboratory information system; LIS) and monitor the state of operation of the associated analysis tools. This management is achieved through the connections and exchange of data between the appropriate automation tools and LIS. Flexlab 3.6 includes the input module rack, which provides a load point of the tubes, identification of the type of tube, and barcode reading; the input/output module with different functions, such as loading and unloading of the tubes, identification of the type of tube, barcode reading, interaction between operator, automation through a graphical interface, and tracking operations in progress in the tubes; the centrifuge module, which automates the centrifugation of the samples and includes a system for loading and unloading within the centrifugation area; the decapper module, which automates removal of screw caps and pressure caps from the tubes; the aliquot module, which provides the possibility to aliquot and generate secondary tubes from the primary tube; the recapping module, which allows the application of screw caps on the tube containing the secondary aliquots produced by the aliquot module; the sealer module, which allows an automatic heat seal of the tubes with aluminum foil after the analytic process; and the storage module, which stores tubes processed by automation in a temperature-controlled environment. The stored tubes, which can be recalled at the request of a user, are discarded after a default and configurable time. Along the automation Flexlab 3.6, multiple analyzers for sample processing are located as follows: three dimension Vista 1500 (Siemens, Healthcare Diagnostics Inc., Milano, Italy); two ADVIA Centaur XP (Siemens, Healthcare Diagnostics Inc.), and one CS 5100 (Siemens, Healthcare Diagnostics Inc.). Data from the analyzer is managed by Nemo software (Inpeco SA) interfaced with MedLIS. The automation layout has been schematized in Figure 1 .
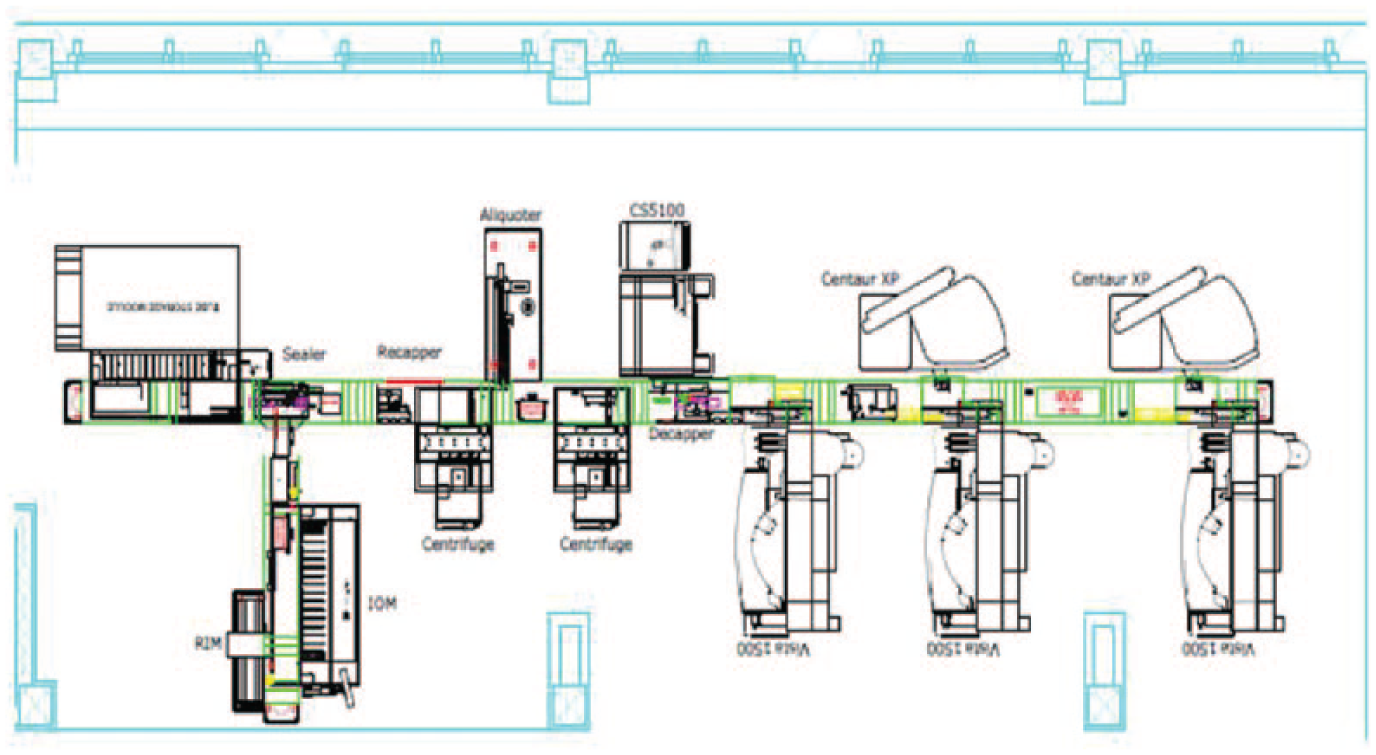
Map of the definitive automation layout (Flexlab 3.6, Inpeco SA) and position of the instruments included along the automation line, at the Laboratory of the University Hospital Campus Bio-Medico of Rome, Italy.
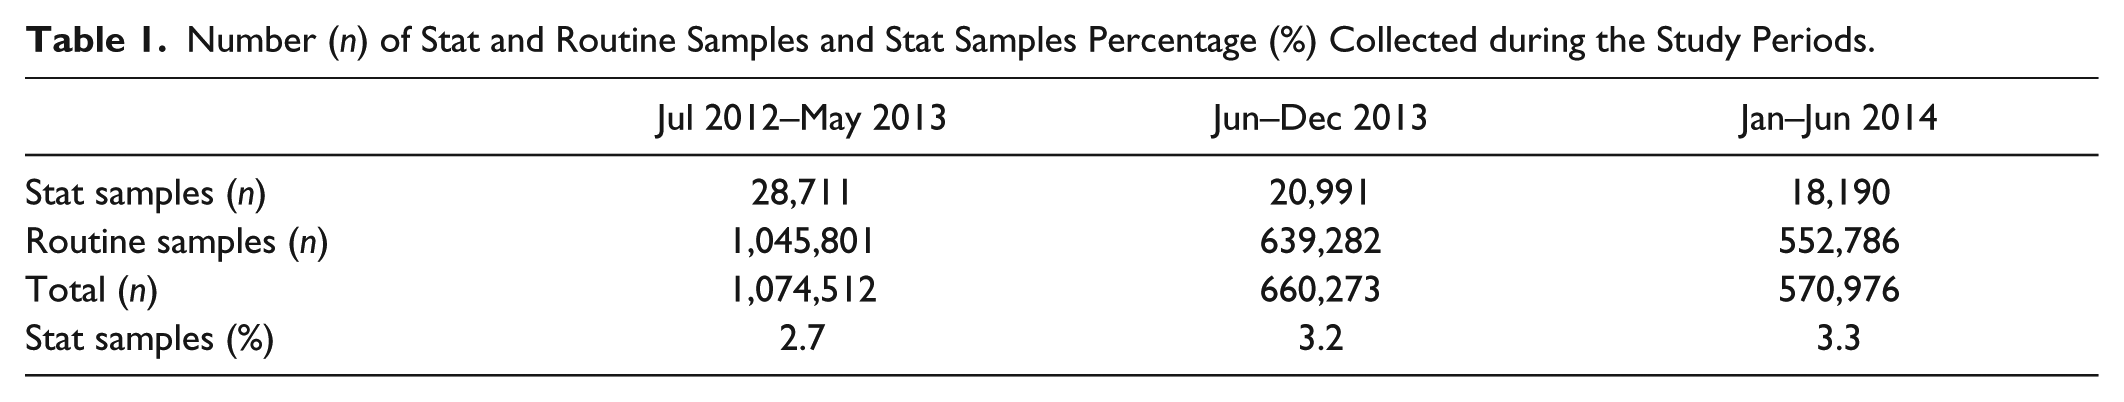
The numbers of stat and routine samples collected during the study periods are reported in Table 1 .
Number (n) of Stat and Routine Samples and Stat Samples Percentage (%) Collected during the Study Periods.
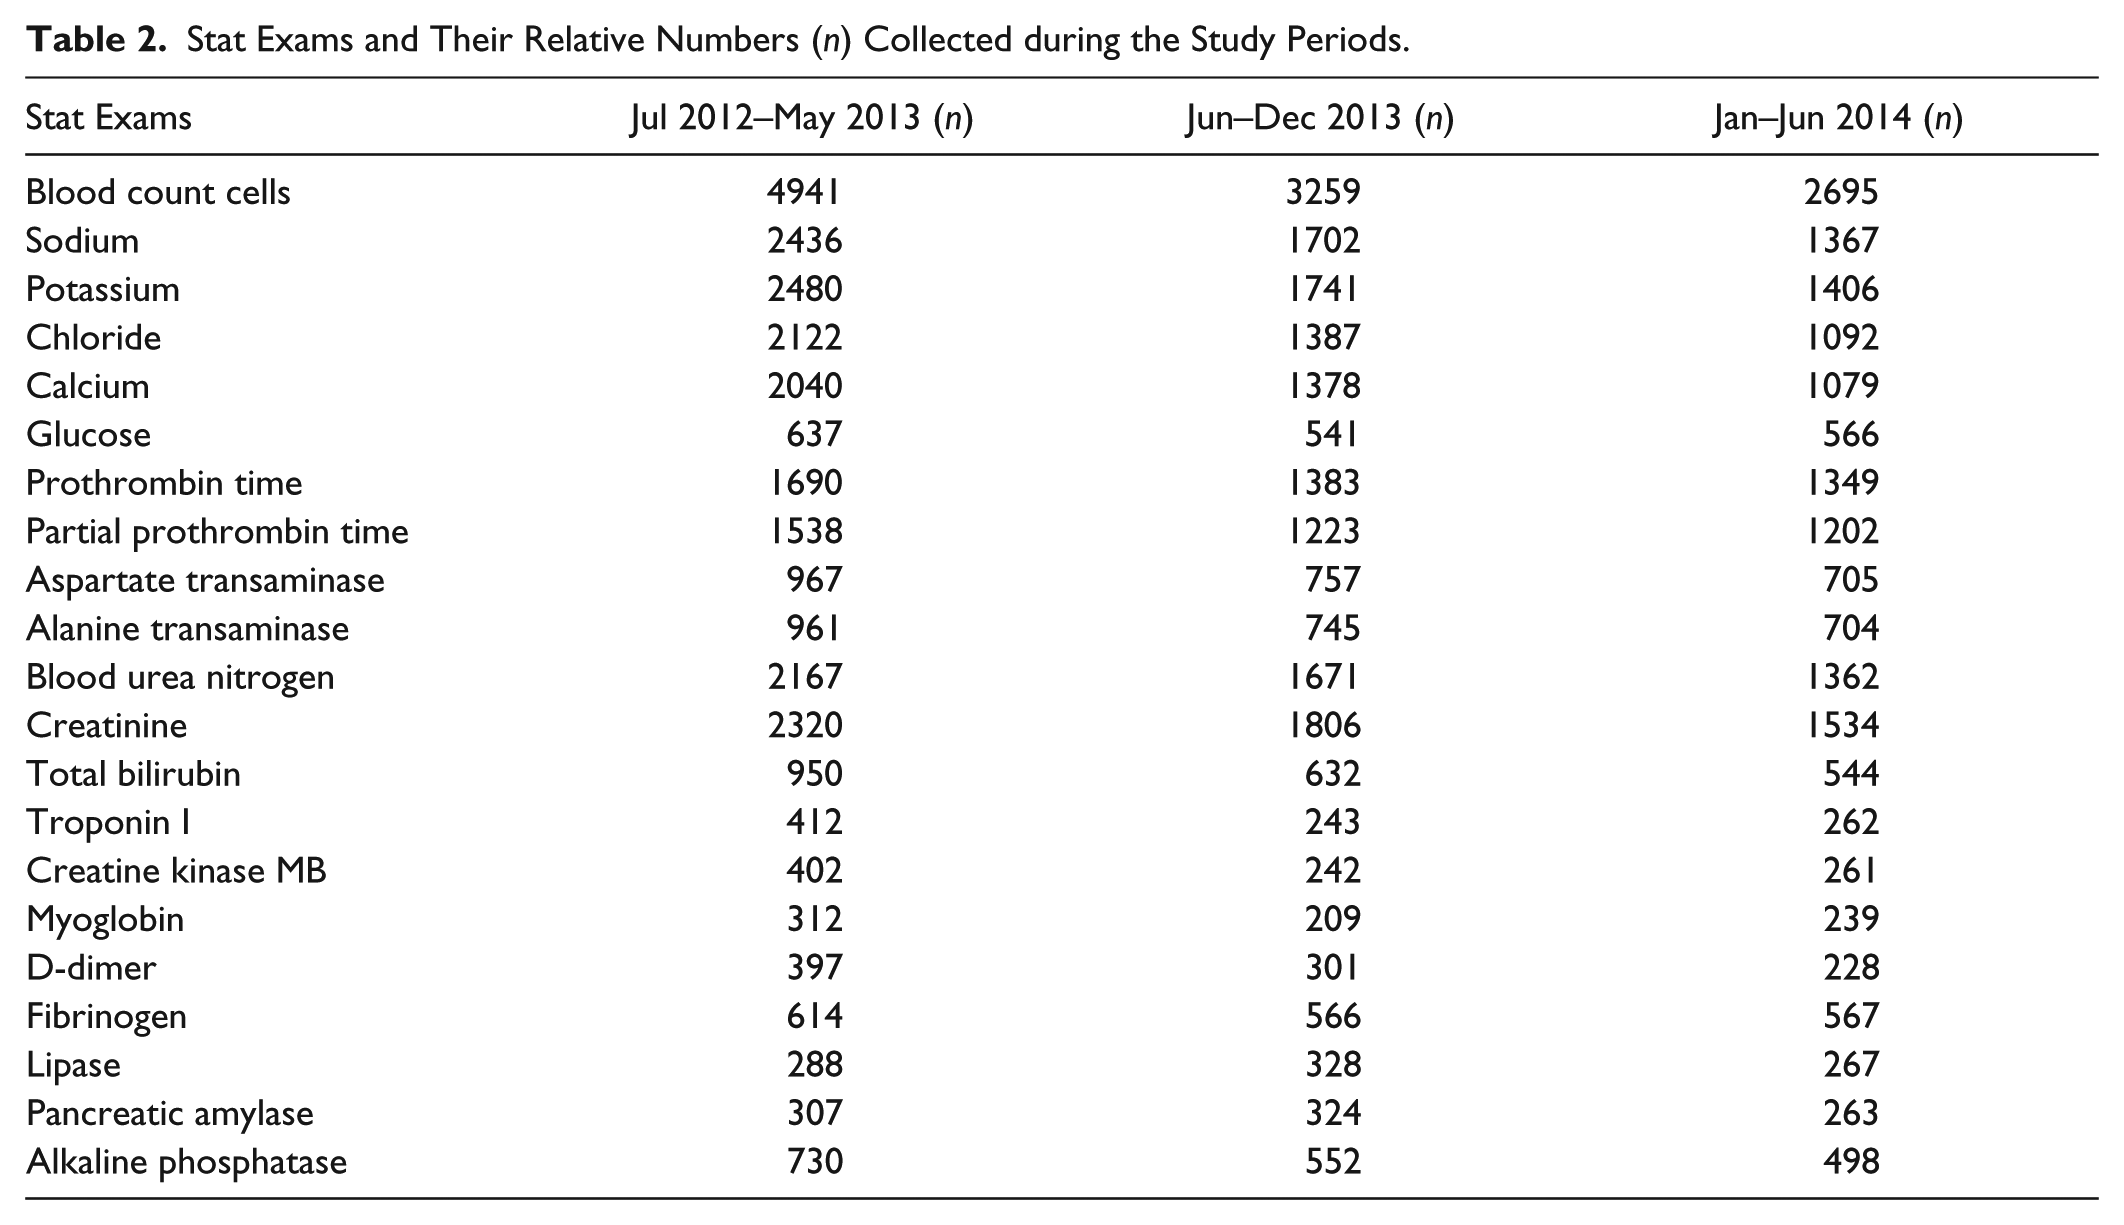
A list of the stat exams and their relative numbers are reported in Table 2 .
Stat Exams and Their Relative Numbers (n) Collected during the Study Periods.
Ward samples delivered to the laboratory are received by technical staff dedicated to the preanalytical phase that, after screening for any preanalytical errors, introduces samples into the automation Flexlab 3.6. The complete automated system recognizes the barcode, checks in the sample, centrifuges when necessary, and sorts samples to the analyzers located along the automation conveyor belt or to the stand-alone hematology analyzer (Sysmex 4100, Dasit, Italy). Along Flexlab, stat samples do not follow a privileged way because they arrive at the instrument for test execution. At this moment, the urgent requests are recognized and analyzed as priority tests.
During analysis, the technical staff can monitor stat samples’ TAT through the aid of a monitor located in the open space of the laboratory, as previously described. 7 After analysis, data are visualized by the technical staff and if adequate are validated and made ready for clinical evaluation by the medical laboratory staff, who produces the final report that can be visualized in real time by ward clinicians.
In the present study, TATs for urgent samples were observed and analyzed for a period of 23 mo (July 2012–June 2014). In June 2013, laboratory automation was implemented. The total laboratory automation was reached in two major steps, which differ in the type of analyzer installed along the Flexlab. To better understand TAT advantages obtained through automation implementation, pre- and postautomation periods were ranged as follows:
July 2012 to May 2013: Preautomation period, during which the laboratory layout was not fully automated and a follow-up of TAT was performed, as previously described 7
June 2013 to December 2013: Postautomation period with coagulation and hematology analyzer still stand alone and automation layout partially achieved
January 2014 to June 2014: Postautomation period with a definitive layout including coagulation analyzer (CS 5100)
During the first phase, the laboratory was equipped by a real-time system for TAT evaluation located in the open space, as previously described. 7 From June 2012 to May 2013, no implementation was decided, but a pure observation and monitoring of TAT was performed. In June 2013, after requesting a proposal for laboratory automation implementation, the project was awarded to Siemens (Siemens, Healthcare Diagnostics Inc), and the automation Flexlab 3.6 was installed.
During the second phase, from June 2013 to December 2013, the coagulometer (ACL-TOP 700; Instrumentation Laboratory, Bedford, MA) and the hematology analyzer (Sysmex 4100; Dasit, Cornaredo, Italy) were still stand alone. In January 2014, the definitive layout of automation was reached through the integration with the CS 5100 coagulometer, and laboratory staff was fully trained. From January to June 2014 a pure observation of TAT, after complete automation layout was reached, was performed to evaluate the global impact of automation implementation on stat samples management and TAT indicator.
The TAT for stat samples was established to be 45 min from the sample check in to the final report production. The TAT was measured consecutively for each urgent sample and data stored in the database for further elaboration.
Intra-laboratory TAT was calculated as the difference between the established TAT at 45 min and the mean TAT observed during the study period. Furthermore, the percentages of stat samples with a final report available within 45 min and 60 min from the check in were calculated to determine the rate of outlier exams with the expectation to obtain urgent exam results within 60 min in 95% of cases and a percentage of outlier (OP) below 5%. 9
The Mann-Whitney test was used to verify whether observed differences in mean TAT during the study periods were statistically significant. Data were analyzed with the MedCalc 13.2.2 statistics package (MedCalc Software, Ostend, Belgium). All probabilities were two-tailed, and p values ≤ 0.05 were regarded as significant.
Results
The mean intra-laboratory TAT of stat exams registered in the preautomation period (July 2012–May 2013) was 36 min, whereas in the postautomation periods, it was 38 min (June 2013–December 2013) and 34 minutes (January–June 2014), respectively, as reported in Table 3 . These values respected the goal TAT established at 45 min. The same trend of decrease was observed when the analysis was extended to the median and to the 90th percentile ( Table 3 ).
Mean Intra-Laboratory Turnaround Time (TAT), 95% Confidence Interval (CI), and Percentage of Outlier (OP) at 45 min and 60 min during the Study Period.
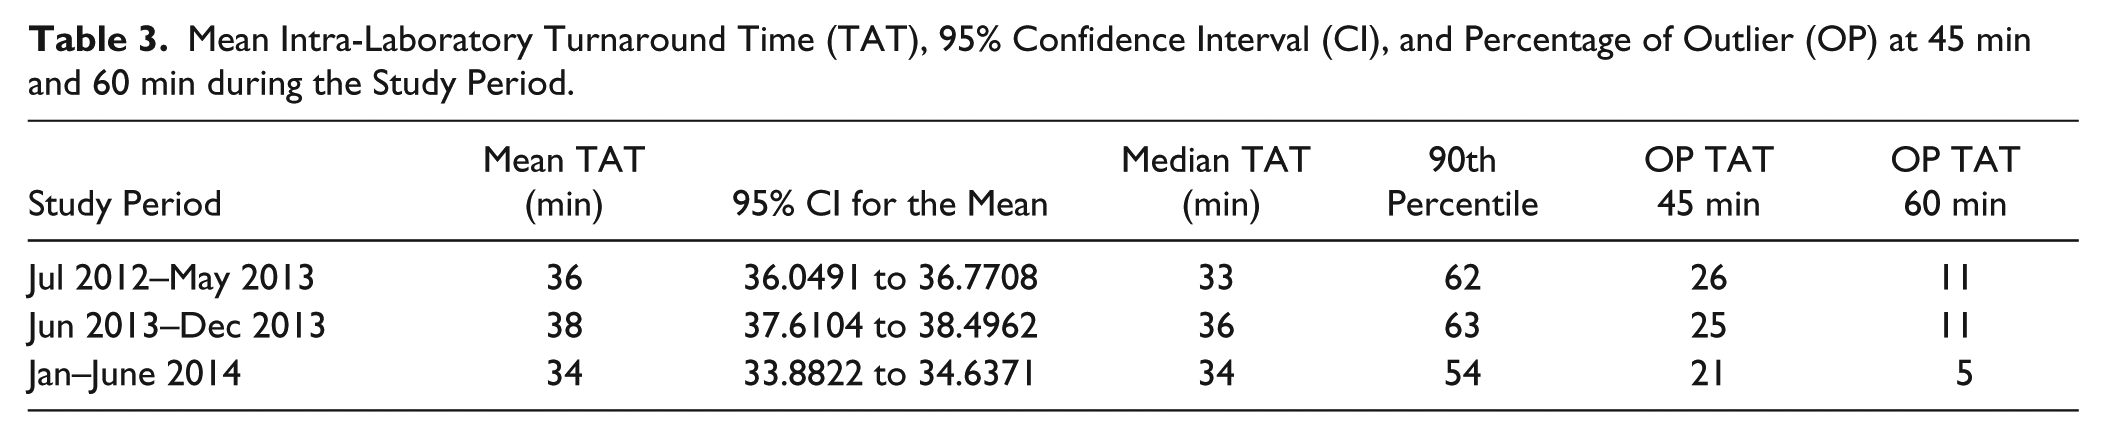
Laboratory automation was implemented from June 2013, and TAT registered after implementation gradually improved. The decrease of the mean TAT was significant (p < 0.0001) when the definitive layout was reached (January–June 2014).
To verify this improvement, the OP, defined as the percentage of exams that did not respect the TAT at 45 and 60 min, was calculated.
As reported in Table 3 , during the study period, the OP of stat exams evaluated for TAT at 45 and 60 min decreased from 26 to 21 and from 11 to 5, respectively.
In Figure 2A , the mean TAT and the OP at 45 min and 60 min registered during the study period is schematized, and the significant decrease obtained for these variables is evident after the automation layout is completed. The trend observed for the OP at 45 min and 60 min registered monthly from the first installation of automation (June 2013) to its definitive layout (June 2014) is schematized in Figure 2B . A gradually decrease is evident.
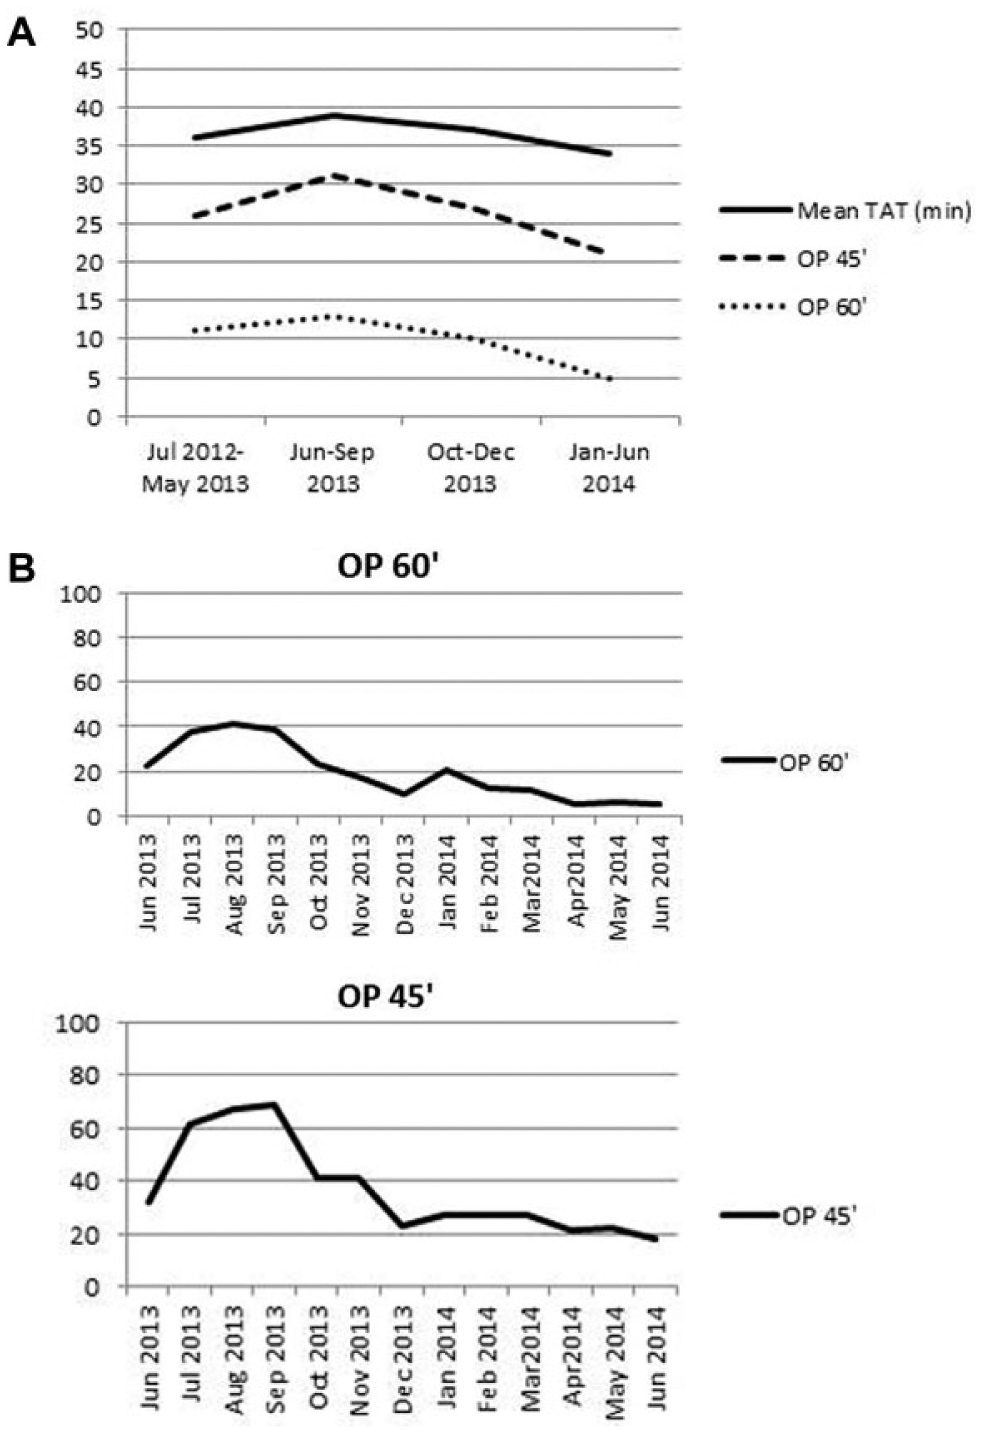
Percentage of outlier (OP) not respecting turnaround time at 45 min and at 60 min during the study period. (
The mean and median TAT and the 90th percentile for six important stat exams (blood cell count, plasmatic potassium, troponin I, prothrombin time [PT], plasmatic creatinine, and plasmatic glucose), used as reference, are reported in Table 4 . The mean intra-laboratory TAT of blood cell count was 24 min in the preautomation period (July 2012–May 2013) and gradually decreased to 23 min in the postautomation period (June 2013–December 2013) and to 21 min after complete layout was reached (January–June 2014; p < 0.0001); the same trend was observed for the other emergency tests, especially for troponin I, which decreased from 48 min to 45 min in 2014, when the automation layout was completed (p < 0.0001).
Mean Intra-Laboratory Turnaround Time (TAT), 95% Confidence Interval (CI), and Outlier Percentage (OP) at 45 min and 60 min for Each Stat Test during the Study Period.
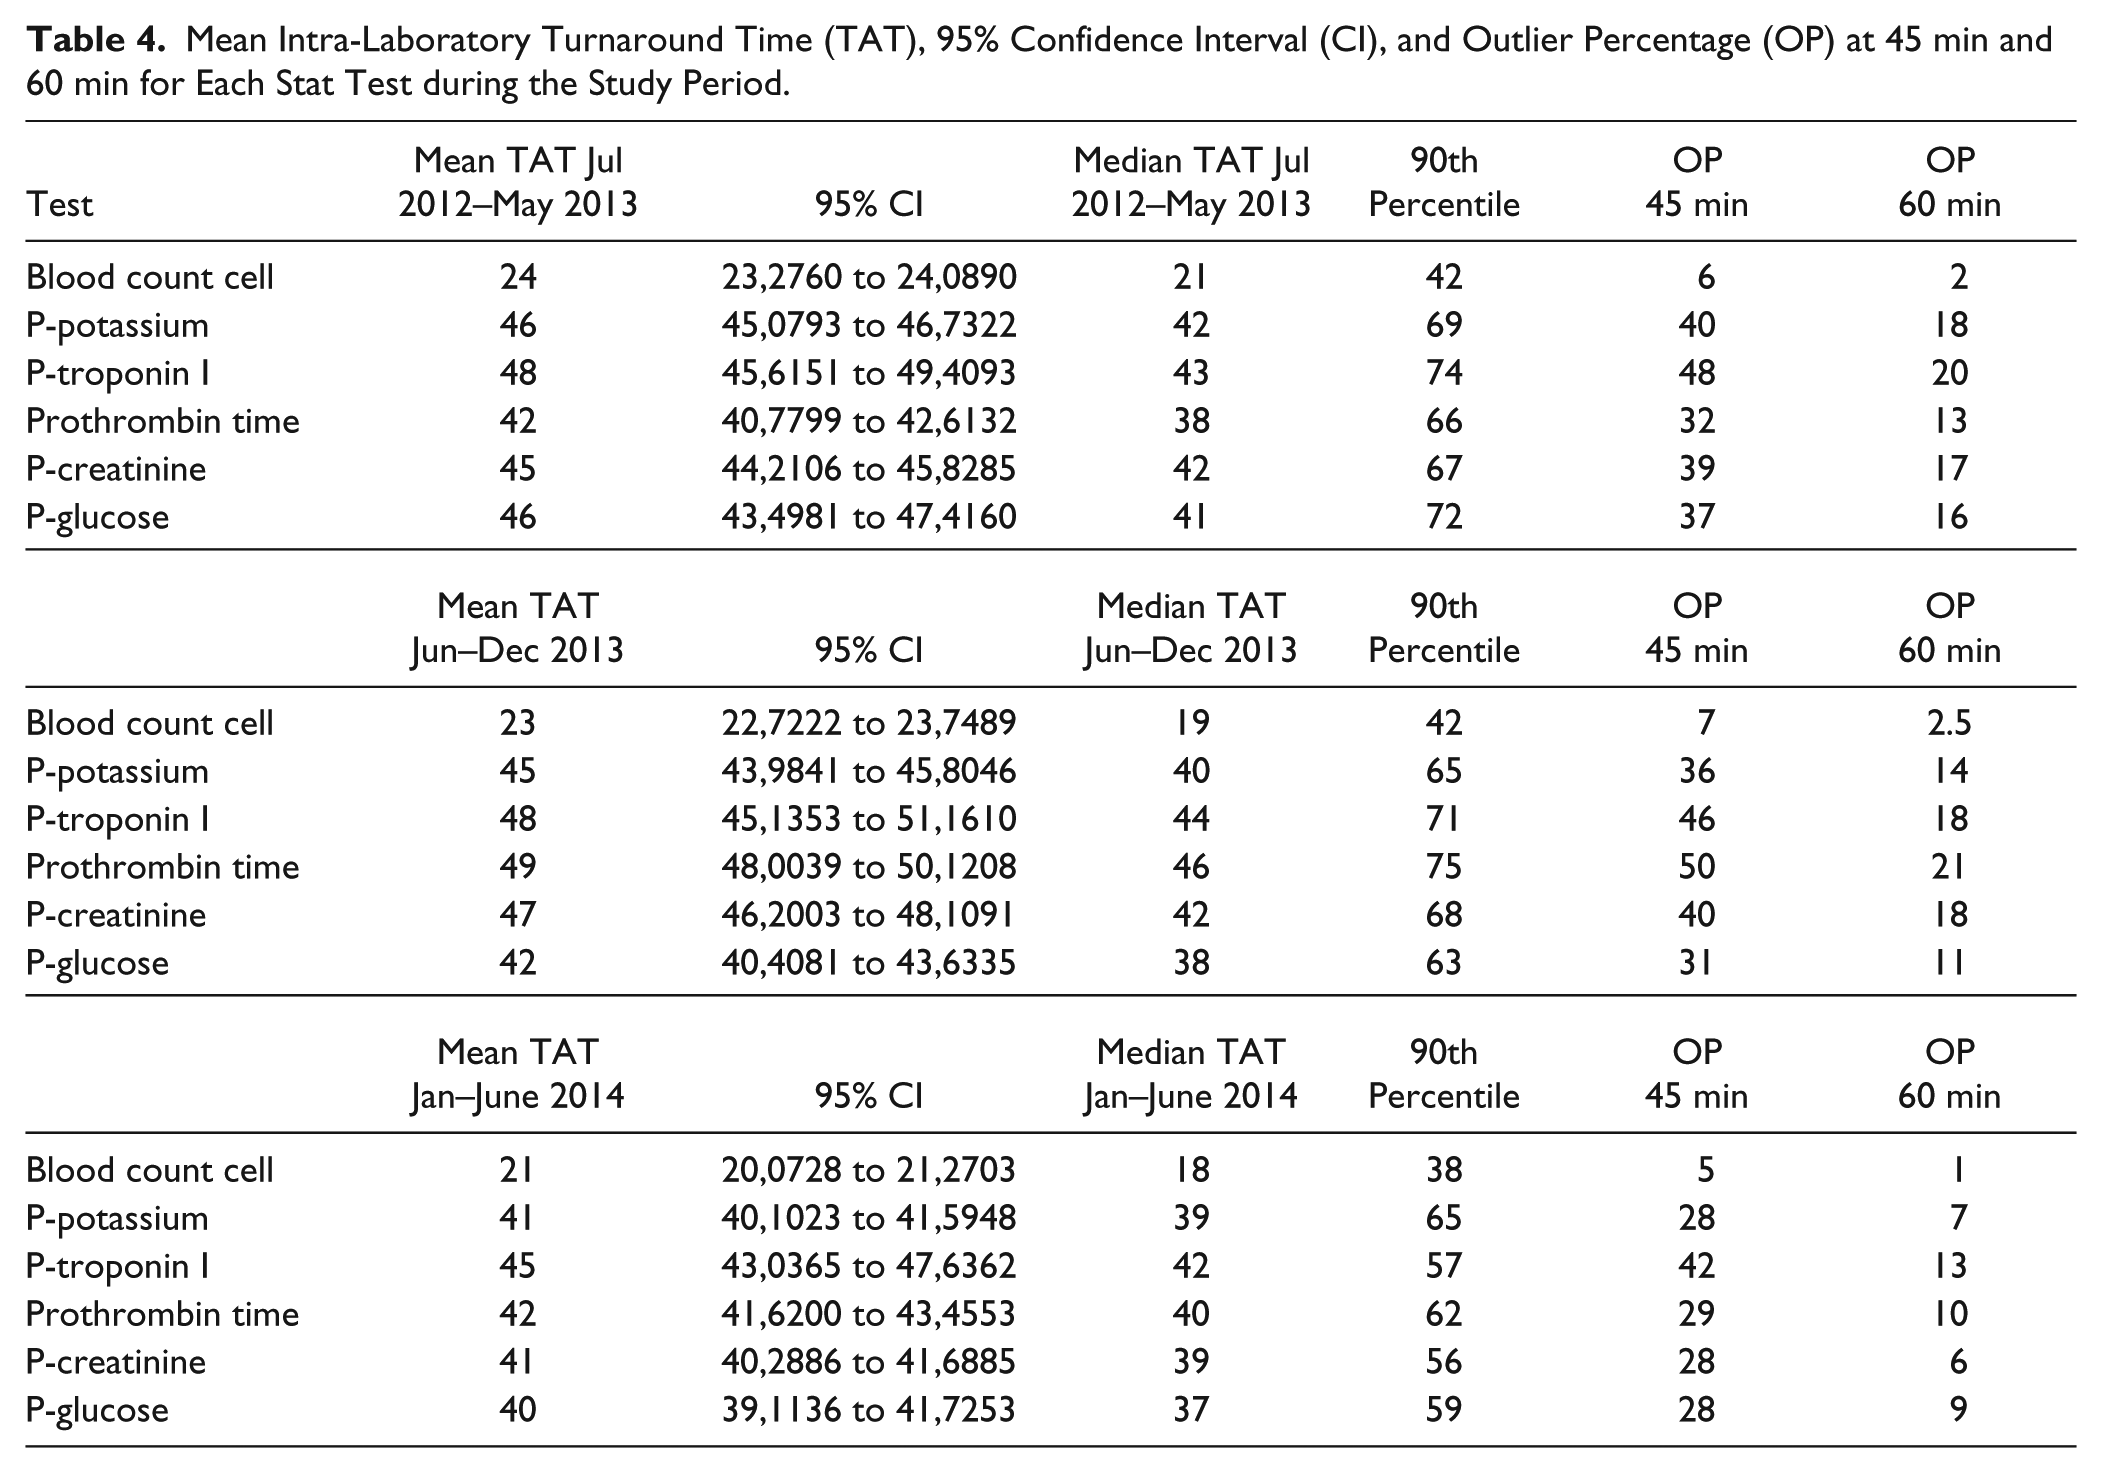
The follow-up of TAT from June 2013 to June 2014 revealed a global reduction of the mean TAT of the median TAT and of the 90th percentile, as well as of the OP not respecting the TAT established (
Tables 3
In Figure 3 , the percentages of stat exams respecting TAT at 45 min and at 60 min have been reported for blood cell count, troponin I, and PT. Data demonstrated that from June 2013 (time of automation implementation), these percentages, after an initial worsening (July–September 2014), began to improve for troponin I, whereas the PT test improved later, in December 2013, when the definitive layout was reached. Blood cell count, performed on a stand-alone hematology analyzer, was not significantly affected by automation implementation.
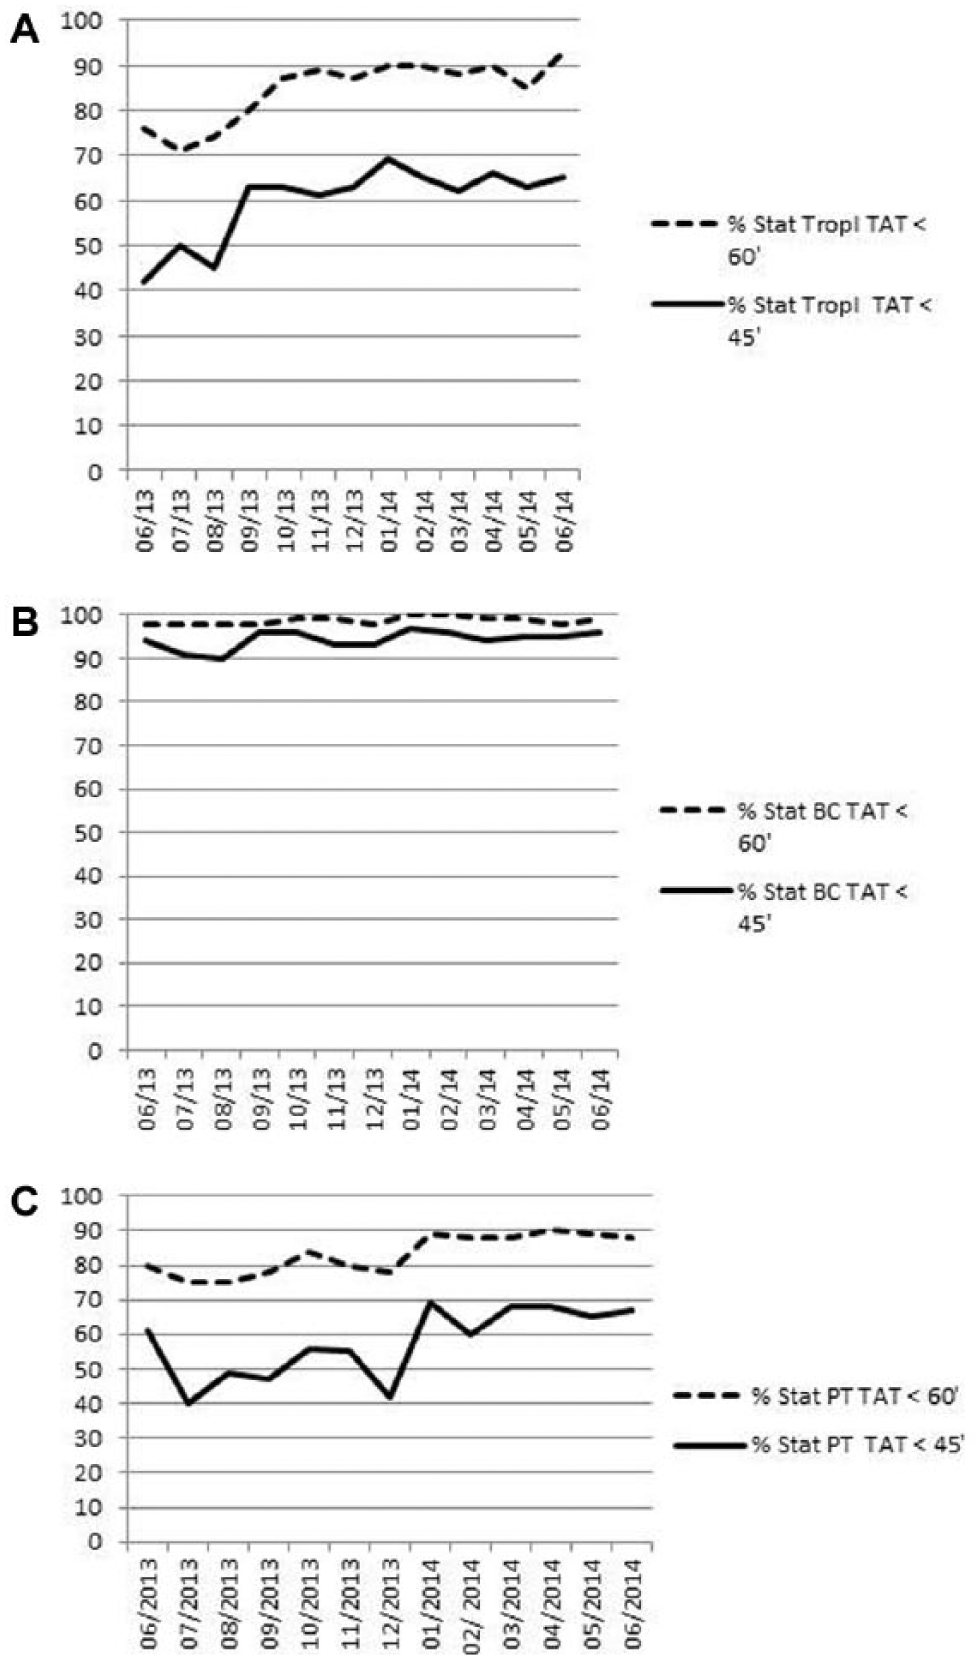
Percentage of stat exams respecting turnaround time at 45 min (solid line) and at 60 min (dashed line) for troponin I (tropI), blood count cell (BC), and prothrombin time (PT) registered monthly after automation introduction from June 2013 to June 2014.
Data demonstrated that the further integration in the automation layout of the coagulometer was useful and that during the period of transition, from June 2013 (automation implementation) to December 2013 (definitive layout), the TAT for PT became worse ( Fig. 3 ). The percentages of stat PT respecting TAT were lower than before automation implementation, and this trend improved only when the coagulometer was included in the automation line ( Table 4 ; Fig. 3 ).
The trend in TAT OP during the two steps of the automation period has been schematized in Figure 4 .
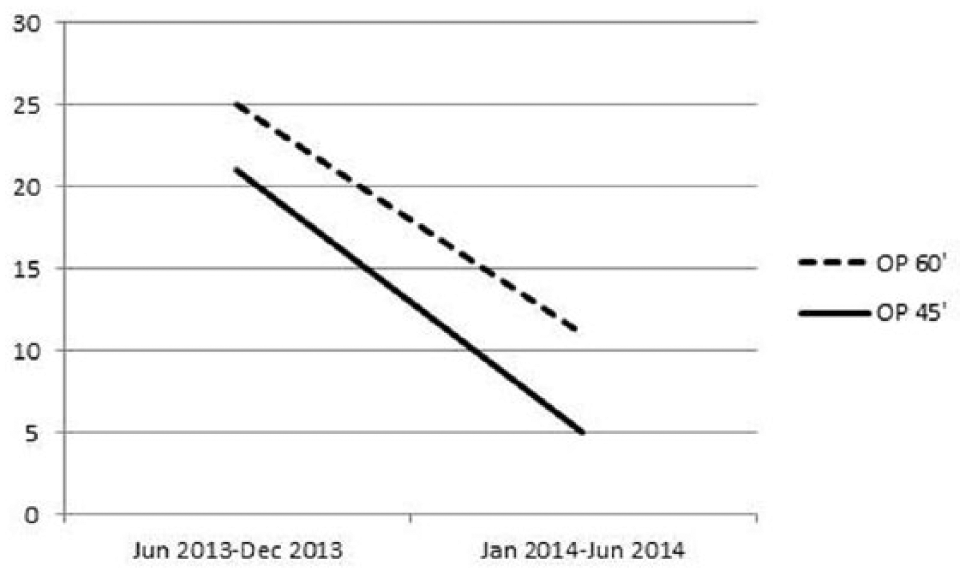
Outlier percentage at 45 min (solid line) and at 60 min (dashed line) registered during the two steps of the automation period (June–December 2013 and January–June 2014).
Discussion
Intra-laboratory TAT is an important indicator of laboratory quality and performance. 10 TAT represents a key factor influencing patient care.8,11–14 The delay in urgent exams has been reported to have a major impact on the diagnosis and management of patients and on length of stay in the emergency department. 12
Laboratory automation has been described as an important means of improving the efficiency of the laboratory and TAT observance.9,13,14
In the present study, TAT was analyzed before and after laboratory automation implementation to evaluate the impact of automation on stat samples management.
Data reported showed that the mean TAT for stat samples respected the TAT goal established at 45 min independently of laboratory automation implementation, as previously described. 7 The automation helped to further improve the mean TAT from 36 min registered during the preautomation period to 34 min in 2014 after the definitive laboratory automation layout was reached, with the percentage of exams respecting TAT substantially increased after laboratory automation implementation ( Table 3 ; Fig. 2 ). The percentage of outlier exams decreased at 45 min from 26% to 21%, as well as at 60 min from 11% to 5%, with the aim of obtaining urgent exam results within 60 min in 95% of cases and an OP below 5%. 8 These decrease is evident after complete automation layout was reached (January–June 2014), as reported in Figure 4 . Furthermore, focusing the analysis on TAT for blood cell count, troponin I, and PT, as examples of stat exams requiring very different processing time, we observed that laboratory automation had a great impact on OP reduction for all of the exams, except blood count cell. Automation was determinant for troponin I and PT, tests requiring longer time for preanalytical (centrifuge) and analytical processing ( Fig. 3 ). This observation suggests that laboratory automation could improve the TAT of stat samples, especially when the preanalytical phase includes centrifugation of the sample, as in the case of troponin I and PT.
Furthermore, our data showed that for these kinds of exams, the integration in the automation layout is strongly recommended because the exclusion of the coagulometer from the automation line produced a worsening of TAT, probably as a consequence of the time requested to move the samples sorted from the automation to the stand-alone instrument, a process requiring the active participation by the laboratory staff. This implication was not significant for blood count cell TAT control, probably because of the rapid analytical phase that is characteristic of this test.
Data from this study demonstrated, in agreement with other authors,4,8,9 that total laboratory automation has a positive impact on the laboratory service and helps to provide mean TAT reduction as well as OP decrease.
Further studies should be performed to evaluate the impact of automation on laboratory errors management and on staff satisfaction.
Footnotes
Declaration of Conflicting Interests
The authors declared no potential conflicts of interest with respect to the research, authorship, and/or publication of this article.
Funding
The authors received no financial support for the research, authorship, and/or publication of this article.