
Abstract
High-throughput screening is an established technique in drug discovery and, as such, has also found its way into academia. High-throughput screening generates a considerable amount of data, which is why specific software is used for its analysis and management. The commercially available software packages are often beyond the financial limits of small-scale academic laboratories and, furthermore, lack the flexibility to fulfill certain user-specific requirements. We have developed a Python module, screening_mgmt, which is a lightweight tool for flexible data retrieval, analysis, and storage for different screening assays in one central database. The module reads custom-made analysis scripts and plotting instructions, and it offers a graphical user interface to import, modify, and display the data in a uniform manner. During the test phase, we used this module for the management of 10,000 data points of various origins. It has provided a practical, user-friendly tool for sharing and exchanging information between researchers.
Introduction
High-throughput screening (HTS) is an important cornerstone in modern pharmaceutical research and lead finding. It is no longer limited to pharma and biotech companies, but is nowadays also extensively used in academia. Since its advent in the mid-1990s, HTS has benefitted from the strong developments in assay miniaturization, detection methods, and liquid handling, which paved the way for this new way of drug discovery.1,2 Consequently, those technologies led to the generation of massive amounts of data, a phenomenon that inspired the term data deluge. 3 The efficient management of these data often poses a major challenge to researchers and has in some fields become the bottleneck of drug discovery. 3 Many software solutions address this issue; they are, however, often beyond the scope and the financial limitations of individual research groups, especially in academia. Fay compiled a good overview of available software packages, but also points out that the sole availability of state-of-the-art software and algorithms does not equal screening success, because a powerful HTS workflow also requires the seamless integration of these technologies. 4
Smaller screening labs, especially in academia, do not have the same needs or resources as industrial HTS facilities. Nevertheless, optimal software integration is crucial in an environment in which economical allocation of financial and human resources is a key factor. If there is no suitable or affordable solution available, an in-house software package is an obvious answer.
Writing one’s own program codes is a budget-friendly alternative for automatizing workflows and carrying out repetitive tasks. They can be tailor-made to fit the exact requirements of all performed experiments, deal with specific problems, and grow along with the complexity of the work, independent of software companies’ development and update schedules. Modern high-level programming languages, such as Perl, Ruby, or Python, are relatively easy to use, and no background in computer science is needed. This makes them a valuable tool in today’s heavily computer-dependent research facilities, especially in data-intensive fields such as HTS.
Data management generally encompasses three distinct parts: 5 infrastructure, data representation, and data analysis. Infrastructure (e.g., plate readers or automated workstations) varies depending on the lab and the task. Most lab equipment’s output is, however, numerical, and many devices nowadays come with the option to export the result as an Excel spreadsheet or comma-separated (csv) file. Data representation and management are more closely linked to the nature of the data and the underlying experiment. Data can be subdivided into three classes: 6 (1) raw data (i.e., the value associated with each measurement); (2) derived data, which are obtained after analysis of the raw data; and (3) metadata (“data about the data”), which describe circumstantial values, for example what is used as positive and negative controls, the date and type of the assay, or sample identifiers. Data analysis can be as simple as a percentage calculation or go as far as intricate statistical analysis or sophisticated machine-learning algorithms.
Although screening experiments are of a different nature, the form and structure of the resulting data are surprisingly similar, because most experiments yield just a numerical value or curve. Here, we describe the development of screening_mgmt, an integrated Python-based tool for the management of small- to medium-sized sets of screening data. It enables gathering raw data from various sources, which are then processed and stored in a central database in which they can be queried and visualized. The screening_mgmt module comes with a simple graphical user interface (GUI) that makes it easy to use in everyday operations.
Materials and Methods
Software and Implementation
With the aim of making this module accessible to small-scale academic labs, we solely relied on open-source or otherwise freely available technologies, in particular Python (Python Software Foundation, Wilmington, DC) and MySQL (Oracle, Santa Clara, CA). We used Python 2.7.3 on Canopy 1.2 (Enthought Inc., Austin, TX). Python is furthermore highly platform independent, and SQL databases are available for all major operating systems. Besides the Python standard library, we used the modules matplotlib, numpy, pandas, dateutil, and sqlalchemy.
Design
The software was designed to leave the user with maximum freedom with the data treatment while providing a convenient interface among the three sections of data management (infrastructure, representation, and analysis). It links the screening results to information about the compound, the user, the assay, and the metadata describing the experiment itself (such as the date and time of the assay run). The screening_mgmt database has 3 preset tables to store the metadata (1 each for compounds, users, and routines) as well as a central reference table, and it dynamically creates a specific table for every new routine. The reference table is the central element of the structure, and it contains for each data point the links to the respective compound, user, and routine. It also provides a link to the routine-specific table in which the actual measurement data are stored. This structure is conceived to make querying of the data easier. An overview of the structure is shown in Figure 1 .
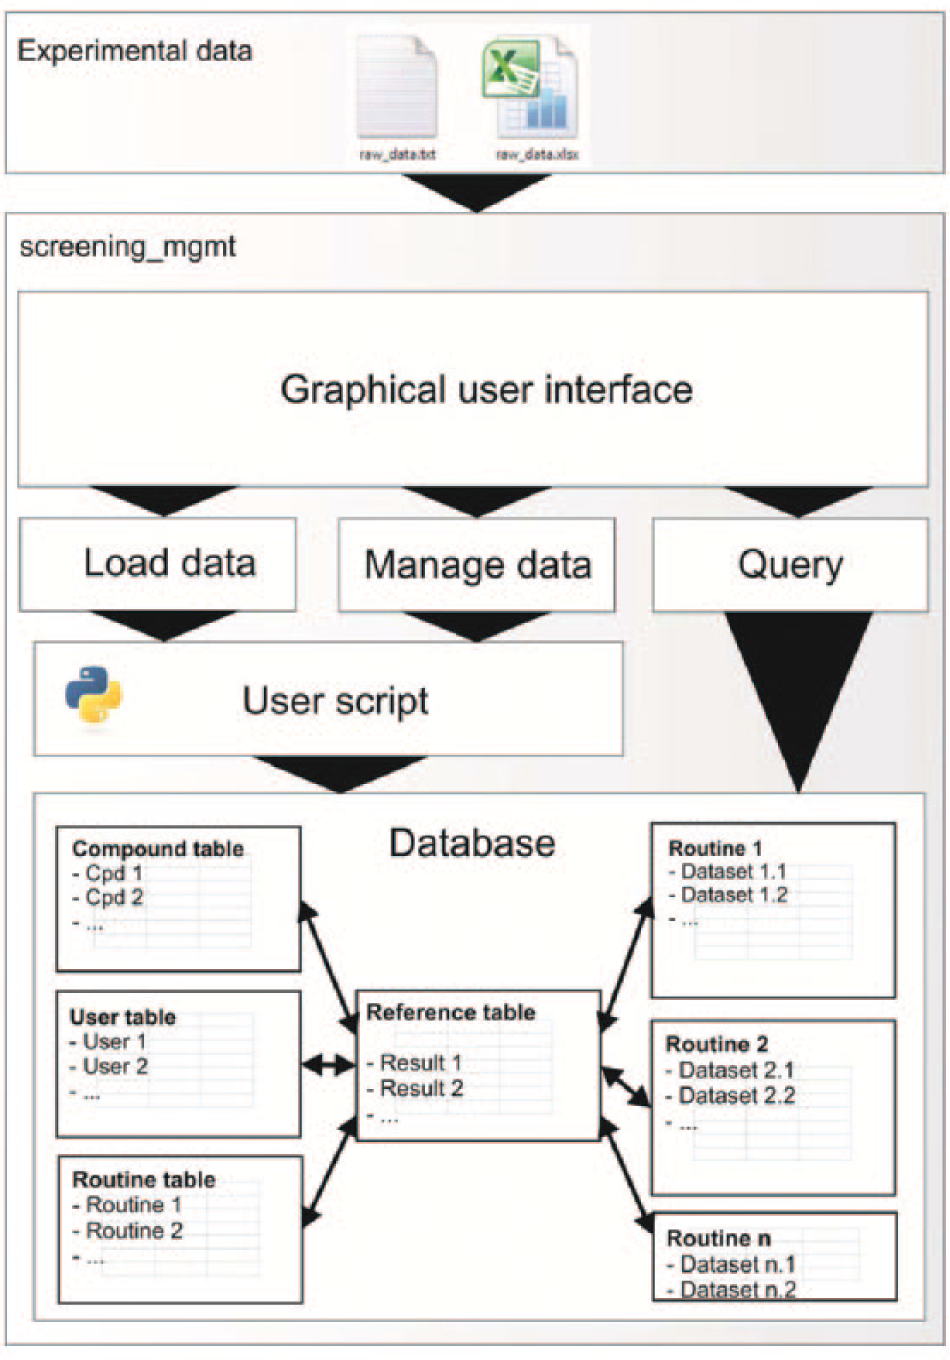
The overall structure of the screening_mgmt module, showing the interaction between the graphical user interface and the database, and the links (or foreign keys) between the compound, user, routine, and result table and the data tables.
For each assay (or routine), the user provides a Python script that defines 3 functions: 1 for reading the raw data, extracting the metadata, and preparing the data for writing to the database; 1 that displays the results on a graph or plot; and 1 to summarize the data in tabular form. When defining a new routine through the GUI, the software automatically creates a template file, which can then be modified, so the script does not need to be written from scratch. Depending on the assay, the user is free to choose to what extent the data are (pre-)processed before they are stored in the database. Thanks to the many Python application programming interfaces (APIs), one can even use scripts written in another language, such as MATLAB, R, or C, for high performance.
Querying
With all the data gathered in the same database, the ability to browse and search results is a great benefit of the software. The database can, for example, be queried for a specific compound (to show and compare the results of all of the experiments that have been performed with that compound) or for an experiment (to list all of the results from a certain assay). Figure 2A–2C shows screenshots of the menus, and Figure 3A–3B represents examples of automatically generated bar and index plots.
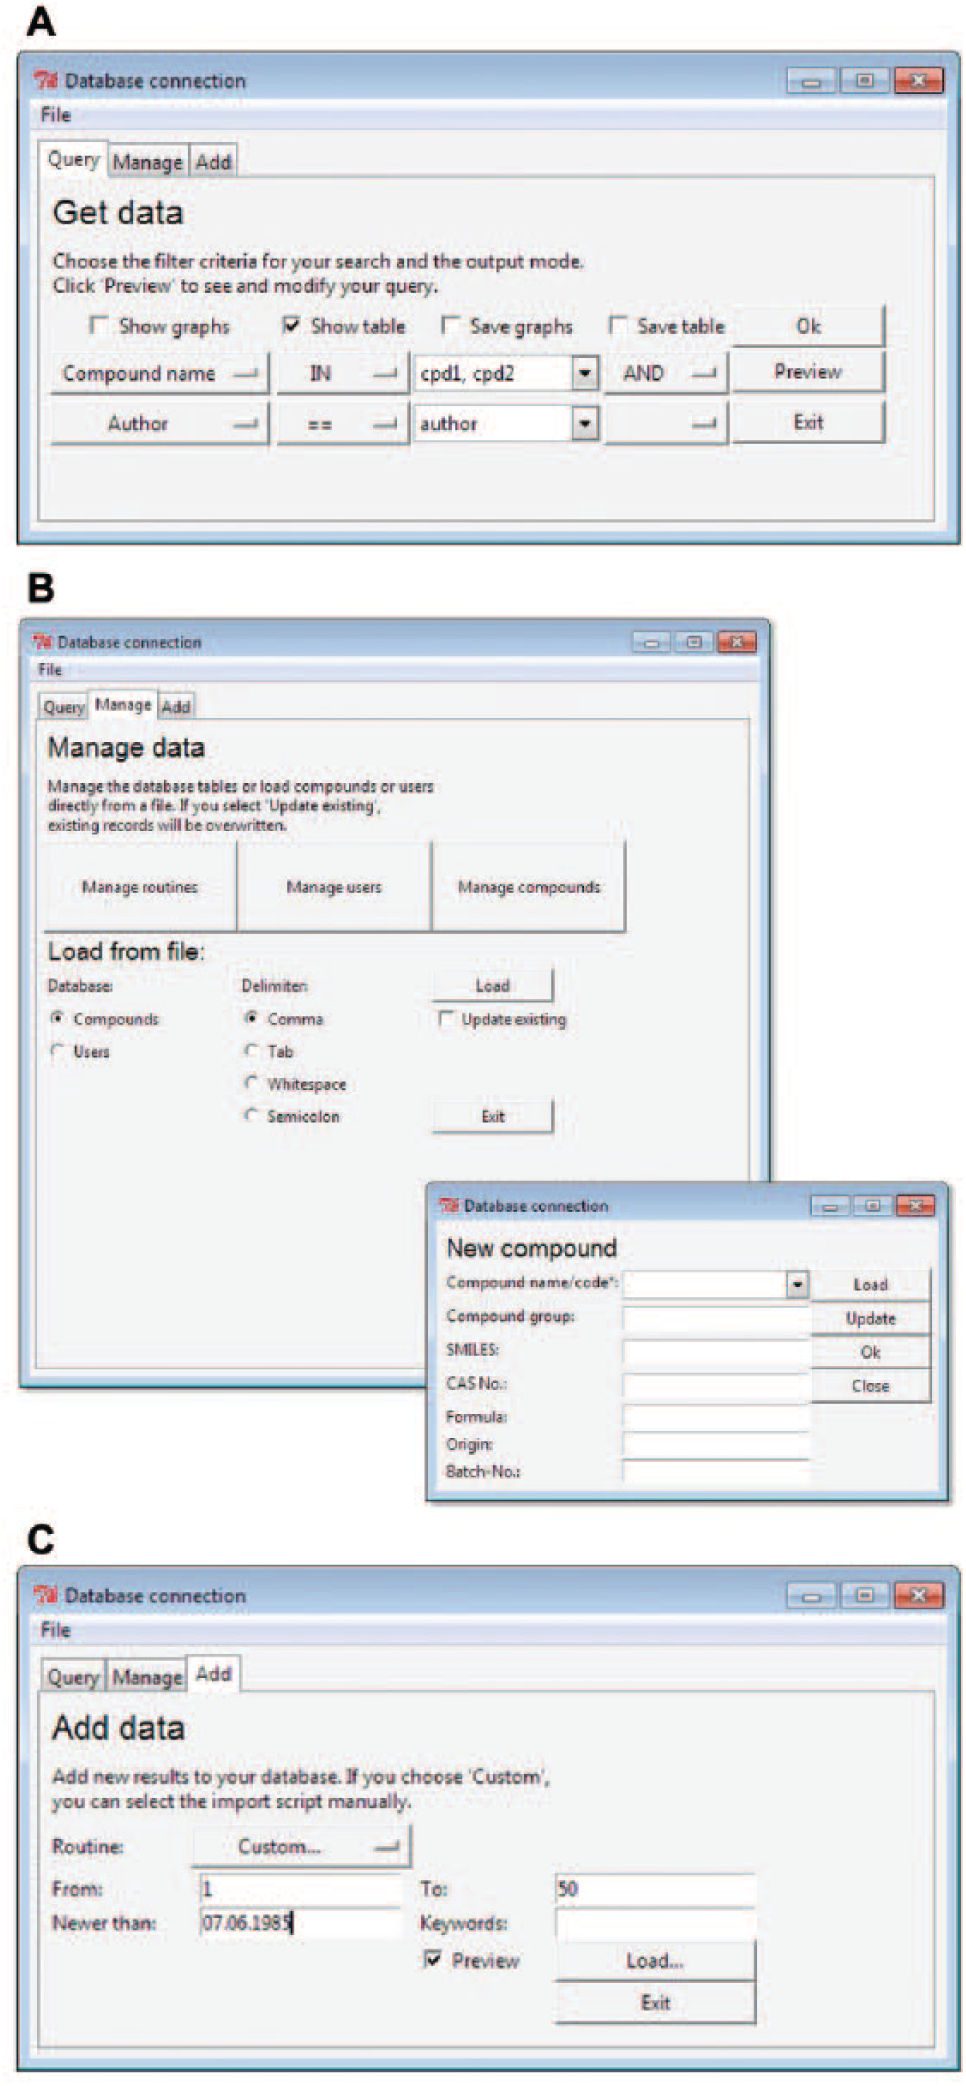
Screenshots of the screening_mgmt menus for (
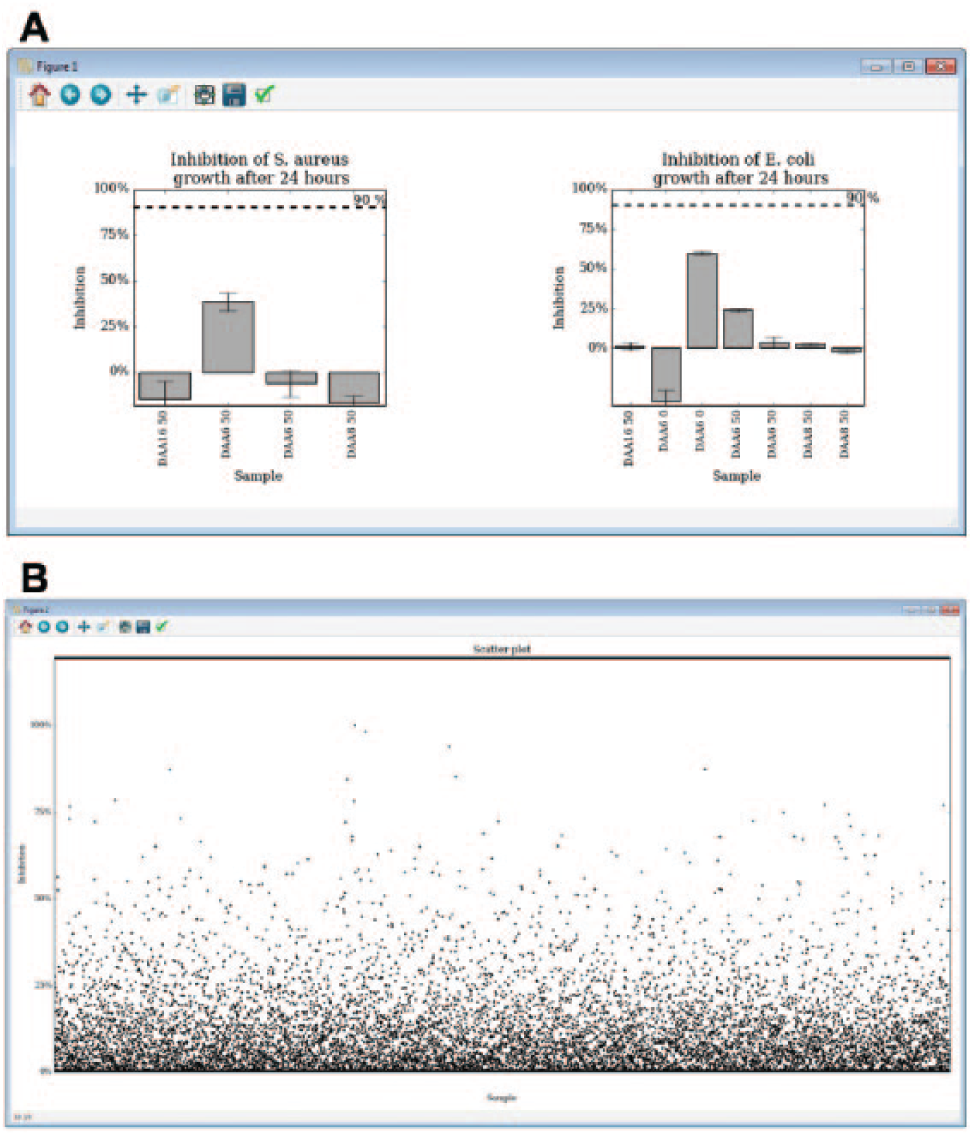
Screenshots of example plots created using matplotlib: (
The module includes extensive documentation to guide the user through the process. The documentation also contains detailed technical information.
Results and Discussion
Sharing, merging, and integrating data are vital for efficient scientific progress, and many open-source solutions have been developed to simplify these processes. The screening_mgmt module permits one to store data from different assays conveniently in one central place where they can be easily accessed. Data treatment and output can be automatized and plotted as publication-grade graphs. The module eliminates the need to rely on lab equipment manufacturers’ built-in software, which might not always be built for how you intend to use it.
The graphic interface makes it easy even for researchers with no Python or SQL knowledge to query the database and visualize the data. Should the database need any modifications, it can also be manipulated by any SQL environment (e.g., the MySQL workbench). Unlike commercial software, the source code is easy to read and also modifiable; thus, the module can be adapted easily to fit new requirements and add new features. This is of particular use for high throughput, in which small modifications in a protocol, when applied to the whole data set, can quickly add up and consume a considerate amount of time.
The module has not (yet) been optimized for speed. The most CPU-intensive part, however, is the treatment of the raw data, which is written by the user. Python knows multiprocessing and seamless integration of C code, so the script can be executed fast if speed becomes an issue.
In contrast to commercially available software, the quality, efficiency, and correctness of the data analysis are entirely the user’s responsibility. Also, the script’s author needs to have a good understanding of the data-processing task to be able to write reliable code. This can be a nonnegligible drawback that might compromise the quality of the results.
Screening_mgmt is not a full-fledged, all-purpose data management tool, but rather a lightweight framework that is designed to reunite compound library, assay archive, and results in one package. It provides a proof of concept that open-source software can satisfy the requirements of a small-scale screening lab for a data management solution. There is a trade-off between the time invested in the conception of the script and the time gained through automation. The main factors in this equation are the data volume, the possible alternatives, the development time of the Python script, and the amount of code that can be recycled from previous projects. Other examples, such as Labkey but also SIMBioMS, ISA, and Intermine,7,8 might offer a more comprehensive solution to many challenges than screening_mgmt’s minimalistic approach does, but they lack the flexibility and intuitiveness of a purpose-built data management solution.
As proof of concept, we have used the screening_mgmt module in our lab to handle screening data from 3 different assays, with a total of around 10,000 data points so far. The screening_mgmt module has eliminated fastidious data-formatting and -transferring tasks, and it has simplified the collaboration between researchers.
The screening_mgmt module can be downloaded from https://github.com/a-hel/screening_mgmt. The current version at the time of submission of this article was Version 0.1.1.
Footnotes
Declaration of Conflicting Interests
The authors declared no potential conflicts of interest with respect to the research, authorship, and/or publication of this article.
Funding
The authors received no financial support for the research, authorship, and/or publication of this article.