
Abstract
In this article, a flexible free and open-source software system for data logging and presentation will be described. The system is highly modular and adaptable and can be used in any laboratory in which continuous and/or ad hoc measurements require centralized storage. A presentation component for the data back end has furthermore been written that enables live visualization of data on any device capable of displaying Web pages. The system consists of three parts: data-logging clients, a data server, and a data presentation Web site. The logging of data from independent clients leads to high resilience to equipment failure, whereas the central storage of data dramatically eases backup and data exchange. The visualization front end allows direct monitoring of acquired data to see live progress of long-duration experiments. This enables the user to alter experimental conditions based on these data and to interfere with the experiment if needed. The data stored consist both of specific measurements and of continuously logged system parameters. The latter is crucial to a variety of automation and surveillance features, and three cases of such features are described: monitoring system health, getting status of long-duration experiments, and implementation of instant alarms in the event of failure.
Introduction
In every experimental laboratory, the need for acquisition and subsequent logging of data is essential. The acquired data from a given experiment is typically stored locally on a laboratory computer and is often acquired in highly specialized proprietary software tightly integrated with the experimental equipment by the manufacturer. These software suites often save to closed proprietary formats, which are difficult to exchange across several computers (e.g., a laboratory computer and an office computer) as specialized software is required both to read and export the data files. The software furthermore typically also requires additional licenses, increasing complexity and cost of the total system. The exchange of acquired data between different computers, some even with different operating systems, is hence cumbersome and difficult.
To avoid difficult data exchange and simplify data processing, an open-source software platform is a much more attractive solution.1–3 To accommodate these demands, we have written an open-source platform for saving, logging, treating, and visualizing experimental data.
In the present work, we describe a software system consisting of data acquisition, storage in a centralized database, and a comprehensive display module including simple data treatment algorithms licensed under the GNU general public License (GPL). 4 Examples of the implementation of the data-logging clients are located at https://github.com/CINF/PyExpLabSys, and the code for the data presentation Web site is located at https://github.com/CINF/DataPresentationWebsite.
System Description
The system consists of three logically separate components, as illustrated in Figure 1 : (1) the acquisition component, in which all communication with equipment and acquisition of data is performed; (2) the server component, which consists of a database server that stores the acquired data from experiments and the Apache web server, which interacts and presents the retrieved data from the database to the user; and (3) the user side, which consists of the clients wishing to access the data.
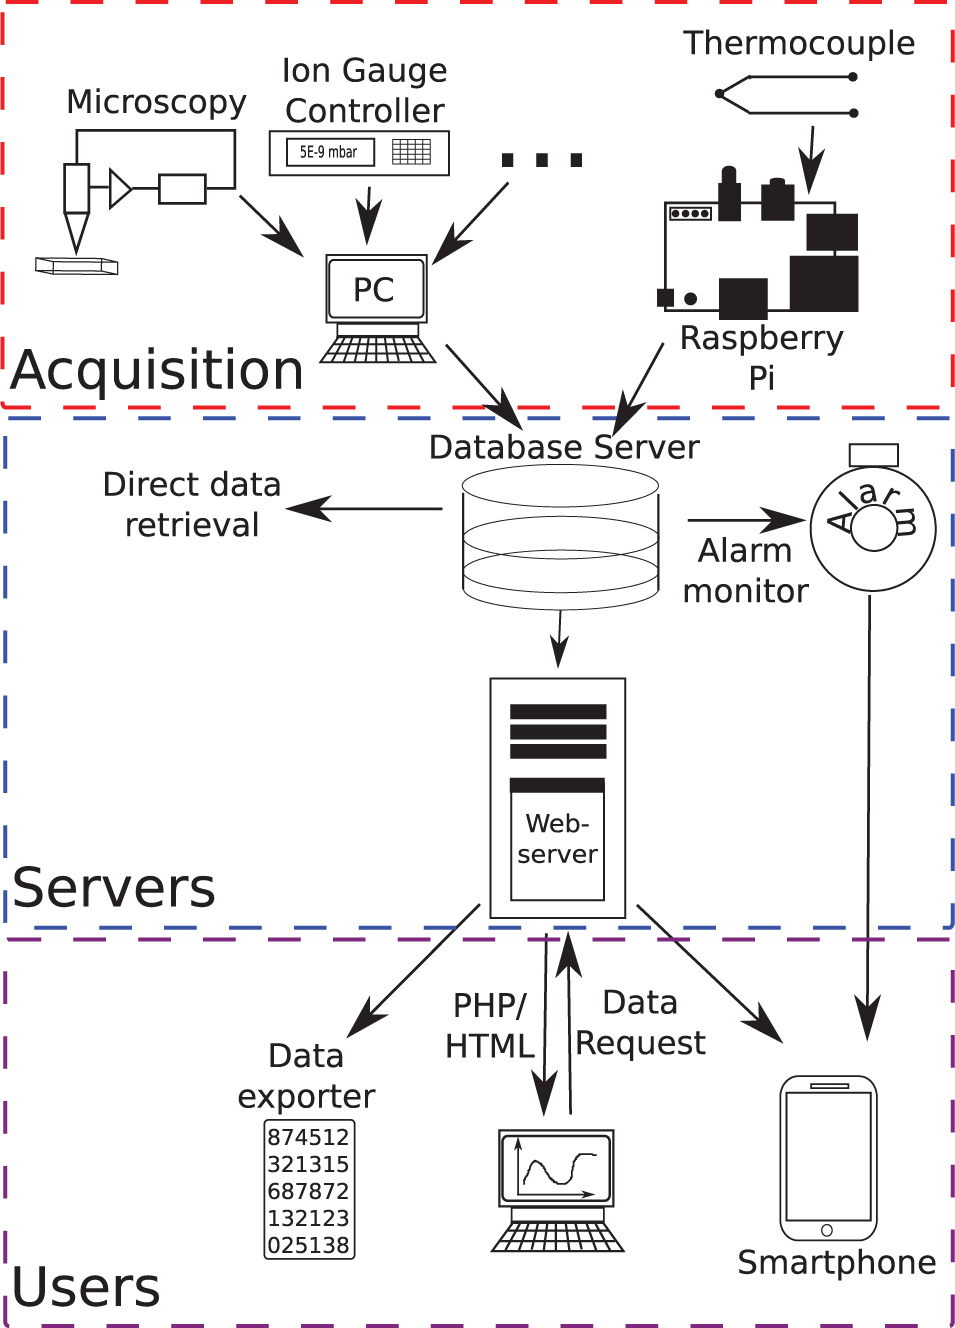
A schematic representation of the structure of the data-handling system. Structurally, the system can be divided into three subparts: the acquisition side where data are acquired, the server side where data are stored, and retrieved and the user side where users interact with the system.
The system is highly flexible and modular, meaning that the servers can accept data from a range of different sources and that each server function can be accessed individually. The user can furthermore use programs written in a wide variety of languages and is only limited by the chosen language’s ability to interface to relational databases. As a testimony to this, software written in both LabVIEW and Python 5 are currently used to save data to the database. How the integration with the server and subsequent storage of data in the database is performed is hence a user-determined design decision. This has a number of advantages. The user can integrate existing software with the databases quickly and without the need to rewrite any previous interface software written for experimental setups. Furthermore, because of the flexibility of the system, if storage in the database during acquisition is not possible because of software limitations, the data can still be saved in the database by subsequent parsing of data files. This, however, still requires that the file format, which holds the data, is specified or that the data can be exported to a specified file format from the acquisition software. Presently, we have written parsers for a number of these external formats ranging from XML-based x-ray photoelectron spectroscopy data to text-based temperature data.
The servers consist of a database server and a Web server. In our specific implementation, a MySQL database has been chosen. All experimental data acquired by the user are stored in the MySQL database and are presented to the user from the Web server. If needed, experimental data from the MySQL server can be retrieved directly from the database by user-written scripts for later analysis. The Web server runs a LAMP (Linux, Apache, MySQL, PHP/Python) stack. Python (version 2.6), PHP, and HTML/CSS are used to extract data from the database and present them to the end user in a simple interactive Web interface for visualization and simple data treatment. Python was primarily chosen because of its tight integration with scientific packages, such as SciPy 6 and NumPy, 7 which makes data analysis and treatment more convenient. 8 PHP and HTML/CSS are used to display data in standardized formats suitable for Web browsers and process input from the user. The combination of PHP and HTML/CSS to process user input from Web pages is very flexible and has proven successful in other parts of the scientific community. 9 To accommodate a range of users and provide the largest flexibility, the Web server displays both a standard HTML/CSS site for desktop PCs and a mobile version suitable for tablet/smartphone users.
Data Acquisition
In research laboratories comprising several experimental setups, decentralized data acquisition from independent clients to a central server is a very attractive solution. This is due to the large flexibility of the system, low probability of data loss, and the simplification of backup procedures of all experimental data. To be able to save acquired data from a range of different computer hardware and scientific instruments, interfacing of many types of equipment is necessary.
In practice, this is achieved by formulating a set of general design goals that will serve as computer language and hardware independent pseudo-code, which will help the process of designing a new acquisition client to obtain conformity of the system. The design goals of our implementation are the following:
To minimize data loss and to provide live data access, all clients must store data for as short amount of time as possible before handing the data to a central server. Preferably, the data should be stored on the server as soon as it is acquired. For data being recorded over longer time spans, this means that data must be live streamed to the server.
To avoid data loss in the event of network failure or maintenance of the central server, all clients collecting critical data must implement a local queue that will temporarily hold data until the central server can again be accessed. The client must continuously check if the server is available and as soon as possible deliver queued data to the server.
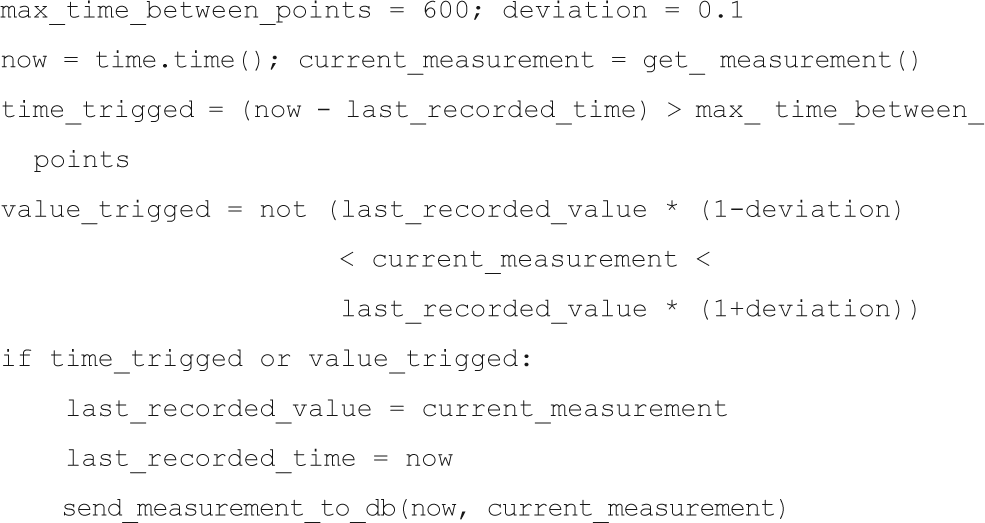
For continuous measurements (e.g., temperatures, pressure in vacuum chambers, cooling water flow, etc.), data logging must be implemented in a way that ensures that all significant events are recorded and at the same time does not use excessive amounts of storage. This is typically implemented by sampling data with a much higher rate than they are recorded. The local client will then, based on relevant heuristics, decide whether a new data point should be stored on the server or not. In practice, this is often implemented by waiting for either a given relative change in the signal or a predefined time since the last recording of a data point. An example of such an implementation in Python is shown below.
For standalone offline measurements (e.g., spectrometry, electrical characterization, etc.), it is important to measure as much metadata as possible to ensure that all information connected to the experiment is preserved. Along with accurate time information, this will ensure that questions that were not yet formulated at the time of the experiment can in some cases be answered in retrospect using the metadata along with the continuously measured data.
Examples of data-logging clients can be viewed and downloaded at the https://github.com/CINF/PyExpLabSyswebpage.
Data Storage
For storage of acquired data, a centralized server has been implemented as opposed to noncentralized systems such as a network-based distributed data system 10 or a file-based system. Storing all acquired experimental data in a database on a centralized server has a number of attractive features. First, by storing the data on a centralized server, backup of all experimental data is enormously simplified compared with backup of individual computers. Backup of experimental data is, hence, from a user’s point of view, automatic as soon as the data are handed off to the server. The backup task itself is also easily accomplished by setting up routine jobs on the server. Second, the data are stored in a standardized and open format, which allows for easy export of the data. This makes data exchange across different platforms immensely more simple. For the reasons mentioned above, this kind of solution is much superior to the traditional solution, in which data were stored, exchanged, and backed up in ordinary files such as spreadsheet files or closed third-party files. Third, by open sourcing all of the code used to visualize and treat data from the database, collaboration between several different groups is possible, thus increasing the number of developers to optimize the code and further increase functionality.
A centralized storage of data can be accomplished in many ways. However, in experimental laboratories where large amounts of data are recorded, a database is an obvious choice. To keep the server back end simple, a relational database has been chosen. As specific implementation MySQL has been chosen. Other SQL-based servers could also have served the purpose, but MySQL was chosen because of its GPL license, 4 simplicity, flexibility, scalability, and experience with the software within the development group.
A system design of many highly decentralized clients all pushing data continuously to a central MySQL server requires decent server performance, high uptimes, as well as a flexible storage ensuring easy expansion of storage space if needed. To ensure these properties of the system, it has been implemented with as few modifications to the configuration of the standard LAMP server installation as possible, which helps to ensure that this central component can easily be managed by the professional IT staff at the department. The storage expansion option is implemented by storing the data in a logical volume manager setup, which allows for dynamic addition of storage space as needed. Data safety is implemented both by locally mirroring the drives that contain the data and by doing remote backups. It is important to realize that although the clients can easily have the “age diversity” of accumulated scientific equipment, be exposed to harsh conditions in the laboratory, and be managed by the scientific staff, the server needs to be managed and handled with all the care associated with a production environment server.
To protect against pollution of the various setup tables in the database, our system has implemented restricted access rights to all the tables in the database. Each client has its own username and password, and only this user has access to store data in the tables of that setup, whereas all users have read access to all the tables. The user credentials are also always placed externally to the code (typically it will be managed in the local ODBC settings of the client or simply in an external file, e.g., for direct access implementations). In this way, the interface code can flow back and forth between different setups without the risk of one setup accidentally logging data to another setup’s tables.
For each of the setups that are connected to this system, the following table structure is implemented: Each of the measurements that are continuously logged has its own table where the values are logged as a function of date and time. All the specific measurements, such as spectra, scans, and values monitored over a well-defined time span, are stored in two tables in the database, a metadata table and a data table. In the metadata table, all metadata pertaining to the measurement are saved in one row. In the data table, xy values and a measurement ID are saved in one row per xy-value entry. The metadata in the metadata table are then connected to the data points in the data table by a unique ID attached to each xy-value entry. This structure is a compromise between space usage and simplicity as it leads to extra space being used to store the measurement ID once for every data point. This, on the other hand, makes it possible and simple to store all the different kinds of xy data in just two tables.
Data Extraction
The flexible nature of SQL allows one to extract data in many ways. Complete data sets, data in a certain time interval for continuous measurements, or data pertaining to a specific measurement can be retrieved by simple statements.
These data can then be handled using the programming or data treatment environment most comfortable for the user and can be used to perform automatic reporting, data treatment, or as input to scripts that will produce plots based on the data. SQL also allows for very simple data treatment directly from the SQL server, which can be very useful to get a quick overview of the acquired data, as illustrated, for example, in the “Monitoring System Health” section.
A further advantage of SQL servers is the standardization, which makes it easy to change the choice of implementation, if it is wanted for some reason. Several open-source implementations of SQL servers exist, including Firebird, PostgreSQL, MariaDB, Oracle, and Mimer SQL, as well as proprietary products such as Microsoft SQL.
Another way to extract the data from the system, for data treatment or plotting, is to use the export function of the data presentation Web site described in the following section. This export function exports the data in a simple fixed header length, tab separated, text-based format that can be imported by most data import modules or functions.
Data Access
As mentioned in the “Data Extraction” section, it is both possible and very easy to access data directly from the database using either direct SQL statements or programming. This is practical for the cases in which it is desired to perform data treatment on the data or to produce high-quality graphs. However, typically it is sufficient to simply look at the data and possibly perform light data treatment. For this kind of data analysis, it would be highly impractical to write small custom pieces of software for each kind of data that the users wish to look at. For this reason, we have developed a framework for visualization of the stored data that allows quick and easy access to all data. The framework includes support for basic data treatment as well as the option to plot several data sets at the same time for easy comparison of results and to export the data to local files. The data treatment options that are already implemented are multiple user-defined linear transformations of both x and y data, differentiation, and plotting of one set of y values as a function of another set of y values through common range x values. On the plot configuration side, there is support for both ordinary data as well as dates on the x axis and of course linear and log scales on the y axis. An example of the Web interface used for plotting is shown in Figure 2 .
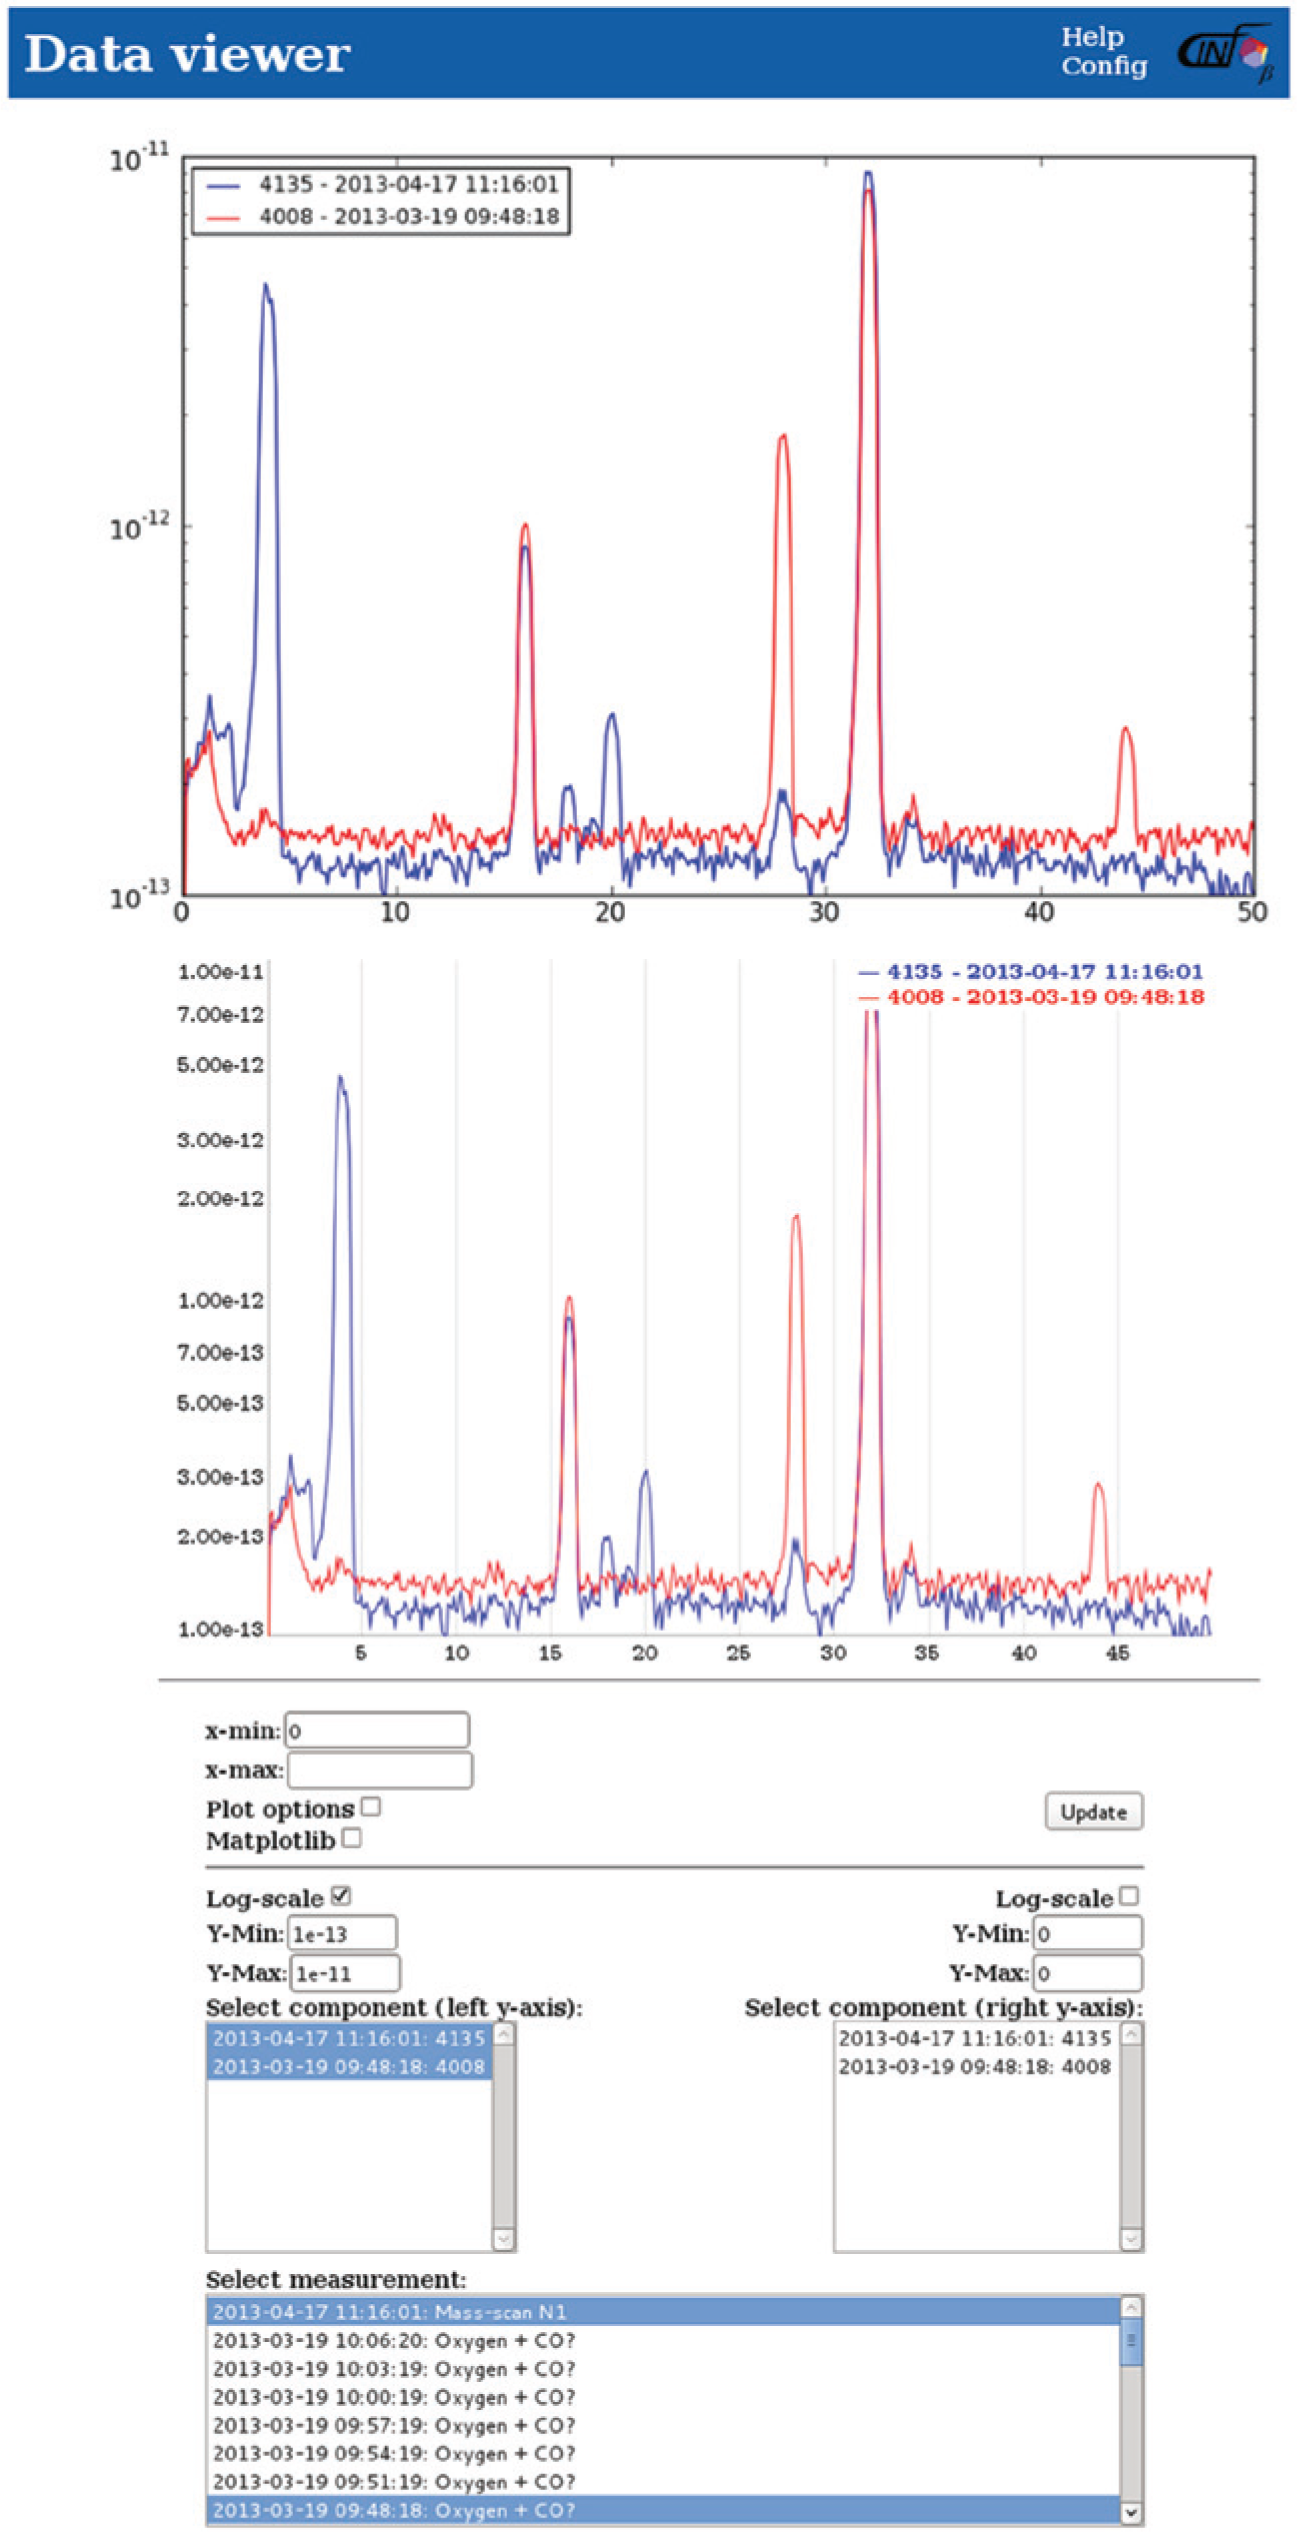
Demonstration of the visualization interface. Data (here mass spectrometer data) can be plotted in a Web browser, allowing easy comparison between data. Data can be selected and treated by the PHP/HTML interface provided beneath the graph. This figure has been edited to show both of the plotting engine results in the same Web browser window, whereas normally only one would be present at a time.
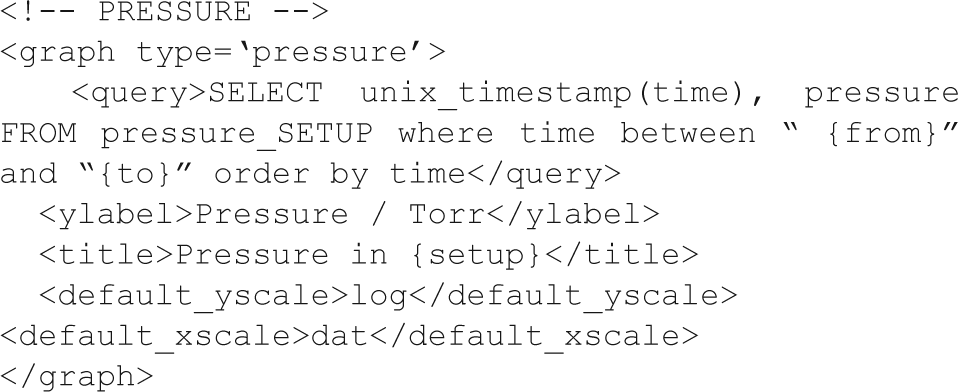
The goal for the visualization module has not been to provide high-quality plots because this is a large task that is best solved with either dedicated software suites or custom scripts. Instead, the quality of the plots was targeted to be sufficient for different kinds of everyday use, including presentations at group meetings, as a starting point for a discussion of data, quick data comparison, and so forth. The visualization module consists of a set of Web pages for user interaction, code to generate the plots, and plot preferences specific to each experimental setup. The preferences XML file contains a settings section for each different kind of plot. Below is shown an example of a continuously logged pressure.
The system is flexible toward choice of plotting library, which is a great advantage because different plotting libraries are optimal for different tasks. At the moment, the default plots are produced by JavaScript-based dygraphs, 11 allowing real-time manipulation of the data, such as zooming and tracking the graph values closest to the mouse, simply by use of the mouse through an ordinary Web browser. This type of plot is shown in the middle of Figure 2 . As a testimony to the flexibility of the setup, Matplotlib 12 is also implemented and can also be used for visualizing data if the user wishes. Matplotlib produces more presentable graphs, with a very strong and customizable plotting engine, a nice layout with good default font sizes, and the option to produce special characters in the text, but all of this at the expense of not allowing dynamic plot manipulation. An example of a Matplotlib-produced plot is shown at the top of Figure 2 . JpGraph 13 has previously been implemented as a plotting library without significant changes to the backend code, demonstrating the large flexibility of system. The structure of the visualization module code will be discussed in more detail in the next section.
Data Presentation Web Site Code Structure
The general structure of the data presentation Web site is illustrated in Figure 3 . The front consists of an index page, which serves as the entry point for the different kinds of plots for all the different setups. This index page links to either “dateplot.php” or “graphplot.php,” with a “type” argument that indicates which section of the preferences XML file should be used to set up the plotting page. The index page may also link to custom pages, which can be used for special purposes such as surveillance. The front pages are written mainly in HTML and PHP but also contain some Javascript (Ajax) for dynamical updating of plot lists, and are all script based. The user input to select plots and change settings are retrieved with standard HTML forms.
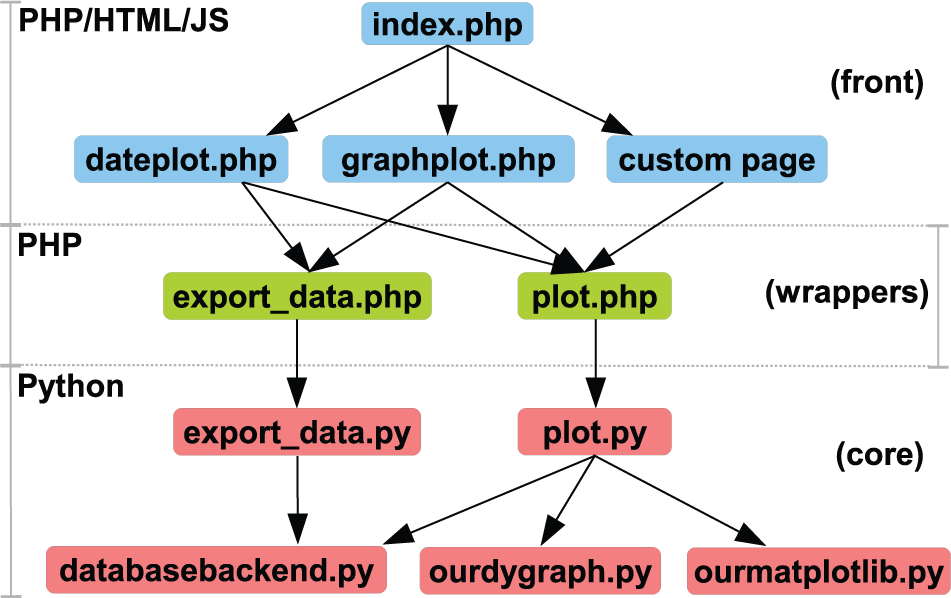
Code structure of the data presentation Web site. The code is logically split up into three categories: the front, which consists of all the user-facing Web pages; a set of wrappers for the figures or exports; and the core, which produces the figure or export content.
The front pages call one of two wrappers depending on whether an export or a plot is requested and includes the plot selection and settings in the call. These wrappers, which are written in PHP, are responsible for setting the correct content type for the output, formatting the settings for Python, and calling the core modules on the command line.
The “export_data.py” and “plot.py” core modules are responsible for producing the requested output, which is either text for an export, data for a Matplotlib figure, or Java script code for the dygraphs plot. Both “export_data.py” and “plot.py” makes use of “databasebackend.py” in a similar manner to retrieve the data from the database and perform the requested data treatment operations on it, such as differentiation or linear transformations. After retrieving the data, the “plot.py” module makes use of either the “ourdygraph.py” or “ourmatplotlib.py” module, depending on the user selection of plotting engine, and produces the plot content. All of the code for the core modules is written in Python.
The modular structure of the code makes it easy to modify and, for example, adding a plotting engine, requires only minimal changes to the front files, wrapper, and “plot.py,” and the addition of an extra plotting module.
Cases
The existence of this data system is paramount to several automation and system health-monitoring tasks in our laboratory. Below, a few examples are described of the use of the data system for these purposes. The examples cover how to create a system health development graph from the continuously logged pressure data, how we use the continuously logged data to monitor the health and status of long-duration experiments remotely, and finally how it can be used to create alarms if some of the system parameters fall outside specified security ranges.
Monitoring System Health
As mentioned in the “Data Extraction” section, the flexibility of SQL provides the possibility to perform advanced data selection and very efficient elementary data treatment directly in the database by means of a query. This can be used as in the example below, where the pressure in a vacuum chamber at 1 a.m. (when all the system parameters have settled down) for the past month is extracted for plotting;
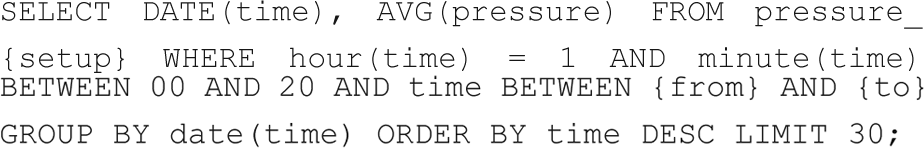
where {setup} should be replaced with the setup’s name and {from} and {to} should be replaced with the relevant date interval.
The output from a statement such as the one above is illustrated in Figure 4 . Plots such as these can be a useful tool to monitor the general health of the chamber (i.e., if leaks have developed, a valve is failing, a roughing pump is malfunctioning, etc.). It should be mentioned that this is a function that has been sought after for quite some time as an ultra-high vacuum is required for surface science studies. Previously, this has simply not been possible before the automated logging and selective plotting, as it would have required a person to log the data in the middle of the night and to periodically make new plots manually of the latest time period.
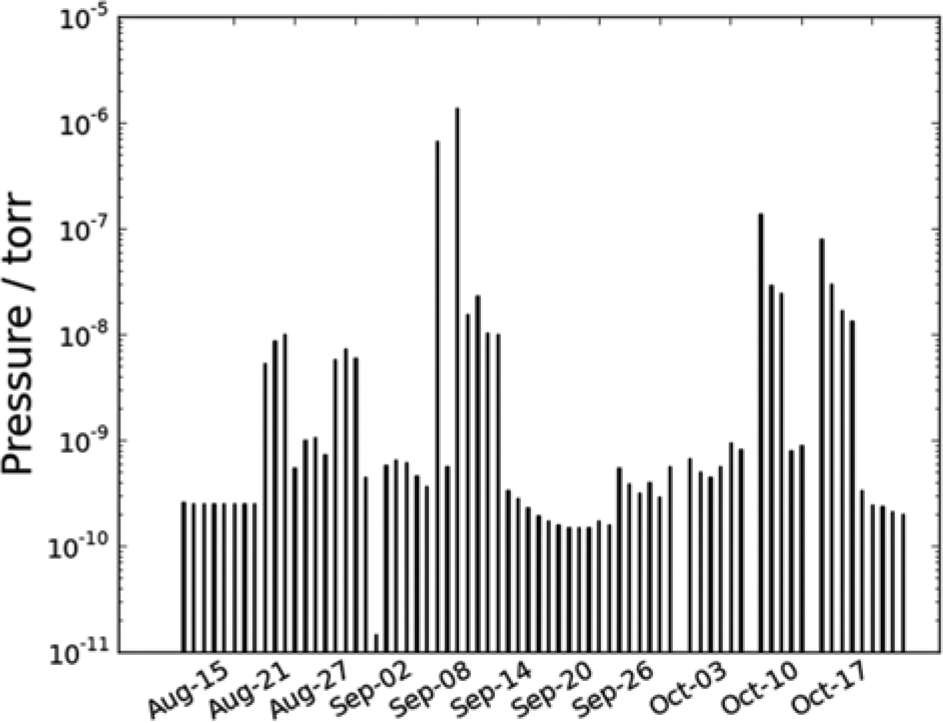
The morning pressure in a vacuum chamber at the department as measured by a Bayard-Alpert ion gauge. Data such as these can be used to identify equipment that requires maintenance or is malfunctioning.
Status of Experiments over Long Time Spans
Within surface science, it is not unusual to have experiments or preparation procedures before an experiment running for extended periods of time (i.e., overnight or over several days). Obviously, for such procedures, the equipment is unmanned during some periods. The software is responsible for the safety of the system/equipment and for shutting it down if something unintentional happens. With continuous logging, it is, however, a simple task to add surveillance to these procedures that alerts the user by mail or text messages if the procedure has been stopped. If this occurs, it is subsequently possible for the operator to assess if it is safe to start the experiment again, even remotely. This prevents loss of experimentation time if the experiment has been stopped at an unmanned time.
An example in which this is used is for the cleaning of metal single-crystal samples before experimentation. The cleaning of the particular surface is achieved by running a number (e.g., 5–20) of cleaning cycles. Each of these cycles can take up to several hours. Before this task was automatized, it typically required simple manual intervention two to four times during a 30 to 120 min cycle. Obviously, this was a suboptimal solution requiring periodical manual work. After the total automation of the task and the implementation of the surveillance features mentioned above, this procedure can now run for 10 to 16 h overnight, for example, and produce a sample ready for experimentation at the beginning of the workday.
Another use of the monitoring of extended procedures is in the experiments on microreactor setups. 14 For these devices, it is very common to have quite long unmanned experimentation times. They can be used to allow for sufficient system settle time when parameters have been changed, to study long time stability effects on the samples, or to thoroughly search the parameter space for the experiment. For all of these purposes, the more experimentation time, the better, and being able to unproblematically and safely use nights and weekends is a noticeable improvement.
Cooling Water Alarms
Several important pieces of equipment in our lab require cooling. If the cooling fails, it can result in breakdown of this equipment, which can be quite expensive in repair costs and lost experiment time. Using the continuously logged data, critical system parameters can be monitored and used to trigger alarms when these fall out of specified ranges. This feature is used to monitor the temperature of all the equipment with critical cooling requirements. All temperatures are logged via the data system, and alarms will trigger if cooling fails. This approach has the desirable side effect that system health can be monitored (to the extent it is given by the temperature) of each piece of equipment individually to evaluate if the equipment is getting old or requires maintenance. To implement the alarms, a program has been written that retrieves the latest temperatures from the database, compares them with values from a previous time interval, and sends out an alarm via email if they increased out of range. Appropriately coupled with email alarms (e.g., on smartphones), this feature provides the user with real-time notification of critical cooling loss.
Summary
In the present article, we have described our implementation of a system for acquiring, logging, treating, and visualizing experimental data. The system can be used to log both continuous data and specific data sets. It is designed to be modular and consist of three parts: the data-logging clients, a data server, and a data presentation Web site.
For the data-logging clients, a set of general design goals have been formulated. This was done to ensure conformity of the system and to ensure the implementability in any programming language and to enforce data safety principles. For the data server, we have described the advantages in terms of simplified backup of storing data in a central location. Furthermore, a simple table layout that enables logging of data of many different kinds has been discussed, as well as how the availability of a central data server with a standard interface can be used for easy data selection and export. As the final part of the system, the data presentation Web site has been described. This Web site has a modular structure with a front-end user interface and a back-end plotting engine. This modular design has been used to implement several different plotting engines for different purposes, ranging from dynamic plot manipulation to better-looking plots as a basis for discussion and for use in internal presentations. The availability of the data from a Web site means that it is easily available from any location for evaluation, comparison, and sharing of data, thus enhancing the possibilities for collaboration.
Besides the system itself, three different cases have been discussed that describe how, in particular, the continuously logged system data can be used for diverse and important purposes that would be very difficult or impractical to implement without the data-logging system. These cases include monitoring of system health, surveillance of experiments running over long durations of time, and cooling water alarms as an example of instant notifications of the loss of a support system.
Finally, it has been described how this entire system is programmed in Python, PHP, and HTML/CSS and is placed online for download under a free software license to enhance future collaboration around the system.
Footnotes
Declaration of Conflicting Interests
The authors declared no potential conflicts of interest with respect to the research, authorship, and/or publication of this article.
Funding
For funding of this work we gratefully acknowledge The Danish National Research Foundation’s Center for Individual Nanoparticle Functionality (DNRF54).