
Abstract
Quantification of bacteria using conventional viable plate counting (VPC) is labor-intensive and time-consuming. Flow cytometry (FCM) can be proposed as a faster alternative. This study aimed to develop a flow cytometric, single-stain approach using TO-PRO®-3 iodide (TP3) for the quantification of Staphylococcus aureus, Escherichia coli, and Bacillus subtilis cells. Live or dead bacterial suspensions were stained with TP3 and analyzed using a FACSCalibur flow cytometer. After optimization of staining parameters and instrument settings, an excellent separation of viable and dead cells was achieved for all species. The quantitative performance of the technique was assessed by analyzing serial dilutions of bacterial suspensions using FCM and VPC. A highly linear correlation (r2 > 0.99) was observed between the colony forming units (CFU)/mL as determined by FCM and by VPC over a concentration range of about 104 to 108 CFU/mL. As such, FCM quantification of viable bacteria using TP3 can be considered as an accurate and reliable alternative for VPC. The monostain procedure is easy to apply and cost-effective, and it allows bacterial enumeration in a broad variety of samples.
Keywords
Introduction
The quantification of microorganisms is ubiquitous in microbiology and usually based on the viable plate count (VPC). 1 This time-consuming, labor-intensive, and subjective method only allows enumeration of organisms that readily grow on solid medium, however.2–4 Of the alternative techniques under investigation, flow cytometry (FCM) has proven to be fast, precise and accurate. Furthermore, it enables growth-independent quantification and multiparametric analyses.4–7
In a previous article, we reported the use of an FCM single-stain approach to directly quantify viable Candida albicans cells. 8 Viable cells were discriminated from dead cells through a difference in fluorescence intensity using TO-PRO®-3 iodide (TP3), a membrane-impermeable dye that shows a greatly enhanced fluorescence on binding to double-stranded DNA (dsDNA) in bacteria that are dead and thus permeable.
The present study aimed to expand this technique to the enumeration of viable bacteria. We evaluated the influence of the small bacterial size on our FCM approach and assessed whether prokaryotes show the same TP3 staining characteristics. The first part of this study focused on the separation of viable bacteria from the dead subpopulation and background noise. Second, the quantitative potential of FCM for viable bacteria was assessed in comparison with VPC, with particular focus on the precision of both methods. Four species with different Gram staining were selected because they are mentioned in the European Pharmacopoeia (monographs 2.6.12 and 2.6.13), indicating their importance for the pharmaceutical industry: Escherichia coli and Pseudomonas aeruginosa as Gram-negative test species, and Staphylococcus aureus and Bacillus subtilis as Gram-positive species. 9 Finally, to confirm the applicability of the developed FCM method, the growth of E. coli under different experimental conditions was monitored.
Material and Methods
Bacterial Strains and Growth Conditions
E. coli ATCC 8739, P. aeruginosa ATCC 15442, S. aureus ATCC 5374, and B. subtilis ATCC 6633 were maintained on Tryptic Soy Agar (TSA; Lab M, Lancashire, UK) at 37°C and were subcultured every 24 h. A fresh culture was prepared weekly from a cryostock.
Qualitative Analysis
After overnight incubation, a single colony was placed in 10 mL sodium chloride peptone (SCP; 1 g of peptone, 3.6 g KH2PO4, 7.2 g Na2HPO4.H2O, and 4.3 g NaCl dissolved in 1 L of ultrapure water with a pH of 7.0 ± 0.2). This suspension was defined as a 100% viable culture. Half of the sample was heat-killed in a water bath at 72 °C for 30 min, resulting in a 100% dead culture. One hundred microliters of this culture was plated on TSA and incubated for 48 h to confirm successful heat killing. A mixture of 50% viable and 50% dead cells was obtained by adding 2 mL of the 100% viable culture to an equal volume of the 100% dead culture. The bacterial suspensions were kept on ice during the experiments.
A FACSCalibur flow cytometer (BD Biosciences, Franklin Lakes, NJ, USA) equipped with a red diode laser (λex = 635 nm) and a band pass filter measuring red fluorescence (FL4; 653–669 nm) was used. The sample flow rate was set at “low” (12 ± 3 µl/min). CountBright absolute counting beads (CB; Molecular Probes®, Eugene, OR, USA) were added to each sample as an internal standard and were counted in the channel detecting green fluorescence [fluorescent channel 1 (FL1)].
Mixed samples were used to optimize FCM separation of the viable and the dead populations by varying final concentrations of TP3 (1 µM–25 nM; Molecular Probes), incubation time (1 min–1 h), and voltages of the FCM channels (forward scatter (FSC), side scatter (SSC), FL1, and FL4) with the parameters for C. albicans in mind, as previously described. 8 The viable and dead cultures were analyzed separately to confirm the localization of the respective populations in the FCM dotplot and to set the gates that delineate these groups.
Bacteria were stained with TP3 (λex = 642 nm – λem = 661 nm) by adding 5 µl of the dye to 470 µl sample and 25 µl CB [final TP3 concentration of 200 nM; 10 min incubation time in the dark at room temperature (RT)]. The voltages were set at E01 for FSC, 445 for SSC, 450 for FL1, and 700 for FL4.
Quantitative Analysis
An entire overnight bacterial culture was scraped from agar and suspended in SCP. From this concentrated sample, a 10-fold dilution series was made in SCP. To increase the number of standards in the linear area of the correlation curve, three twofold and three fivefold dilutions were prepared to cover that concentration range. The dilutions were quantified in triplicate by both VPC and FCM. Sterile SCP was included as a blank. The experiment was repeated on three different days. Correlation between both methods was determined statistically using linear regression analysis (Graphpad prism 4).
Precision Analysis
To compare the precisions of VPC and FCM, one dilution approximating the middle of the linear range of the calibration curve was analyzed 10 times by both VPC and FCM for every bacterial species. 9 The coefficients of variation (CV) of the viable cell counts obtained by both methods were compared.
Growth Curve
The developed FCM technique was applied to assess the stability of an E. coli culture in SCP at RT and on ice. The resulting growth curves were compared to a growth curve of E. coli in Tryptic Soy Broth (TSB; Lab M, Lancashire, UK). For this experiment, three 50 mL tubes containing 40 mL of medium were inoculated with 8×10⁵ colony forming units/mL (CFU/mL) E. coli cells from a fresh culture. Bacterial concentrations were determined by FCM every hour for the first 10 hours and at t = 12, 24, 30, and 48 h.
Results
Qualitative Analysis
To optimize the procedure for qualitative analysis, different TP3 concentrations (1 µM–25 nM) and incubation times (1 min–1 h) were explored. A good FCM separation of the viable- and dead-cell populations could be achieved for B. subtilis 6633, S. aureus 5374, and E. coli 8739 ( Fig. 1 ). The best results were obtained using a concentration of 200 nM TP3 followed by 10 min incubation in the dark at RT. The FCM voltages were set at E01 for FSC, 445 for SSC, 450 for FL1, and 700 for FL4. An SSC threshold was set at 125 based on a blank sample to eliminate as much background noise as possible.
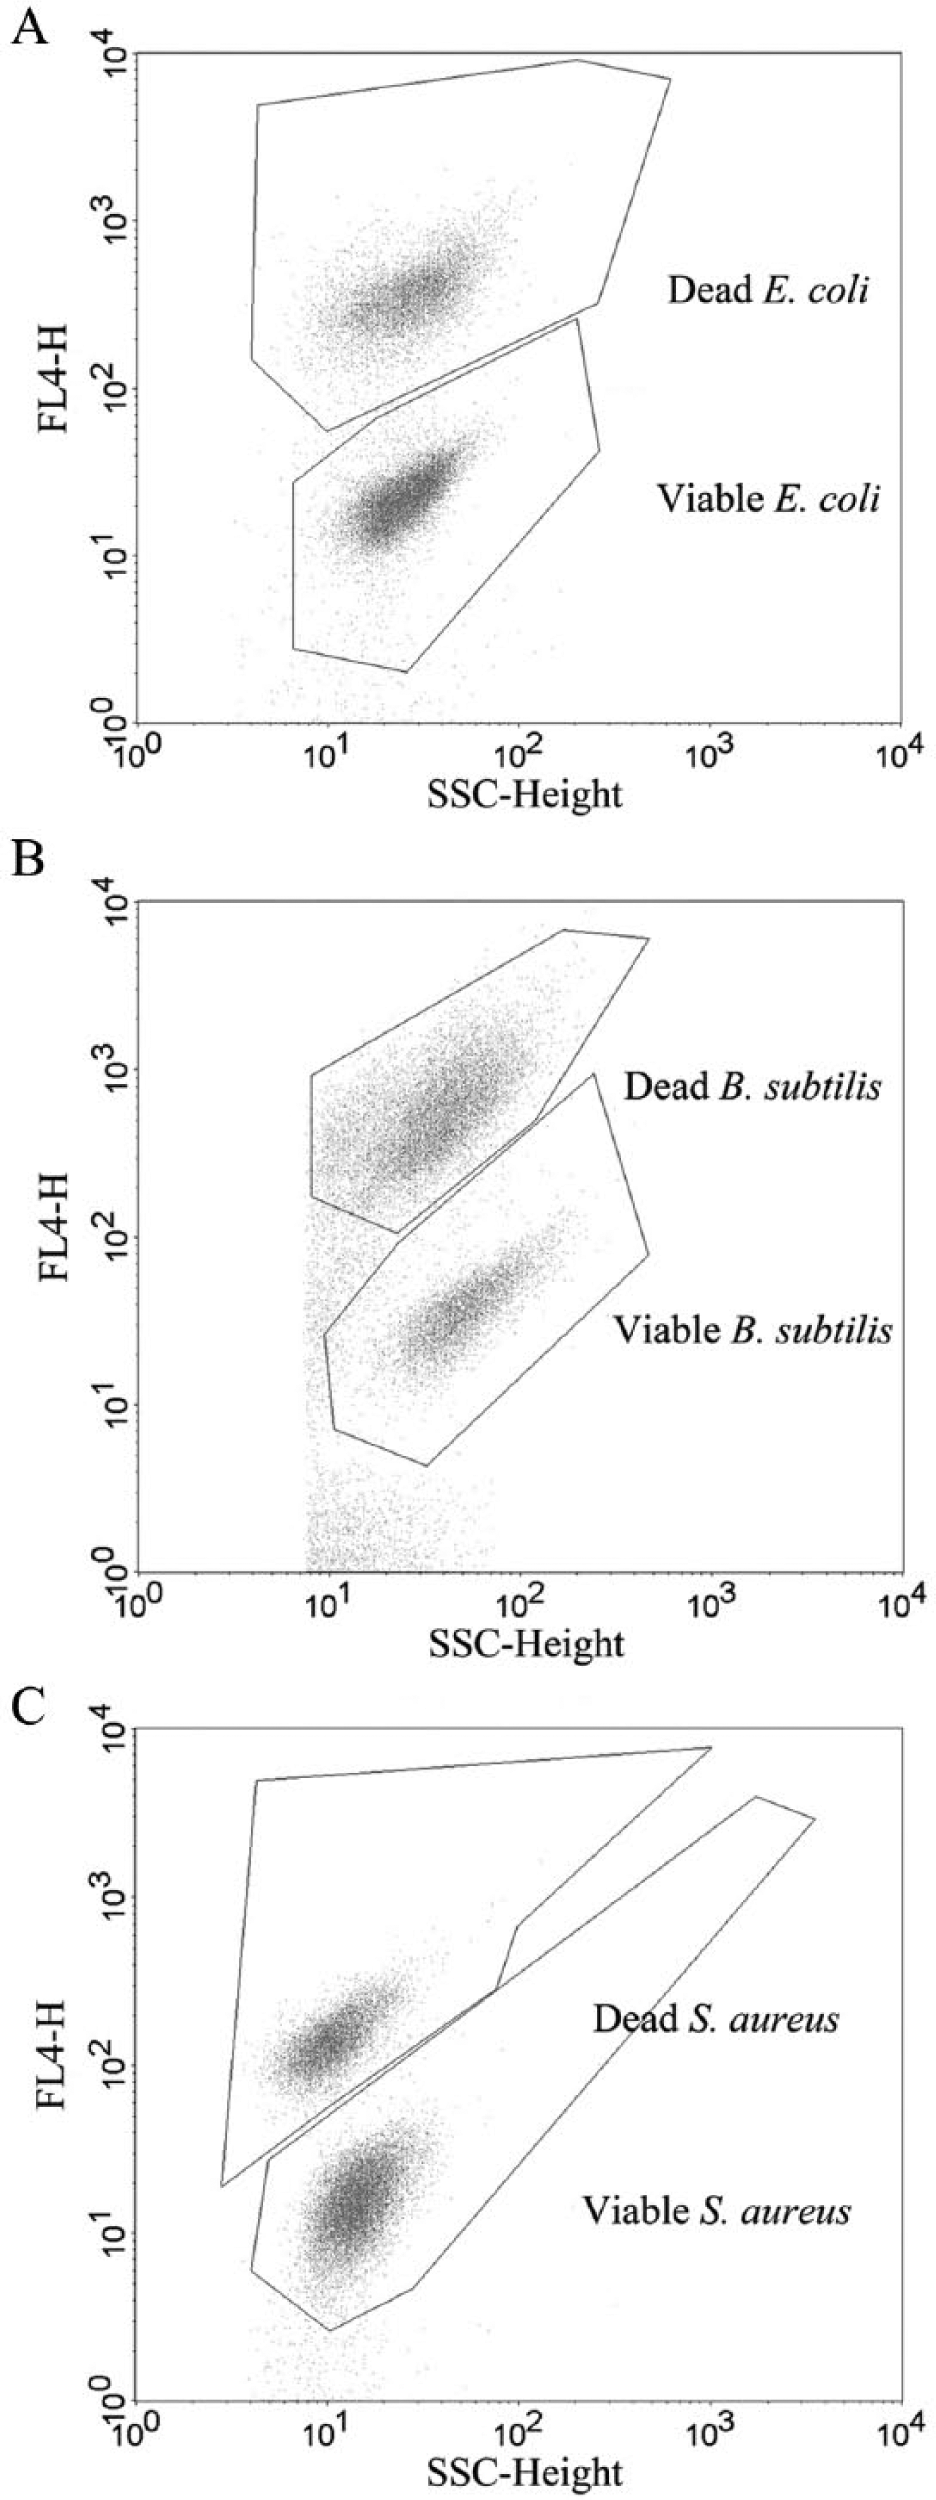
Flow cytometric separation of viable and dead bacterial cells in the side scatter (SSC)–fluorescent channel 4 (FL4) dotplot. (
Using these settings, it was impossible to distinguish viable from dead P. aeruginosa cells ( Fig. 2 ). Varying the concentration of TP3, incubation time or voltages did not improve the separation.
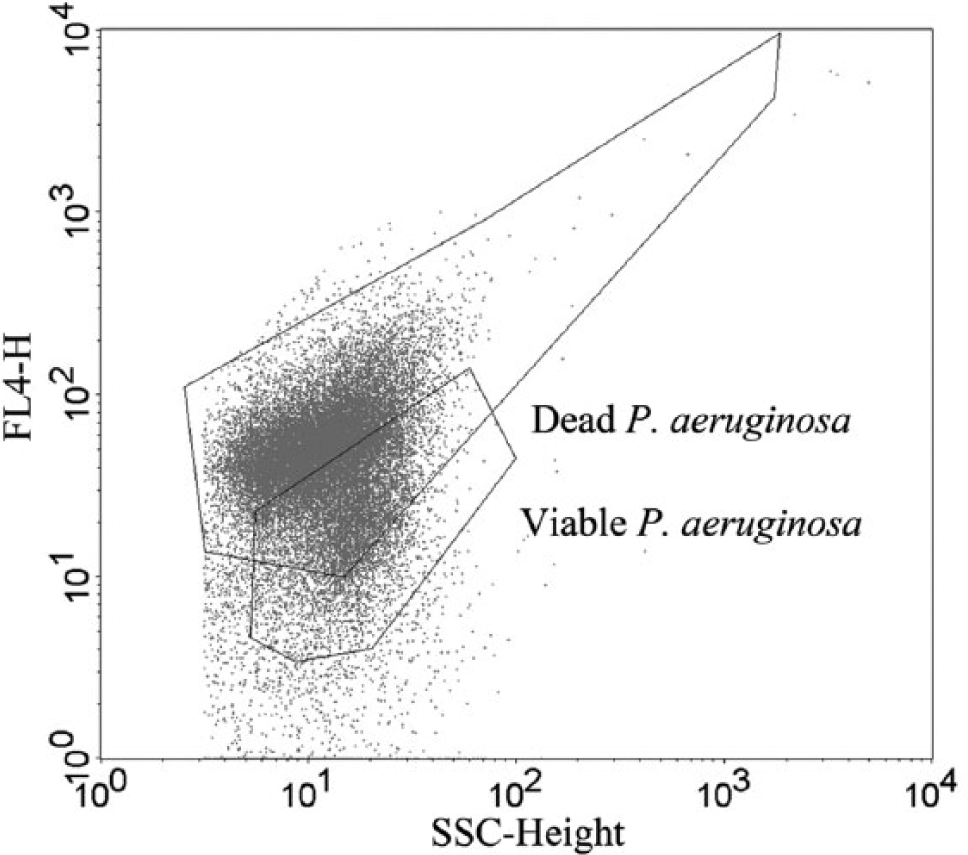
The side scatter (SSC)–fluorescence channel 4 (FL4) dotplot of a mixed P. aeruginosa sample.
Quantitative Analysis
For E. coli, B. subtilis, and S. aureus, quantitative analyses were performed. A good linear correlation (r2 > 0.99) was observed between 6×10³ and 6×10⁷ viable cells/mL (VC/mL) ( Fig. 3 ; Table 1 ). The lower limit of this linear range was determined by the limit of detection (3× the standard deviation of the blank). The onset of the plateau phase marked the upper end of the range. The excellent correlation between FCM and VPC confirms the feasibility of FCM quantification. For E. coli and S. aureus, both methods yielded statistically equivalent results, because the 95% confidence interval of the slope included “1” and the interval of the intercept included “0.” 8 Although the slope did not significantly differ from 1, a minimal relative bias was found for B. subtilis (intercept > 0).
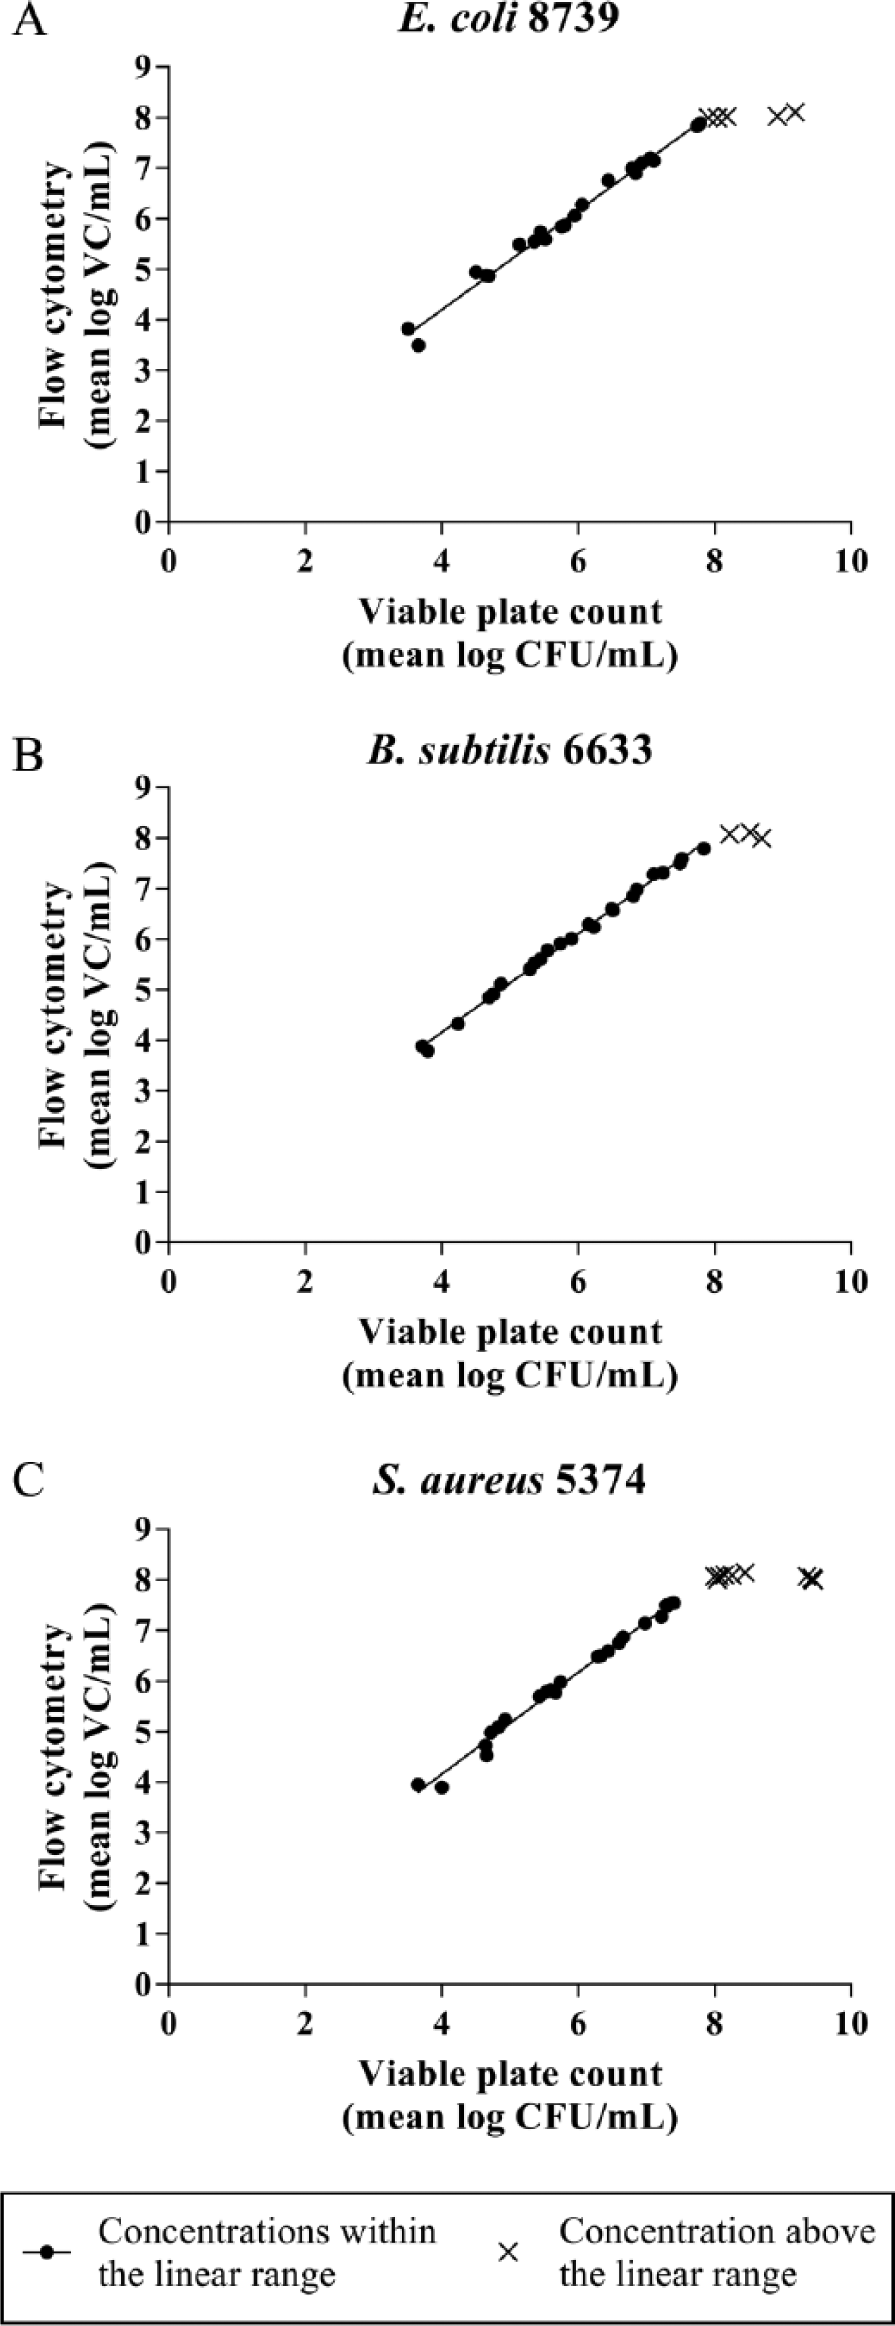
Comparison between the viable count/mL (VC/mL) as determined by flow cytometry and the amount of colony forming units/mL (CFU/mL) by viable plate counting for E. coli, B. subtilis, and S. aureus. (
Outcome Parameters of the Linear Regression Analysis for the Three Bacteria.
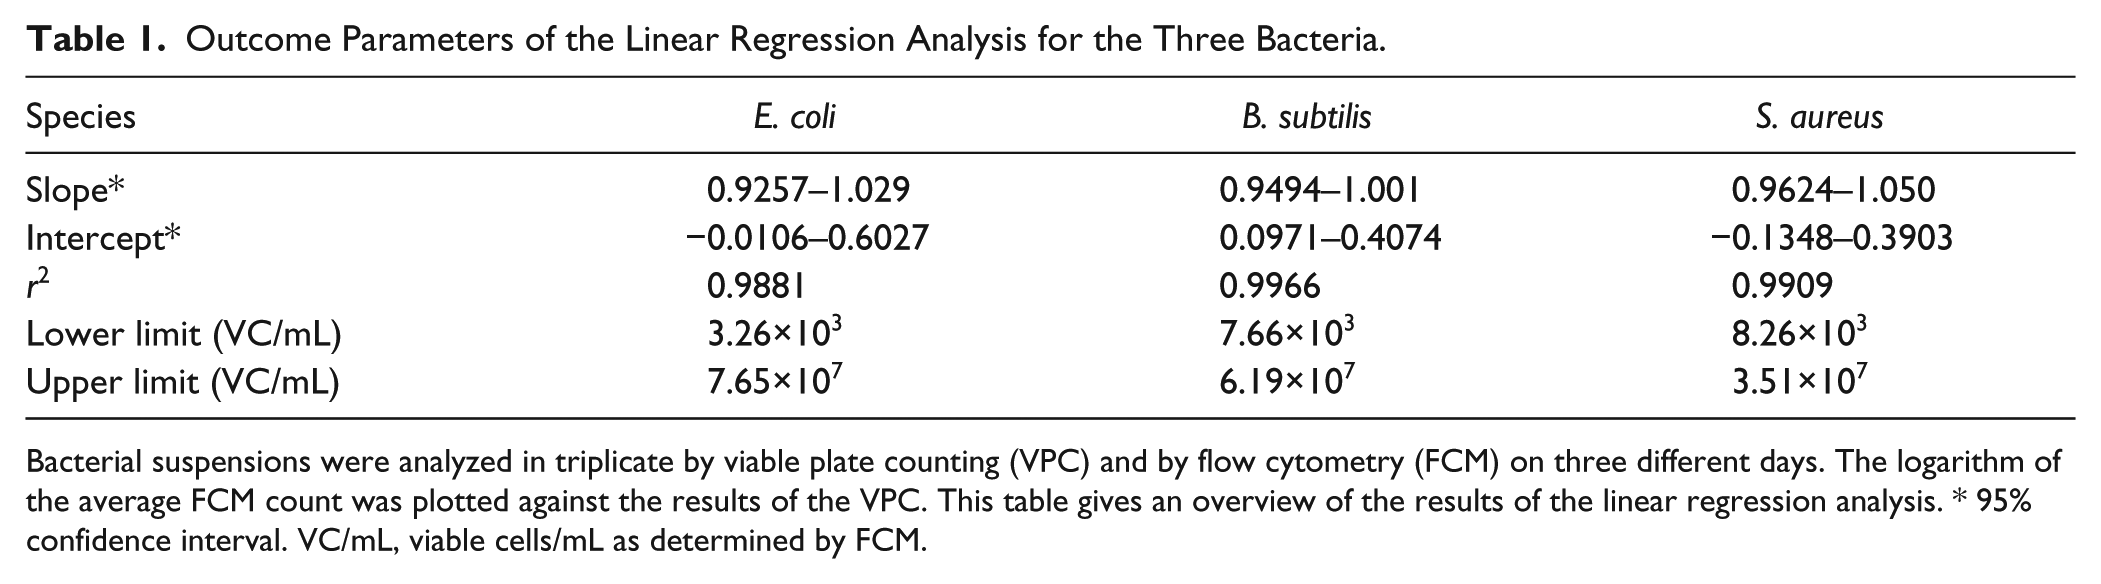
Bacterial suspensions were analyzed in triplicate by viable plate counting (VPC) and by flow cytometry (FCM) on three different days. The logarithm of the average FCM count was plotted against the results of the VPC. This table gives an overview of the results of the linear regression analysis. * 95% confidence interval. VC/mL, viable cells/mL as determined by FCM.
Precision Analysis
Every fifth sample of the dilution series, corresponding with the middle of the linear range, was analyzed 10 times by VPC and FCM. For each bacterial species, the CV was compared between both methods. FCM consistently yielded a lower CV than VPC, indicating a higher precision. The difference in CV was most pronounced for E. coli and B. subtilis ( Fig. 4 ).
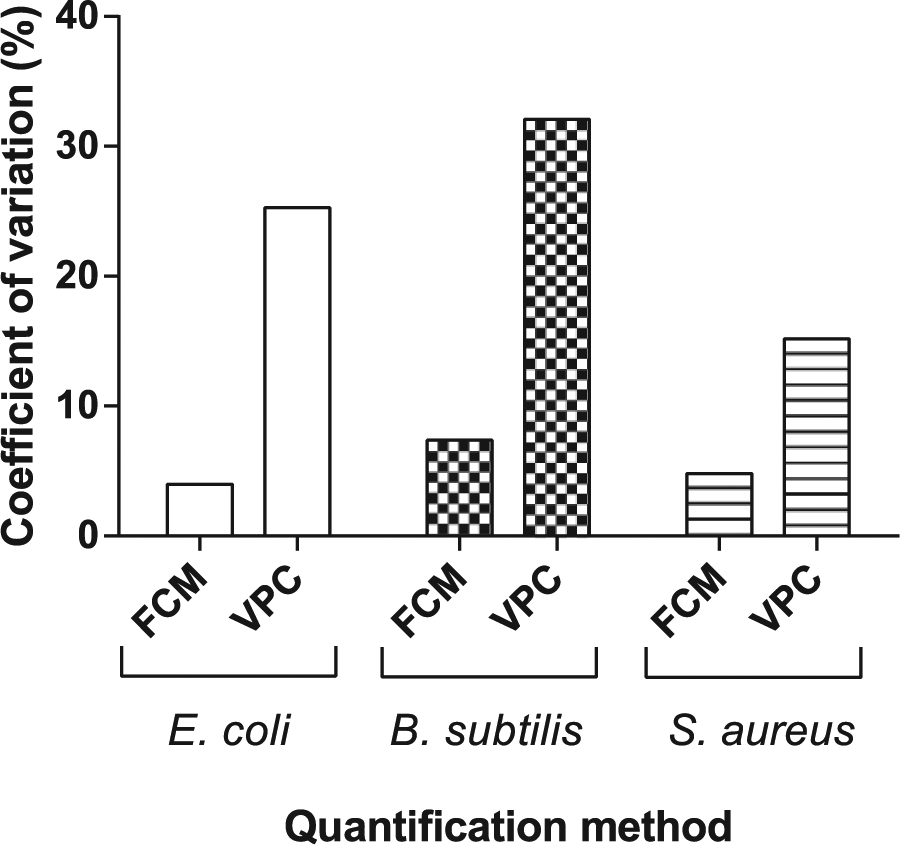
Coefficient of variation (CV) for flow cytometry (FCM) and viable plate count (VPC) quantification as determined from 10 repeated measurements of an identical sample of every bacterial species.
Growth Curve
Figure 5 shows the growth curves of E. coli in SCP (RT and on ice) and in TSB (RT). For SCP on ice, there was no significant increase or decrease in the amount of viable cells present during a period of 48 h. For both media at RT, a characteristic growth curve could be observed. A lag phase of approximately 2 h was followed by an exponential growth, which was the fastest for the TSB sample. A stationary phase was reached after 12 h and continued for at least 36 h. During the stationary phase, more viable cells were present in TSB than in SCP.
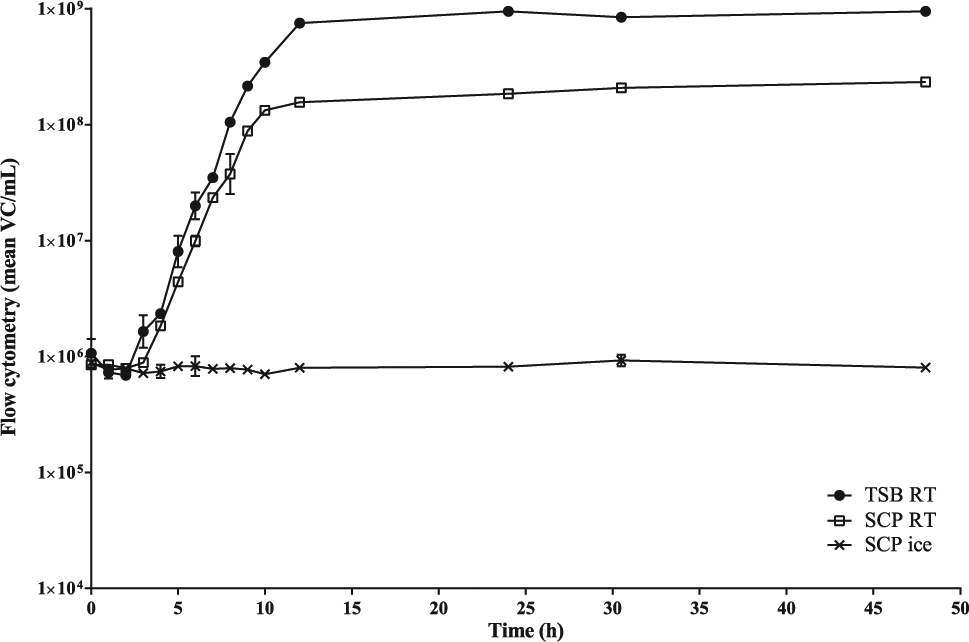
Growth curves of E. coli under different conditions: in sodium chloride peptone (SCP) on ice versus in tryptic soy broth (TSB), and in SCP at room temperature (RT).
Discussion
Quantification of microorganisms is important in a broad range of industries and settings. Within the pharmaceutical and food industry, quantification of bacteria supports quality control of the production process and of the end product. 4 For basic research purposes, inoculum concentrations need to be determined, whereas in applied research such as preclinical drug development, the amount of viable bacteria after treatment indicates drug efficacy. 10 Clinically, bacterial enumeration can be used for diagnostic purposes and presents an essential element of quality assurance (e.g., to monitor the effectiveness of disinfection procedures).11–12
Enumeration methods can be based on direct quantification, in which the organisms themselves are counted, or indirect quantification, in which the output parameter correlates with the amount of bacteria. Indirect techniques, such as quantitative PCR (qPCR), impedance, and turbidity measurements, require standard curves, but standards that accurately reflect exact quantities are not always available. 1 Although qPCR has proven to be a valuable method, sample preparation and processing can be relatively time-consuming. Moreover, the presence of inhibitory substances can greatly influence the reaction.5,13 For primer design, the organism needs to be identified, which is not always the case for environmental samples. 7 In addition, depending on the experimental setting, qPCR analysis does not support accurate discrimination between viable and dead bacteria. 5
Microscopy, VPC, and FCM are examples of direct quantification techniques. Despite its drawbacks, VPC is omnipresent. However, the method allows no real-time data acquisition and is labor-intensive, subjective, and growth-dependent. Considering the estimation that only 1% of all microorganisms is culturable on solid medium, most of them cannot be counted by VPC, nor does the technique allow the detection of viable but nonculturable cells (VBNCs), which are metabolically active but cease to divide under stress conditions, such as starvation and changes in oxygen concentration or temperature. 14 VBNCs can produce metabolites that compromise production processes. Moreover, pathogens can also occur in this state without losing their pathogenic abilities, which clearly highlights the importance of VBNC detection.4,15
Direct FCM counting poses an interesting alternative to VPC, because of its speed and its objective readout, combined with a high precision and the possibility of investigating different cellular parameters in just one analysis. 4
This study evaluated FCM-based quantification of TP3-stained bacteria in comparison to VPC as a conventional gold-standard technique. Our previous work showed that TP3 allows the discrimination of viable and dead C. albicans cells. 8 Dead cells showed strong fluorescence, because TP3 can pass the damaged membrane to bind dsDNA, which enhances its fluorescence intensity. Viable cells are stained as well but to a much lesser extent because TP3 binds to the outer cell wall structures. This article proves that the same approach can be applied to bacteria, which differ from yeasts in size, cell wall, and membrane composition.
The staining procedures for E. coli, B. subtilis, and S. aureus proved to be similar to the procedure for yeast cells, which improves the ease of use and enables analysis of mixed samples. Given this uniformity, it seems very likely that the same staining procedure can be applied to other bacterial species as well. Qualitative experiments on various other bacterial species, such as Lactobacillus rhamnosus GR-I, Enterococcus faecalis (clinical isolate), and Burkholderia cenocepacia LMG 16656, have confirmed this assumption (
FCM and VPC quantification correlated very well in the linear range of 6×10³ to 6×10⁷ VC/mL. Below the linear range, background noise interferes with the detection of the bacteria, leading to a high CV and an overestimation of the FCM count. Above the linear range, the FCM detector suffers from oversaturation, but this problem could be overcome by diluting the samples. As to the precision of both methods, CVs were smaller for FCM than for VPC, especially for E. coli and B. subtilis. Because these species form large colonies, which tend to coalesce, precise VPC becomes more difficult.
In the European Pharmacopoeia, SCP is recommended as commercial buffer to stabilize the amount of microorganisms. 9 Our FCM method was applied to investigate this assertion. E. coli was incubated in TSB and SCP at RT or on ice, and subjected to TP3 staining and FCM. Samples in SPC on ice maintained a constant cell number up to 48 h of incubation. At RT, however, a classical growth pattern could be observed, clearly emphasizing the importance of low temperatures to stabilize cultures during long experiments. This evaluation proved that our FCM technique can be used to assess bacterial growth, although different culture conditions may demand minor experimental modifications. Because cells grown in TSB were somewhat larger than cells grown on solid medium, the gates were readjusted to obtain optimal results.
Because a FACSCalibur is not equipped with a volumetric sensor, CB were added to each sample as an internal standard. Adding the beads to a sample led to a slightly higher fluorescent signal of the viable population owing to the presence of 0.1% Tween 20 in the CB solution. This nonionic surfactant enhances TP3 binding to bacterial cells by increasing membrane fluidity and therefore influences the position of the viable population in the SSC–FL4 dotplot. 18
It must be noted that despite the advantages of FCM, the technique also has its drawbacks compared with VPC. Although the latter is cost-effective and easy to perform, skilled technicians are needed to operate the flow cytometer and interpret the often complex data.19–20 Also, flow cytometers can be costly, although in recent years, prices have decreased and affordable bench-top flow cytometers have become commercially available.3,21–22
Our data clearly indicate that FCM using TP3 as a single-stain viability dye allows accurate bacterial quantification. FCM has previously been described as a useful tool for the enumeration of viable bacteria, but most studies combined two or more dyes. The LIVE/DEAD® BacLight™ kit is one of the most used stain combinations in this context. The kit, marketed by Invitrogen, contains the membrane-impermeable dye propidium iodide to mark dead cells and SYTO®9 to act as a counterstain.23–24 The addition of two dyes complicates FCM analysis due to spectral overlap and color compensation issues.25–27 Moreover, dual color viability staining saves fewer channels for the investigation of other cellular parameters. Other studies on single-stain FCM rarely focus on bacterial quantification or use indirect quantification approaches.28–30 Our TP3 assay enables direct counting of both viable- and dead-cell populations, making the addition of a counterstain redundant, whereas the unique spectral properties of TP3 offer an extra advantage. Because TP3 emission is located in the red end of the spectrum and only red laser light allows excitation, combination with other fluorochromes to assess additional cell parameters with minimal spectral overlap is feasible. 31 In addition, the uniformity of the staining protocol eliminates the need for species-specific optimization, as is the case with many viability stains, including the LIVE/DEAD® BacLight™ kit. 3
In conclusion, TP3 staining of bacteria for FCM quantification offers clear advantages compared with VPC and other FCM enumeration techniques, and it should be further explored in samples of pharmaceutical, environmental, or food origin.
Footnotes
Abbreviations
B. subtilis = Bacillus subtilis
C. albicans = Candida albicans
CB = counting beads
CFU/mL = colony forming units/mL
CV = coefficient of variation
dsDNA = double-stranded DNA
E. coli = Escherichia coli
FCM = flow cytometry
FL1 = fluorescence channel 1
FL4 = fluorescence channel 4
FSC = forward scatter
P. aeruginosa = Pseudomonas aeruginosa
qPCR = quantitative PCR
RT = room temperature
S. aureus = Staphylococcus aureus
SCP = sodium chloride peptone
SSC = side scatter
TP3 = TO-PRO®-3 iodide
TSA = tryptic soy agar
TSB = tryptic soy broth
VBNC = viable but nonculturable
VC/mL = viable cells/mL
VPC = viable plate count
Declaration of Conflicting Interests
The authors declared no potential conflicts of interest with respect to the research, authorship, and/or publication of this article.
Funding
The authors declared receipt of the following financial support for the research, authorship, and/or publication of this article: This work was supported by the Research Foundation—Flanders (FWO grant 24761) and by the University of Antwerp (BOF/GOA grant 25624). Monique Kerstens is a PhD fellow of the FWO—Flanders.