
Abstract
Methods for quantifying mixing in microfluidics have varied largely in the past, and various indices have been employed to represent the extent of mixing. Mixing between two or more colored liquids is usually quantified using simple mathematical functions operated over a sequence of images. The function, usually termed mixing indices, involves a measure of standard deviation. Here, we first review some mixing indices and then experimentally verify the index most representative of a mixing event. It is observed that the relative mixing index is not affected by the lighting conditions, unlike other known mixing indices. Based on this finding, the use of a relative mixing index is advocated for further use in the lab-on-a-chip community for quantifying mixing events.
Introduction
Mixing is one of the most fundamental challenges in microfluidics because of the laminar flow behavior at microscale. Enhancing mixing in microfluidics has thus been extensively studied in the past two decades and, being a quintessential function, will continue to be of interest to the lab-on-a-chip community. Generally speaking, mixing of fluids in microchannels can be achieved using either active or passive mixers.1,2 Regardless of the mixing mechanism, there exists a need for a proper criterion to gauge the extent of mixing. 3 Usually, mixing is quantified by processing a set of images to yield a meaningful index that is representative of the extent of mixing. On the images, different fluids are usually differentiated based on differences in light intensities received by a camera. A dye is often used to absorb transmitted light, reflect incoming light, or emit light itself for the camera recording. However, the extent of mixing remains incomparable throughout the wide spectrum of studies on microfluidic mixing. Indeed, none of the review papers have directly compared the mixing effects from different studies, and a few are replete with misleading comparisons. Why we cannot compare mixing events across different studies, even if the researchers use the same mixing quantification method, is primarily due to the following reasons: (1) some mixing quantification methods are very sensitive to the initial mixing conditions (slight interfacial diffusion will influence the value dramatically), (2) some methods give values that depend on the minimum pixel intensity in the image (any mixing event that involves dyes other than black will be problematic), and (3) in cases in which mixing is not 1:1, some methods will produce values that are out of the normal range.
Therefore, there is a need to set a common scale for quantifying the extent of mixing, making comparisons convenient across different studies. Here, we first summarize the various mixing indices and then establish a common index to gauge spatiotemporal mixing events more reliably.
Mixing Indices
Mixing indices are computed using intensities of pixels across a cross section of a gray-scale image that delineates a mixing event. The simplest index is calculated by taking the standard deviation, σ, of the pixel intensities,4–6 as shown in eq 1:
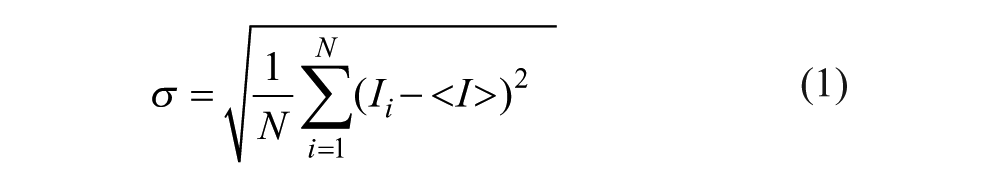
where Ii shows a local pixel intensity, <I> shows the average of the pixel intensities in the cross section, and N represents the total number of pixels.
This index attains the highest value when the fluids are unmixed and 0 if the fluids are homogeneously (completely) mixed. Although a measure of simple standard deviation yields information regarding the spread of data about the mean intensity, it is not a direct measure of the extent of mixing because the index possesses a dimension of intensity. Hence, comparison of mixing extent among different studies is not possible using this index.
The index can be rendered dimensionless by comparing the standard deviation to the mean intensity.7–16 For the sake of discussion, we call the ratio the absolute mixing index (AMI), and it can be computed from the following formula:
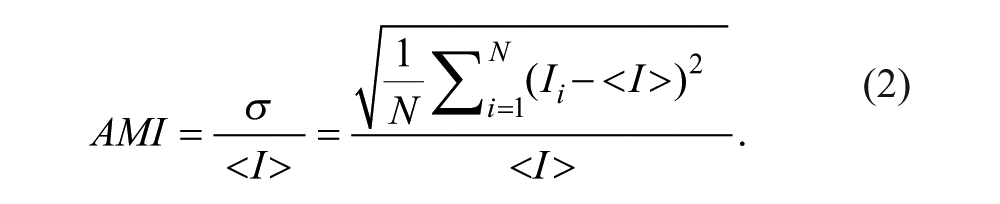
The aforementioned mixing index, on a scale of 0 to 1 (for 1:1 mixing), quantifies mixing, where 1 delineates an unmixed state and 0 a fully mixed state for the case in which one of the fluid streams yields a minimum pixel intensity of 0 (for instance, black ink that absorbs all the incoming light or a black field without emission of fluorescent light). Note that some researchers replace <I > with Imixed in the equation, which serves the same purpose, because Imixed should ideally equal <I >.
Although AMI is a direct measure of the mixing extent, it still cannot be used for comparing mixing in different studies. For example, two hydrodynamically identical mixing events would result in different absolute mixing indices if different lighting conditions are used, let alone the cases in which inks with dissimilar colors are used. Methods that tend to solve this problem include artificially rescaling (stretching) or normalizing each pixel to the same span of intensities as 0 to 255 on a gray-scale image, or 0 to 1. The mixing index obtained using eq 2 with modified intensity values should be called the absolute mixing index with modified intensities.
The process of rescaling and stretching intensities makes analysis and comparison an extremely tedious process. Therefore, a third kind of mixing index, which we name here the relative mixing index (RMI), also used in some earlier studies,17–20 precludes the need for any artificial pretreatment of the intensity data, such as stretching or rescaling. RMI can be computed by taking the ratio of the standard deviation of pixel intensities across a cross section to the standard deviation of the pixel intensities in the unmixed case, σ o , according to the formula as follows:
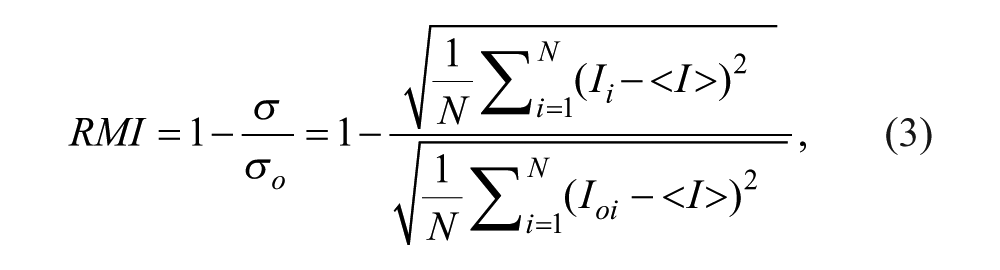
where Ioi represents the local pixel intensity in the unmixed state.
Note that although the ratio itself is quite versatile in making comparisons of the extent of mixing, it is a rather non-intuitive representation. Thus, a more subtle way to quantify a mixing event is by considering (1 – the ratio) in percentage form, which we can characterize as mixing efficiency or mixing ratio, so that the scale of RMI extends from 0 to 1, where 0 delineates the unmixed state and 1 the homogeneously mixed state.
Experimental
Experiments were conducted to record a specific mixing event at varied light intensities, with images recorded using two different types of optical microscopes with different lighting directions. The extent of mixing was then compared using both AMI and RMI. A 7.92 ×10⁻⁴ mol/L solution of blue dye (Erioglaucine disodium salt, Acros Organics) was allowed to mix with deionized (DI) water in a micro T-channel ( Fig. 1 , left), which was fabricated using polydimethylsiloxane soft lithography.
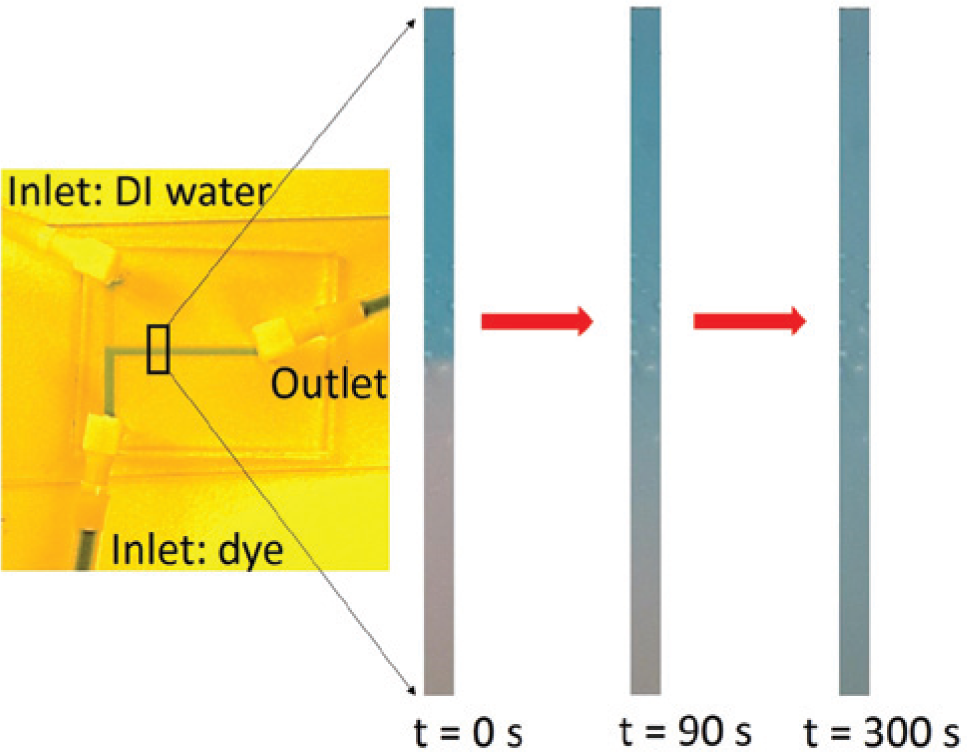
(Left) A simple T-channel used for the experiments. (Right) Sequence of images showing the diffusion of blue-dyed solution in water at three different time intervals, with the first image representing the unmixed case.
Holes were punched into the polymer to create inlets and outlets for the passage of fluid. The chip was then plasma bonded onto a glass slide. Inserts and tubing were attached to the two inlets of the microchannel on one end and to plastic syringes on the other to ensure fluid flow without any leakages. An insert with tubing was attached to the outlet of the T-channel as a means to exhaust fluid. The syringes—one comprising the blue-dyed solution and the second DI water—were mounted onto a syringe pump (KDS 210). The fluidic chip was placed under a Nikon microscope (MM400) attached to a camera (Nikon DS, Fi2 5 megapixel) to capture videos and images (10×) in real time. The KDS pump was programmed to dispense fluids at 0.5 mL/min until a sharp interface was observed between the dyed solution and the DI water stream. Significant time was allowed for the system to reach equilibrium before the measurements were made. The image at time t = 0 s was taken during the duration the pump was active. The pump was stopped, and a stopwatch was started; images were taken at various time intervals to capture the entire diffusion event ( Fig. 1 , right). The experiments were performed for varied light intensities (labeled as bright, dark, and darkest) using reflected light. Later, an experiment was performed under a stereomicroscope (Leica EZ4 HD), and images were captured at specified time intervals with transmitted light.
The images were analyzed using a Matlab code to determine AMI and RMI. Results for the different cases are presented in Figure 2 . As is evident, the AMIs deviate considerably for the same hydrodynamic mixing event at varied light conditions, whereas the computed RMIs have an excellent agreement irrespective of the light intensity.
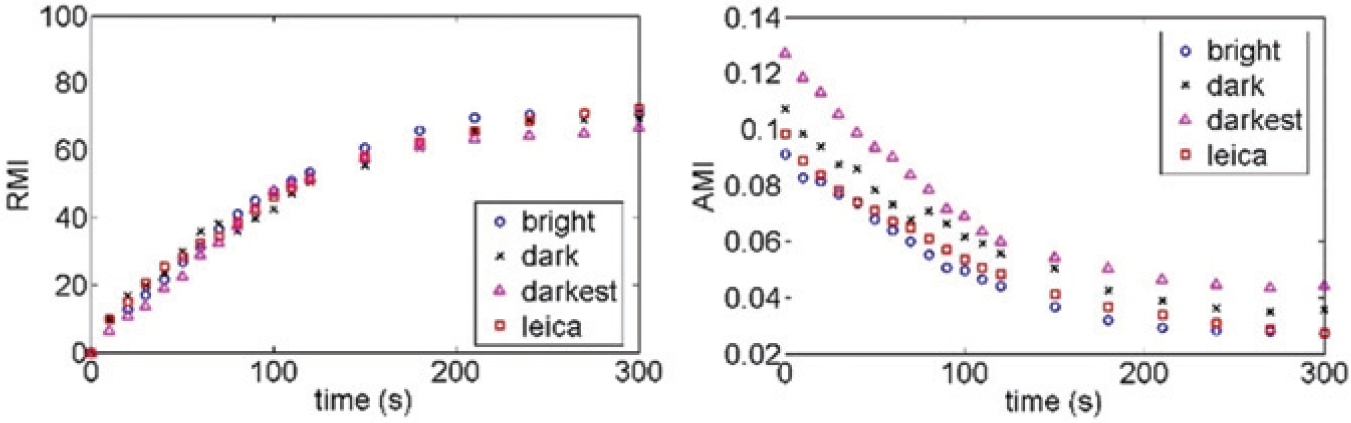
The graphs delineate the relative mixing index and absolute mixing index for the same mixing event at different light intensities under different types of microscopes. A significant deviation between absolute mixing indices and an excellent agreement between the relative mixing indices advocate the use of the relative mixing index as a measure of the mixing extent.
The caveat regarding the various mixing indices is that the entire characterization of mixing is based on the distribution pattern of the intensity values of the pixels within the span of the minimum and maximum intensities. However, this span depends on many factors, such as lighting conditions and dye color. Thus, AMI is not an effective method of quantifying mixing events, except for cases in which one of the fluids is absolutely black on the image. In RMI, the temporally evolving distribution pattern of the pixel intensity values is always compared with the initial distribution. Hence, RMI as an index is insensitive to variation in light intensities as well as to the color of the dyes involved, provided the diffusion coefficient remains constant.
Because each biochemical event has its own characteristic time, it is very important to have a clear comparison of the mixing extent at different times. By quantifying one such mixing event under various light intensities and two different types of optical microscopes, we have demonstrated that AMI is not an accurate representative of the mixing extent. Owing to the insensitivity of RMI to light intensities, dye color, and span of intensity distributions, we advocate its use for future research in the scientific community.
Footnotes
Acknowledgements
We thank DARPA for the financial support.
Declaration of Conflicting Interests
The authors declared no potential conflicts of interest with respect to the research, authorship, and/or publication of this article.
Funding
The authors disclosed receipt of the following financial support for the research, authorship, and/or publication of this article: We thank the financial support from the DARPA Young Faculty Award through grant N66001-11-1-4127.
References
Supplementary Material
Please find the following supplemental material available below.
For Open Access articles published under a Creative Commons License, all supplemental material carries the same license as the article it is associated with.
For non-Open Access articles published, all supplemental material carries a non-exclusive license, and permission requests for re-use of supplemental material or any part of supplemental material shall be sent directly to the copyright owner as specified in the copyright notice associated with the article.