
Abstract
High-resolution melting (HRM) has garnered significant interest as an analytical technique for a number of applications, including DNA methylation detection, due to its inherent sensitivity and robustness. In this study, we describe a miniaturized assay platform for quantitative methylation density analysis using a microfluidic droplet array cartridge. We demonstrate that the DNA methylation level of the RASSF1A promoter can be directly analyzed using HRM. PCR products were generated by amplifying bisulfite-treated DNA with varying CpG densities using CpG island-flanking primer sets. Subsequent HRM analysis on the miniaturized droplet platform shows distinct melting curve profiles associated with methylation levels, which was verified using a conventional benchtop PCR-HRM system. The characteristic melting temperature (Tm) of the PCR products was used to directly quantify the respective levels of DNA methylation density. Our approach provides a key advantage over current gold standard methods such as methylation-specific PCR (MSP), which are incapable of providing specific information regarding the overall methylation density of the target genes. The miniaturized platform establishes a practical approach to methylation density profiling from multiple DNA samples with a potential application in point-of-care diagnostics.
Introduction
Methylation of the promoter regions of genes is an epigenetic phenomenon that plays an important role in the modulation of gene activity and the biology of cancer.1,2 In particular, high methylation levels in tumor suppressor genes have been correlated with gene silencing and are being studied as a promising biomarker for cancer diagnostics. 3 One of the most routinely used techniques to perform methylation studies is methylation-specific PCR (MSP). This technique can perform a binary assessment of the methylation status in gene promoters, 4 and we have previously demonstrated a microfluidic droplet-in-oil platform capable of performing a panel of MSP reactions. 5 However, CpG methylation in clinical samples is heterogeneous both globally as well as locally, which makes it impractical to design MSP primers specific to more than a few CpG methylation patterns. 6
High-resolution melting (HRM) is a post-PCR analytical technique that measures the fraction of double-stranded DNA (dsDNA) in a sample as a function of temperature, monitored fluorimetrically using dsDNA-binding dyes ( Fig. 1A ). Since the energy needed to break the hydrogen bonds between the hybridized DNA strands depends on the sequence characteristics such as length and guanine-cytosine content (GC), the melting profile is intimately correlated with the amplicon sequence. Recently, HRM has also been extended to applications in DNA methylation detection and quantification6–14 by combining it with bisulfite conversion and PCR. Bisulfite conversion is a technique commonly employed in the study of DNA methylation, where unmethylated cytosines in DNA samples are chemically converted into uracils, while methylated cytosines are preserved ( Fig. 1B ). After amplification with PCR, highly methylated DNA templates will contain a higher GC content compared with unmethylated templates, resulting in a higher melting temperature ( Fig. 1C ). While conventional MSP assays provide only a binary assessment of methylation status and are highly dependent on the design of primer regions, the combination of PCR-HRM with bisulfite conversion requires only a pair of methylation-independent PCR primers and can also provide information regarding the extent of CpG methylation density. As such, it is a practical approach for diagnostic assays where the sample methylation profile is unknown.
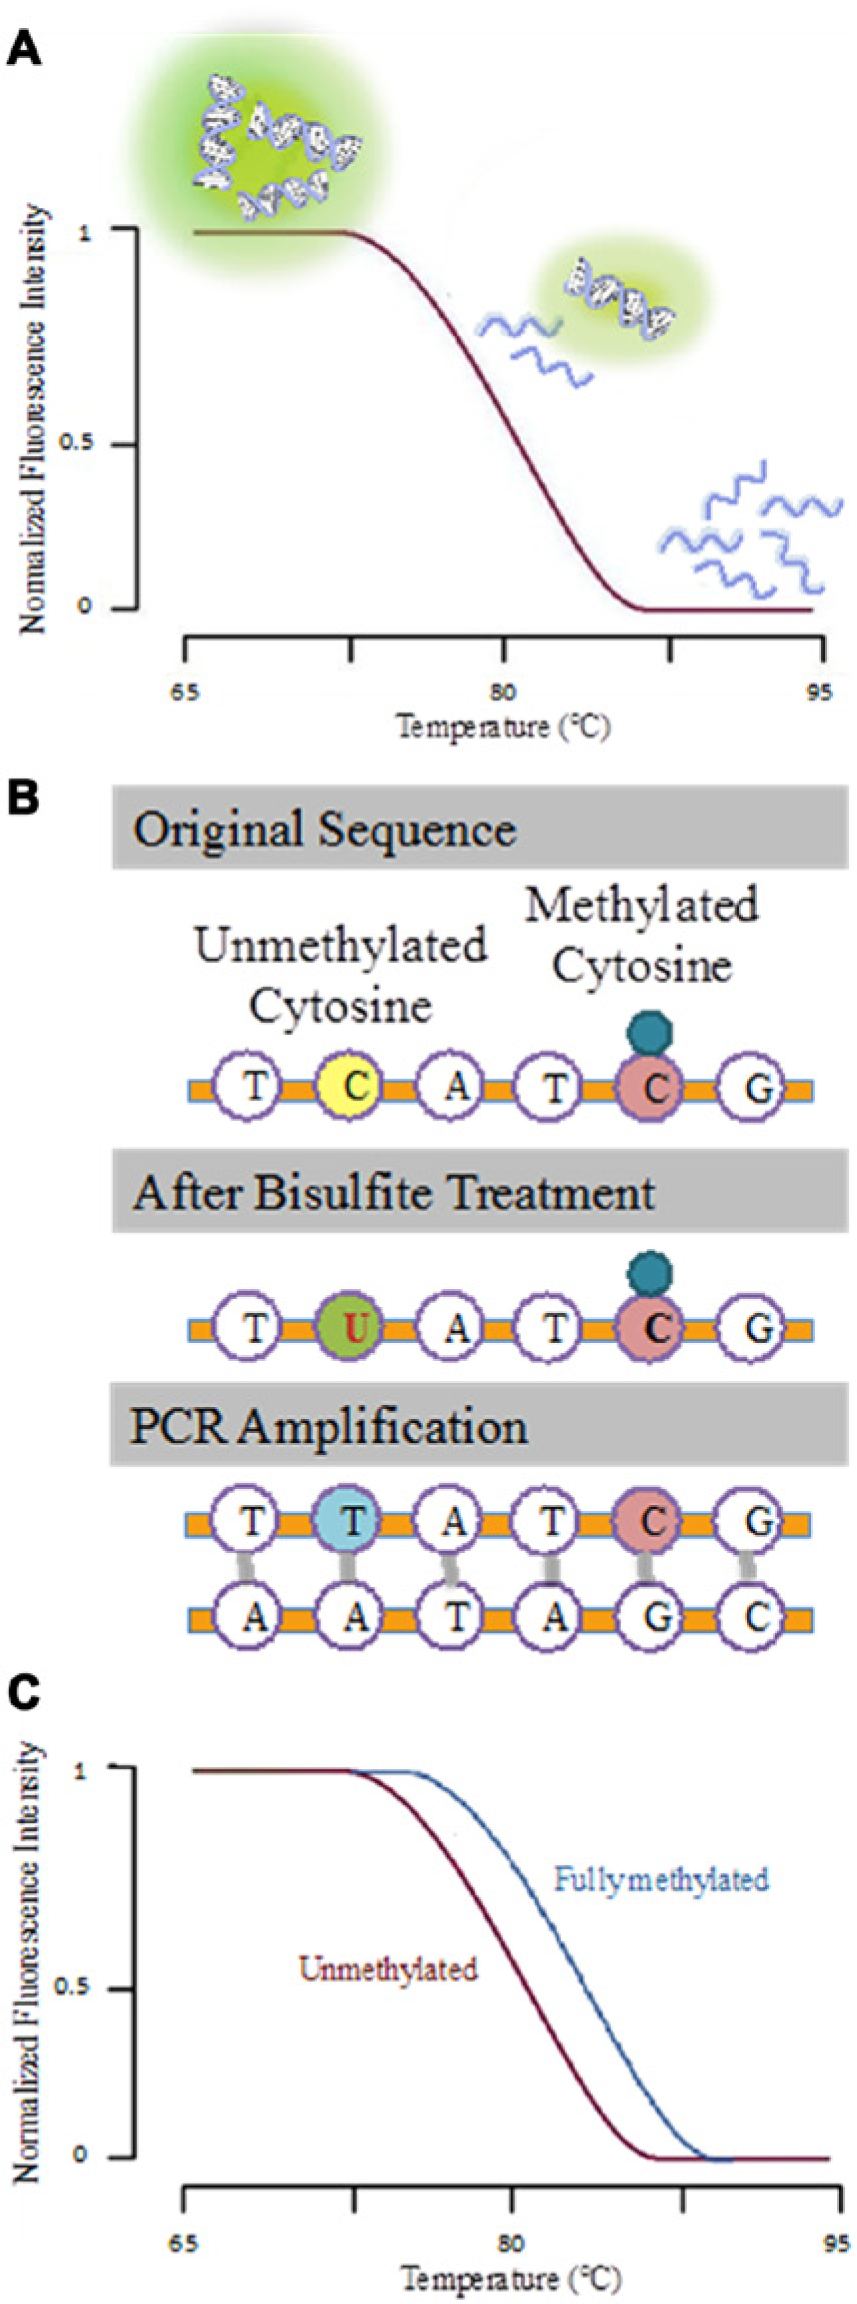
Principle of melting curve analysis. (
In this report, we present a miniaturized platform consisting of a motorized fluorescence detection module and a customized heating unit, designed to parallelize DNA melting curve analysis on an array of reaction droplets. We demonstrate the functionality of our platform for cancer-specific methylation profiling by performing CpG methylation density analysis on differentially methylated RASSF1A gene targets and comparing the results from a conventional real-time PCR machine. Our platform uses only a fraction of sample volume used in conventional instruments, which has the benefit of reduced input requirement for the user. In addition, the reduced thermal mass of sample allows controlled DNA melting using a simple, portable temperature control unit. The advantages of miniaturization are specifically applicable to diagnostic platform development for global health, where developing countries can be equipped to perform melting curve analysis on DNA methylation density without the costly PCR-HRM instrument.
Materials and Methods
Target DNA Sequences
The RASSF1A promoter sequence was obtained from the GenBank database of the National Center for Biotechnology Information (NCBI, http://www.ncbi.nlm.nih.gov, March 5, 2013). As a proof of concept, we selected four different CpG methylation density levels within a 201-bp DNA fragment within the RASSF1A gene containing a total of 16 CpG sites, including 0% (unmethylated) and 31.25%, 68.75%, and 100% (fully methylated), as shown in Table 1 . Unmethylated human genomic DNA (Promega, Madison, WI) and CpG methylated HeLa genomic DNA (New England Biolabs, Beverly, MA) were selected as the 0% and 100% methylated DNA targets, respectively. Then, 2 µg of each genomic DNA was bisulfite converted prior to each PCR reaction using the methylation-on-beads (MOB) technique described by Bailey et al. 15 For 31.25% and 68.75% methylated DNA targets, we created 201-bp synthetic dsDNA with the sequence composition of bisulfite-treated DNA using fusion PCR.
Bisulfite-Treated DNA Sequences of the RASSF1A Gene with Different Methylation Densities.
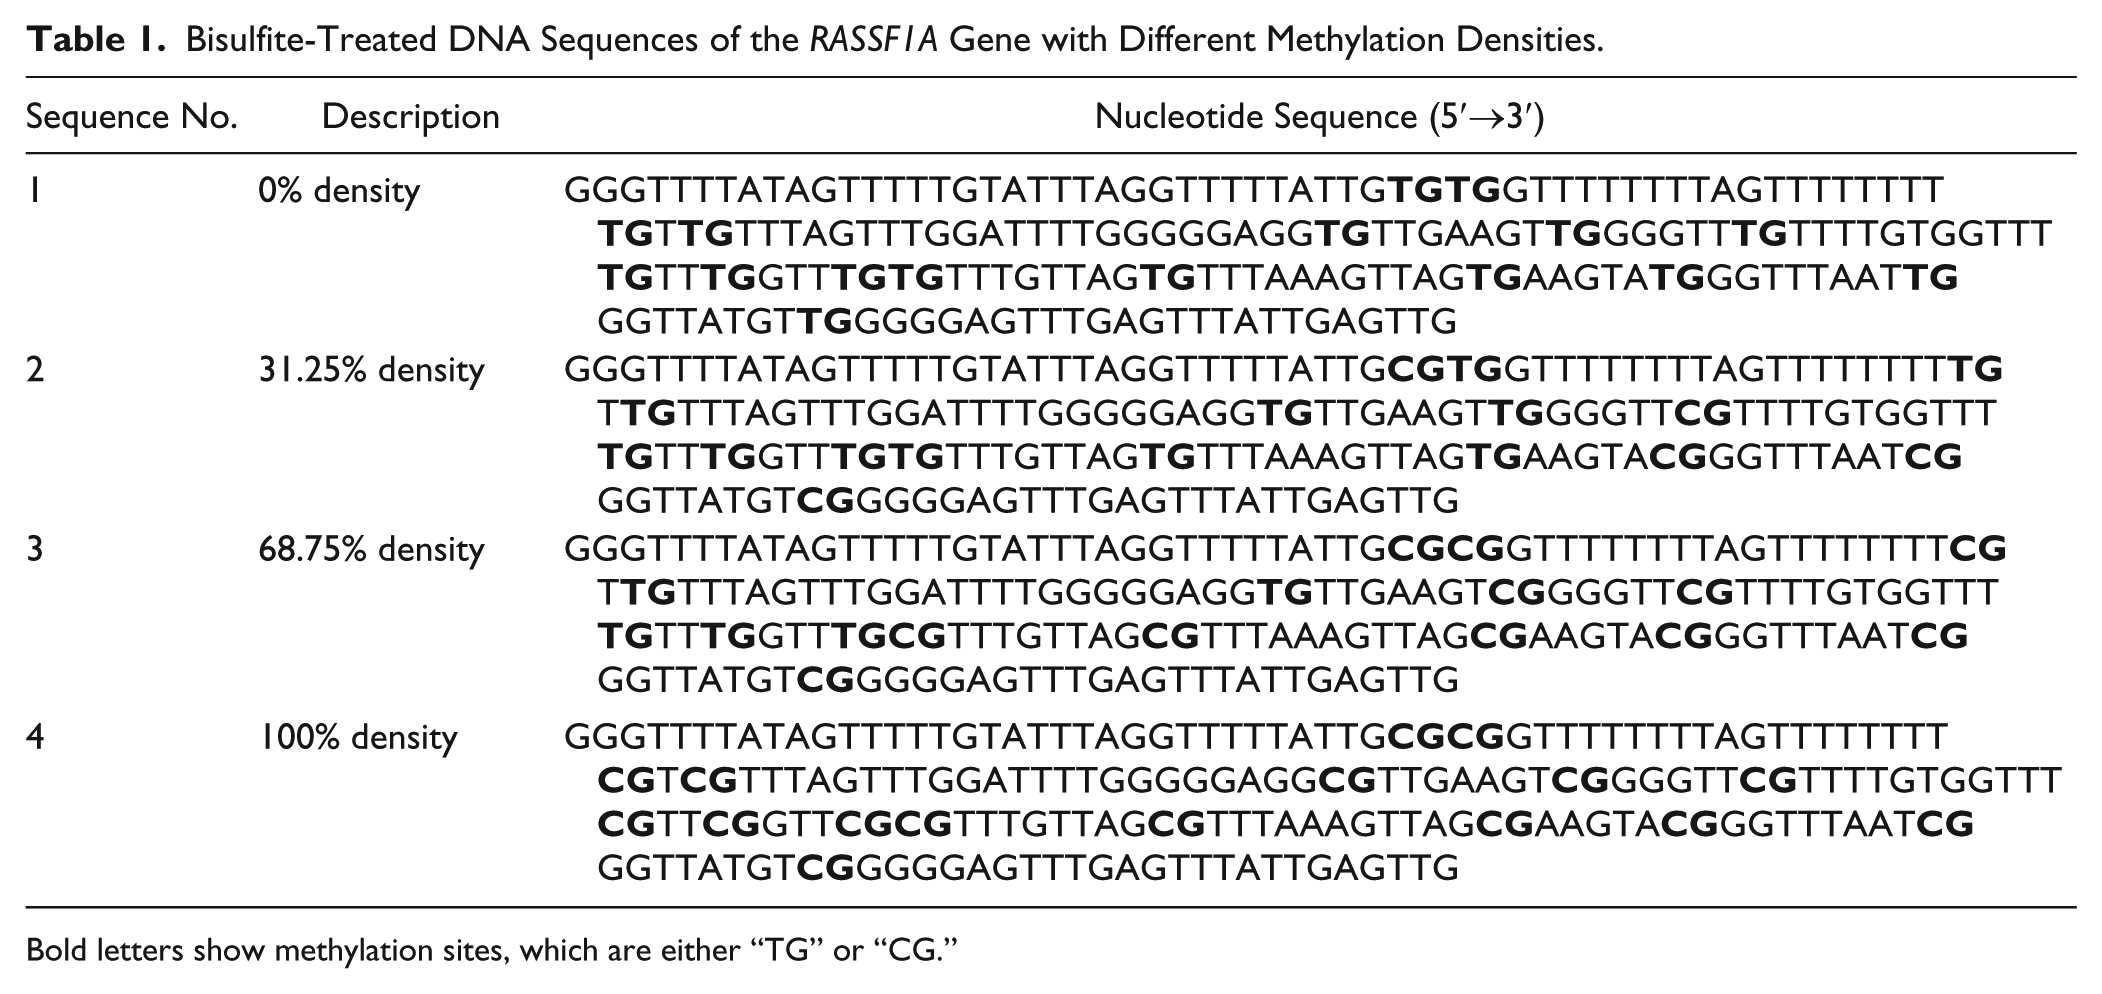
Bold letters show methylation sites, which are either “TG” or “CG.”
Fusion PCR to Create Different Methylation Density Targets
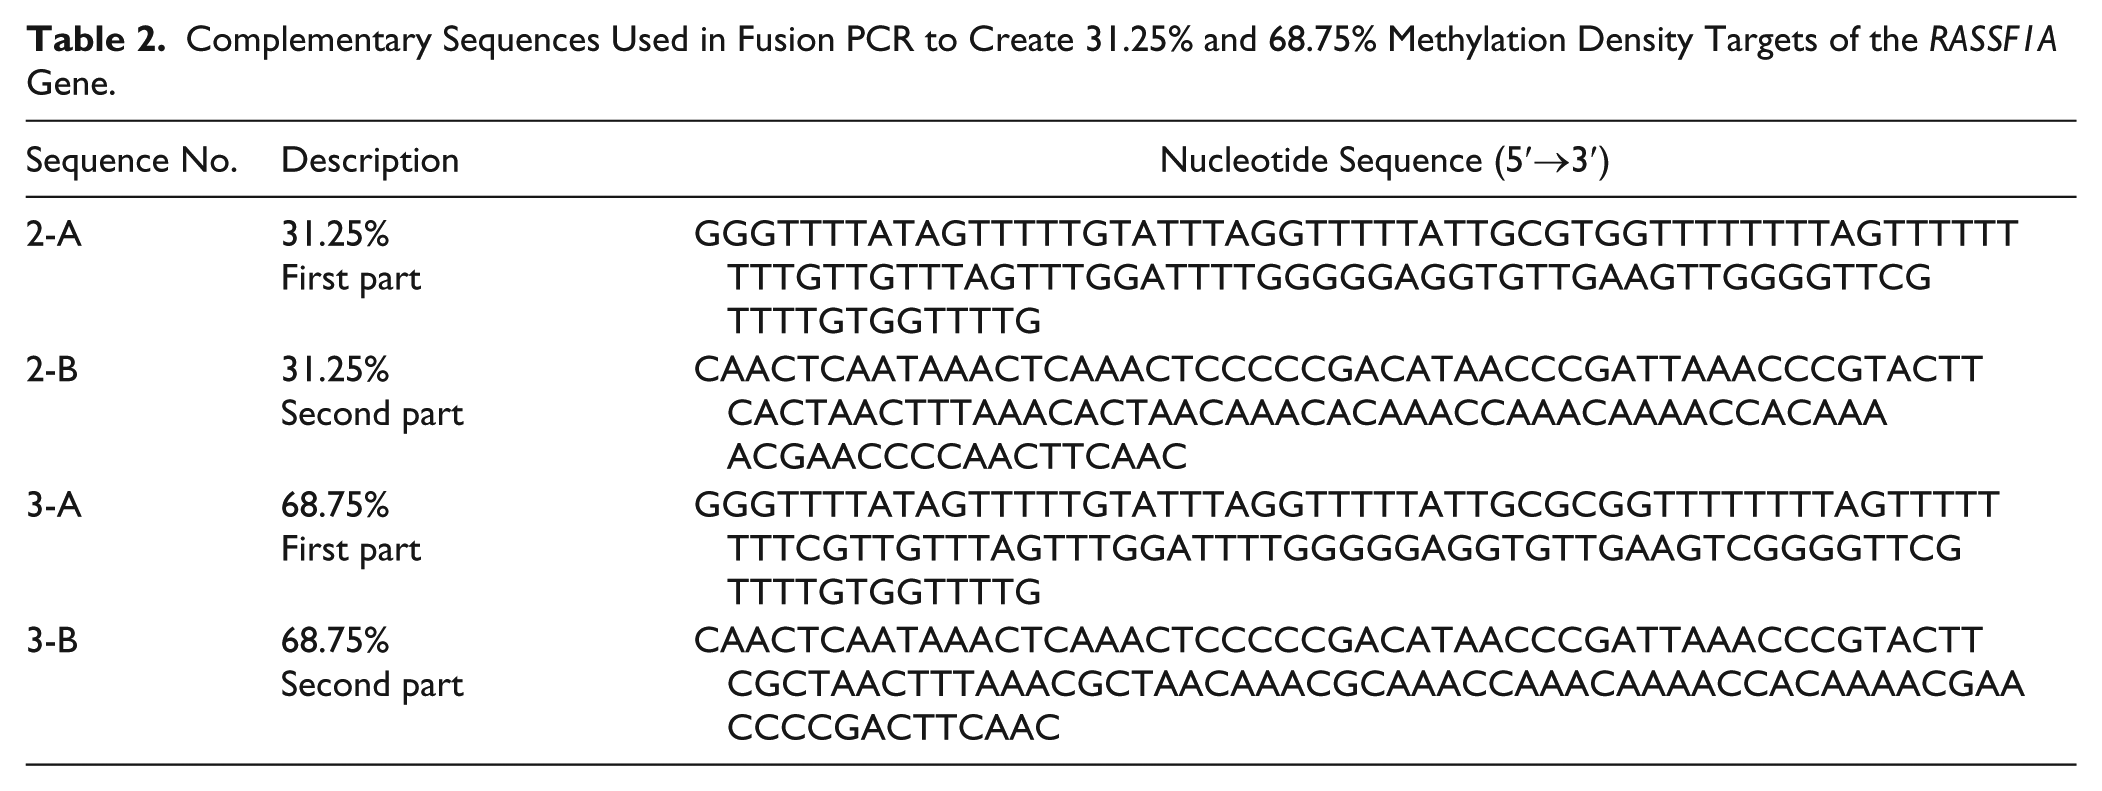
To create synthetic DNA targets with 31.25% and 68.75% methylation densities, the 201-bp RASSF1A DNA template was assembled from synthetic DNA strands with 3′ complementarity and 5′ overhangs, as shown in Figure 2 by strand elongation with Bst 2.0 WarmStart DNA polymerase (New England Biolabs). Synthetic DNA strands were purchased from IDT DNA Technologies (IDT DNA, Coralville, IA). Complementary sequences used for fusion PCR are listed in Table 2 . The reactions contained 0.2 µM each of the fragments, 20 mM Tris-HCl, 10 mM (NH4)2SO4, 50 mM KCl, 10 mM MgSO4, 0.1% Tween 20, 1 mM dNTPs, and 16 U of Bst polymerase in a total reaction volume of 25 µL. Each reaction was incubated at 65 °C for 1 h and heat inactivated at 80 °C for 20 min. The products were purified by illustra MicroSpin G-50 columns (GE Healthcare, Waukesha, WI) and verified based on length using agarose gel electrophoresis (data not shown).
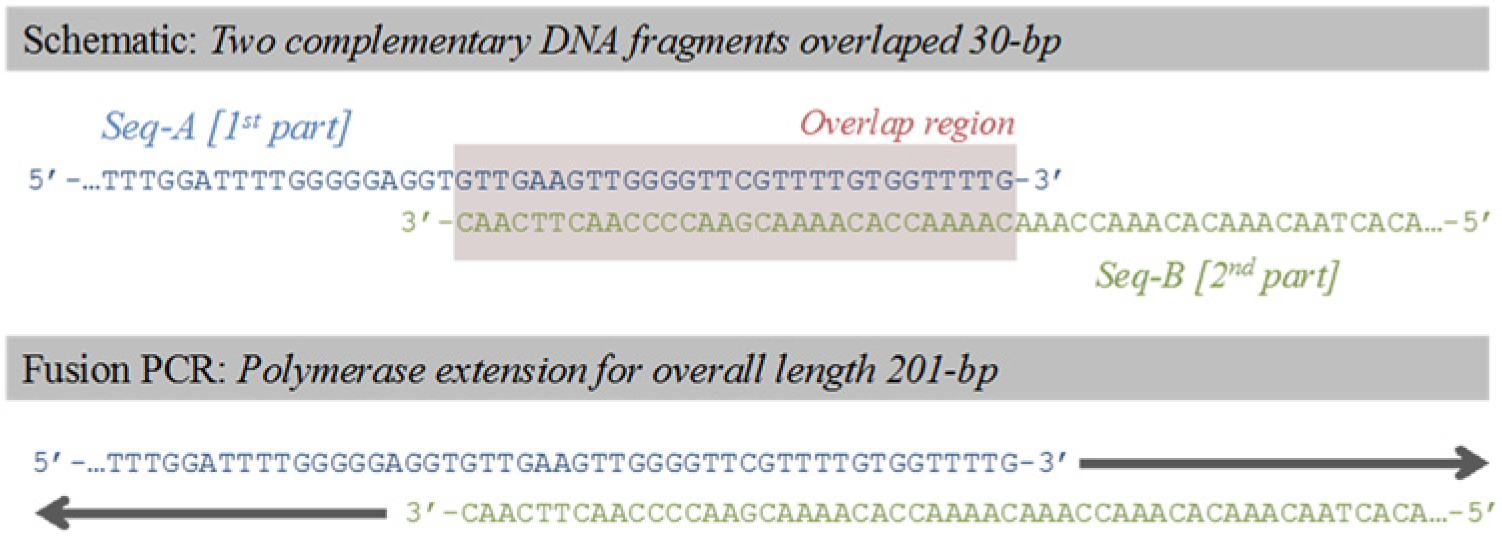
Schematic for fusion PCR to synthesize 31.25% and 68.75% methylation density DNA sequences. The product obtained from this process is a 201-bp double-stranded DNA sequence.
Complementary Sequences Used in Fusion PCR to Create 31.25% and 68.75% Methylation Density Targets of the RASSF1A Gene.
PCR Amplification
To account for thermal variation across the reaction wells, we used a pair of temperature calibrators 16 as an internal control. The sequences used were the low-Tm calibrator (5′-TTA AAT TAT AAA ATA TTT ATA ATA TTA ATT ATA TAT ATA TAA ATA TAA TA/3SpC3/-3′) and high-Tm calibrator (5′-GCG CGG CCG GCA CTG ACC CGA GAC TCT GAG CGG CTG CTG GAG GTG CGG AAG CGG AGG GGC GGG/3SpC3/-3′). The primers used to amplify bisulfite-treated DNA were RASSF1A-F[orward] (5′-GGG TTT TAT AGT TTT TGT ATT TAG GTT-3′) and RASSF1A-R[everse] (5′-CAA CTC AAT AAA CTC AAA CTC CC-3′) 10 and were designed to specifically amplify the bisulfite-converted target sequence. Each 25-µL PCR reaction consisted of 2 µL target DNA containing approximately 1000 copies of DNA, 1× PCR buffer (Qiagen, Valencia, CA), 2 nM fluorescein, 1× Evagreen (Biotium, Hayward, CA), 2 nM MgCl2, 0.1 µM temperature calibrators sequences (IDT), dNTPs (0.2 mM each), 0.05 U/µL of HotStartTaq DNA polymerase (Qiagen), and 0.2 µM each of RASSF1A-F and RASSF1A-R primers. Thermal cycling conditions were 95 °C for 15 min, followed by 60 cycles of 95 °C for 30 s, 60 °C for 30 s, and 72 °C for 30 s.
High-Resolution Melting Using a Commercial Instrument
Directly after PCR amplification, HRM was subsequently performed on a 96-well plate using a commercial PCR-HRM instrument (CFX96 Touch; Bio-Rad, Hercules, CA). The temperature was ramped from 55 °C to 95 °C at a rate of 0.2 °C per second, and data analysis was performed using CFX Manager Software (Bio-Rad) followed by two-point alignment using low-Tm and high-Tm calibrator peaks. First, low-Tm peaks of each derivative melting curve were aligned to 62 °C, and then the entire curve was scaled along the temperature axis such that the high-Tm peaks were aligned at 92 °C. 16
Microfluidic Device
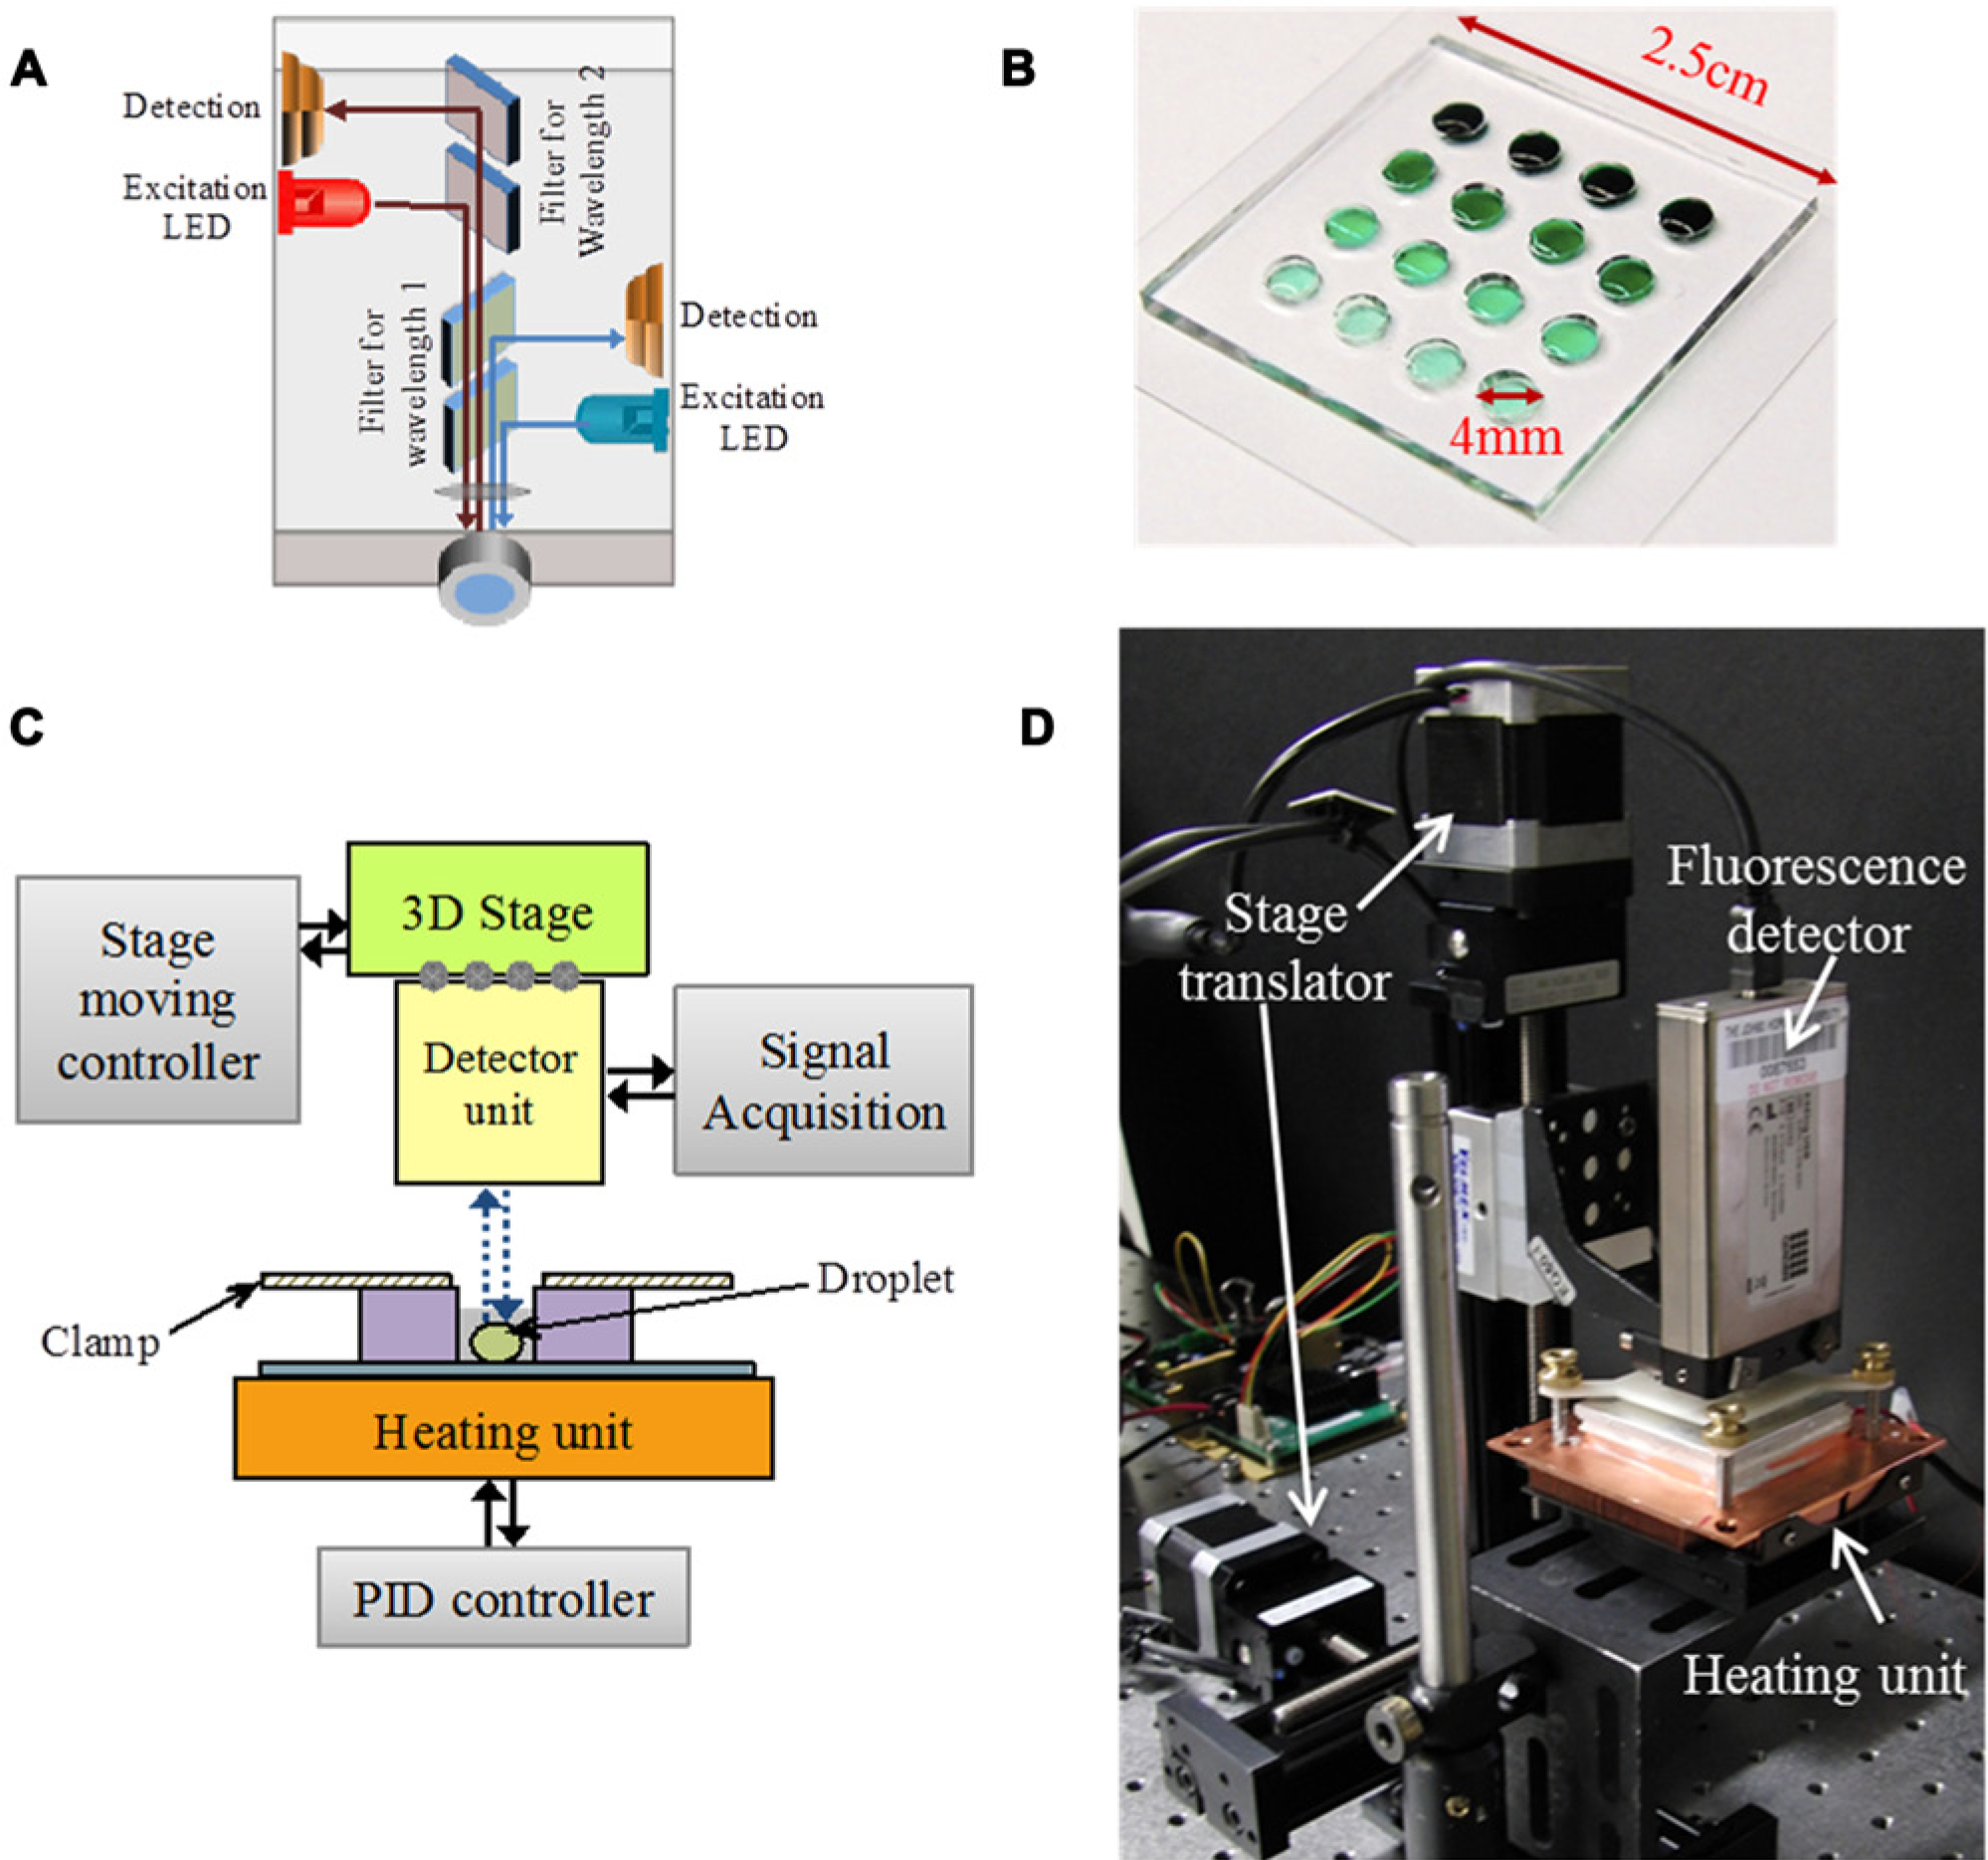
Streamlining biochemical assays and lab automation can greatly benefit from microfluidics and its interfacing with conventional instrumentation.17,18 We developed a droplet microchip coupled with a miniaturized analyzer for automatic methylation detection via HRM analyses. The device was fabricated using standard soft lithography techniques. Polydimethylsiloxane (PDMS) (Dow Corning, Midland, MI) was mixed at a 10:1 base-to-crosslinker ratio and cast on a flat surface at a 2-mm thickness at 80 °C for 25 min. The PDMS sheet was processed with a 4-mm diameter biopsy punch to generate a 4 × 4 circular aperture array (16 chambers total) with a 2-mm separation between each well. The processed PDMS was cut to 2.5 × 2.5 cm and bonded to a No. 1 thickness borosilicate cover slip (Fisher Scientific, Pittsburgh, PA) via oxygen plasma treatment and then baked at 80 °C for 15 min. Afterward, all reaction chambers were dip-coated using Teflon to prevent adhesion between droplets and their respective chamber walls. The device was overlaid with mineral oil, followed by degassing for 15 min before use to prevent bubble formation during the temperature ramping process.
High-Resolution Melting on Device and Signal Processing
Each HRM experiment on the miniaturized system was performed with 2 µL PCR product loaded into each well. First, the temperature was held at 55 °C for 1 min followed by temperature ramping at a rate of 0.1 °C per acquisition step from 55 °C to 100 °C. Each acquisition step consisted of fluorometric measurement in a well followed by motorized translation of the detection unit into subsequent well ( Fig. 3 ). The temperature was held constant at each acquisition step until all wells were measured. Afterward, the raw data obtained from the miniaturized platform were normalized by background subtraction and temperature calibrator–mediated curve alignment. Sample fluorescence (F) solely attributed to dsDNA dissociation events was extracted from the raw profile by subtracting the background fluorescence modeled as an exponential function of temperature. 19 Afterward, taking the negative derivative as a function of temperature (–dF/dT) for each melt curve resulted in a DNA dissociation profile. For every dissociation profile, the low-Tm calibrator peak was first aligned to 62 °C, and the curve was scaled along the temperature axis until the high-Tm calibrator peak was aligned at 92 °C. 16
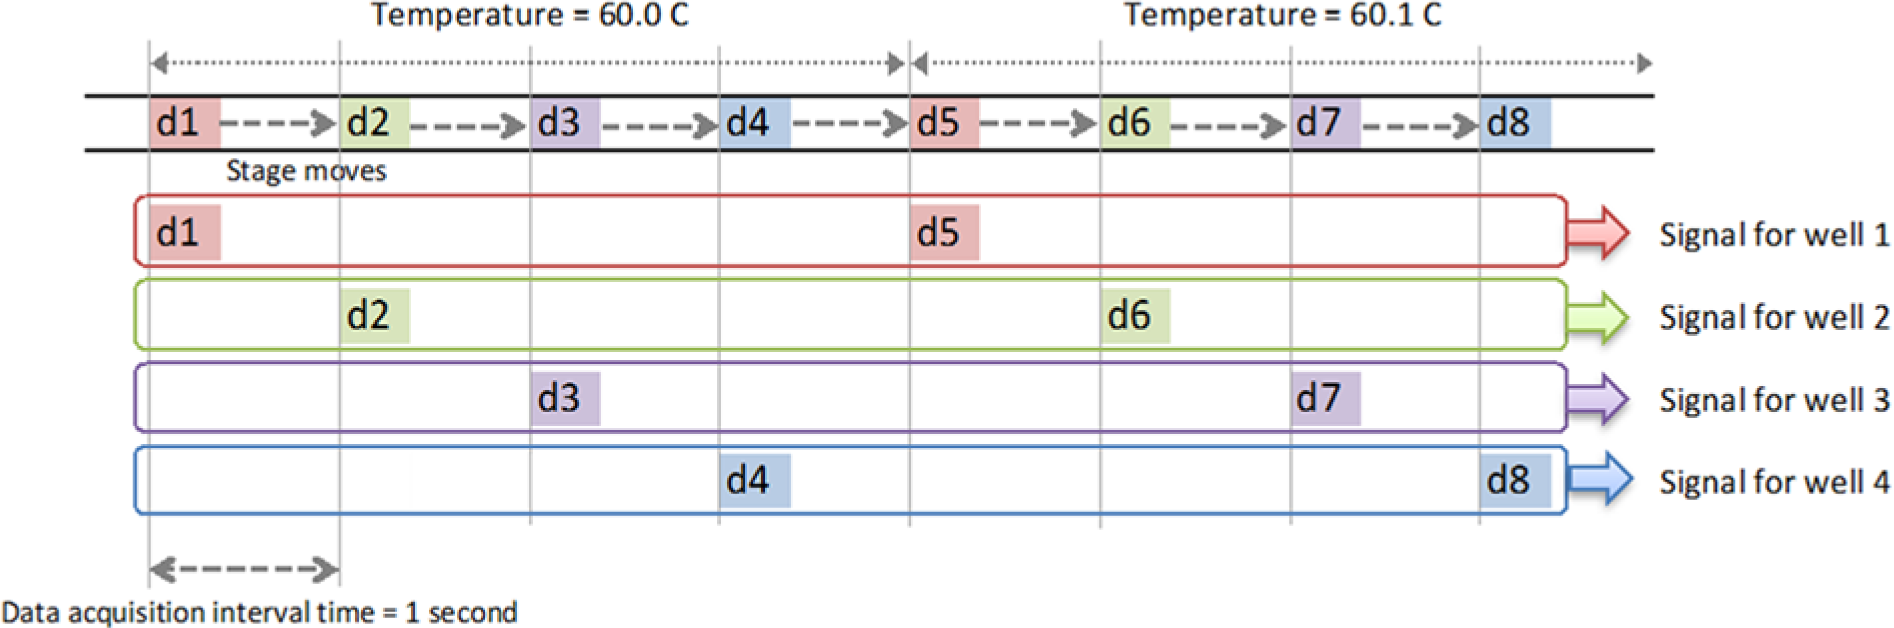
Timeline for signal acquisition from four wells. The data points d1, d2, d3, . . . are collected sequentially. The detector collects fluorescence data d1 at the first well and then moves to the second well and obtains data d2 and so on. The data d1 to d4 are the fluorescence intensity of four wells acquired at 60.0 °C, and the next loop d5 to d8 are acquired at 60.1 °C, at 0.1 °C incremental steps. To analyze the result, the sequential signal was sorted into bins for each well and then processed individually.
Results and Discussion
The assay was initially tested on a commercial PCR-HRM instrument (Bio-Rad). To verify that unique melting temperatures are observed as a result of varying methylation densities in the 201-bp RASSF1A gene target, we performed melting curve analysis following PCR amplification. All four methylation densities presented distinct melting temperatures, which were 84.5 °C, 85.7 °C, 86.9 °C, and 88.6 °C for 0%, 31.25%, 68.75%, and 100% methylation densities, respectively ( Fig. 4 ). The result showed a linear relationship between DNA methylation density and the corresponding melting temperature.
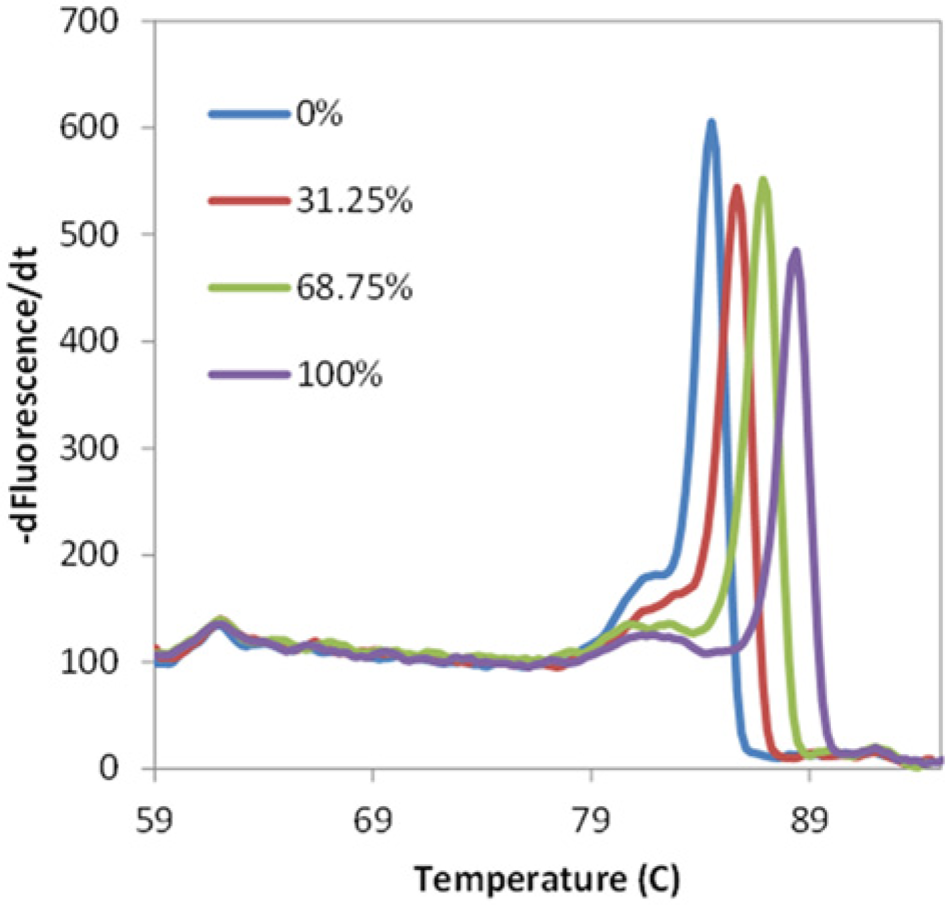
Derivative melting curves of four different methylation densities of RASSF1A sequences obtained from a real-time PCR instrument (Bio-Rad, Hercules, CA). The graph shows the profiles of 0%, 31.25%, 68.75%, and 100% methylation from left to the right, respectively.
To construct the miniaturized system, we used a confocal fluorescence detector unit ( Fig. 5A ) (ESElog; Qiagen, Hilden, Germany) designed for signal acquisition from the fluorescein channel (λem = 520 nm) with a sensitivity of 1 pM fluorescein. The detector was mounted on a programmable, motorized 3D translation stage (Xslide; Velmex, Bloomfield, NY) to facilitate parallel signal acquisition from each of the reaction chambers. Thermal control was achieved with an aluminum heating plate attached to a thermoelectric unit (Custom Thermoelectric, Bishopville, MD) with a PID controller unit (Accuthermo Technology, Fremont, CA) and a 2.25-kΩ feedback thermistor. The PID parameters used were P = 7.76%, I = 115 s, and D = 28 s. The feedback temperature of the heater unit was obtained from the thermistor embedded in an aluminum heating block, which has a thermal conductivity above 200 W/m·K. In order of proximity to the aluminum heating block, there was a ~0.1-mm glass coverslip (σ = 1.08 W/m·K) and a 2-µL aqueous sample droplet (σ ~ 0.58W/m·K for water) sealed with mineral oil (σ ~ 0.13 W/m·K) to prevent evaporation in air. Comparison of thermal conductivities suggests that the mineral oil acts as an insulator, and sample temperature is strongly dependent on the aluminum plate temperature. The microfluidic cartridge with 16 independent reaction chambers ( Fig. 5B ) was placed on the heating plate. The fluorescence signals were collected using FL Digital software package (Qiagen, Hilden, Germany) and the moving stage was programmed and controlled using Cosmos V.3.1.6 software (Velmex). A diagram of our platform workflow and photograph of the setup are shown in Figure 5C , D .
Instrument overview. (
For each temperature increment, fluorescence signal was obtained one chamber at a time by the detector. The motorized stage was used to automatically guide the detector through each chamber and acquire signal at 1-s intervals until a fluorescence signal could be detected. Once signal was obtained from all chambers, the heating instrument raised the temperature to the next increment and the process was repeated. The time chart for this workflow is shown in Figure 3 . To facilitate synchronization of the thermal, motor, and detector controls, a custom application was programmed in Java.
In addition to system synchronization, temperature control was another important area of interest in platform development. We previously reported that the bending of PDMS-glass may affect thermal contact between a droplet device and the heating surface. 20 In our setup, two layers of control were put in place to minimize batch-to-batch temperature variation in the data. First, we implemented a clamping unit built from acrylonitrile butadiene styrene (ABS) material, which was used to maintain uniform thermal contact between the array cartridge and heating plate throughout the ramping process. Second, as mentioned previously, we used temperature calibrators to normalize the data to account for variations in temperature between reaction chambers.
Using the instrument setup as described, melt curve experiments were performed by loading 2 µL PCR products into each well. To determine the adequate range of sample concentration for melt curve acquisition using the detector, various dilutions of 0% methylation density PCR product were prepared and measured on the platform. We found that 2-fold dilution gave adequate signal range for this setup and was used in subsequent experiments.
Figure 6A shows the raw fluorescence intensity profile as a function of temperature corresponding to four different methylation densities obtained from the miniaturized platform. The raw data were processed as described in the Materials and Methods and normalized within a range of 0 to 1. The negative derivative plots of the normalized melt curves are shown in Figure 6B . Each sample is characterized by three peaks associated with the low-Tm calibrator (left), the PCR product (middle), and the high-Tm calibrator (right). The derivative curves in Figure 6B clearly show misalignment in temperature calibrator peaks, indicating variations in temperature profiles across individual reaction chambers. After the calibrator peaks were used to perform two-point alignment as shown in Figure 6C , the melting peaks between different methylation density samples were visually distinct and consistent with the profile obtained from the conventional instrument ( Fig. 4 ). The melting temperatures obtained by the miniaturized platform also correlated linearly with the % methylation density, as shown in Figure 6D .
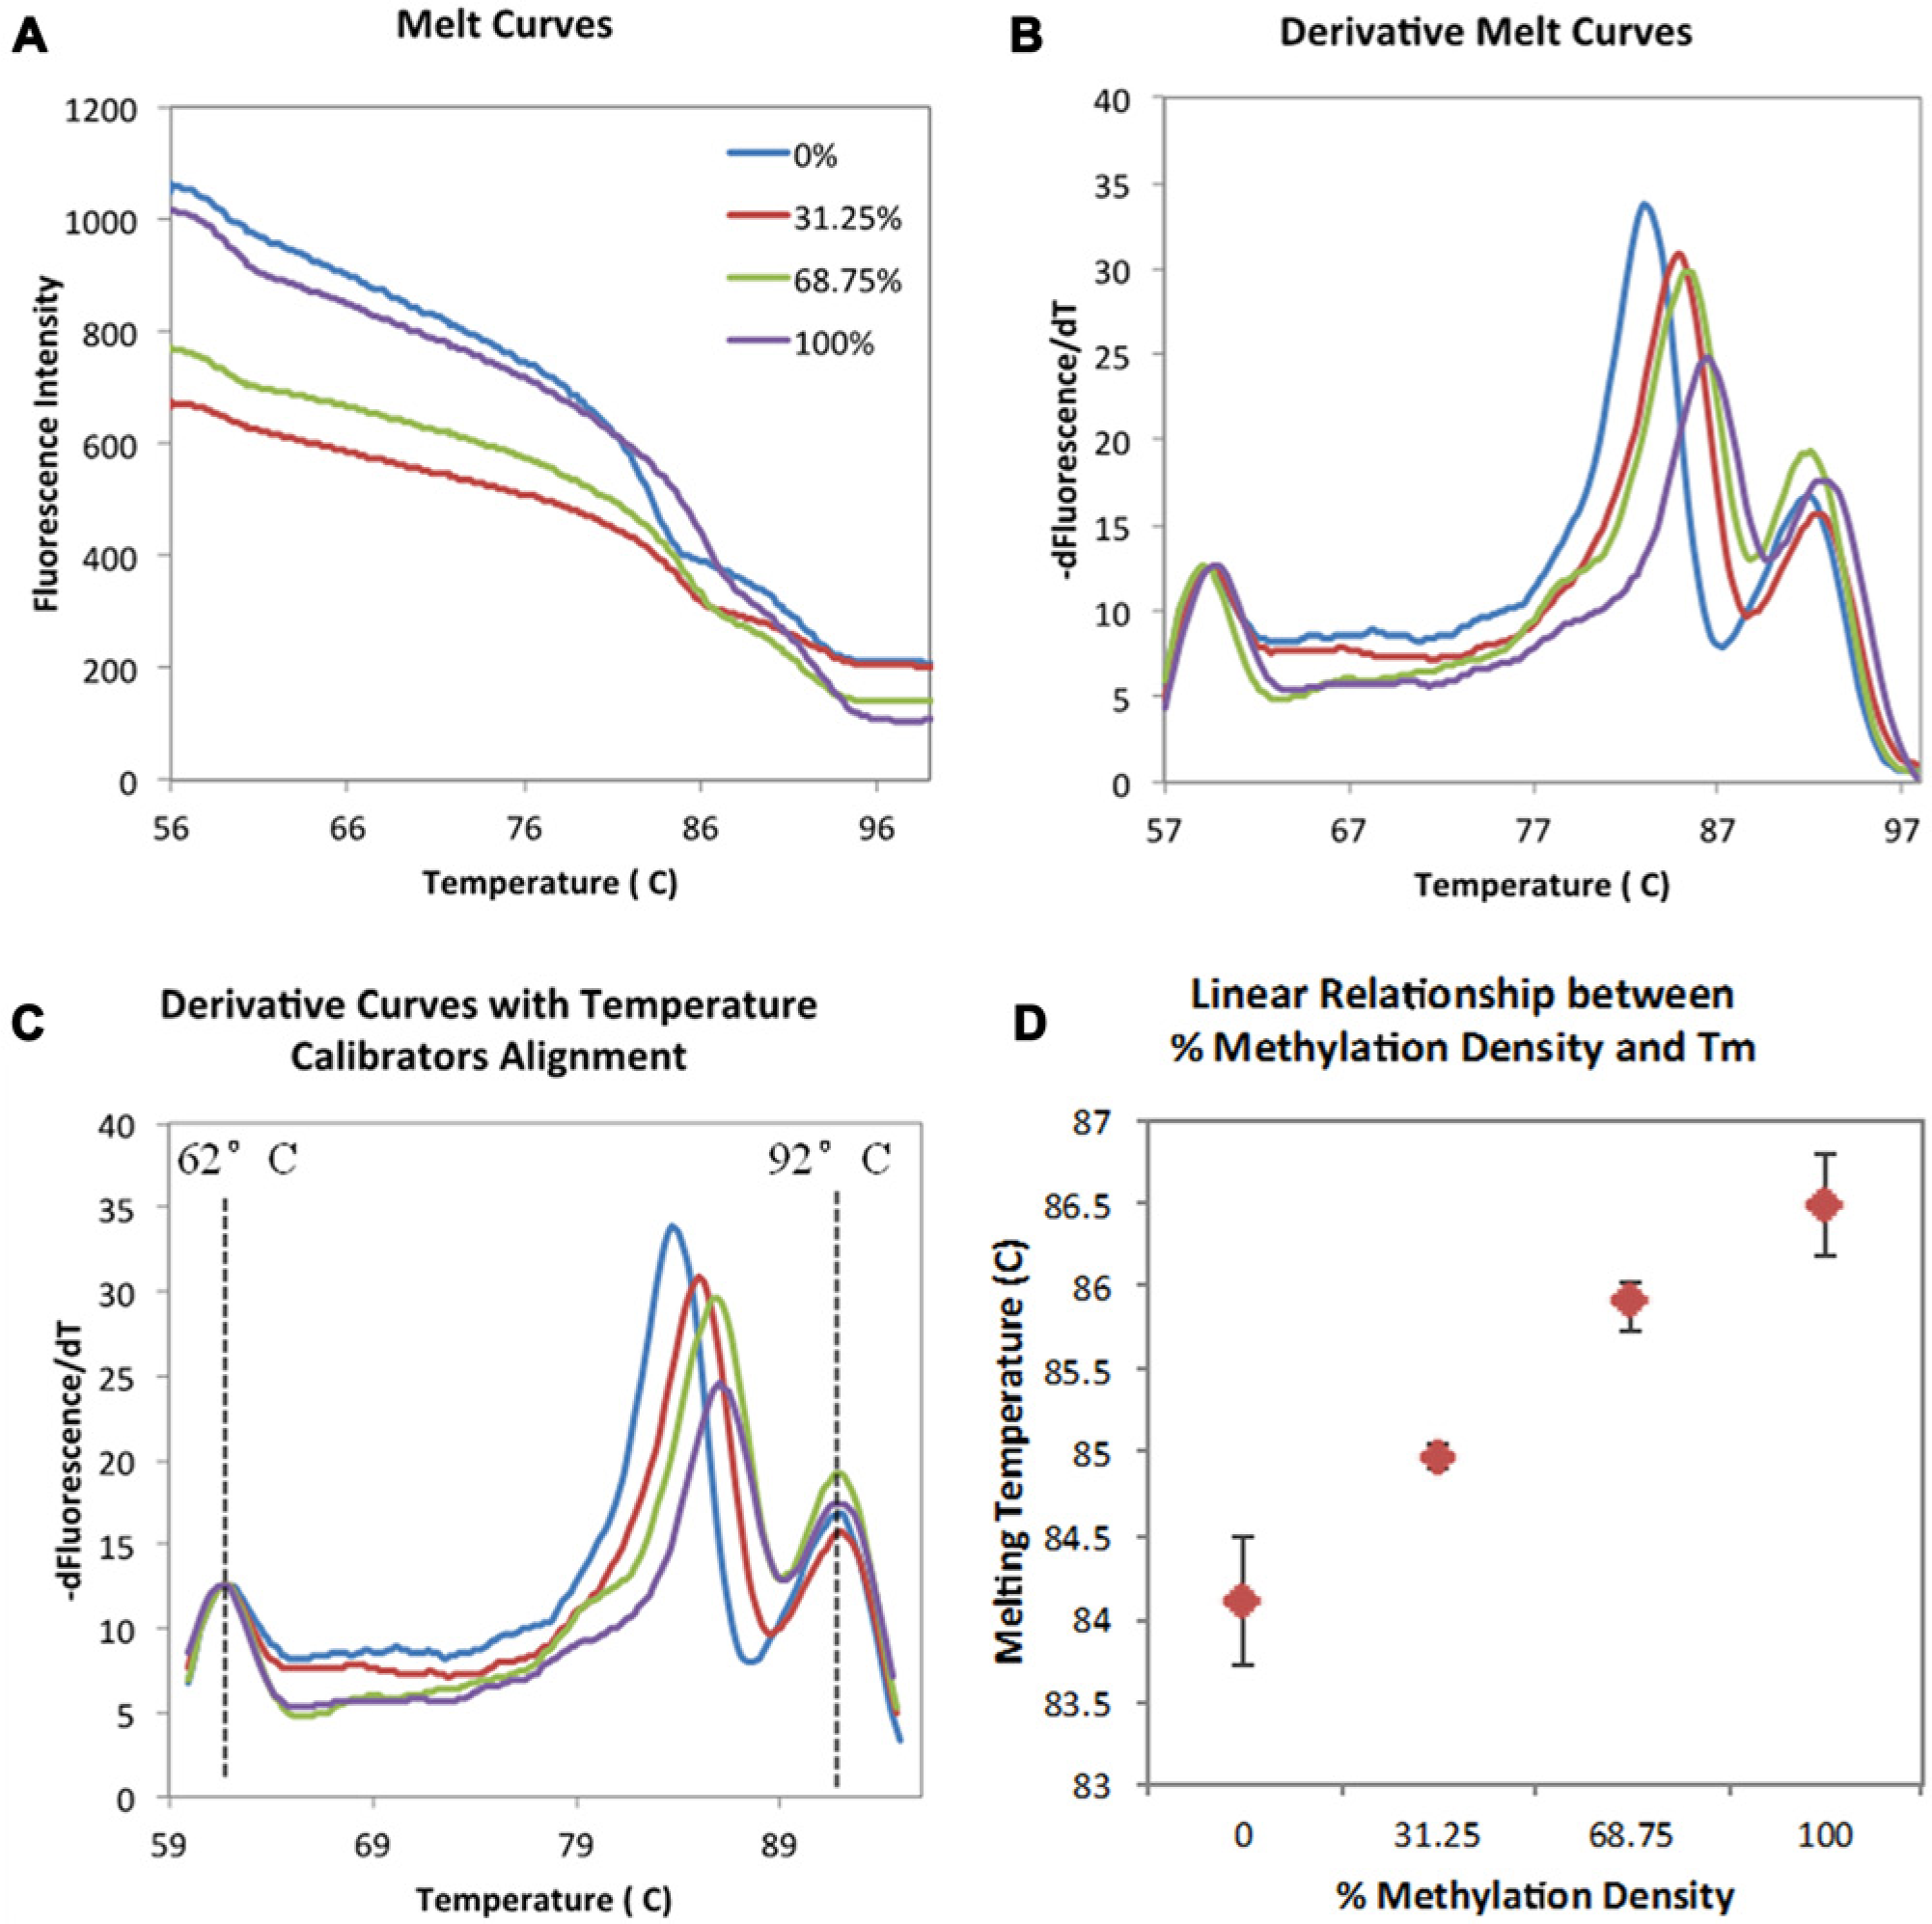
Experimental melting curves from four methylation densities of the RASSF1A gene on the miniaturized platform. The blue line represents 0% unmethylated sample. The 31.25%, 68.75%, and 100% fully methylated sequences are shown with red, green, and purple lines, respectively. (
The accuracy of results obtained from the miniaturized platform was assessed by comparing against the conventional PCR-HRM instrument. The peak melting temperature obtained for each methylation density using the miniaturized platform was plotted as a function of reference melting temperatures obtained by processing the same PCR products on the commercial PCR-HRM instrument ( Fig. 7 ). Our system gave comparable results, with an average standard deviation of 0.31 °C for each target. The genomic DNA targets in general showed higher variation in melting temperature compared with synthetic targets, which was also observed on the conventional instrument (data not shown). This may be associated with the quality of processed DNA targets after the bisulfite conversion process, which suggests that an efficient bisulfite conversion technique may be an important factor for accurate methylation density profiling with HRM. It should be noted that the melting temperatures from two platforms are likely to be different due to various factors, primarily differences in thermal control hardware and signal processing algorithm.
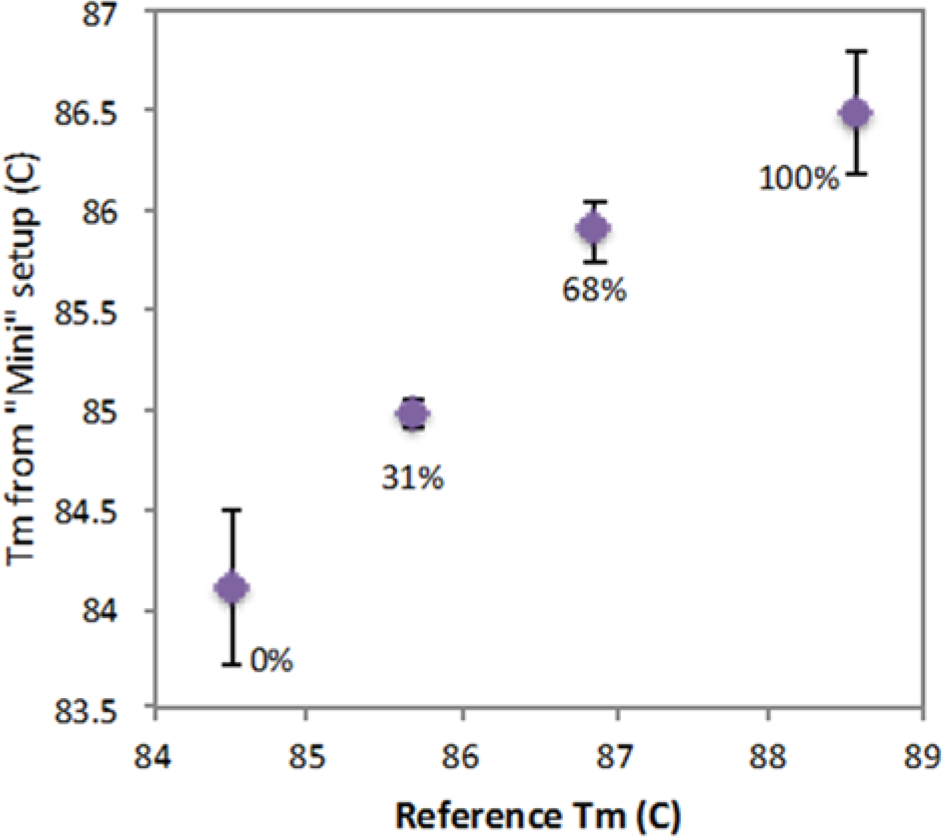
Interassay variation in melting temperature measurement. X-values represent the melting temperature of each methylation density on the commercial PCR-HRM instrument (Bio-Rad, Hercules, CA). Y-values show the measured melting temperatures from experiments on the miniaturized microfluidic system with error bars showing the lowest and highest values for each of the four different methylation densities of the RASSF1A sequence.
In conclusion, we have designed and demonstrated a miniaturized assay platform capable of DNA methylation density analysis on an array of samples in parallel. The combination of internal temperature calibrators and a normalization algorithm provided a robust control mechanism for processing signals from an array of reactions. Comparison of our results to a benchtop platform showed that the correlation between methylation density and melting temperature could be identified from both platforms. In future work, the current platform will be amended to include on-chip PCR21–25 toward the development of a fully functional PCR-HRM microfluidic platform. We envision that with further development, our platform may provide researchers and clinicians with a convenient approach for methylation density profiling.
Footnotes
Acknowledgements
We thank Thomas Pisanic for critical review of the manuscript.
Declaration of Conflicting Interests
The authors declared no potential conflicts of interest with respect to the research, authorship, and/or publication of this article.
Funding
The authors disclosed receipt of the following financial support for the research, authorship, and/or publication of this article: This study was supported by the National Institutes of Health (R01CA155305, U54CA151838, R21CA173390) and National Science Foundation (0967375, 1159771).